Serial Magnetic Resonance Imaging to Identify Early Stages of Anthracycline-Induced Cardiotoxicity
←
→
Page content transcription
If your browser does not render page correctly, please read the page content below
JOURNAL OF THE AMERICAN COLLEGE OF CARDIOLOGY                                                                                   VOL. 73, NO. 7, 2019

                              ª 2019 THE AUTHORS. PUBLISHED BY ELSEVIER ON BEHALF OF THE AMERICAN

                              COLLEGE OF CARDIOLOGY FOUNDATION. THIS IS AN OPEN ACCESS ARTICLE UNDER

                              THE CC BY-NC-ND LICENSE (http://creativecommons.org/licenses/by-nc-nd/4.0/).

                              Serial Magnetic Resonance Imaging
                              to Identify Early Stages of
                              Anthracycline-Induced Cardiotoxicity
                              Carlos Galán-Arriola, DVM,a,b Manuel Lobo, MD,a,c Jean Paul Vílchez-Tschischke, MD,a,c Gonzalo J. López, RT,a
                              Antonio de Molina-Iracheta, DVM,a Claudia Pérez-Martínez, DVM, PHD,d Jaume Agüero, MD, PHD,a,b,e
                              Rodrigo Fernández-Jiménez, MD, PHD,a,b,f Ana Martín-García, MD, PHD,b,g Eduardo Oliver, PHD,a
                              Rocío Villena-Gutierrez, MBS,a Gonzalo Pizarro, MD, PHD,a,b,c Pedro L. Sánchez, MD, PHD,b,g
                              Valentin Fuster, MD, PHD,a,f Javier Sánchez-González, PHD,h Borja Ibanez, MD, PHDa,b,i

                                 ABSTRACT

                                 BACKGROUND Anthracycline-induced cardiotoxicity is a major clinical problem, and early cardiotoxicity markers are
                                 needed.

                                 OBJECTIVES The purpose of this study was to identify early doxorubicin-induced cardiotoxicity by serial multipara-
                                 metric cardiac magnetic resonance (CMR) and its pathological correlates in a large animal model.

                                 METHODS Twenty pigs were included. Of these, 5 received 5 biweekly intracoronary doxorubicin doses (0.45 mg/kg/injection)
                                 and were followed until sacrifice at 16 weeks. Another 5 pigs received 3 biweekly doxorubicin doses and were followed to
                                 16 weeks. A third group was sacrificed after the third dose. All groups underwent weekly CMR examinations including anatomical
                                 and T2 and T1 mapping (including extracellular volume [ECV] quantification). A control group was sacrificed after the initial CMR.

                                 RESULTS The earliest doxorubicin-cardiotoxicity CMR parameter was T2 relaxation-time prolongation at week 6
                                 (2 weeks after the third dose). T1 mapping, ECV, and left ventricular (LV) motion were unaffected. At this early time point,
                                 isolated T2 prolongation correlated with intracardiomyocyte edema secondary to vacuolization without extracellular
                                 space expansion. Subsequent development of T1 mapping and ECV abnormalities coincided with LV motion defects: LV
                                 ejection fraction declined from week 10 (2 weeks after the fifth and final doxorubicin dose). Stopping doxorubicin therapy
                                 upon detection of T2 prolongation halted progression to LV motion deterioration and resolved intracardiomyocyte
                                 vacuolization, demonstrating that early T2 prolongation occurs at a reversible disease stage.

                                 CONCLUSIONS T2 mapping during treatment identifies intracardiomyocyte edema generation as the earliest
                                 marker of anthracycline-induced cardiotoxicity, in the absence of T1 mapping, ECV, or LV motion defects. The
                                 occurrence of these changes at a reversible disease stage shows the clinical potential of this CMR marker for
                                 tailored anthracycline therapy. (J Am Coll Cardiol 2019;73:779–91) © 2019 The Authors. Published by Elsevier on
                                 behalf of the American College of Cardiology Foundation. This is an open access article under the CC BY-NC-ND license
                                 (http://creativecommons.org/licenses/by-nc-nd/4.0/).

                              A          nthracyclines         are     highly
                                         frequently used chemotherapy drugs (1),
                                         with the most commonly used being doxoru-
                              bicin, alone or in combination with other anticancer
                                                                                   effective      and      anthracycline therapy is cardiotoxicity and subse-
                                                                                                           quent heart failure; depending on the accumulated
                                                                                                           dose, the incidence of severe anthracycline-induced
                                                                                                           cardiotoxicity resulting in overt systolic heart failure
                              agents.       A     prominent           undesired         effect      of     can be as high as 25% (2). The trade-off between
Listen to this manuscript’s
audio summary by
Editor-in-Chief
                              From the aCentro Nacional de Investigaciones Cardiovasculares (CNIC), Madrid, Spain; bCentro de Investigación Biomédica en Red
Dr. Valentin Fuster on
                              en Enfermedades Cardiovasculares (CIBERCV), Madrid, Spain; cComplejo Hospitalario Ruber Juan Bravo, Madrid, Spain; dFacultad
JACC.org.
                              de Veterinaria de León, León, Spain; eCardiology Department, Hospital Universtitari i Politecnic La Fe, Valencia, Spain; fZena and
                              Michael A. Wiener Cardiovascular Institute, Icahn School of Medicine at Mount Sinai, New York, New York; gCardiology
                              Department, Hospital Universitario de Salamanca-IBSAL, Salamanca, Spain; hPhilips Healthcare, Madrid, Spain; and the iCardi-
                              ology Department, IIS-Fundación Jiménez Díaz Hospital, Madrid, Spain. This study was partially supported by grants from the
                              Ministerio de Ciencia, Innovación y Universidades through the Carlos III Institute of Health-Fondo de Investigación Sanitaria
                              (PI16/02110), the European Regional Development Fund (SAF2013-49663-EXP), and the Spanish Society of Cardiology (FEC basic

                              ISSN 0735-1097                                                                                              https://doi.org/10.1016/j.jacc.2018.11.046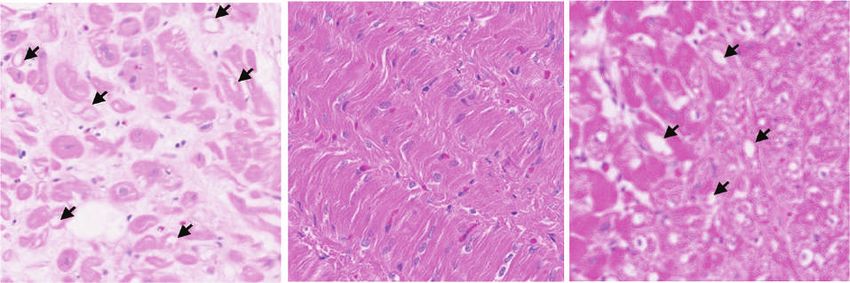
780          Galán-Arriola et al.                                                                                                                  JACC VOL. 73, NO. 7, 2019

             T2 Mapping CMR and Anthracycline Cardiotoxicity                                                                                      FEBRUARY 26, 2019:779–91

ABBREVIATIONS                           cancer and chronic heart failure places an                          Here, we used a large animal model (pig) of
AND ACRONYMS                            immense personal burden on patients, with                       doxorubicin-induced cardiotoxicity to identify the
                                        physical and psychological consequences.                        earliest CMR marker of myocardial damage and its
CMR = cardiac magnetic
resonance
                                           Anthracyclines bind to topoisomerase 2 b                     pathological correlates. We also studied the revers-
                                        in the cardiomyocyte’s DNA. Anthracyclines-                     ibility of cardiotoxicity upon detection of the early
ECV = extracellular volume
                                        topoisomerase 2 b complexes bind to pro-                        CMR marker.
LAD = left anterior descending
coronary artery                         moters       of    mitochondrial           antioxidative,
                                        biogenesis, and electron transport chain                        METHODS
LV = left ventricular
                                        genes leading to a downstream mitochon-
LVEF = left ventricular ejection
                                                                                                        STUDY DESIGN. The study was approved by the
fraction                                drial dysfunction. In fact, genetic ablation of
                                                                                                        Institutional Animal Research Committee and con-
MOLLI = T1 modified Look-                topoisomerase          2b     in    mice      ameliorates
                                                                                                        ducted in accordance with recommendations of the
Locker Inversion recovery               anthracycline-induced cardiotoxicity (3). In
sequence                                                                                                Guide for the Care and Use of Laboratory Animals.
                                        addition, anthracyclines bind to cardiolipin
                                                                                                        The study design is summarized in Figure 1. The study
                            in the inner mitochondrial membrane, contributing to
                                                                                                        population consisted of 20 castrated male large white
                            increased reactive oxygen species generation, iron
                                                                                                        pigs (25 to 35 kg). Pigs in group 1 received 5 biweekly
                            deposition, and defective mitochondrial biogenesis
                                                                                                        doxorubicin injections (final injection at week 8) and
                            (3,4). Altogether, these phenomena lead to mito-
                                                                                                        were followed-up until sacrifice at week 16 by intra-
                            chondrial swelling, intracardiomyocyte vacuoliza-
                                                                                                        venous injection of pentobarbital sodium in over-
                            tion, and ultimately, cell death and replacement of
                                                                                                        dose. In group 2, pigs underwent 3 biweekly
                            cardiomyocytes by fibrotic tissue (5–7).
                                                                                                        doxorubicin injections (final injection at week 4) and
                                                          SEE PAGE 792
                                                                                                        were similarly followed-up until sacrifice at week 16.
                                                                                                        Group 3 pigs underwent the same doxorubicin pro-
                                   Current algorithms to identify early stages of
                                                                                                        tocol as group 2 (3 biweekly injections) but were
                            anthracycline-induced cardiotoxicity are far from
                                                                                                        sacrificed earlier, at week 6 (2 weeks after the final
                            optimal. Diagnosis generally occurs once left ven-
                                                                                                        doxorubicin injection). Group 4 was a control group
                            tricular (LV) functional deterioration becomes mani-
                                                                                                        sacrificed after baseline CMR without doxorubicin
                            fest, either as a decline in left ventricular ejection
                                                                                                        exposure. In all groups, weekly comprehensive mul-
                            fraction (LVEF) or longitudinal LV strain abnormal-
                                                                                                        tiparametric CMR examinations were performed until
                            ities (8,9). By this stage, the damage to the myocar-
                                                                                                        sacrifice. In the treatment weeks, CMR scans were
                            dium is often irreversible. The lack of a validated
                                                                                                        performed           immediately           before       doxorubicin
                            early damage marker limits the development of pre-
                                                                                                        injections.
                            ventive strategies. Cardiac magnetic resonance (CMR)
                            is the gold standard technique for anatomical and                           DOXORUBICIN ADMINISTRATION PROCEDURE. We
                            functional evaluation of the heart, and the advent of                       used a modification of a previously described
                            multiparametric algorithms allows accurate charac-                          approach (22,23). Animals were anesthetized and
                            terization of myocardial tissue. CMR is thus suitable                       endotracheally intubated. The femoral artery was
                            for the detection of myocardial edema (10–12) and                           then accessed by the Seldinger technique, and a 7-F
                            diffuse myocardial fibrosis (13–15), which are present                       sheath was inserted. Pigs were anticoagulated with
                            at different stages of anthracycline-induced car-                           150 IU/kg of intravenous heparin, and a 5-F coronary
                            diotoxicity (16–21). To date, there has been a lack of                      diagnostic catheter was inserted via a femoral sheath
                            comprehensive serial multiparametric CMR tissue                             and placed at the origin of the left coronary artery.
                            studies characterizing the full anthracycline treat-                        Under angiography guidance, a 0.014-mm coronary
                            ment cycle from pre-treatment, through treatment, to                        guidewire was positioned distally in the left anterior
                            overt LV systolic dysfunction and heart failure.                            descending (LAD) coronary artery. The catheter was

                            science in cardiology grant). This research program is part of an institutional agreement between the CNIC and FIIS-Fundación
                            Jiménez Díaz. This study forms part of a Master Research Agreement between the CNIC and Philips Healthcare, and is part of a
                            bilateral research program between Hospital de Salamanca Cardiology Department and the CNIC. The CNIC is supported by the
                            Ministerio de Ciencia, Innovación y Universidades, and the Pro-CNIC Foundation, and is a Severo Ochoa Center of Excellence
                            (MEIC award SEV-2015-0505). Drs. Galán-Arriola and Villena-Gutierrez are P-FIS fellows (Instituto de Salud Carlos III). Dr. Fer-
                            nández-Jiménez has received funding through the European Union Horizon 2020 Research and Innovation program under grant
                            MSCA-IF-GF-707642. Dr. Sánchez-González is an employee of Philips Healthcare. All other authors have reported that they have
                            no relationships relevant to the contents of this paper to disclose.

                            Manuscript received August 13, 2018; revised manuscript received October 14, 2018, accepted November 8, 2018.
JACC VOL. 73, NO. 7, 2019                                                                                                                        Galán-Arriola et al.   781
FEBRUARY 26, 2019:779–91                                                                                        T2 Mapping CMR and Anthracycline Cardiotoxicity

   F I G U R E 1 Study Design

                                             Weekly Cardiac Magnetic Resonance

                           0           2          4        6           8        10        12        14          16
                                                                                                                        TIME
                          doxo        doxo       doxo     doxo        doxo                                             (weeks)

                                                                                                                     Sacrifice
         Group 1
                   doxo                                                                                               n=5
                          doxo        doxo       doxo

                                                                                                                     Sacrifice
         Group 2
                                                                                                                      n=5
                          doxo        doxo       doxo

                                                                 Sacrifice
         Group 3
                                                                  n=5

         Group 4                 Sacrifice
        (Control)                 n=5

   Large white castrated male pigs weighing 25 to 30 kg were used in this study. Animals were divided into 4 experimental groups of 5 animals
   each. Group 1 animals received 5 biweekly intracoronary (IC) doxorubicin (doxo) doses followed by 8 dose-free weeks, whereas Group 2 pigs
   received 3 biweekly IC doxo doses followed by 12 dose-free weeks. Group 3 pigs received 3 IC doxo dose followed by 2 dose-free weeks before
   sacrifice. Group 4 was a control group of untreated animals. Cardiac magnetic resonance scans were performed every week in each group,
   before doxo infusion. Infused and remote myocardial areas were collected at sacrifice for further analysis.

docked selectively in the LAD, and a 0.45 mg/kg dose                         excitations ¼ 3. The imaging parameters for the
of doxorubicin (Farmiblastina, Pfizer, New York, New                          T2-gradient-spin-echo mapping sequence mapping were
York) diluted in 30 ml saline was given as a slow bolus                      FOV 300  300 mm with an acquisition voxel size of
injection    over     3   min.       Electrocardiographic           and      1.8  2.0 mm2 and slice thickness 8 mm, and 8 echo
hemodynamic monitoring was maintained during                                 times ranging from 6.7 to 53.6 ms. To reduce T1 effects, a
doxorubicin administration. Once the infusion was                            2-heartbeat interval was used between excitations. The
completed, coronary angiography was performed to                             T1 mapping sequence (Modified Look-Locker Inversion
document normal coronary flow, the catheter mate-                             recovery [MOLLI]) was acquired before and 10 min after
rial was removed, and the animal was allowed to                              contrast administration. All MOLLI sequences were
recover.                                                                     based on a 5(3)3 scheme using a single shot steady-state
CMR PROTOCOL. All studies were performed with a                              free    precession       readout         sequence       (TR/TE/flip
Philips 3-T Achieva Tx whole body scanner (Philips                           angle ¼ 2.1 ms/1.05 ms/35 ) with an in-plane acquisition
Healthcare, Best, the Netherlands) equipped with                             resolution of 1.5  1.8 mm2 and an 8-mm slice thickness.
a 32-element phased-array cardiac coil. The CMR                              T2 and T1 mapping sequences were both triggered at
protocol     included       a     standard       segmented         cine      mid-diastole and acquired from a single short-axis
steady-state free-precession sequence to provide                             midapical slice.
high-quality anatomical references, a T 2 gradient-                            LGE imaging was performed 15 min after intrave-
spin-echo      mapping          sequence,        and    native      and      nous administration of 0.2 mmol/kg gadopentetate
post-contrast       T1    mapping          and   late   gadolinium           dimeglumine contrast agent using an 3-dimensional
enhancement (LGE) sequences.                                                 inversion-recovery          spoiled        turbo     field         echo
  The imaging parameters for the standard segmented                          sequence (TR/TE/flip angle ¼ 2.4 ms/1.13 ms/10 ) with
cine steady-state free-precession sequence were as                           an isotropic resolution of 1.5  1.5  1.5 mm 3 on a FOV
follows: field of view (FOV) of 280  280 mm, slice                           of 340  340  320 mm 3 in the FH, LR, and AP
thickness 6 mm with no gaps, repetition time (TR)                            directions. Data were acquired in mid-diastole with a
2.8 ms, echo time (TE) 1.4 ms, flip angle 45 , cardiac                       151.2-ms acquisition window. Acquisition was accel-
phases ¼ 30, voxel size 1.8  1.8 mm, and number of                          erated using a net SENSE factor of 2.25 (1.5  1.5 in the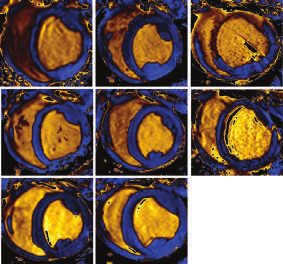
782   Galán-Arriola et al.                                                                                                    JACC VOL. 73, NO. 7, 2019

      T2 Mapping CMR and Anthracycline Cardiotoxicity                                                                         FEBRUARY 26, 2019:779–91

                    AP and LR directions) with a bandwidth of 853 Hz per                 STATISTICAL ANALYSIS. Sample size selection. Objective
                    pixel. Inversion time was adjusted before acquisition                1 was hypothesis generating, and for this reason, we
                    using a look-locker scout sequence with different                    used an arbitrary same sample size of 5 animals
                    inversion     times     to    ensure    proper     nulling     of    (similar    to    previous   hypothesis-generating        pig
                    the healthy myocardium signal. For the analysis,                     studies [25]). For objective 2, we based the sample
                    3-dimensional volume was reconstructed in short-                     size selection on results (T 2 relaxation times) from
                    axis, 2-chamber, and 4-chamber views with a slice                    objective    1, and on       the    capacity to     detect a
                    thickness of 6 mm.                                                   meaningful 5-ms difference in T2 relaxation time
                    C M R a n a l y s i s . CMR studies were analyzed by 2               between     examination      time    points.   Taking    into
                    experienced and independent observers using dedi-                    consideration an anticipated SD of 3 ms, and
                    cated software (MR extended Work Space 2.6, Philips                  multiple pairwise comparisons between time points,
                    Healthcare; and Qmass MR 7.6, Medis, Leiden, the                     a sample size of 5 individuals/group resulted in a
                    Netherlands). T2 maps were automatically generated                   statistical power of 80% to detect differences.
                    on the acquisition scanner by fitting the signal in-                    Variables are expressed as mean  SD or median
                    tensity of all echo times to a monoexponential decay                 (interquartile range [Q1, Q3]) as appropriate. Data
                    curve at each pixel with a maximum likelihood                        normality was assessed with the Shapiro-Wilk test.
                    expectation maximization algorithm. T 1 maps were                      The Student’s t-test was used for 2-group com-
                    generated using a maximum-likelihood expectation-                    parisons, and the changes of imaging variables
                    maximization algorithm and fitting the MR signal to a                 across time was assessed using 1-way repeated
                    T 1 inversion recovery with 3 independent model                      measures analysis of the variance test. To identify
                    parameters. T 2 and T 1 relaxation maps were quanti-                 the   timepoints     showing       statistically   significant
                    tatively analyzed by placing a wide transmural region                changes compared with the baseline values, pairwise
                    of interest at the infused myocardial area (irrigated by             paired Student’s t-tests were performed taking into
                    the LAD) of the corresponding slice in all studies.                  account p value adjustment for multiple compari-
                    Delayed gadolinium-enhanced regions were defined                      sons (Bonferroni method). Differences were consid-
                    as >50% of maximum myocardial signal intensity                       ered statistically significant at p < 0.05. All data
                    (full width at half maximum) and qualitatively                       were analyzed with RStudio (RStudio Team [2015],
                    analyzed. Extracellular volume (ECV) was estimated                   Integrated Development for RStudio, Inc., Boston,
                    with native T 1 -MOLLI values and 10-min post-                       Massachusetts), and graphics were created with
                    contrast T 1 -MOLLI values corrected by hematocrit,                  ggplot2.
                    as described elsewhere (13).
                                                                                         RESULTS
                    E x - v i v o a n a l y s i s . After heart extraction, samples of
                    the doxorubicin-infused region (anteroseptal wall)
                                                                                         None of the pigs showed adverse events during
                    and the remote area were collected for histology and
                                                                                         doxorubicin administration at any time point (i.e., no
                    water content quantification. For histological studies,
                                                                                         changes were noted in electrocardiogram or systolic
                    samples were fixed in 4% formalin and then trans-
                                                                                         arterial pressure during injections). None of the pigs
                    ferred to 70% ethanol. After paraffin embedding,
                                                                                         died during the study.
                    4-m m sections were cut and stained with hematoxylin
                    and eosin, Masson trichrome, and Sirius Red. Stained                 SERIAL      CMR     TISSUE    CHARACTERIZATION            OF
                    sections were scanned, and 20  20 magnification                      DOXORUBICIN-INDUCED CARDIOTOXICITY. A total
                    images were taken for collagen quantification using a                 of 5 pigs received 5 biweekly doxorubicin injections
                    modified macro (24).                                                  (weeks 0, 2, 4, 6, and 8). Multiparametric CMR was
                        For water content quantification, harvested tissue                performed weekly until week 16, when animals were
                    samples were immediately blotted to remove surface                   sacrificed and hearts were harvested for pathology
                    moisture and then introduced into laboratory crystal                 evaluation.
                    containers previously weighed on a high-precision                    L V e j e c t i o n f r a c t i o n . Weekly CMR examinations
                    scale. The tissue-loaded containers were weighed                     revealed no changes in LVEF until week 9 (1 week
                    before and after drying for 48 h at 100 C in a desic-               after the fifth and final doxorubicin injection). From
                    cating oven. Tissue water content (% dry weight) was                 week 9 onwards, LVEF declined progressively, the
                    calculated     using    the    following     formula:      water     decline becoming significant at week 12 (55  4% at
                    content ¼ ([wet weight  dry weight]/dry weight)                    baseline vs. 33  6% at week 12; p < 0.01). The
                    100. An empty container was weighed before and                       lowest LVEF value was recorded at the 16-week time
                    after desiccation as an additional calibration control.              point (30  8%; p ¼ 0.01 vs. baseline). Group and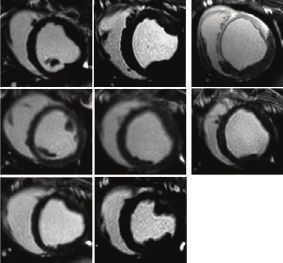
JACC VOL. 73, NO. 7, 2019                                                                                                                                Galán-Arriola et al.   783
FEBRUARY 26, 2019:779–91                                                                                                    T2 Mapping CMR and Anthracycline Cardiotoxicity

   F I G U R E 2 Animal Model of Anthracycline Cardiotoxicity (Group 1)

                         A
                             100

                              75

                              50

                              25

                                                   Doxorubicin injections

                               0

                                       0       1    2    3     4        5   6    7        8    9   10   11   12   13   14    15       16
                                                                                Time (Weeks)

                                                                   LVEF (%)              T2 (ms)        ECV (%)

                         B
                                                   LVEF (%)                          T2 (ms)                      ECV (%)
                               100
                                                                                                   **
                                                                                              **
                                75
                                                                                     **                                           *
                                50
                                                          **       *

                                25

                                   0

                                           0        6     12       16       0        6        12   16        0    6     12        16
                                                                                 Time (Weeks)

   (A) Time course of cardiac magnetic resonance (CMR) imaging studies. Data are represented as mean  SD (bars). (B) Individual animal data at
   selected time points for left ventricular ejection fraction (LVEF), T2, and extracellular volume (ECV). Asterisks indicate statistically significant
   differences compared with week 0: *p < 0.05, **p < 0.01.

individual      LVEF       trajectories            are    presented         in       week 6, T 2 relaxation times were significantly longer
Figures 2A and 2B. LVEF data are presented in Online                                 than at baseline (45.2  0.5 ms and 52.0  1.4 ms at
Table 1. In agreement with the LVEF data, no                                         baseline and week 6, respectively; p ¼ 0.007). T 2
regional contractile abnormalities were documented                                   relaxation times subsequently increased, reaching a
until   week       12,    when         the         doxorubicin-infused               maximum at end follow-up (73.0  4.6 ms and 72.8
myocardium showed regional wall motion defects                                       4.6 ms on weeks 12 and 16; p ¼ 0.003 and p ¼ 0.001 vs.
(data not shown).                                                                    baseline, respectively). Group and individual T 2
T 2 r e l a x a t i o n t i m e s . Weekly CMR examinations                          trajectories are presented in Figures 2A and 2B.
revealed no changes in T 2 relaxation times on CMR                                   T 2 relaxation times at all time points are presented in
examinations performed at weeks 0 through 5. At                                      Online Table 1.
784 Galán-Arriola et al. JACC VOL. 73, NO. 7, 2019
T2 Mapping CMR and Anthracycline Cardiotoxicity FEBRUARY 26, 2019:779–91
F I G U R E 3 Time Course CMR Comparison Between Groups 1 and 2
A B C
100 100 100
75 75 75
LVEF (%)
ECV (%)
T2 (ms)
50 50 50
25 25 25
Doxorubicin injections Doxorubicin injections Doxorubicin injections
0 0 0
0 1 2 3 4 5 6 7 8 9 10 11 12 13 14 15 16 0 1 2 3 4 5 6 7 8 9 10 11 12 13 14 15 16 0 1 2 3 4 5 6 7 8 9 10 11 12 13 14 15 16
Time (Weeks) Time (Weeks) Time (Weeks)
Group 1 Group 2 Group 3
D E F
Baseline 6 weeks 16 weeks Baseline 6 weeks 16 weeks
Baseline 6 weeks 16 weeks
Group 1
Group 1
Group 1
Group 2
Group 2
Group 2
Group 3
Group 3
Group 3
(A) LVEF (%). (B) T2-gradient-spin-echo (T2-GraSE) mapping sequence in the infused area (in ms). (C) ECV in the infused area (%). (D) Representative images of late
gadolinium enhancement sequences for selected time points and groups. (E) Representative images of T2-GraSE mapping for selected time points and groups,
represented with a masked range (20 to 120 ms). (F) Representative images of native T1-MOLLI mapping for selected time points and groups, represented with a
masked range (550 to 1,750 ms). Abbreviations as in Figure 2.
T 1 r e l a x a t i o n t i m e s . Native T 1 relaxation times progressively, but with no statistically significant
showed no change from baseline until week 10 difference from baseline until week 14 (26.03 5.81%
(2 weeks after the fifth and final doxorubicin dose). A and 41 1.34% at baseline and week 14, respectively;
nonsignificant increase was noted at week 10, fol- p ¼ 0.006). Group and individual ECV trajectories are
lowed by a progressive increase to end follow-up at presented in Figures 2A and 2C. Complete ECV data
week 16. Native T 1 values were significantly longer are presented in Online Table 1. Post-contrast T 1
than at baseline only from week 12 onwards (1,087 relaxation times are presented in Online Figures 1B
101 ms and 1,220 59 ms at baseline and week 12 and 1C.
respectively; p ¼ 0.02). Group and individual native L a t e g a d o l i n i u m e n h a n c e m e n t . Positive LGE areas
T 1 trajectories are presented in Online Figures 1A and first appeared in the doxorubicin-infused area from
1C. Complete T 1 relaxation time data are presented in week 10 onwards. The enhanced areas formed a pat-
Online Table 1. chy pattern at week 12, becoming more evident at
E x t r a c e l l u l a r v o l u m e . ECV expansion was tracked 16 weeks follow-up (Figure 3D).
using a validated formula that includes pre- and post- T 2 -DRIVEN STRATEGY FOR THE PREVENTION OF
contrast T 1 values and hematocrit (13). In parallel with ANTHRACYCLINE-INDUCED CARDIOTOXICITY. Hav-
the native T 1 trajectory, ECV did not differ from ing documented T2 mapping abnormalities preceding
baseline until week 10 (2 weeks after the fifth and systolic function deterioration, we next explored
final doxorubicin dose). ECV subsequently expanded whether T 2 relaxation time prolongation occurred at aJACC VOL. 73, NO. 7, 2019 Galán-Arriola et al. 785
FEBRUARY 26, 2019:779–91 T2 Mapping CMR and Anthracycline Cardiotoxicity
reversible stage of anthracycline-induced cardiotox- At the end of follow-up in group 1 (5 biweekly
icity. To address this question, we studied a group of doxorubicin doses followed by sacrifice at week 16),
5 pigs (group 2) in which doxorubicin treatment was myocardial water content was also significantly
stopped upon detection of T 2 prolongation. As in increased (500 39% of dry weight; p < 0.001 vs.
group 1, T 2 relaxation times in group 2 pigs were control). At this time point, ECV CMR data revealed
nonsignificantly prolonged at week 5 and this pro- an overt increase in extracellular space (Figures 3C
longation became significant at week 6 (i.e., imme- and 3F, blue line), a finding compatible with extra-
diately before the scheduled fourth doxorubicin cellular edema formation. This is consistent with the
dose). Group 2 pigs therefore received only 3 doxo- positive LGE at this disease stage (Figure 3D). Inter-
rubicin doses (weeks 0, 2, and 4) and were followed- estingly, myocardial end follow-up water content in
up until week 16. T2 relaxation times in group 2 pigs group 2 (3 biweekly doxorubicin doses and follow-up
were significantly prolonged at week 6 (45.6 0.6 ms to week 16) did not differ from control subjects (365
and 51.6 0.8 ms at baseline and week 6, respec- 0.5%; p ¼ 0.13 vs. control). Myocardial water content
tively; p ¼ 0.004) but returned to baseline levels at in all groups is shown in Figure 4C.
week 8 (45.5 1.3 ms; p ¼ 1.00 vs. baseline), and S t r u c t u r a l m y o c a r d i a l c h a n g e s . Hematoxylin and
these levels were maintained until the end of follow- eosin staining of group 3 samples (harvested at week
up (44.8 1.4 ms at week 16; p ¼ 1.00 vs. baseline) 6, after 3 doxorubicin doses) revealed cardiomyocyte
(Figure 3B and 3E, red lines). LVEF in group 2 showed vacuolization (Figure 4E, left panel) with no other
no deterioration during follow-up (Figure 3A), and overt alteration to myocardial tissue structure; car-
regional LV wall motion was similarly unaffected. All diomyocytes maintained their shape, and there was
other evaluated parameters in group 2 remained no increase in extracellular space. Interestingly, at
within normal ranges throughout follow-up (Figure 3, 16-week follow-up of animals receiving 3 doxorubicin
red lines, and Online Table 1). doses (group 2), samples showed no intra-
cardiomyocyte vacuolization (Figure 4E, right panel).
PATHOLOGICAL CORRELATES OF EARLY T2
Conversely, myocardial samples from group-1 pigs (5
MAPPING CHANGES. The underlying tissue compo-
doxorubicin doses and 16-week follow-up) showed
sition changes leading to early T2 relaxation-time
even larger intracardiomyocyte vacuolae and a dis-
prolongation in the presence of normal T1 and ECV
arrayed myocardial structure, with increased extra-
readings was investigated in another group of 5 pigs
cellular space and replacement fibrosis, suggestive of
(Group 3). Group 3 animals received 3 doxorubicin
end-stage disease (Figures 4A and 4E, middle panel).
doses at weeks 0, 2, and 4, and were sacrificed
Complete histopathology data (fibrosis, myocardial
immediately after detection of T 2 prolongation (at
water content, and vacuolae presence) and CMR data
week 6). Like the other groups, these animals un-
(ECV and T 2 relaxation times) are shown for all groups
derwent a weekly CMR examination. Tissue samples
and sacrifice time points in Figure 4.
from group 3 animals were compared with samples
from groups 1 and 2 animals, which were sacrificed at DISCUSSION
the end of the 16-week protocol.
Myocardial water c o n t e n t . As expected, T2 In a pig model of anthracycline-induced cardiotox-
relaxation-time prolongation was associated with an icity with serial multiparametric CMR evaluations,
increase in myocardial water content (10). At week 6, we demonstrate that T2 mapping abnormalities pro-
after 3 doxorubicin doses, T2 relaxation times were vide the earliest marker of subtle myocardial dam-
significantly prolonged in group 3 animals (45.8 age, with T2 relaxation times prolonged long before
2.52 ms and 52.6 2.2 ms at baseline and week 6, LV motion abnormalities were detected (Central
respectively; p ¼ 0.01) (Figures 3B and 3E, gray lines). Illustration). At this early stage of cardiotoxicity, T1
Myocardial water content was significantly elevated relaxation times and ECV quantification were unal-
in samples harvested at this time point (396 12% of tered. Pathology evaluation upon T 2 prolongation
dry weight and 375 0.7% in group 3 and control, demonstrated an absolute increase in myocardial
respectively; p ¼ 0.014) (Figure 4C). ECV CMR data for water content, correlating with vacuolae formation
group 3 revealed no expansion of the extracellular in preserved cardiomyocytes but with no concomi-
space at week 6 (Figures 3C and 3F, gray line), indi- tant fibrosis or increased extracellular space. These
cating that the increased myocardial water content findings demonstrate that T 2 relaxation-time pro-
and T 2 prolongation likely corresponds to intracel- longation in the presence of normal T1 mapping and
lular edema. ECV identifies intracardiomyocyte edema as the786 Galán-Arriola et al. JACC VOL. 73, NO. 7, 2019
T2 Mapping CMR and Anthracycline Cardiotoxicity FEBRUARY 26, 2019:779–91
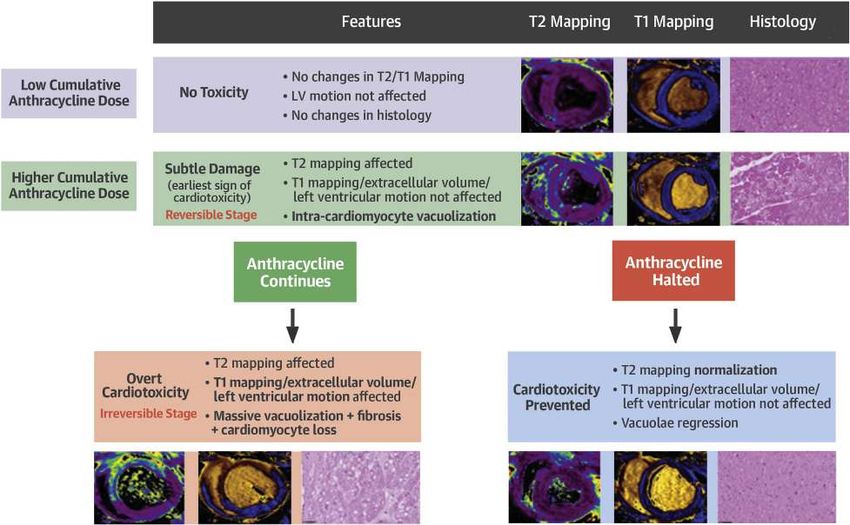
F I G U R E 4 End Follow-Up Ex Vivo and Imaging Studies of the Infused Area in Each Group
A B
Control Group 1 Group 2 Group 3 Control Group 1 Group 2 Group 3
60 100
*** 75
Fibrosis (%)
40 ***
ECV (%)
50
ns ns ns ns
20
25
0 0
Sirius Red
T1-MOLLI
C Control Group 1 Group 2 Group 3
D Control Group 1 Group 2 Group 3
600 100
** ***
Water Content (%)
75
500
**
T2 (ms)
ns
50
*
ns
400
25
300 0
T2-GraSE
H-E
E
Continued on the next pageJACC VOL. 73, NO. 7, 2019 Galán-Arriola et al. 787 FEBRUARY 26, 2019:779–91 T2 Mapping CMR and Anthracycline Cardiotoxicity earliest anthracycline-induced cardiotoxic event. intracardiomyocyte vacuolization thus has important Our results further demonstrate that stopping clinical implications. Serial T 2 mapping might allow doxorubicin administration upon detection of T 2 tailored anthracycline dose management, with pa- relaxation-time prolongation prevents progression tients showing no T 2 mapping abnormalities perhaps to myocardial dysfunction, with subsequent T 2 able to receive further doses, even beyond currently normalization as a surrogate of cardiomyocyte accepted high cardiotoxicity limits, without vacuolae resolution. These findings indicate that this increasing the risk of future LV dysfunction. This marker of intracardiomyocyte edema appears at a could be especially helpful for patients requiring high reversible disease stage and, thus, has important anthracycline doses to halt cancer progression. There clinical implications. is also the potential to monitor and possibly modify Previous CMR evaluations of anthracycline- anthracycline therapy in vulnerable populations, induced cardiotoxicity have been performed in mice such as patients with pre-existing myocardial disease; (26), rats (27,28), and rabbits (29,30); however, ours is pediatric or geriatric patients; smokers; obese or the first study to use the pig model with serial CMR sedentary patients; patients consuming alcohol; evaluations. We chose the pig because of its or patients with hypertension, diabetes, or hyper- anatomical and physiological similarity to humans cholesterolemia (8). The chemotherapy dose- (including heart rate and metabolism) and because management potential of serial T2 mapping is the CMR protocols are the same as those used clini- supported by the finding that cessation of doxoru- cally. Our study is the most comprehensive to date, bicin therapy upon detection of T2 mapping abnor- because it includes weekly multiparametric CMR malities prevented progression to LV motion evaluations over 4 months to cover all cardiotoxicity deterioration or fibrosis development and led to stages, from baseline to end-stage disease with overt regression of cardiomyocyte vacuolae formation. LVEF deterioration. Following a modification of a Another potential application of serial T 2 mapping published protocol in pigs (22,23), doxorubicin was is decision making about heart failure therapy initia- injected directly into the coronary arteries rather than tion (e.g., with beta-blockers and/or ACE inhibitors). intravenously. This approach achieves high local This is highly significant, because a major predictor of doxorubicin concentrations in the heart without therapeutic myocardial recovery is the time elapsed exposing animals to undesired systemic adverse ef- between anthracycline therapy and cardiotoxicity fects like myelosuppression, which would render the diagnosis (32). Cardinale et al. (32) found that only animals vulnerable to infection and thus potentially 42% of patients with anthracycline-induced car- affect survival and even cardiac readouts. This diotoxicity fully recovered LV function in response to approach is validated by the absence of casualties in heart failure therapy; in that study, the percentage of our study. responders decreased progressively as the time from Current clinical approaches for the early detection the end of anthracycline therapy to the start of heart of cardiotoxicity are based on deterioration of LV failure treatment increased. Therefore, early detec- motion, detected as LVEF or global longitudinal strain tion and prompt treatment of cardiotoxicity is crucial (8,9); however, these changes reflect profound dam- to ensuring substantial recovery of cardiac function. age to myocardial function and thus only become With current approaches (based on LVEF and global manifest at an advanced stage of the disease. Almost longitudinal strain), the mean interval from the end 90% of patients developing anthracycline-mediated of anthracycline therapy to the detection of car- LVEF deterioration never fully recover pre- diotoxicity is 3.5 months (31). The ability to identify treatment LVEF even with heart failure therapies patients at a much earlier stage would allow earlier (31). The identification of T2 relaxation-time initiation of heart failure therapy and would thus prolongation as a very early marker of reversible prevent many cases of overt LV dysfunction. F I G U R E 4 Continued Asterisks indicate statistically significant statistical differences compared with week 0 for each time point: *p < 0.05, **p < 0.01, ***p < 0.001, or nonsignificant (NS). (A) Fibrosis (%) in the infused area for each group at sacrifice. Representative images show Sirius Red staining. (B) ECV (%) in the infused area for each group at sacrifice. Representative images show CMR native T1-MOLLI with a 550 to 1,750 ms masked range. Red arrows mark areas with significantly increased signal. (C) Water content (normalized to dry weight) in the infused area for each group at sacrifice. Representative hematoxylin and eosin images are shown. Black arrows mark intracardiomyocyte vacuolization. (D) T2-GraSE mapping (ms) in the infused area for each group at sacrifice. Representative images show CMR T2-GraSE mapping with a 20 to 120 ms mask range. Red arrows mark areas with significantly increased signal. Abbreviations as in Figures 2 and 3.
788          Galán-Arriola et al.                                                                                                                  JACC VOL. 73, NO. 7, 2019

             T2 Mapping CMR and Anthracycline Cardiotoxicity                                                                                       FEBRUARY 26, 2019:779–91

      C E NT R AL IL L U STR AT IO N Serial CMR Evaluations During On-(Anthracycline) Treatment Allows Very Early
      Detection of Subtle Myocardial Damage

      Galán-Arriola, C. et al. J Am Coll Cardiol. 2019;73(7):779–91.

      Isolated T2 relaxation times prolongation (with normal T1, extracellular volume [ECV], and left ventricular [LV] motion) is able to identify intracardiomyocyte
      vacuolization, the earliest cardiotoxic event. Stopping anthracycline therapy at this early time point results in no progression to LV motion abnormalities and
      normalization of T2 values (corresponding to vacuolae regression). These phenomena support that T2 mapping identifies anthracycline-induced cardiotoxicity at a
      reversible stage of the disease. If anthracycline therapy is not halted, T1 mapping and ECV become pathological at a stage where LV motion is already deteriorated.
      Serial multiparametric cardiac magnetic resonance (CMR) might serve to implement a personalized treatment approach for patients undergoing anthracycline
      therapy to prevent cardiotoxicity.

                               T 2 mapping is an accurate technique for the                             mapping or T1 -based ECV changes is highly sugges-
                           detection and quantification of myocardial edema                              tive of intracellular edema formation. Intracellular
                           (10). We have previously used T2 mapping to char-                            vacuolization is an early change in the anthracycline-
                           acterize the edematous reaction of porcine (11,25,33)                        injured myocardium, identified as a pre-apoptotic
                           and human (12) myocardium to ischemia/reperfu-                               phenomena in animal models and human biopsies
                           sion. T 2 relaxation time prolongation correlates with                       (5–7,34). Our analysis records not only in vivo
                           increased myocardial water content (10), but by itself                       changes in T 2 mapping, but also the very early pres-
                           does not differentiate between intracellular and                             ence of intracardiomyocyte vacuolization, before the
                           extracellular edema. Our multiparametric approach,                           appearance of LV functional abnormalities. At the
                           combining T 2 mapping with T1 mapping and ECV                                end of follow-up in animals undergoing the full
                           fraction quantification, here allowed us to define the                         doxorubicin protocol (5 biweekly injections and
                           spatial location of increased myocardial water.                              follow-up to 16 weeks), T2 relaxation times were even
                           T 2 mapping prolongation in the absence of T 1                               longer than at early stages and were accompanied by
JACC VOL. 73, NO. 7, 2019 Galán-Arriola et al. 789 FEBRUARY 26, 2019:779–91 T2 Mapping CMR and Anthracycline Cardiotoxicity significant T 1 relaxation-time prolongation, a signifi- recently, Schulz-Menger’s group (41) reported the cantly elevated T1 -based ECV fraction, and patchy findings of serial multiparametric CMR examinations LGE. The pathological correlate at this end-stage of in a cohort of 30 sarcoma patients on high anthracy- the disease was the presence of larger and more cline regimes. Patients underwent comprehensive numerous intracardiomyocyte vacuoles accompanied T 2/T 1 mapping and ECV assessment before treatment, by intense extracellular matrix remodeling and 48 h after the first dose, and after finishing the diffuse fibrosis. anticancer therapy; 30% of patients developed car- Our results are in line with those reported by Far- diotoxicity. In contrast with our results, T 2 mapping had et al. (26). Using a mouse model of anthracycline- showed no differences between patients developing induced cardiotoxicity, these authors found that cardiotoxicity and those who did not, although both 5 weekly doxorubicin injections induced early pro- groups showed a nonsignificant trend toward longation of T 2 relaxation times accompanied by increased T2 relaxation times over time. ECV did not intracellular vacuolization (26). This study and ours change over time. Interestingly, patients who subse- confirm the feasibility of in vivo noninvasive identi- quently developed cardiotoxicity had significantly fication of vacuolae formation inside cardiomyocytes shortened T1 relaxation times 48 h after the first dose. as a direct toxic effect of anthracyclines in 2 different In our study, we observed no drop in T1 relaxation species. However, Farhad et al. (26) found that T 2 time after doxorubicin dosing; however, this might mapping abnormalities were associated with concur- reflect the performance of CMR examinations 1 week rent T1 relaxation-time prolongation and expanded after dosing in our protocol and not after 48 h as in extracellular space on electron microscopy images, a the study by Muehlberg et al. (41). finding not observed in our analysis until later dis- Currently, the performance of frequent surveil- ease stages. This indicates that we identified doxo- lance, comprehensive, multiparametric, contrast- rubicin cardiotoxic effects at an earlier disease stage, enhanced CMRs as part of routine care is likely not when only intracardiomyocyte changes were present, feasible given the high volume of patients receiving with preservation of the extracellular space. Our anthracycline-based chemotherapy, high cost, and weekly protocol was able to identify the onset of lack of access to CMR capabilities. We speculate that cardiac damage, whereas Farhad et al. (26) performed the development of ultra-fast CMR protocols able to the first scan at the end of the doxorubicin protocol, gather the minimum info required for this screening thus missing the earliest on-treatment tissue might help alleviate these limitations. In the mean- composition changes. In another study, Hong et al. time, this CMR strategy might be offered for those (30) used a rabbit model of doxorubicin-induced patients at high risk for developing anthracycline- cardiotoxicity to study the evolution of changes in induced cardiotoxicity (8). T 1 mapping and T1-based ECV, but did not include T2 STUDY LIMITATIONS. One potential limitation of the mapping. These authors found that T1 relaxation- present study is the intracoronary doxorubicin time prolongation occurred concurrently with ECV administration route, contrasting the intravenous expansion at a time when LVEF had already route used in cancer patients. In the pig, the intra- deteriorated (albeit not significantly vs. baseline). venous route requires very high doxorubicin doses Histological evaluation revealed intracardiomyocyte that result in significant myelosuppression and vacuolization and interstitial fibrosis, indicating that compromise the experimental setting (42). The this time point corresponds to more advanced disease intracoronary approach in the pig model was stage than that identified by us. described by Christiansen et al. (23) and has been To date, very few studies have used a serial mul- validated by several imaging approaches as a valid tiparametric CMR strategy including T2 mapping in alternative. In this study, all animals showed a very patients undergoing anthracycline therapy. Several similar behavior in terms of time to intra- authors have reported CMR findings in patients cardiomyocyte edema and time to LVEF fall. In the treated with anticancer therapies (16–19,35,36). In clinical setting, this is expected to be more variable. some of these studies, increased ECV coincided with In addition, the time window between T 2 relaxation cardiac function deterioration. Few studies have re- time prolongation and LVEF fall (3 weeks) appears ported serial CMR examinations before and after narrow to be picked-up in the clinical setting. We anthracycline exposure, and in most of them, speculate that this time window might be signifi- CMR was performed only after completion of cantly wider in patients due to the more concealed anthracycline administration, thus missing early evolution of the disease but this is to be demon- changes occurring during treatment (37–40). More strated in the clinics.
790   Galán-Arriola et al.                                                                                                                          JACC VOL. 73, NO. 7, 2019

      T2 Mapping CMR and Anthracycline Cardiotoxicity                                                                                              FEBRUARY 26, 2019:779–91

                    CONCLUSIONS
                                                                                                     ADDRESS FOR CORRESPONDENCE: Dr. Borja Ibanez,

                    In a large animal model of anthracycline-induced                                 Translational Laboratory for Cardiovascular Imaging
                    cardiotoxicity, we show that the earliest CMR on-                                and Therapy, Centro Nacional de Investigaciones
                    treatment event is a prolongation of T 2 relaxation                              Cardiovasculares Carlos III (CNIC), and IIS-Fundación
                    time. T 1 mapping and T 1-based ECV are normal at this                           Jiménez Díaz University Hospital, c/ Melchor Fer-
                    early time point and do not change until later in the                            nandez Almagro, 3, 28029 Madrid, Spain. E-mail:
                    cardiotoxic process. At this early stage, T 2 mapping                            bibanez@cnic.es. OR Dr. Javier Sánchez-González,
                    abnormalities          correspond         to     intracardiomyocyte              MR Clinical Scientist Philips Healthcare Iberia, cy
                    edema secondary to doxorubicin-induced vacuoliza-                                María de Portugal, 1, 28050 Madrid, Spain. E-mail:
                    tion, unaccompanied by any extracellular alteration.                             Javier.Sanchez.Gonzalez@philips.com.
                    Early identification of intracardiomyocyte edema
                    from T 2 mapping abnormalities has prognostic im-                                     PERSPECTIVES
                    plications, because stopping doxorubicin treatment
                    upon detection of this early CMR marker stops the                                     COMPETENCY IN PATIENT CARE AND
                    progression of LV dysfunction and triggers regression
                                                                                                          PROCEDURAL SKILLS: T2 mapping abnormalities
                    of intracardiomyocyte vacuolization. Serial multi-
                                                                                                          identified by CMR imaging in the presence of normal
                    parametric T 2 mapping during treatment has the po-
                                                                                                          T1, ECV, and LV wall motion correlate with
                    tential      to     support        personalized         anthracycline
                                                                                                          cardiomyocyte vacuolization at an early and reversible
                    regimes.
                                                                                                          stage of anthracycline-induced cardiotoxicity.

                    ACKNOWLEDGMENTS The authors thank Eugenio
                                                                                                          TRANSLATIONAL OUTLOOK: Prospective trials of
                    Fernández,          Santiago        Rodriguez-Colilla,           Tamara
                                                                                                          chemotherapeutic strategies guided by serial T2
                    Córdoba, Óscar Sanz, Nuria Valladares, Inés Sanz, and
                                                                                                          mapping could incorporate earlier cardiac intervention
                    Rubén Mota for technical and veterinary support at
                                                                                                          to preserve ventricular function in those with early
                    the CNIC animal facility and the farm. They also thank
                                                                                                          cardiotoxicity and higher cumulative anthracycline
                    Marta Gavilán, Ángel Macías, and Braulio Pérez for
                                                                                                          therapy for those without evidence of toxicity.
                    technical support in CMR studies. Simon Bartlett
                    (CNIC) provided English editing.

                    REFERENCES

                    1. Minotti G, Menna P, Salvatorelli E, Cairo G,      to management. Prog Cardiovasc Dis 2007;49:             of the human heart to myocardial infarction: im-
                    Gianni L. Anthracyclines: molecular advances and     330–52.                                                 plications for assessing myocardial area at risk and
                    pharmacologic developments in antitumor activity                                                             salvage. Circulation 2017;136:1288–300.
                                                                         8. Zamorano JL, Lancellotti P, Rodriguez Munoz D,
                    and cardiotoxicity. Pharmacol Rev 2004;56:
                                                                         et al. 2016 ESC position paper on cancer treat-         13. Flett AS, Hayward MP, Ashworth MT, et al.
                    185–229.
                                                                         ments and cardiovascular toxicity developed un-         Equilibrium contrast cardiovascular magnetic
                    2. Chang HM, Moudgil R, Scarabelli T,                der the auspices of the ESC Committee for Practice      resonance for the measurement of diffuse
                    Okwuosa TM, Yeh ETH. Cardiovascular complica-        Guidelines: The Task Force for Cancer Treatments        myocardial fibrosis: preliminary validation in
                    tions of cancer therapy: best practices in diag-     and Cardiovascular Toxicity of the European So-         humans. Circulation 2010;122:138–44.
                    nosis, prevention, and management: part 1. J Am      ciety of Cardiology (ESC). Eur Heart J 2016;37:         14. Nakamori S, Dohi K, Ishida M, et al. Native T1
                    Coll Cardiol 2017;70:2536–51.                        2768–801.                                               mapping and extracellular volume mapping for the
                    3. Zhang S, Liu X, Bawa-Khalfe T, et al. Identifi-    9. Lopez-Fernandez T, Martin Garcia A, Santaballa       assessment of diffuse myocardial fibrosis in
                    cation of the molecular basis of doxorubicin-        Beltran A, et al. Cardio-onco-hematology in clin-       dilated cardiomyopathy. J Am Coll Cardiol Intv
                    induced cardiotoxicity. Nat Med 2012;18:1639–42.     ical practice. Position paper and recommenda-           2018;11:48–59.

                    4. Hahn VS, Lenihan DJ, Ky B. Cancer therapy-        tions. Rev Esp Cardiol (Engl Ed) 2017;70:474–86.        15. Ambale-Venkatesh B, Lima JA. Cardiac MRI: a
                    induced cardiotoxicity: basic mechanisms and po-     10. Fernandez-Jimenez R, Sanchez-Gonzalez J,            central prognostic tool in myocardial fibrosis. Nat
                    tential cardioprotective therapies. J Am Heart       Aguero J, et al. Fast T2 gradient-spin-echo (T2-        Rev 2015;12:18–29.
                    Assoc 2014;3:e000665.                                GraSE) mapping for myocardial edema quantifi-            16. Neilan TG, Coelho-Filho OR, Shah RV, et al.
                    5. Buja LM, Ferrans VJ, Mayer RJ, Roberts WC,        cation: first in vivo validation in a porcine model of   Myocardial extracellular volume by cardiac mag-
                    Henderson ES. Cardiac ultrastructural changes        ischemia/reperfusion. J Cardiovasc Magn Reson           netic resonance imaging in patients treated with
                    induced by daunorubicin therapy. Cancer 1973;32:     2015;17:92.                                             anthracycline-based chemotherapy. Am J Cardiol
                    771–88.                                              11. Fernandez-Jimenez R, Garcia-Prieto J, San-          2013;111:717–22.

                    6. Friedman MA, Bozdech MJ, Billingham ME,           chez-Gonzalez J, et al. Pathophysiology underly-        17. Toro-Salazar OH, Gillan E, O’Loughlin MT,
                    Rider AK. Doxorubicin cardiotoxicity. Serial endo-   ing the bimodal edema phenomenon after                  et al. Occult cardiotoxicity in childhood cancer
                    myocardial biopsies and systolic time intervals.     myocardial ischemia/reperfusion. J Am Coll Cardiol      survivors exposed to anthracycline therapy. Circ
                    JAMA 1978;240:1603–6.                                2015;66:816–28.                                         Cardiovasc Imaging 2013;6:873–80.

                    7. Takemura G, Fujiwara H. Doxorubicin-induced       12. Fernandez-Jimenez R, Barreiro-Perez M, Mar-         18. Ylanen K, Poutanen T, Savikurki-Heikkila P,
                    cardiomyopathy from the cardiotoxic mechanisms       tin-Garcia A, et al. Dynamic edematous response         Rinta-Kiikka I, Eerola A, Vettenranta K. Cardiac
JACC VOL. 73, NO. 7, 2019 Galán-Arriola et al. 791
FEBRUARY 26, 2019:779–91 T2 Mapping CMR and Anthracycline Cardiotoxicity
magnetic resonance imaging in the evaluation of and function in mice treated with anthracyclines cardiomyopathy after treatment with anthracy-
the late effects of anthracyclines among long- using serial cardiac magnetic resonance imaging. clines. Am J Cardiol 2012;110:1679–86.
term survivors of childhood cancer. J Am Coll Circ Cardiovasc Imaging 2016;9.
36. Cheung YF, Lam WW, Ip JJ, et al. Myocardial
Cardiol 2013;61:1539–47.
27. Cottin Y, Ribuot C, Maupoil V, et al. Early iron load and fibrosis in long term survivors of
19. Tham EB, Haykowsky MJ, Chow K, et al. Diffuse incidence of adriamycin treatment on cardiac pa- childhood leukemia. Pediatr Blood Cancer 2015;
myocardial fibrosis by T1-mapping in children with rameters in the rat. Can J Physiol Pharmacol 1994; 62:698–703.
subclinical anthracycline cardiotoxicity: relation- 72:140–5. 37. Drafts BC, Twomley KM, D’Agostino R Jr.,
ship to exercise capacity, cumulative dose and
28. Lightfoot JC, D’Agostino RB Jr., Hamilton CA, et al. Low to moderate dose anthracycline-based
remodeling. J Cardiovasc Magn Reson 2013;15:48.
et al. Novel approach to early detection of doxo- chemotherapy is associated with early noninva-
20. Jordan JH, D’Agostino RB Jr., Hamilton CA, rubicin cardiotoxicity by gadolinium-enhanced sive imaging evidence of subclinical cardiovascular
et al. Longitudinal assessment of concurrent cardiovascular magnetic resonance imaging in an disease. J Am Coll Cardiol Img 2013;6:877–85.
changes in left ventricular ejection fraction and experimental model. Circ Cardiovasc Imaging 38. Jordan JH, Vasu S, Morgan TM, et al. Anthra-
left ventricular myocardial tissue characteristics 2010;3:550–8. cycline-associated T1 mapping characteristics are
after administration of cardiotoxic chemotherapies
29. Hong YJ, Kim TK, Hong D, et al. Myocardial elevated independent of the presence of cardio-
using T1-weighted and T2-weighted cardiovascu-
characterization using dual-energy CT in vascular comorbidities in cancer survivors. Circ
lar magnetic resonance. Circ Cardiovasc Imaging
doxorubicin-induced DCM: comparison with CMR Cardiovasc Imaging 2016;9:e004325.
2014;7:872–9.
T1-mapping and histology in a rabbit model. J Am 39. Lunning MA, Kutty S, Rome ET, et al. Cardiac
21. Toro-Salazar OH, Lee JH, Zellars KN, et al. Use Coll Cardiol Img 2016;9:836–45. magnetic resonance imaging for the assessment of
of integrated imaging and serum biomarker pro-
30. Hong YJ, Park HS, Park JK, et al. Early detec- the myocardium after doxorubicin-based chemo-
files to identify subclinical dysfunction in pediatric
tion and serial monitoring of anthracycline- therapy. Am J Clin Oncol 2015;38:377–81.
cancer patients treated with anthracyclines. Car-
induced cardiotoxicity using T1-mapping cardiac 40. Heck SL, Gulati G, Hoffmann P, et al. Effect of
diooncology 2018;4:4.
magnetic resonance imaging: an animal study. Sci candesartan and metoprolol on myocardial tissue
22. Goetzenich A, Hatam N, Zernecke A, et al. Rep 2017;7:2663. composition during anthracycline treatment: the
Alteration of matrix metalloproteinases in selec-
PRADA trial. Eur Heart J Cardiovasc Imaging 2018;
tive left ventricular adriamycin-induced cardio- 31. Cardinale D, Colombo A, Bacchiani G, et al.
19:544–52.
myopathy in the pig. J Heart Lung Transplant Early detection of anthracycline cardiotoxicity and
2009;28:1087–93. improvement with heart failure therapy. Circula- 41. Muehlberg F, Funk S, Zange L, et al. Native
tion 2015;131:1981–8. myocardial T1 time can predict development of
23. Christiansen S, Perez-Bouza A, Schalte G,
subsequent anthracycline-induced cardiomyopa-
Hilgers RD, Autschbach R. Selective left ventricu- 32. Cardinale D, Colombo A, Lamantia G, et al.
thy. ESC Heart Fail 2018;5:620–9.
lar adriamycin-induced cardiomyopathy in the pig. Anthracycline-induced cardiomyopathy: clinical
J Heart Lung Transplant 2008;27:86–92. relevance and response to pharmacologic therapy. 42. Van Vleet JF, Greenwood LA, Ferrans VJ.
J Am Coll Cardiol 2010;55:213–20. Pathologic features of adriamycin toxicosis in
24. Hadi AM, Mouchaers KT, Schalij I, et al. Rapid
young pigs: nonskeletal lesions. Am J Vet Res
quantification of myocardial fibrosis: a new macro- 33. Fernandez-Jimenez R, Sanchez-Gonzalez J,
1979;40:1537–52.
based automated analysis. Cell Oncol (Dordr) Aguero J, et al. Myocardial edema after ischemia/
2011;34:343–54. reperfusion is not stable and follows a bimodal
pattern: imaging and histological tissue charac-
25. Fernandez-Jimenez R, Galan-Arriola C, San- KEY WORDS anthracycline, cardio-
terization. J Am Coll Cardiol 2015;65:315–23.
chez-Gonzalez J, et al. Effect of ischemia duration oncology, cardiotoxicity, CMR, doxorubicin
and protective interventions on the temporal dy- 34. Mitry MA, Edwards JG. Doxorubicin induced
namics of tissue composition after myocardial heart failure: phenotype and molecular mecha-
infarction. Circ Res 2017;121:439–50. nisms. Int J Cardiol Heart Vasc 2016;10:17–24.
A PP END IX For a supplemental table and
26. Farhad H, Staziaki PV, Addison D, et al. Char- 35. Neilan TG, Coelho-Filho OR, Pena-Herrera D, figure, please see the online version of this
acterization of the changes in cardiac structure et al. Left ventricular mass in patients with a paper.You can also read