ATLAS.ti 8 Windows Quick Tour - Online Update
←
→
Page content transcription
If your browser does not render page correctly, please read the page content below
ATLAS.ti 8 Windows Quick Tour
ATLAS.ti 8 Windows – Quick Tour

Copyright ©2019 by ATLAS.ti Scientific Software Development GmbH, Berlin. All rights reserved.
Document version: 673.20190310. Updated for program version: 8.4
Author: Dr. Susanne Friese
Production: hypertexxt.com/Dr. Thomas G. Ringmayr

Copying or duplicating this document or any part thereof is a violation of applicable law. No part of this manual may be reproduced or
transmitted in any form or by any means, electronic or mechanical, including, but not limited to, photocopying, without written permission
from ATLAS.ti GmbH.

Trademarks: ATLAS.ti is a registered trademark of ATLAS.ti Scientific Software Development GmbH. Adobe Acrobat is a trademark of
Adobe Systems Incorporated; Microsoft, Windows, Excel, and other Microsoft products referenced herein are either trademarks of Microsoft
Corporation in the United States and/or in other countries. Google Earth is a trademark of Google, Inc. All other product names and any
registered and unregistered trademarks mentioned in this document are used for identification purposes only and remain the exclusive
property of their respective owners.

CONTENTS 3
Contents
Objectives of this Document................................................................................................................................................................... 5
Other Useful Resources For Getting Started................................................................................................................................ 5
Basic Concepts.......................................................................................................................................................................................... 5
ATLAS.ti – The Knowledge Workbench........................................................................................................................................ 5
Software For Creative Analysis...................................................................................................................................................... 5
Some Basic Terms And Concepts.................................................................................................................................................. 5
First Steps................................................................................................................................................................................................. 6
The Sample Project......................................................................................................................................................................... 6
Starting ATLAS.ti............................................................................................................................................................................ 6
Interface........................................................................................................................................................................................... 7
The ATLAS.ti Ribbon...................................................................................................................................................................... 8
Backdrop ........................................................................................................................................................................................ 10
Selecting The Display Language ................................................................................................................................................. 10
The Six Main Entity Types............................................................................................................................................................ 10
Working With Docked And Floated Windows............................................................................................................................. 11
Working With Tabs And Various Regions In The Main Work Space......................................................................................... 12
Display Of Coded Document With Margin Area.......................................................................................................................... 13
Creating A New Project........................................................................................................................................................................... 16
Adding Documents........................................................................................................................................................................ 16
Removing / Deleting Documents From A Project....................................................................................................................... 17
Saving Projects............................................................................................................................................................................... 17
Project Backup And Transfer........................................................................................................................................................ 18
Starting Data Analysis........................................................................................................................................................................... 18
Importing The Stage 1 Project...................................................................................................................................................... 18
Organizing Project Data................................................................................................................................................................ 19
Exploring The Content Of Text Documents................................................................................................................................. 21
Reading Data, Noticing And Marking Interesting Things......................................................................................................... 23
Creating Quotations ..................................................................................................................................................................... 23
Creating Hyperlinks....................................................................................................................................................................... 25
Coding Data............................................................................................................................................................................................ 28
Creating And Applying Codes...................................................................................................................................................... 28
Coding PDF Files........................................................................................................................................................................... 30
Applying Existing Codes .............................................................................................................................................................. 30
Modifying The Length Of A Coded Segment.............................................................................................................................. 31
Replacing A Code.......................................................................................................................................................................... 32
Changing and Removing Code Color........................................................................................................................................... 32
Writing Code Comments.............................................................................................................................................................. 32
Merging Codes .............................................................................................................................................................................. 33
Splitting A Code............................................................................................................................................................................ 34
Working With Code Groups.......................................................................................................................................................... 35
Coding An Image........................................................................................................................................................................... 36
Retrieving Coded Data.................................................................................................................................................................. 37
Creating Reports........................................................................................................................................................................... 39
Working With Comments And Memos................................................................................................................................................. 41
Creating Memos............................................................................................................................................................................ 42
Linking Memos To Data Segments............................................................................................................................................. 43
Viewing Memo Links in a Network.............................................................................................................................................. 43
Querying Data......................................................................................................................................................................................... 44
Overview........................................................................................................................................................................................ 44
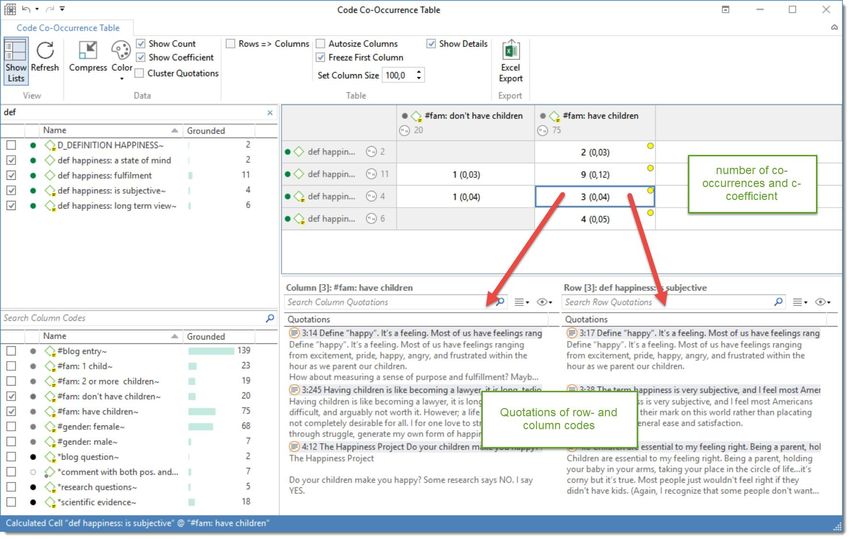
Code Co-occurrences Analysis - Example .................................................................................................................................. 45
Cross-Tabulation Of Codes By Documents & Groups - Example............................................................................................... 47
Document And Group Comparisons In The Query Tool............................................................................................................. 48
Complex Retrievals In The Query Tool........................................................................................................................................ 49
Working With Networks And Links ..................................................................................................................................................... 49
Exploring Networks...................................................................................................................................................................... 49
Creating Your Own Network......................................................................................................................................................... 52
ATLAS.ti 8 Windows – Quick Tour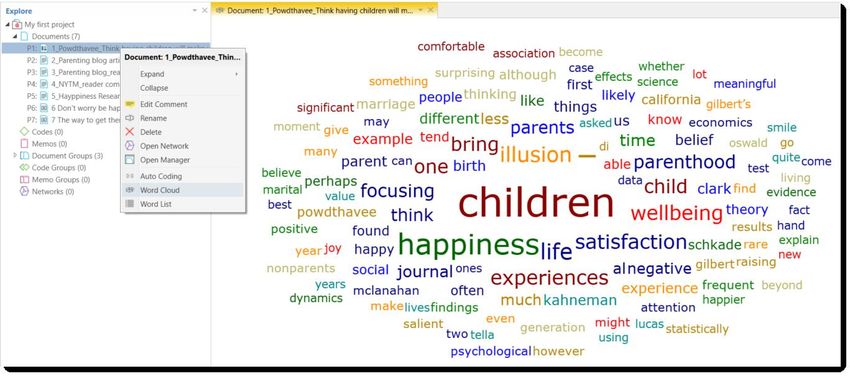
CONTENTS                                                                                                                                                                                                           4

                   Creating And Modifying Relations ............................................................................................................................................ 54
                   Exporting Networks...................................................................................................................................................................... 55

           Creating Reports.................................................................................................................................................................................... 55
                   Overview........................................................................................................................................................................................ 55
                   Creating Word / PDF Reports...................................................................................................................................................... 55
                   Creating Excel Reports................................................................................................................................................................. 56
                   Creating A Code Book................................................................................................................................................................... 58

           Importing Survey Data........................................................................................................................................................................... 59
                   Preparing Survey Data For Import............................................................................................................................................... 59
                   How To Import Survey Data......................................................................................................................................................... 60
                   Inspecting Imported Survey Data............................................................................................................................................... 60
                   Working With Survey Data.......................................................................................................................................................... 62

           Working With Reference Manager Data.............................................................................................................................................. 62
                   Overview........................................................................................................................................................................................ 62
                   Preparing Mendeley Data............................................................................................................................................................. 62
                   Preparing Zotero Data.................................................................................................................................................................. 63
                   Importing Reference Manager Data........................................................................................................................................... 63
                   Inspecting Imported Documents................................................................................................................................................. 63

           Twitter Data........................................................................................................................................................................................... 64
                   Importing Twitter Data................................................................................................................................................................ 64
                   Inspecting Imported Twitter Data............................................................................................................................................... 65

                                                                                                                                                             ATLAS.ti 8 Windows – Quick Tour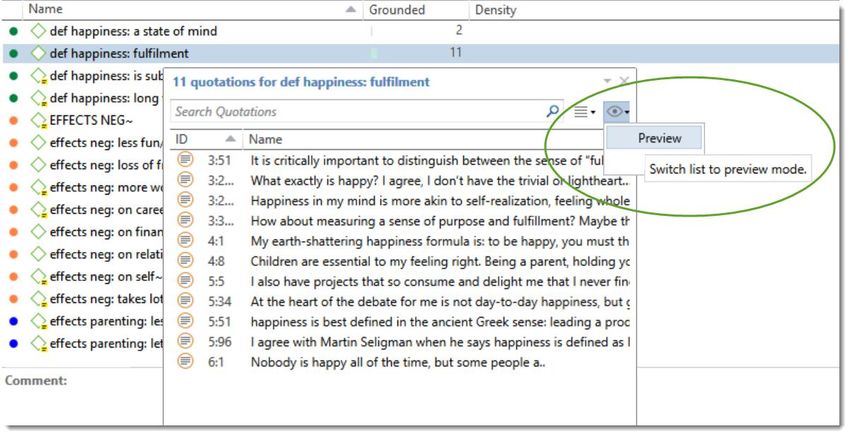
OBJECTIVES OF THIS DOCUMENT                                                                                                                                    5

Objectives of this Document
                              Perhaps you have just downloaded the trial version of ATLAS.ti 8 because you are generally curious about its possibilities. Or
                              you are evaluating different software packages for qualitative data analysis. Or maybe you just purchased ATLAS.ti and are
                              now eager to take your very first steps with the program.
                              The ATLAS.ti 8 Quick Tour was designed with users like yourself in mind!
                              Its main objectives are to provide an initial orientation for working with our software, quickly acquaint you with its most
                              important features, and demonstrate some of its typical applications.
                              The tour first introduces some basic concepts that are important to know when working with ATLAS.ti. The step-by-step
                              instruction that follows uses a sample project, which can be downloaded from our website. After learning about the main
                              components of the ATLAS.ti user interface, you are guided through the various phases of the analysis process like creating a
                              project, exploring the data, coding, working with comments and memos, querying data, creating networks and reports. You
                              will also get to know some special options such as how to prepare and import survey data, how to import reference manager
                              and Twitter data.

                              Other Useful Resources For Getting Started
                                • System requirements and installation instructions can be found here.
                                • Download Whats' New in ATLAS.ti 8 Windows here.
                                • Video tutorials in English and Spanish can be found on our YouTube channel.
                                • Free introductory online webinars here.

Basic Concepts

                              ATLAS.ti – The Knowledge Workbench
                              The image of our software as a "knowledge workbench" is more than just a lively analogy. Analytical work involves tangible
                              elements: research material requires piecework, assembly, reworking, complex layouts, and some special "tooling". A well-
                              stocked workbench provides you with the necessary instruments to thoroughly analyze and evaluate, search and query your
                              data, to capture, visualize and share your findings.

                              Software For Creative Analysis
                              Your typical project deals with sifting through large sets of diverse documents, notes, and multi-media files, and examining
                              and comparing such sources regarding a specific line of inquiry.
                              While the technical side of selecting, and organizing useful portions of your data might seem manageable when dealing with
                              just a handful of source documents, it can tend to become overwhelming as the number of sources mount.
                              Enter a specialized software package like ATLAS.ti: It lets you extract, categorize, and interlink data segments from a large
                              variety and volume of source documents. Based on your analysis, the software supports you in discovering patterns and
                              testing hypotheses. With numerous output options and collaboration tools, your analysis is easily accessible to yourself and
                              others.

                              Some Basic Terms And Concepts
                              To understand how ATLAS.ti handles data, visualize your entire project as an intelligent "container" that keeps track of all
                              your data. This container is your ATLAS.ti project.
                              The project keeps track of the paths to your source data and stores the codes, code groups, network views, etc. that you
                              develop during your work. Your source data files are copied and stored in a repository. The standard option is for ATLAS.ti to
                              manage the documents for you in its internal database. If you work with larger audio or video files, they can be linked
                              "externally" to your project to preserve disk space. All files that you assign to the project (except those externally linked) are
                              copied, i.e. a duplicate is made for ATLAS.ti's use. Your original files remain intact and untouched in their original location.

                                                                                                                            ATLAS.ti 8 Windows – Quick Tour
BASIC CONCEPTS                                                                                                                                   6

                 Your source data can consist of text documents (such as interviews, articles, reports); images (photos, screen shots,
                 diagrams), audio recordings (interviews, broadcasts, music), video clips (audiovisual material), PDF files (papers, brochures,
                 reports), and even geo data (locative data using Open Street Map).
                 Once your various documents are added or linked to an ATLAS.ti project, your real work can begin. Most commonly, early
                 project stages involve coding different data sources.
                 Coding is the basic activity you engage in when using ATLAS.ti and is the basis of everything else you will do. In practical
                 terms, coding refers to the process of assigning categories, concepts, or "codes" to segments of information that are of
                 interest to your research objectives. We have modeled this function to correspond with the time-honored practice of
                 marking (underlining or highlighting) and annotating text passages in a book or other documents.
                 In its central conceptual underpinnings, ATLAS.ti has drawn deliberately from what might be called the "paper and pencil
                 paradigm." The user interface is designed accordingly, and many of its processes are based on—and thus can be better
                 understood by—this analogy.
                 Because of this highly intuitive design principle, you will quickly come to appreciate the margin area as one of your most
                 central and preferred work space—even though ATLAS.ti almost always offers a variety of ways to accomplish any given task.
                                                                               ***
                 Equipped with this basic understanding, you are now definitely ready to get your feet wet and get acquainted with ATLAS.ti
                 8.

First Steps
                 To familiarize with ATLAS.ti 8 quickly, you will be working with a sample project that we have already created for you to
                 experiment with.

                     The sample project (in two parts) is available online for download here.

                 The Sample Project
                 When searching for suitable example data for this Quick Tour, we happened upon an article on the topic of children and
                 happiness, written by Nattavudh Powdthavee in the journal The Psychologist1. Powdthavee reports on several academic
                 studies that repeatedly found a negative correlation between having children and the parents' levels of happiness, life
                 satisfaction, marital satisfaction and mental well-being. These are on the one hand provocative findings if you are a parent
                 yourself; on the other hand, they add fuel to the fire for people who have decided purposefully against parenthood ("I knew it
                 all along.").
                 In any case, no matter on which side of the issue you stand, the article and the various reactions to it (in the form of blog
                 discussions) promised to be interesting material for a sample study. It will let you code the various blog posts and offers a
                 variety of opportunities to try out many of the powerful analytic functions ATLAS.ti brings to the task.
                 In addition to the journal article itself, a report written about this article in a parenting blog and reader comments are
                 included, as well as the reader comments of an article published in the New York Times Magazine, and a summary of
                 research finding regarding happiness research more generally. Furthermore, some fictional survey data are available. The
                 survey data contains answers from 24 respondents to two open-ended questions: Reasons for having and for not having
                 children. You will import the survey data yourself as part of the Quick Tour.

                     The data is available for download here.

                 Starting ATLAS.ti
                 In Windows 10, start ATLAS.ti by typing "ATLAS.ti" into the Windows search field, or ask the voice assistant Cortana to open
                 it for you.
                 In older Windows versions, go to START / P ROGRAMS and select S CIENTIFIC S OFTWARE / ATLAS. TI 8. Or double-click the ATLAS.ti
                 shortcut on your desktop if you selected this option during installation.

                 1    Powdthavee, N. (2009). Think having children will make you happy? Think again, suggests Nattavudh Powdthavee – you’re
                      experiencing a focusing illusion, V 22 (4), 308-311.

                                                                                                              ATLAS.ti 8 Windows – Quick Tour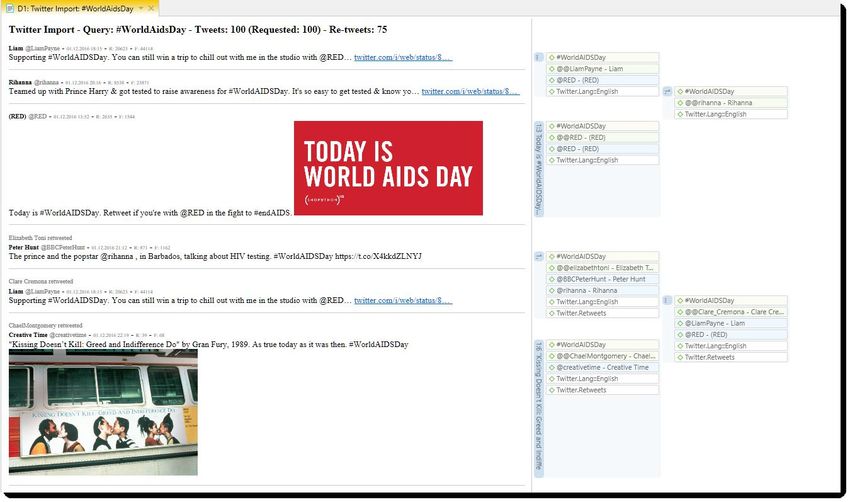
FIRST STEPS                                                                                                                                  7

              Figure 1: ATLAS.ti Start Screen – Create a new project, or open an existing one.

                 Download the sample project Children and happiness sample (stage 2). – If this direct download link does not work for you,
                 you can also find the sample projects here.

              Figure 2: Import project bundle dialogue

                 Select the option IMPORT P ROJECT BUNDLE. The Import Project Bundle dialogue opens. You can rename the project if you
                 want, but for this exercise it is not necessary. Just click IMPORT.
              If a project is already loaded, you need to select File / New. This will also bring you to a screen where you see the Import
              Project Bundle option.

              Interface
              When you open a project, you see the ribbon on top, the project navigator on the left-hand side and the ATLAS.ti logo in the
              middle of the working area. At the top of the screen, you see the title bar where the name of the current project is displayed.
              It also includes the Save, Undo and Redo functions on the left-hand side. Below the title you see ribbon tabs.

                 Video Tutorial: ATLAS.ti 8 Windows - Interface Overview

                                                                                                            ATLAS.ti 8 Windows – Quick Tour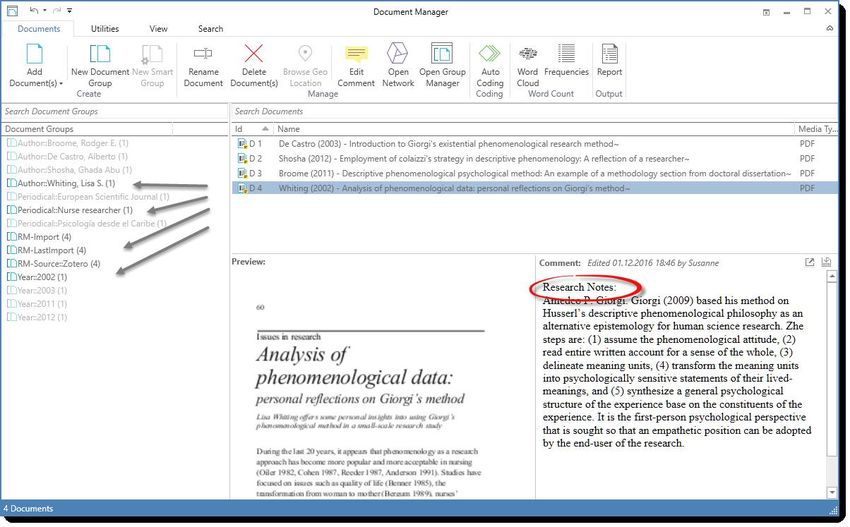
FIRST STEPS                                                                                                                                           8

              Figure 3: ATLAS.ti 8 Interface

                      You are probably familiar with ribbons from other contemporary Windows software that you use. A ribbon is a graphical
                      control element in the form of a set of toolbars placed on several tabs. They are grouped by functionality rather than object
                      types, as was the case in older versions of ATLAS.ti. Ribbons, in comparison, use tabs to expose different sets of controls,
                      eliminating the need for numerous parallel toolbars. This highly improves the workflow and makes it easier for users to see
                      which functions are available for a given context.

                      The ATLAS.ti Ribbon
                      The five core tabs in ATLAS.ti are:

                      Figure 4: Core tabs in ATLAS.ti 8 to access the various functions

                       •   Home
                       •   Search Project
                       •   Analyze
                       •   Import & Export
                       •   Tools & Support
                      Depending on the function you are using, additional contextual tabs will appear. These will be highlighted by a colored line at
                      the top of the ribbon.

                                                                                                                  ATLAS.ti 8 Windows – Quick Tour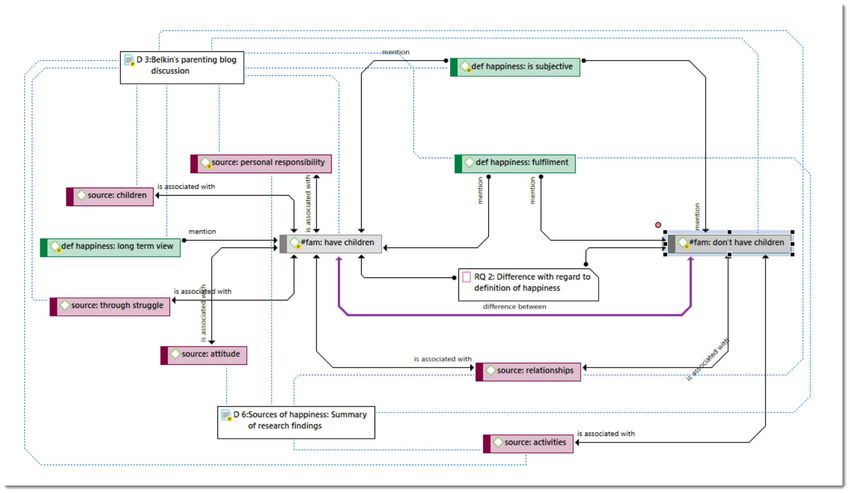
FIRST STEPS                                                                                                                                               9

                     The HOME tab (see Figure 4) is the starting point for most projects. You can start here to add documents to a project, create
                     new codes, memos and networks (NEW ENTITIES ), open various navigators to be displayed in the navigation area on the left-
                     hand side of the screen, write a comment for your project, and open the various managers.

                     The S EARCH P ROJECT tab allows to search through all entities of your project. Later in this tour there will be an exercise where
                     you practice its functionality.

              Figure 5: Search Project tab

                     The ANALYZE tab offers a number of advanced functions to analyze your data after coding. See “Querying Data“ on page 44ff.
                     The Inter-Coder Agreement function is not discussed in this Quick Tour.

                     Figure 6: Analyze tab

                     Use the IMPORT/EXPORT tab to import Twitter data (page 64), to add data stored in Evernote, to import data from reference
                     managers like Endnotes, Medeley, etc. to support the analysis of literature (page 62), to import survey data, especially
                     responses to open-ended questions (page 59) and already existing code lists. If you are interested in a mixed-method
                     approach, you can generate a SPSS syntax file for further quantitative analysis in SPSS of your qualitative coding. Another
                     option is to export an Excel file that contains all of your ATLAS.ti data for import to R, SAS or STATA.
                     Further, you can import and export code lists in Excel or QDC format. The QDC format is an open access exchange format to
                     exchange code lists or code books between different CAQDAS packages. ATLAS.ti is an active supporter of the initiative and
                     has advocated and offered open exchange formats since 2004. See: http://www.qdasoftware.org/
                     Document Groups can also be exported and imported. You will find a description on how to work with document groups later
                     in this Quick Tour.

                     Figure 7: Import/Export

                     If you want to report a problem, send suggestions, create or manage user accounts, want to access the Quick Tour or other
                     resources, click on the T OOLS &SUPPORT tab. The Redundant Codings Analyzer is a tool that helps to clean up your project after
                     coding. See full manual for further detail.

                     Figure 8: Support

                                                                                                                    ATLAS.ti 8 Windows – Quick Tour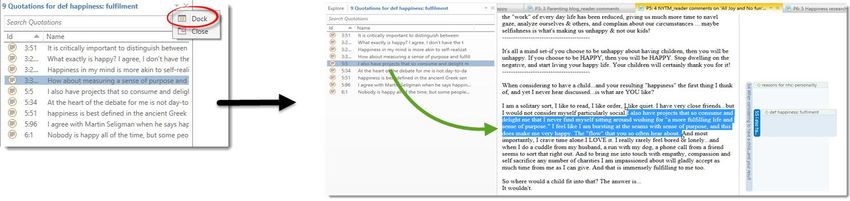
FIRST STEPS                                                                                                                                          10

                        Backdrop
                        Under FILE you find all options that concern your project, like creating a new project, open existing projects, saving and
                        deleting projects, exporting and merging projects (see “Saving Projects“, and “Project Backup And Transfer“. For more
                        information on merging projects, see the full manual.
                        Via O PTIONS you can access Project and Application Preferences, set the user interface language, check for updates, or switch
                        the library location (see full manual for more detail).

                        Selecting The Display Language
                        Currently three user interface languages are available: English, German and Spanish. ATLAS.ti recognized the language or
                        your Operating System and will set the language accordingly. The default language is English for all OS that are not German
                        or Spanish.

                        Figure 10: Setting the Display Language

                           To change the user interface language, select FILE / O PTIONS / APPLICATION P REFERENCES / DISPLAY OPTIONS.

Figure 9: Application
commands
                        The Six Main Entity Types
                        The six main entity types in ATLAS.ti are: Documents, Quotations, Codes, Memos, Networks, and Links. All entity types have
                        their own manager, which can be opened from the Home tab:

                           To open the Document Manager, click on the Documents button; to open the Quotation Manager, click on the Quotations
                           button; to open the Code Manager click on the Codes button, and so on.
                        The managers open as docked windows, but all windows can be floated as well (see arrow on the top right in Figure 12). Each
                        manager contains a list of the entities it manages and some detail information about them. At the bottom of the list, you
                        find a comment field in each manager and in some managers, also a preview field. E.g. in the Document and Quotation
                        Manager you can preview the content of either the selected document or the selected quotation. In the Memo Manager, the
                        memo content is shown next to the comment field.

                        Figure 11: The managers for the six main entities

                        Another common element is the side panel on the left-hand side, which can be used to quickly access and filter the elements
                        listed in the managers. On top of the side panel and entity list, you find a search field.

                                                                                                                     ATLAS.ti 8 Windows – Quick Tour
FIRST STEPS 11
Figure 12: Document Manager
In all managers but the Links Manager you find both a View and a Search tab. In the View tab, you can activate or deactivate
the navigator, the preview field (if available) or the comments. The list of entities can either be displayed showing lots of
detail or just as a single column.
Figure 13: View
The search allows you to search through the entire content of documents, quotations or memos, through entity names and
comments, or entities created or written by a selected author. The search term can contain regular expression (GREP; see full
manual).
In case you wonder why there is a search option here in addition to the main Search tab, the difference is that the search
option in managers is restricted to the respective entity type. Thus, if you are for instance in the Quotation Manager and you
want to search quotation content, accessing the search option directly in the manager is more convenient.
Figure 14: Search
Working With Docked And Floated Windows
When you first open a manager or other windows, they will be opened in docked mode. All windows can however also be
floating. Depending on what you are currently doing, you may prefer a window to be docked or floated. Once you have docked
a window, ATLAS.ti will remember this as your preferred setting for the current session. Let's shortly practice how to float
and dock windows.
ATLAS.ti 8 Windows – Quick TourFIRST STEPS 12
Open the Code Manager by clicking the CODES button on the H OME Tab, or double.click on the main Codes branch in the
Project Explorer.
To float the window, click on the drop down arrow as shown in Figure 17 and select FLOAT.
Figure 15: Docked Code Manager
To dock this window, click on the icon shown in Figure 16.
Figure 16: Floated Code Manager
Under FILE / O PTIONS / P ROJECT P REFERENCES you can set your preferred behavior.
Working With Tabs And Various Regions In The Main Work Space
In the next exercise, we would like to show you how to work with the various entities and features in the main work space.
While doing so, some other features are explained along the way. Let's open some documents, the Code Manager and a
memo:
To load a document, open the document tree in the navigation area on the left-hand side and double-click document D1
and D3:
ATLAS.ti 8 Windows – Quick TourFIRST STEPS 13
Figure 17: Open documents from the navigation panel
The documents are loaded into two tabs in the main work space. The tab of the currently loaded document is colored in
yellow.
Figure 18: Documents loaded in tabs next to each other
If you want to see the documents side-by-side, you can move one of the documents into a different tab group, click on the
down arrow and select NEW TAB G ROUP / R IGHT .
Figure 19: Moving a document into a new tab group
You have the option to move it into a tab group (or new region) to the right, left, below or above. Move D3 into a tab group
to the right.
By the way, this can also be done with any other items you open, be it your list of codes, a memo, or a network. But we well
get to this later. Let's look at the loaded document D3 with the margin area on the right-hand side.
Display Of Coded Document With Margin Area
The margin area displays the coded segments that consist of a quotation and a linked code. In the figure below one coded
segment is selected and its quotation is highlighted in context.
ATLAS.ti 8 Windows – Quick TourFIRST STEPS 14
Figure 20: Coded document with margin area
Further, you see a memo that is linked to a quotation and a hyperlink. Hyperlinks are quotation-quotation links, which we will
look at more closely on page 25 : “Creating Hyperlinks“.
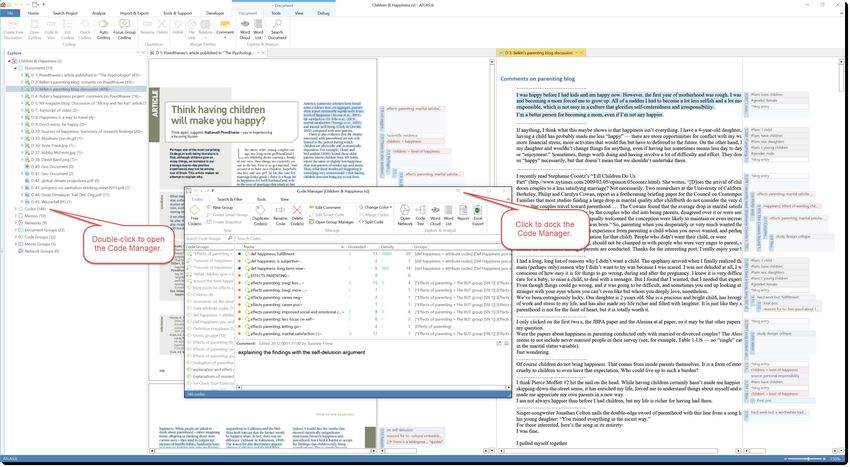
Next, open the Code Manager: The easiest way is to double-click on the main Codes branch in the Project Explorer on the
left-hand side. Another option is to double-click the Codes button in the H OME tab. The Code Manager opens as docked
window. If not, dock the window to the currently active tab, see Figure 21).
Figure 21: Exercise working with tabs, tab groups, docked and floating windows
Next, move D3 back to the left tab: Click on the down arrow of the D3 tab and select: M OVE TO TAB GROUP / L EFT.
Next, we want to open a memo. Move the cursor to the navigation panel on the left-hand side of your screen and open the
memo sub tree.
ATLAS.ti 8 Windows – Quick TourFIRST STEPS 15
Figure 22: Memo sub tree in project explorer
Load the first memo “**Types of memos” with CTRL+ DOUBLE-CLICK into the main work space (Once version 8.4 is released,
you can open a memo with a double-click. Ctrl+double-click will open the list of linked quotations). Depending on your
setting, it either opens floated or in the first tab group. If it opens floated, dock the window.
Now move it to the bottom of the page: Click on the down arrow and select NEW T AB GROUP / B ELOW. Play around some
more with opening items from the project explorer and move them to new tabs or between tabs.
Figure 23: Individualize your work space so that it suits your needs
ATLAS.ti 8 Windows – Quick TourCREATING A NEW PROJECT 16
Creating A New Project
In the following, it is shown how to create a new project and how to add documents. You can use this project for the
exercises on coding, on how to create groups and work with comments and memos. For all subsequent exercises, we however
recommend to work with the provided sample project.
Figure 24: Create a new project
To create a new project, click on FILE to open the backdrop menu.
Select NEW. Click on the button: CREATE NEW P ROJECT. Enter a project name like “My first project” and click on CREATE.
Video Tutorial ATLAS.ti 8 Windows Creating a New Project
Adding Documents
To add documents, click on the ADD DOCUMENTS button in the H OME tab, or click on the dialog box launcher (drop-down
arrow).
Figure 25: Removing documents from a project
ATLAS.ti 8 Windows – Quick TourCREATING A NEW PROJECT 17
If you click on “Add Documents” you can select individual files. If you want to add entire folders or link larger multimedia files
(audio / video) to your project, click on the dialog box launcher. All documents that you add to a project are copied and
become internal ATLAS.ti files.
As audio and video files can be quite sizable, you have the option to link them instead. This means they remain at their
original location and are accessed from there. Preferably, these files should not be moved to a different location. If the files
need to be moved, you need to re-link the files to your project. ATLAS.ti will alert you, if it can no longer access the files.
All added documents are numbered consecutively starting with D1, D2, D3 and so on.
This Quick Tour focuses on working with text files. Shortly we will also make available other sample projects that show
you how to work with audio/video and Geo documents.
Video Tutorial: ATLAS.ti 8 Windows - Adding Documents to the Project
Removing / Deleting Documents From A Project
If you accidentally have added documents or want to remove them from your project for other reasons, you can select one
or more documents in in the Project Explorer on the left-hand side, right-click and select the DELETE option from the
context menu, or open the Document Manager, select one or more documents and select the DELETE DOCUMENT (S) button
on the H OME tab.
In the Document Manager, select the documents that you want to remove and click on the D ELETE DOCUMENT ( S) button.
You will not be asked for confirmation.
If you delete a document by mistake, you can always use the U NDO option in the Quick Access tool bar.
Figure 26: Deleting multiple documents in the Document Manager
After deleting documents, the consecutive numbering may be off.
To renumber documents in consecutive order again, select the U TILITIES tab in the Document Manager and the R ENUMBER
DOCUMENTS option.
Figure 27: Renumbering
Documents Saving Projects
To save a project, click on the Save icon in the Quick Access tool bar (see left), or select FILE / SAVE .
ATLAS.ti projects and all documents that you add to a project are stored in the application folder on your computer. The
Windows application folder is called: AppData and can be found under your user account's home folder.
AppData\Roaming is a system folder and not meant for user access. Files in this folder cannot be used outside
ATLAS.ti.
To change the default location for storing ATLAS.ti data, see the chapter “Switching Libraries” in the full manual.
ATLAS.ti 8 Windows – Quick TourCREATING A NEW PROJECT 18
Project Backup And Transfer
To create a backup of your project or a version that you can transfer to a different computer, select FILE / EXPORT.
Figure 28: Project export
Click on the P ROJECT BUNDLE button. This opens the Windows File Manager. Select a location for storing the project bundle
file.
The default name of the bundle is the project name. You can rename the bundle file at this stage. However, please note
– renaming the bundle does not automatically change the name of your project. Think of the project bundle file like a box
that contains your project. Putting a different label on the outside of the box does not change anything that is inside,
which is your project with all your coded segments, comments, memos, networks, etc. and all of the documents that
have been added to it.
The project bundle file can be used as project backup and to transfer your project to a different computer. It can be read by
both ATLAS.ti 8 Windows and ATLAS.ti Mac 1.5 and later.
Video Tutorials:
• ATLAS.ti 8 Windows - Exporting the Project
• ATLAS.ti 8 Windows - Transfer from ATLAS.ti 7 to ATLAS.ti 8
Starting Data Analysis
We recommend that for the following exercises you work with the sample project: Children & Happiness sample (stage 1). It
contains 1 PDF document, 4 Word documents and 2 images. It can be downloaded here. Or visit our website: sample projects.
Importing The Stage 1 Project
After you downloaded the project, Select FILE / NEW / IMPORT P ROJECT BUNDLE
Select the stage 1 project you just downloaded and open it.
There is no need to rename the project for this exercise. Just click IMPORT.
ATLAS.ti 8 Windows – Quick TourSTARTING DATA ANALYSIS 19
Figure 29: Import Project Bundle Dialogue
Organizing Project Data
Often data come from different sources, locations, respondents with various demographic backgrounds etc. To facilitate the
handling of the different types of data, they can be organized into document groups. Document groups allow quick access to
subsets of your data. They can be used for analytic comparisons in later stages of the analysis, or for administrative purposes
in team projects by for instance creating a group that contains all documents for coder 1, another group that contains the
documents for coder 2 and so on.
Depending on your data, you may want to include a comparison of different groups based on categories such as gender,
profession, age, income, location, as well as data types and sources. In ATLAS.ti a single document can be a member of
multiple groups. For instance: "Gender: female" / "Profession: teacher" / "Age group: 31 - 40", and so on. When querying
data, you can combine the various groups as needed.
Groups can be created in two ways – you can create them in the side panel of the Document Manager, or in the Document
Group Manager. Both options are explained below.
Video Tutorial: ATLAS.ti 8 Windows - Grouping the Project Documents
Crea ti ng Do cument Gro ups In The Do cument Ma na ger
Open the Document Manager with a click on the D OCUMENTS button in the H OME tab.
Hold down the CTRL-key to select documents D1 and D5, then drag-and-drop the selected documents into the side panel
on the left."
Figure 30: Creating document groups in the Document Manager
As name of the document group enter “Academic articles” and click CREATE or ENTER .
ATLAS.ti 8 Windows – Quick TourSTARTING DATA ANALYSIS 20
Next create a group for D2, D3, and D4 and call it “blog data”. And a third group “images” for D6 and D7.
As mentioned above, the document groups can be used to easily access sub sets of your data. Click for instance on the group
“blog data”. This filters the list of all documents and the only ones that remain in the list are the documents from the
selected group:
Figure 31: Filtering by document group
Once a group has been set as filter, a yellow bar appears above the list of documents. To reset the filter to see all documents
again, click the X on the right-hand side of the yellow bar.
Crea ti ng Gro ups In The Gro up M ana ger
To open the Document Group Manager, select the H OME tab. Click on the drop-down for documents and select DOCUMENT
GROUPS.
Figure 32: Adding documents to a document group
In the Group Manager, select the button New Group and enter a name.
Next select documents on the right-hand side in the pane: 'documents not in group' and move them to the left-hand side
'documents in group'. You can either double-click each document that you want to move, or you highlight multiple
documents and click on the button with the left arrow ().
Del eti ng A Gro up
Select a group in the group manager and click on the D ELETE button in the ribbon.
ATLAS.ti 8 Windows – Quick TourSTARTING DATA ANALYSIS 21
Exploring The Content Of Text Documents
Crea ti ng Wo rd Clo uds And Wo rd Li s ts
A quick way to get a feeling for the content of a text document is by creating a word cloud or list.
To create a word cloud or list for just one document, right-click on a text document in the navigation panel and select the
option W ORD CLOUD / WORD LIST.
Figure 33: Word Cloud for one document
The Word Cloud tool bar provides several options like spiral or typewriter view, various sorting option when in typewriter
view, and a slider for limiting the number of words that are shown by frequency of occurrence.
Figure 34: Word Cloud options
You can set the threshold to see every word that occurs at least 1 time, or higher to for instance only show words that occur
at least 5 or 10 times. Words that should not be counted can be excluded. For this you need to create a stop list first and
select it. See the program manual for a more detailed description.
Video Tutorial: ATLAS.ti 8 Windows - Word Clouds
To create a word cloud or word list of multiple documents, open the Document Manager with a click on the D OCUMENTS
button in the HOME tab.
Select one or more documents – document groups as filters come in handy here as well – and select the Word Cloud or
Word List option in the ribbon.
ATLAS.ti 8 Windows – Quick TourSTARTING DATA ANALYSIS 22
Figure 35: Creating a word cloud or list based on multiple documents
Figure 36 shows an example of a word list report. The DETAIL view gives you a separate count per document. In addition you
can select to see relative percentages in addition to the absolute counts.
Figure 36: Word lists for selected documents
The Excel export offers the following options:
Figure 37: Excel export for word lists
ATLAS.ti 8 Windows – Quick TourSTARTING DATA ANALYSIS 23
Reading Data, Noticing And Marking Interesting Things
Based on the word cloud, you get a first impression of what words have been used by your respondents or by the writer of a
report. However, in most cases this does not replace a more detailed reading of the text. Meaning is often hidden between
the lines. Thus, a next step is to become more familiar with your data. If you have been transcribing audio recordings
yourself, you are probably already quite familiar with the text and might be able to begin with coding the data right away. We
would like to invite you to follow the next exercise nonetheless, as it will introduce an important feature of ATLAS.ti – the
quotation level.
Creating Quotations
The quotation level in ATLAS.ti is a unique feature, which not only facilitates interpretive approaches much better than other
programs, but also adds functionality that is interesting for a broad range of analytical approaches like working with
hyperlinks.
If not already open, please open the Children & Happiness (stage 1) sample project. The focus of this exercise is on the
technical aspects to show you the necessary mouse clicks that you need to know.
D1 should still be open from the last exercise. If not, please open it, e.g. from the navigator panel on the left.
Next, open the Quotation Manager (click on the H OME tab, click on the button QUOTATIONS ). The Quotation Manager opens
floating. Dock it and move it to a new tab group to the right, so that you can see the document and the Quotation
Manager side-by-side.
Click on the D1 document tab, so that it becomes the active tab. The ribbon on top should automatically change and
display the contextual D OCUMENT ribbon. If this is not the case, click on the Document tab.
Figure 38: Document and Quotation Manager loaded in two regions next to each other
If you need more space on your screen, close the navigator on the left-hand side of your screen.
Start reading the article and highlight a passage that you find interesting—just like marking something with a highlighter
when you read a journal article.
To make your "marking" permanent in ATLAS.ti, we need to create a quotation.
After highlighting something in the document, several buttons in the ribbon have become active. Select the first option:
CREATE FREE QUOTATION .
ATLAS.ti 8 Windows – Quick TourSTARTING DATA ANALYSIS 24
Figure 39: Create a new quotation without having to code immediately
You will now see a first entry in the Quotation Manager.
Click on it to preview the content of the quotation in the preview area.
Next to this area, you see a comment field. Write some text into the comment field.
Figure 40: Quotation Manager with preview area and comment field
Please note on your screen, as soon as you work inside the Quotation Manager, the active tab in the ribbon changes to
Q UOTATIONS . Among other options, you find an option to rename quotations. By default, the quotation name consists of the
first 60 characters of the selected text. For all other media types, the document name is used).
Notice, for instance, that the first sentence in the article can best be understood as a hook. Rename the quotation by
right-clicking and selecting the option RENAME . Change the default name to “hook for article”. You can read the quotation
in full length in the preview field.
Add a few more quotations, write comments and rename the quotations so that the new name reflects a summary of the
content (cf. Figure 41).
ATLAS.ti 8 Windows – Quick TourSTARTING DATA ANALYSIS 25
Figure 41: Renaming quotations to summarize the content, add first interpretations into comments
Each quotation has an ID which consists of the document number and a number that indicates the chronological order when
a quotation was created. Thus, quotation 1:4 was created after quotation 1:3, and quotation 1:3 after quotation 1:2 and so on.
Further towards the right, you find a column with the start and stop position for each quotation. The density is still 0 for all
quotations as 'Density” indicates the number of codes linked to a quotation.
When the list of quotation gets longer and longer and you are looking for a particular quotation—a fully coded project may
have hundreds, if not thousands of quotations—you can use the search field on top of the quotation list.
If you want to save screen space and you are not yet coding your data, you can hide the 'Codes' column in the Quotation
Manager: Select V IEW and deactivate CODES .
Figure 42: Hiding the side panel in the Quotation Manager
Video Tutorial: ATLAS.ti 8 Windows - Creating Quotations
Creating Hyperlinks
A hyperlink is a named linked between two quotations. If, for instance, you notice that one statement in a report or interview
is explaining a previous statement in a bit more detail, you can link the two using the relation “explains.” Or you may find a
contradictory or supporting statement. These are just a few of the default relations that come with the software. If they do
not fit what you want to express, you can create user-defined relations in the Relation Manager (H OME tab / L INKS button /
R ELATIONS from the drop down menu).
ATLAS.ti 8 Windows – Quick TourSTARTING DATA ANALYSIS 26
Figure 43: Relation Manager for Hyperlinks
To create a hyperlink, you can simply drag and drop one quotation on top of another in the Quotation Manager or in the
margin area. Or you select a quotation in the Quotation Manager, click on the L INK S OURCE button in the ribbon, select
another quotation and click on the L INK T ARGET button in the ribbon. Figure 44 shows the drag & drop option.
Figure 44: Linking two quotations via drag & drop in the Quotation Manager
Practice linking the quotations you already have created.
You will see some symbols being added to the Quotation Id:
Figure 45: List of commented and hyperlinked quotations
Here is what they indicate:
ATLAS.ti 8 Windows – Quick TourSTARTING DATA ANALYSIS 27
Symbol Explanation
~ Quotation has a comment
< Quotation is source of a hyperlink
> Quotation is target of a hyperlink
Quotation is both start and target, thus at least two other quotations are linked
Now look at the margin area; there you also see the hyperlinks that you just have created:
Figure 46: Display of quotation and hyperlinks in the margin area
Just one last exercise before we turn to coding data segments:
Everything you do in ATLAS.ti can be visualized in networks. This applies to anything, whether it is creating hyperlinks,
coding data, linking memos, adding entities to a group, etc.
Let us now see how the hyperlinks you have created look in a network:
Go back to the Quotation Manager. If you have a quotation that is source and target, select this quotation (if you do not
have such a quotation, select any other).
Now select the OPEN NETWORK button in the Quotation . Your network might look similar to the one shown in Figure 47.
Figure 47: Network based on the created hyperlinks
ATLAS.ti 8 Windows – Quick TourSTARTING DATA ANALYSIS 28
Networks can also be created within the graphical interface and you have several further options, some of which will be
shown later, in the section on networks. At this point, we would like to point out an additional benefit of the renaming
options for quotations. As the names are displayed in a network, it allows you to create meaningful and easy to understand
models of your data. 'The hook for the article' 'guiding questions' 'worse than expectations....'
and this is discussed by quotation [1:2] 'consistent evidence of negative correlation...'
Coding Data
In this section, we show you to code texts and images. You can continue to work with the currently open Children &
Happiness (stage 1) project. Open document D3: Parenting blog_reader comments. If the document ribbon is not on top, click
on the Document tab.
Figure 48: The Document tab offers all options that you need for coding
Creating And Applying Codes
Use your mouse to highlight the first sentence beginning with "I was happy before I had kids...."
Next, click on the OPEN CODING button in the Document ribbon. As name enter “same level of happiness” and click CREATE . It
is also possible to code a selection with multiple codes. You can enter as many codes as apply (see Figure 42).
Figure 49: Open Coding dialogue
An alternative is to right-click on the highlighted section and to chose OPEN CODING from the context menu (see Figure 50).
ATLAS.ti 8 Windows – Quick TourCODING DATA 29
Figure 50: Coding a text segment using the context menu
The coded segment is displayed in the margin area. A bar marks the size of the coded segment (= quotation) and the code
name appears next to it. When coding data in this way, a new quotation is created automatically and the code is linked to
this quotation.
Figure 51: Margin display of coded data segment
Next, highlight the remaining part of the paragraph starting at "However...," and ending with "... irresponsibility." Here
three issues can be coded. Click on the OPEN CODING button again and enter three codes:
• parenting is hard work
• effects of parenting
• narcissistic culture
When you are done entering code names, click on the CREATE button. The margin area now looks like this:
Figure 52: Display of codes and quotations in the margin area
The work you have done so far also is visible in the Project Explorer on the left.
Take a look at the Project Explorer and open the sub trees for D3 and for codes:
ATLAS.ti 8 Windows – Quick TourCODING DATA 30
Figure 53: The Project Explorer after some codes have been created and linked
The numbers behind the quotations 3:1 and 3:2 indicate the start and end positions in the document by number of
characters. The numbers behind the codes (1-0) mean that the code has been applied 1 time (grounded = 1) and that it has
not yet been linked to other codes (density = 0). The density remains 0 until the researcher manually links codes to other
codes, mostly in later stages of the analysis if relationships between codes become apparent. The density is not a value that
is calculated by the software. It goes up, when the researcher begins to link codes to each other (see “Working With
Networks And Links “ on page 49).
Video Tutorial: ATLAS.ti 8 Windows - Coding text documents
Coding PDF Files
PDF files can be text or image files. Sometimes users accidentally add an image PDF and wonder why they cannot select any
text. If this happens but you want to be able to select text, you need to re-create the PDF file, e.g. by letting an OCR scanner
running over your PDF image file. In a lot of PDF creators these days this is an option in the software, no additional physical
scan is needed.
A text PDF file can contain images and in ATLAS.ti you can select and code both text and images within the same document.
If you want to code text, select the text just like you do in a Word file.
If you want to code an image within a PDF file, draw a rectangular area with your mouse, just as if you would code an
image (see “Coding An Image“ on page 36). Document 1 is a PDF document. Try it out.
Video Tutorial: ATLAS.ti 8 Windows - Coding Audio and Video Documents
Applying Existing Codes
Now, we would like to invite you to continue for a few minutes to code the document. If you come across a passage that you
would like to code with an already existing code, you can link one of the existing codes either via drag & drop from the Project
Explorer, or you open the Code Manager as shown before. Dock The Code Manager into a new tab group to the right.
As shown in Figure 55 you can either drag & drop a code from the navigator on the left-hand side onto a highlighted data
segment, or from the Code Manager.
Figure 54: Open code list in If you use the navigator on the left for coding, we recommend that you open just the list of codes. In order to do this, click on
navigator
Codes in the ribbon (see left). The code list has has a search field, which makes it easier to navigate if your code list gets
longer. You can also select multiple codes by holding down the Ctrl-key.
ATLAS.ti 8 Windows – Quick TourYou can also read