High-fat diet-induced obesity and impairment of brain neurotransmitter pool
←
→
Page content transcription
If your browser does not render page correctly, please read the page content below
Translational Neuroscience 2020; 11: 147–160
Research Article
Ranyah Shaker M. Labban, Hanan Alfawaz, Ahmed T. Almnaizel, Wail M. Hassan,
Ramesa Shafi Bhat, Nadine MS Moubayed, Geir Bjørklund, Afaf El-Ansary*
High-fat diet-induced obesity and impairment of
brain neurotransmitter pool
https://doi.org/10.1515/tnsci-2020-0099 dopamine and glutamate as well as significantly low
received February 18, 2020; accepted March 12, 2020 levels of serotonin were found in the obese group
Abstract: Obesity and the brain are linked since the compared to those in the lean group (P > 0.001) and
brain can control the weight of the body through its were discussed in relation to the biochemical profile in
neurotransmitters. The aim of the present study was to the serum. It was also noted that the HFD affected
investigate the effect of high-fat diet (HFD)-induced bacterial gut composition in comparison to the control
obesity on brain functioning through the measurement group with gram-positive cocci dominance in the control
of brain glutamate, dopamine, and serotonin metabolic group compared to obese. The results of the present
pools. In the present study, two groups of rats served as study confirm that obesity is linked to inflammation,
subjects. Group 1 was fed a normal diet and named as oxidative stress, dyslipidemic processes, and altered
the lean group. Group 2 was fed an HFD for 4 weeks and brain neurotransmitter levels that can cause obesity-
named as the obese group. Markers of oxidative stress related neuropsychiatric complications.
(malondialdehyde, glutathione, glutathione-s-trans- Key words: dyslipidemia, gut microbiota, inflammation,
ferase, and vitamin C), inflammatory cytokines (inter- obesity, oxidative stress, synaptopathy
leukin [IL]-6 and IL-12), and leptin along with a lipid
profile (cholesterol, triglycerides, high-density lipopro-
tein, and low-density lipoprotein levels) were measured
in the serum. Neurotransmitters dopamine, serotonin, 1 Introduction
and glutamate were measured in brain tissue. Fecal
samples were collected for observing changes in gut It is unquestionable that obesity continues to increase
flora. In brain tissue, significantly high levels of worldwide. Recently, the prevalence of obesity was
found to be threefold higher than in the last 40 years.
In 2018, the World Health Organization (WHO) reported
* Corresponding author: Afaf El-Ansary, Central Laboratory, Female that globally 39% of the adults are overweight (body
Centre for Scientific and Medical Studies, King Saud University, mass index [BMI] ≥ 25 kg/m2) and 13% are obese (BMI ≥
Riyadh, Saudi Arabia, e-mail: afafkelansary@gmail.com, 30 kg/m2) [1]. Research has shown that obesity increases
tel: +966-508462529, fax: +966-11-4682184
the risk of developing metabolic illnesses [1,2] and
Ranyah Shaker M. Labban: Department of Food Science and
Nutrition, College of Food and Agriculture Sciences, King Saud
disturbs brain structure and function [3–5]. For instance,
University, Riyadh, Saudi Arabia; Ministry of Health, General it is known that regional cerebral blood flow is
Administration of Nutrition, Riyadh, Saudi Arabia decreased in individuals with obesity, particularly in
Hanan Alfawaz: Department of Food Science and Nutrition, College prefrontal brain regions that are involved in cognitive,
of Food and Agriculture Sciences, King Saud University, Riyadh, attention, and decision-making functions [6]. In addi-
Saudi Arabia
tion, obesity is associated with impaired gray and white
Ahmed T. Almnaizel: Prince Naif for Health Research Center, King
Saud University, Riyadh, Saudi Arabia matter due to inflammation [7]. For most neurotrans-
Wail M. Hassan: Department of Biomedical Sciences, University of mitters, only a small amount of the total stored pool is
Missouri-Kansas City School of Medicine, Missouri, USA released with each nerve stimulation; nonetheless, it
Ramesa Shafi Bhat: Biochemistry Department, Science College, was interesting to find that obesity is associated with
King Saud University, Riyadh, Saudi Arabia
brain-level molecular changes [8].
Nadine MS Moubayed: Botany and Microbiology Department,
College of Sciences, King Saud University, Riyadh, Saudi Arabia
Dietary forms, mainly for those who prefer fat
Geir Bjørklund: Council for Nutritional and Environmental Medicine, intake, often have been responsible for the increase in
Mo i Rana, Norway body weight and adiposity [9]. High-fat diets (HFDs)
Open Access. © 2020 Ranyah Shaker M. Labban et al., published by De Gruyter. This work is licensed under the Creative Commons
Attribution 4.0 Public License.148 Ranyah Shaker M. Labban et al.
have been used to induce obesity in animals in a model 2 Materials and methods
first termed nutritional obesity and later renamed dietary
obesity [10]. The hormone leptin plays an important role
2.1 Animals and diet
regarding intake of food, and the homeostasis of body
weight is commonly increased in obesity, a condition
A predetermination of sample size calculation was not
known as leptin resistance. Hyperleptinemia is known to
performed. Twelve male Wistar albino rats weighing 100 ±
have a considerable role in the pathogenesis of obesity
20 g, at the age of 4 weeks, were housed individually in
and obesity-related neurological conditions [11]. Pro-
stainless steel cages under controlled environmental condi-
longed presence of glutamate as an excitatory amino
tions of 25℃, 12 h day/night cycle, and a humidity of
acid and reactive oxygen species (ROS) can induce
50% ± 5. Rats were randomly and blindly classified into two
excitotoxicity and oxidative stress, respectively, which
groups of six rats each as follows: Group 1, the control
are two of the major mechanisms responsible for
group had free access to water and standard diet. Group 2,
neuronal damage [12]. Several pieces of evidence have
the obese group was fed with HFD (60% fats) for four
pointed out that excitotoxicity and oxidative stress are
consecutive weeks. Feeding of animals was done under
related in that excitatory events may stimulate the
sterilized controlled conditions at the Experimental and
formation of ROS, which can lead to the release of excitatory
Surgery Animal Laboratory, King Khalid Hospital. TestDiet®
amino acids under any stressful condition. Glutamate
company formula was used to prepare HFD with the help of
receptor agonists are able to induce the formation of ROS.
Prince Naif Health Research Center, King Khalid Hospital,
It is well documented that under normal conditions, leptin
College of Medicine, King Saud University and prepared
regulates glutamate N-methyl-D-aspartate receptors (NMDA-
diet was 60% rich in fat content. At the end of the
R) and provides neuroprotective effects on cells. However,
experiment, animals were anesthetized with 5.0% of
obesity impairs this pathway, and an increase in brain
sevoflurane and 100% oxygen, and the flow rate of
glutamate levels leads to a dysfunction in extrasynaptic
sevoflurane was determined by the following formula:
NMDA-R, a decrease in long-term potentiation, and mito-
flow rate (mL/min) = 0.5 × body weight (g). Blood and
chondrial dysfunctions. Thus, the slow excitotoxicity shown
whole brain tissue samples were collected from all the
in Alzheimer’s disease due to overexcitation of NMDA
animals under study. Fecal samples were also collected
receptors by glutamate can be linked to obesity through
after 2 and 4 weeks from the start of the study from all the
leptin resistance as a risk factor for neurological
animals of each group. The experimental design is
disorders [13,14].
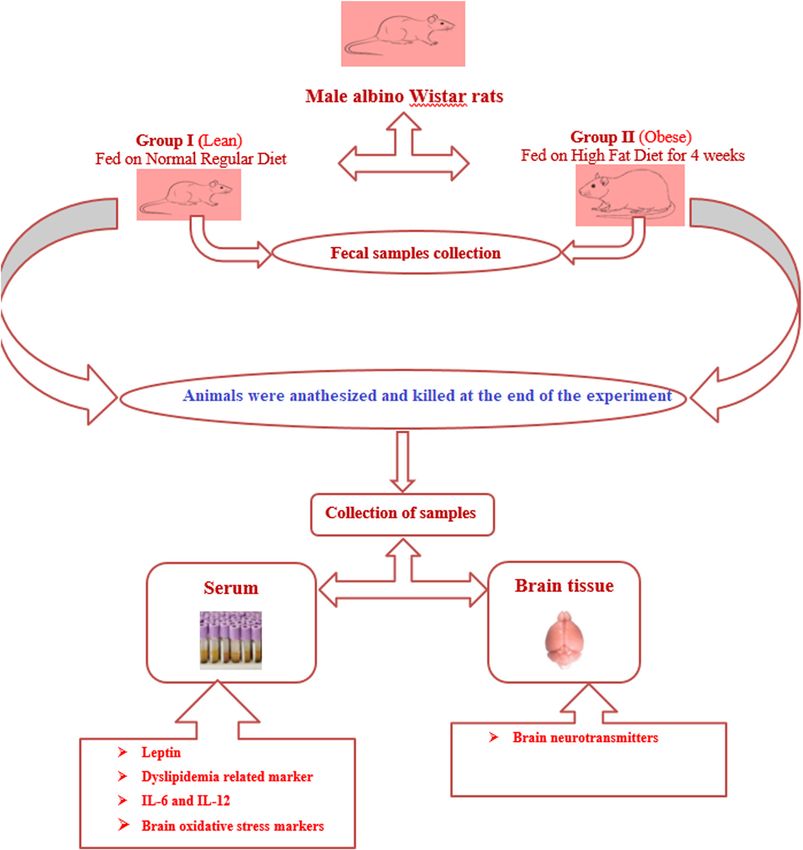
illustrated in Figure 1.
The association between obesity and chronic low-
grade inflammation has been well researched [15]. An
Ethics approval: The research related to animal use has
increase in the circulatory concentrations of numerous
been complied with all the relevant national regulations
cytokines can be observed in obese individuals [15]. Many
and was approved by the Graduate Studies and Scientific
of these proinflammatory molecules are secreted by
Research Ethical Committee of Bioethics at King Saud
adipocytes, and it is hypothesized that enlarged adipose
University, for the care and use of animals.
tissue mass is either directly or indirectly associated with
increased production of proinflammatory cytokines [16].
Significant increases in proinflammatory cytokines, 2.1.1 Measurement of the BMI
including interleukin (IL)-6 and IL-12, were found in
generally obese individuals compared to nonobese ones Body length (nose–anus length) was determined for all
[17]. For cases of central obesity specifically, Schmidt et anesthetized rats. The body weight and body length were
al. reported higher levels of IL-5, IL-6, IL-12, IL-13, and used to determine the BMI using the following equation.
interferon-γ in participants with abdominal obesity Body mass index (BMI) = Body weight (g)/body
compared to those without [17]. In another study, IL-10 length2 (cm2).
was significantly increased, whereas tumor necrosis
factor-alpha and IL-6 decreased, following calorie
restriction [18]. Thus, the use of drugs or specific 2.1.2 Collection of samples
bioactive food components with anti-inflammatory
properties may help to reduce the inflammatory state Blood sample was collected by direct cardiac puncture in
associated with obesity and overcome leptin resistance, a plane tubes without anticoagulant. It was centrifuged at
especially at the hypothalamus. 1,100 × g for 10 min to separate blood serum. The collectedObesity and brain neurochemistry 149
Figure 1: Flow chart of the study design and experimental procedure.
serum samples were immediately stored at −80℃ until use. clear supernatant was gathered and used for the
Whole brain was collected, washed, dissected to small measurements of neurotransmitters as described
pieces, and immediately stored at −80℃ deep freezer until subsequently.
further use. Feces were collected from both groups after 2
and 4 weeks.
2.1.4 Leptin and dyslipidemia-related markers
2.1.3 Preparation of brain tissue homogenates Leptin in serum was estimated with a quantitative
sandwich ELISA kit from MyBioSource. Quantitative
After collection, the brain tissue was washed using cold estimations of cholesterol, triglycerides, high-density
normal saline and homogenized in ten volumes/weight lipoprotein (HDL), and low-density lipoprotein (LDL)
of phosphate-buffered saline (PBS). Then, the homo- were calculated with kits from United Diagnostics
genate was centrifuged at 1,500 × g for 10 min, and the Industry.150 Ranyah Shaker M. Labban et al.
2.1.5 IL-6 and IL-12 3 day incubation period. The incubation time for all
other culture media was 18–24 h under aerobic condi-
The concentrations of IL-6 and IL-12 in the serum tions at 37℃. The experiment was repeated twice, and
samples were determined using a quantitative sandwich the average number of bacteria per plate was recorded
enzyme ELISA kit from MyBioSource. each time. Gram staining and biochemical tests were
used to identify the bacterial strains.
2.1.6 Oxidative stress markers
The method of Ruiz-Larrea et al. [19] was used to 2.3 Statistical analysis
determine lipid oxidation. An assay of vitamin C was
performed according to the method of Jagota and Dani The results are expressed as mean ± SD. To statistically
[20]. The method provided by Beutler et al. [21] was used compare the results between groups, one-way analysis of
to estimate glutathione (GSH) by utilizing 5,5′-dithiobis variance tests were used. Significance was assigned at the
2-nitrobenzoic acid combined with sulfhydryl com- level of P < 0.05. The receiver operating characteristics
pounds in order to obtain a relatively stable yellow curve (ROC) analysis with the area under the curve (AUC),
color. Glutathione S-transferase (GST) activity was cutoff values, and the degrees of sensitivity and specifi-
determined by the GST-catalyzed reaction between GST city were calculated. We used Pearson moment correla-
substrate, GSH, and 1-chloro-2,4-dinitrobenzene [22]. tion coefficient and multiple regression analysis to
determine the most predictive biomarkers of the three
neurotransmitters, serotonin, dopamine, and glutamate.
2.1.7 Brain neurotransmitters As a first step, we used Pearson correlation to test the
correlation of each of the biomarkers individually with
The concentrations of dopamine and glutamate were each of the neurotransmitters. Next, a multiple regression
determined using a Competitive ELISA kit from model was constructed using the stepwise method. Both
MyBioSource. The concentration of serotonin was deter- Pearson moment correlation coefficient and multiple
mined using the Quantitative Sandwich ELISA kit from regression analysis were performed using IBM SPSS
MyBioSource. version 24 (IBM Corp., Armonk, NY, USA).
2.1.8 Microbiological analyses
3 Results
2.1.8.1 Fecal sample collection and preparation
After collection, fecal matter was homogenized as 1 g in In the present study, animals were fed an HFD
10 mL of 0.1 M, pH 7.2, PBS. The homogenate was composed of saturated fats in addition to coconut oil.
centrifuged at 4,500 rpm and 4℃ for 3 min. Finally, Table 1 demonstrates mean ± SD of weight gain and BMI
1 mL of the resulting fecal supernatant was serially in the two studied groups. We found a significant
diluted four times with a 9 mL solution of sterile difference between the obese and lean rats (P < 0.001).
PBS [23]. While the BMI in obese rats recorded a value of 0.86 ±
0.09 g/cm2, the normal weight group recorded a sig-
nificantly lower value of 0.55 ± 0.04 g/cm2 (P < 0.001).
Table 2 presents the brain levels of serotonin,
2.2 Bacterial enumeration and culturing dopamine, and glutamate in the two groups. It can be
easily observed that compared with lean rats, serotonin
One hundred microliters of each prepared dilution were was significantly lower, and dopamine and glutamate
loaded onto the surface of different culture media, were significantly higher in obese rats compared to lean
including MacConkey plates, nutrient agar (Oxoid) rats (P < 0.003, P < 0.001, and P < 0.001, respectively).
plates, and blood agar plates as well as cycloserine Table 3 demonstrates the IL-12 and IL-6 serum levels
cefoxitin fructose agar (CCFA) plates, a selective medium in the two studied groups. Both inflammatory cytokine
to grow Clostridium bacteria. Anaerobic jars containing levels were much lower in the serum of lean rats (44.14 ±
5% CO2 at 37℃ were used for the CCFA plates with a 6.68 and 84.50 ± 6.22, respectively) compared to obeseObesity and brain neurochemistry 151
Table 1: Weight gain and BMI as measures of obesity in the two studied groups
Parameters Groups Min. Max. Mean ± SD Percent change P valuea
Weight gain Lean 120.00 199.00 152.00 ± 30.83 100.00
HFD-obese 425.00 513.00 458.60 ± 35.66 201.31 0.001
BMI Lean 0.51 0.62 0.55 ± 0.04 100.00
HFD-obese 0.79 1.01 0.86 ± 0.09 156.36 0.001
a
Refers to the significant difference between lean and HFD-induced obese rats.
Table 2: Brain neurotransmitters as measures of synaptopathy in HFD-induced obese rats compared to lean rats
Parameters Groups Min. Max. Mean ± SD Percent change P valuea
Serotonin (ng/mL) Lean 67.00 100.00 77.40 ± 14.50 100.00
HFD-obese 34.00 43.00 39.00 ± 3.67 50.40 0.003
Dopamine (ng/mL) Lean 23.00 49.00 34.60 ± 11.37 100.00
HFD-obese 72.00 105.00 92.40 ± 12.82 167.05 0.001
Glutamate (ng/mL) Lean 22.00 44.00 36.20 ± 8.79 100.00
HFD-obese 55.00 71.00 64.80 ± 6.02 179.00 0.001
Table 3: IL-12 and IL-6 as measure of inflammation in HFD-induced obese compared to lean rats
Parameters Groups Min. Max. Mean ± SD Percent change P valuea
IL-12 (pg/mL) Lean 33.81 50.27 44.14 ± 6.68 100.00
HFD-obese 133.55 161.69 149.11 ± 11.24 237.81 0.001
IL-6 (pg/mL) Lean 77.14 92.47 84.50 ± 6.22 100.00
HFD-obese 269.52 291.11 280.15 ± 8.42 231.36 0.001
a
Refers to the significant difference between lean and HFD-induced obese rats
rats fed an HFD (149.11 ± 11.24 and 280.15 ± 8.42, This irregularity presents as significantly higher cholesterol,
respectively) (P < 0.001). higher triglycerides, remarkably higher LDL, nonsignificantly
Table 4 demonstrates a significant increase in leptin lower HDL, together with higher total/HDL and HDL/LDL
in HFD-induced obese rats (P < 0.001). relative values.
Table 5 demonstrates lipid peroxides (malondialdehyde While lean rats recorded total/HDL and HDL/LDL ratios
[MDA]) as an oxidative stress marker together with GSH, of 1.52 ± 0.28 and 4.62 ± 1.21, respectively, obese rats
GST, and vitamin C as markers of antioxidant capacity. It recorded much higher total/HDL ratios (3.02 ± 0.78)
can be noticed that the four measured variables were concomitant with much lower HDL/LDL ratios (1.15 ±
nonsignificantly different between the two groups. 0.73). A total/HDL of 02 ± 0.78 was observed in obese rats.
Tables 6 and 7 present the occurrence of dyslipi- Figure 2 demonstrates the correlations between all of the
demia in the obese rats compared to lean rats. measured markers, either in serum or in brain homogenates.
Table 4: Leptin in HFD-induced obese rats compared to lean rats
Parameters Groups Min. Max. Mean ± SD Percent change P valuea
Leptin (ng/mL) Lean 0.71 1.09 0.89 ± 0.14 100.00
HFD-obese 3.39 3.57 3.48 ± 0.07 291.011 0.001
a
Refers to the significant difference between lean and HFD-induced obese rats.152 Ranyah Shaker M. Labban et al.
Table 5: Oxidative stress related markers in HFD-induced obese rats compared to lean rats
Parameters Groups Min. Max. Mean ± SD Percent change P valuea
MDA Lean 92.94 126.66 108.95 ± 12.54 100.00
HFD-obese 80.71 114.83 94.97 ± 13.70 87.25 0.131
GSH Lean 103.38 185.99 148.31 ± 36.42 100.00
HFD-obese 154.10 203.86 168.50 ± 20.49 113.61 0.312
GST Lean 0.94 1.88 1.35 ± 0.42 100.00
HFD-obese 0.52 4.17 1.64 ± 1.46 121.48 0.600
Vitamin C Lean 0.03 0.05 0.04 ± 0.01 100.00
HFD-obese 0.02 0.03 0.03 ± 0.00 125.00 0.075
a
Refers to the significant difference between lean and HFD-induced obese rats.
Table 6: Dyslipidemia-related markers in HFD-induced obese rats compared to lean rats
Parameters Groups Min. Max. Mean ± SD Percent change P valuea
CHOL Lean 66.28 85.05 74.26 ± 6.97 100.00
HFD-obese 85.16 211.42 148.00 ± 48.24 199.29 0.026
HDL Lean 42.22 65.73 54.95 ± 8.71 100.00
HFD-obese 22.59 67.32 51.45 ± 17.76 106.37 0.702
LDL Lean 5.10 15.90 11.12 ± 3.89 100.00
HFD-obese 9.84 123.69 65.05 ± 43.59 484.98 0.075
TRIG Lean 125.53 199.87 182.29 ± 31.89 100.00
HFD-obese 208.71 244.18 223.07 ± 14.77 122.37 0.032
a
Refers to the significant difference between lean and HFD-induced obese rats.
Table 7: CHOL/HDL and HDL/LDL as atherosclerotic risk factors in HFD-induced obese rats compared to lean rats
Parameters Groups Min. Max. Mean ± SD Percent change P value a
CHOL∕HDL Lean 1.15 1.75 1.52 ± 0.28 100.00
HFD-obese 2.15 3.77 3.02 ± 0.78 198.68 0.010
HDL∕LDL Lean 2.65 5.91 4.61 ± 1.21 100.00
HFD-obese 0.52 2.29 1.15 ± 0.73 24.95 0.009
a
Refers to the significant difference between lean and HFD-induced obese rats.
It can easily be noticed that serotonin as a brain Through the use of Pearson correlations, leptin
neurotransmitter was negatively correlated with dopa- displayed the highest (inverse) correlation to serotonin
mine and glutamate as brain-related variables. Sero- followed by IL-6 and IL-12. Dopamine and serotonin
tonin also shows negative correlations with inflamma- were inversely correlated, and IL-6, IL-12, and leptin
tory cytokines (IL-12 and IL-6), obesity (leptin and were the most (positively) correlated markers to dopa-
BMI), antioxidant status (GSH), and dyslipidemia- mine and glutamate. To test the predictive power of
related markers (cholesterol, triglycerides, total/HDL), multivariate biomarker profiles, we used stepwise
respectively. multiple regression, which showed that leptin is the
Table 8 and Figure 3 present the ROC curves of all of sole statistically significant predictor of serotonin (R2 =
the measured variables in HFD-induced obese rats. 0.648, p = 3.9185 × 10⁻¹⁰). For dopamine and glutamate,
AUCs, specificity, and sensitivity are clearly presented the statistically significant biomarker profiles were
in the table. composed of IL-6 and GSH (R2 = 0.725, p = 0.043457)Obesity and brain neurochemistry 153
Serotonin Dopamin Glutamate IL12 IL6 Leptin BMI GSH GST VIT C CHOL HDL LD TRIG CHOL/HDL HDL/LDL
Serotonin 1 -0.803 -0.55 -0.781 -0.781 -0.805 -0.612 -0.431 -0.175 0.270 -0.625 0.156 -0.613 -0.361 -0.569 0.486
Dopamin -0.803 1 0.709 0.803 0.832 0.806 0.658 0.446 0.257 -0.261 0.675 -0.226 0.691 0.260 0.584 -0.54
Glutamate -0.55 0.709 1 0.66 0.662 0.646 0.535 -0.111 0.335 -0.067 0.426 -0.322 0.391 0.371 0.514 -0.446
IL12 -0.781 0.803 0.66 1 0.984 0.988 0.852 0.319 0.306 -0.112 0.664 -0.394 0.677 0.258 0.732 -0.665
IL6 -0.781 0.832 0.662 0.984 1 0.982 0.847 0.331 0.296 -0.123 0.695 -0.352 0.701 0.290 0.707 -0.692
Leptin -0.805 0.806 0.646 0.988 0.982 1 0.843 0.334 0.294 -0.133 0.669 -0.388 0.681 0.272 0.71 -0.683
BMI -0.612 0.658 0.535 0.852 0.847 0.843 1 0.300 0.472 0.032 0.601 -0.381 0.585 0.292 0.645 -0.656
GSH -0.431 0.446 -0.111 0.319 0.331 0.334 0.300 1 0.027 -0.236 0.553 0.102 0.562 0.221 0.323 -0.163
GST -0.175 0.257 0.335 0.306 0.296 0.294 0.472 0.027 1 -0.010 0.227 -0.255 0.214 0.157 0.142 -0.310
VIT C 0.270 -0.261 -0.067 -0.112 -0.123 -0.133 0.032 -0.236 -0.010 1 -0.070 0.224 -0.125 0.176 -0.185 -0.027
CHOL -0.625 0.675 0.426 0.664 0.695 0.669 0.601 0.553 0.227 -0.070 1 -0.066 0.973 0.507 0.691 -0.759
HDL 0.156 -0.226 -0.322 -0.394 -0.352 -0.388 -0.381 0.102 -0.255 0.224 -0.066 1 -0.084 0.046 -0.603 0.366
LD -0.613 0.691 0.391 0.677 0.701 0.681 0.585 0.562 0.214 -0.125 0.973 -0.084 1 0.312 0.668 -0.779
TRIG -0.361 0.260 0.371 0.258 0.290 0.272 0.292 0.221 0.157 0.176 0.507 0.046 0.312 1 0.384 -0.186
CHOL/HDL -0.569 0.584 0.514 0.732 0.707 0.71 0.645 0.323 0.142 -0.185 0.691 -0.603 0.668 0.384 1 -0.665
HDL/LDL 0.486 -0.54 -0.446 -0.665 -0.692 -0.683 -0.656 -0.163 -0.310 -0.027 -0.759 0.366 -0.779 -0.186 -0.665 1
Figure 2: Heat map of Pearson’s correlations between all of the measured variables.
Table 8: ROC curve analyses of all parameters for HFD-induced obese rats
Parameters AUC Cut-off value Sensitivity % Specificity % P value 95% CI
Serotonin 1.000 55.000 100.0 100.0 0.009 1.000–1.000
Dopamine 1.000 60.500 100.0 100.0 0.009 1.000–1.000
Glutamate 1.000 49.500 100.0 100.0 0.009 1.000–1.000
IL12 1.000 91.910 100.0 100.0 0.009 1.000–1.000
IL6 1.000 180.995 100.0 100.0 0.009 1.000–1.000
Leptin 1.000 2.240 100.0 100.0 0.009 1.000–1.000
Weight gain 1.000 312.000 100.0 100.0 0.009 1.000–1.000
BMI 1.000 0.705 100.0 100.0 0.009 1.000–1.000
MDA 0.800 102.640 80.0 80.0 0.117 0.494–1.106
GSH 0.680 148.060 100.0 60.0 0.347 0.301–1.059
GST 0.600 0.911 40.0 100.0 0.602 0.219–0.981
Vitamin C 0.840 0.028 80.0 80.0 0.076 0.580–1.100
CHOL 1.000 85.105 100.0 100.0 0.009 1.000–1.000
HDL 0.560 58.545 60.0 80.0 0.754 0.168–0.952
LDL 0.840 29.425 80.0 100.0 0.076 0.544–1.136
TRIG 1.000 204.290 100.0 100.0 0.009 1.000–1.000
CHOL/HDL 1.000 1.950 100.0 100.0 0.009 1.000–1.000
HDL/LDL 1.000 2.470 100.0 100.0 0.009 1.000–1.000
for the former and IL-6, GSH, and triglycerides (R2 = collections, where gram-positive bacteria were over-
0.617, p = 0.027508) for the latter. The coefficients shown whelmed by the overgrowth of gram-negative Clostri-
in Table 9 indicate the dependent variable change for dium and Bacteroides.
each independent variable unit increase.
Table 10 demonstrates the bacterial plate count in
different culture media for lean and HFD-induced obese
rats. Data from the present study indicated that the 4 Discussion
dominant bacterial types in Group 1 (control group) in
the first and second collections were gram-positive The recorded higher BMI in obese rats parallels
cocci, mainly Streptococcus coliforms. Gram-negative the findings of Novelli et al. [24], who reported
bacteria were either entirely absent or present in that BMI in obese rats usually has a value higher than
negligible numbers, and both Clostridium and Bacter- 0.68 g/cm2. This observation is in good agreement with
oides were similarly absent in the control group. the previous work of Picklo et al. [25], which proved the
However, the opposite was true for Group 2, particularly obesogenic effect of a saturated lipid diet in an animal
following the HFD intake in the first and second model.154 Ranyah Shaker M. Labban et al.
Serotonin (ng/ml) Dopamin (ng/ml) Gluta mate (ng/ml)
1.0 1.0 1.0
0.8 0.8 0.8
Sensitivity
Sensitivity
Sensitivity
0.6 0.6 0.6
0.4 0.4 0.4
0.2 0.2 0.2
0.0 0.0 0.0
0.0 0.2 0.4 0.6 0.8 1.0 0.0 0.2 0.4 0.6 0.8 1.0 0.0 0.2 0.4 0.6 0.8 1.0
1 - Specificity 1 - Specificity 1 - Specificity
IL6 (pg/ml) Leptin (pg/ml) IL12 (pg/ml)
1.0 1.0 1.0
0.8 0.8 0.8
Sensitivity
0.6
Sensitivity
Sensitivity
0.6 0.6
0.4 0.4 0.4
0.2 0.2 0.2
0.0 0.0 0.0
0.0 0.2 0.4 0.6 0.8 1.0 0.0 0.2 0.4 0.6 0.8 1.0 0.0 0.2 0.4 0.6 0.8 1.0
1 - Specificity 1 - Specificity 1 - Specificity
Weight gain BMI MDA
1.0 1.0 1.0
0.8 0.8 0.8
Sensitivity
Sensitivity
0.6 0.6
Sensitivity
0.6
0.4 0.4
0.4
0.2 0.2
0.2
0.0 0.0
0.0 0.2 0.4 0.6 0.8 1.0 0.0 0.2 0.4 0.6 0.8 1.0
0.0
1 - Specificity 1 - Specificity
0.0 0.2 0.4 0.6 0.8 1.0
1 - Specificity
CHOL Vit C LDL
1.0 1.0 1.0
0.8 0.8 0.8
Sensitivity
0.6
Sensitivity
Sensitivity
0.6 0.6
0.4
0.4 0.4
0.2
0.2 0.2
0.0
0.0 0.0 0.2 0.4 0.6 0.8 1.0
0.0
0.0 0.2 0.4 0.6 0.8 1.0 1 - Specificity 0.0 0.2 0.4 0.6 0.8 1.0
1 - Specificity 1 - Specificity
TRIG CHOL/HDL HDL/LDL
1.0 1.0 1.0
0.8 0.8 0.8
Sensitivity
Sensitivity
0.6 0.6
Sensitivity
0.6
0.4 0.4
0.4
0.2 0.2
0.2
0.0
0.0
0.0 0.2 0.4 0.6 0.8 1.0 0.0 0.2 0.4 0.6 0.8 1.0 0.0
1 - Specificity 1 - Specificity 0.0 0.2 0.4 0.6 0.8 1.0
1 - Specificity
Figure 3: ROC curve analyses of all parameters for HFD-induced obese rats.
It is well known that dopamine and serotonin play and rodents, including those by Palmiter [28] and
important roles in homeostatic signaling as neurotrans- Halford et al. [29], show that experimental inhibition or
mitters [26,27]. Numerous studies performed in humans stimulation of both transmitters is connected toObesity and brain neurochemistry 155
Table 9: Predictive models of the dependent variables, serotonin, dopamine, and glutamate generated using multiple regression analysis
of 13 independent variables
Dependent R2 of the model Model Independent Coefficient 95% confidence interval
variable (multivariate biomarker significance variables
Lower Upper
profile)
boundary boundary
Serotonin 0.648 3.9185 × 10⁻¹⁰ Leptin −12.861 −15.977 −9.745
Dopamine 0.725 0.043457 IL-6 0.239 0.181 0.296
GSH 0.067 0.002 0.132
Glutamate 0.617 0.027508 IL-6 0.138 0.095 0.182
GSH −0.087 −0.136 −0.039
Triglycerides 0.089 0.01 0.168
Table 10: Bacterial plate count in different culture media for lean and HFD-induced obese rats
Identified group Gram (+ve) cocci (Streptococcus) Gram (−ve) rods Clostridium sp. Bacteroides sp.
strains/ (nutrient agar, and blood agar) (E. coli or other coliforms) (CCFA agar plates) (BBE agar plates)
collection time (MacConkey agar)
Lean first collection 100 1 0 0
90 1 0 0
95 0 0 0
Obese first 0 250 200 >300
collection 0 230 200 >300
0 200 200 >300
210
Lean second 8 0 0 0
collection 6
7
Obese second 0 >300 >300 200
collection 0 >300 >300 180
0 250 280 190
differences in feeding behavior, the stimulus to eat, saturated HFD, as used in the current study, and
energy expenditure, and reward learning. Based on hippocampal dysfunction, including increased neuroin-
these as well as other observations, it can be hypothe- flammation and neurogenesis and synaptic plasticity,
sized that changes in feeding behavior in individuals which can give further support to our findings.
with obesity are a result of alterations in the central The significant increase in brain dopamine in obese
serotonin and dopamine systems [29–31]. rats (Table 2) can be explained by the fact that the
The remarkably lower brain serotonin (5-HT) level in dopamine system has a crucial role with regard to
HFD-induced obese rats reported in the present study hyperphagia, high-energy diets, and obesity develop-
(Table 2) is supported by the recent work of van Galen et ment [34,35].
al. [31], in which a notable decrease in serotonin in The significant increase in brain glutamate reported
obese subjects compared to overweight and lean in the present study is supported by the recent work of
controls using neuroimaging trials was reported. Their Fritz et al. [35], in which it was found that mice fed with
observations bolster the existing neurotransmitter the- an HFD have a focally extended excitatory postsynaptic
ories of distressed feeding behavior in obesity. Apart current, likely due to lowered glutamate buffering
from implications for mental health, 5-hydroxytrypta- (conversion to glutamine or gamma aminobutyric acid
mine (5-HT) receptors also play a significant role in (GABA)) and/or blunted glutamate receptors (NMDA-R),
obesity, which is usually accompanied by depression with much higher glutamate signaling in the brain. In
[32]. Interestingly, Noble and Kanoski [33] reported on evaluating the synaptic function of obese animals within
the relationship between the obesogenic effects of a the dorsal striatum, they observed that obesity is linked156 Ranyah Shaker M. Labban et al.
to changes in glutamate transmission and greatly The ratio between total and HDL cholesterol is
enhanced transmission of dopamine. These research established as a useful lipid atherogenesis indicator, which
results provide a novel insight into how high fat reflects the transport of cholesterol within the arterial intima
consumption affects neural mechanisms and the pos- [41]. Based on the fact that total/HDL and HDL/LDL are
sible role of these mechanisms with regard to exagger- both used as measures of risk factors of cardiovascular
ated nonhomeostatic eating. diseases, we suggest that the obese rats in the present study
The significant increases in IL-6 and IL-12 proin- are at considerable risk (Tables 6 and 7). While lean rats
flammatory cytokines (Table 3) are consistent with the recorded low ratios, obese rats recorded much higher total/
recent work of Yu et al. [36], in which IL-6 was much HDL concomitant with much lower HDL/LDL ratios. A high
higher in the serum and brain of HFD-induced obese total/HDL ratio in obese rats demonstrates a high athero-
rats. In their study, hippocampal inflammatory re- genic risk. This idea is supported by the work of Nam et al.
sponses were enhanced in obese rats, including the [42], in which a total/HDL ratio of 2.1–3.6 was recorded as a
activation of TLR4 and NF-κB, the production of risk factor for chronic heart disease.
proinflammatory cytokines (IL-6), and the activation of LDL is responsible for the transport of cholesterol
microglia and astrocytes. In addition, hippocampal cell into peripheral tissues, while HDLs mediate an inverse
apoptosis and cognitive impairment were observed in transport of cholesterol [43]. The nonsignificant decrease
the HFD-fed rats. This finding can be related to the in HDL in obese rats reported in the present study may
remarkable alterations in serotonin, dopamine, and be related to the antioxidant effect of the coconut oil
glutamate as markers of neuronal damage previously component in our HFD.
discussed in the present study (Table 2). In general, coconut oil ingestion is thought to
The reported significant increase in leptin in HFD- increase HDL [44]. Lauric acid, which accounts for
induced obese rats compared to that in lean rats about 50% of the coconut oil content, is proposed to be
(Table 4) is in good agreement with the previous work the cornerstone of the pathway. Even though lauric acid
of Lin et al. [37], who showed that obesity induced by an is classified as a medium-chain fatty acid (MCFA), 70%
HFD in C57 B1/6J mice may occur in three stages: an of it gets transported as a long-chain fatty acid while
early response to the HFD due to exogenous leptin 30% remains as an MCFA [45]. Thus, the transport of
sensitivity, lowered food intake when leptin production lauric acid happens in two ways in the body. Lauric acid
increases and the brain remains sensitive to leptin, and that is transported to the liver functions as a substrate
finally, an elevated intake of food with reduced central for the production of apoA1 and apoB, both of which
sensitivity to leptin. This observation can also be further contribute to the production of low-density
supported by the most recent work of Mzhelskaya et al. lipoprotein cholesterol (LDL-C) and high-density lipo-
[38], in which it was reported that in HFD-induced protein cholesterol (HDL-C) particles.
obesity, leptin loses its anorexigenic effect on neurons of Research has shown that HDL, in contrast to LDL,
the hypothalamus, consequently increasing appetite and may have an antithrombotic and antiatherogenic func-
fat mass accumulation. tion [46] by protecting LDL from lipid peroxidation as
The concentration of the serum MDA may be a well as reducing the harmful effect of oxidized LDL.
useful indicator of oxidative stress. MDA is one of the Based on this finding, the nonsignificant decrease in
final products in the peroxidation of polyunsaturated HDL as an antiatherogenic molecule can be linked to the
fatty acid by the cell. The concentration of MDA can be presence of coconut oil in the HFD [45].
used as an indicator of cell or tissue damage due to The Pearson correlation coefficient is a statistical
increased lipid peroxidation activity. However, although metric that measures the strength and direction of a
the significant increase in BMI serves as a signal for linear relationship between two or more random vari-
obesity, impairment of neurotransmission, induction of ables [47]. The reported negative correlations between
inflammation, and leptogenesis, obese controls did not serotonin and inflammatory cytokines (IL-12 and IL-6),
show a significant increase in MDA or decrease in GSH, obesity (leptin and BMI), antioxidant status (GSH), and
GST, and vitamin C as antioxidants (Table 5). This result dyslipidemia-related markers (cholesterol, triglycerides,
might be attributed to the addition of coconut oil as an and total/HDL), respectively, can find support in the
inducer of obesity to the high saturated fat diet in our recent work of van Galen et al. [31], who highlighted that
experiment. This prediction is supported by multiple the neuroinflammation and dyslipidemia complications
studies that highlight the antioxidant effects of virgin of obesity may be associated with decreased seroto-
coconut oil [39,40]. nergic signaling.Obesity and brain neurochemistry 157
Additionally, dopamine and glutamate were posi- and dyslipidemia-related markers. This finding parallels
tively correlated with neuroinflammatory cytokines (IL- the recent work of Hernández Bautista et al. [52], which
12 and IL-6), leptin and BMI as markers of obesity, and illustrated the association between glutamate as an
cholesterol as an atherogenic marker (Figure 2). Again, excitotoxic amino acid and obesity-related markers of
this finding can be supported by the work of van Galen inflammation, oxidative stress, and dyslipidemia. The
et al. [31], which reported on the decrease in dopamine reported elevated glutamate is in good agreement with
receptors proportional to BMI in obese individuals. the research findings, which strongly support the
Glutamate, the most dominant excitatory neuro- hypothesis that elevated levels of nutritional glutamate
transmitter in the brain, is involved in nearly all normal are etiologically important in obesity development in
functions of the brain, including memory, learning, and humans [57,58]. In their clinical trial, they were able to
cognition. Monosodium glutamate (MSG), also called treat obesity by protecting the hypothalamic signaling
sodium glutamate, is used as a flavor enhancer in the cascade of leptin action with low to moderate affinity,
food industry. MSG gives a flavor that is impossible to noncompetitive glutamate NMDA-R antagonists that
achieve with other food additives [48–51]. The obtained selectively block the GLU-gated Ca2+ ion channels.
positive correlations between brain glutamate as an Additionally, an HFD disrupts the inhibitory GABAergic
excitatory neurotransmitter and most of the obesity- processes, leading to imbalanced inhibitory/excitatory
related markers in the current study can be supported neurotransmission in the frontal cortex and hippo-
through the recent work of Hernández Bautista et al. campus of rats concomitant with abnormal feeding
[52], in which an MSG-induced obesity model was behavior [59]. This concept suggests that considerable
associated with inflammation and impaired leptin levels. efforts should be devoted to the development of weight-
The AUCs of the measured variables ascertained the control medications that target the brain neurotransmit-
effectiveness of the variables as predictive biomarkers for ters that regulate food intake.
the development of synaptopathy as a complication of Data from the present study indicated that an HFD
HFD-induced obesity (Table 8 and Figure 3). All variables stimulated the overgrowth of Bacteroides, which is in
recorded AUCs of one or near one with satisfactory agreement with other findings that highlighted how
specificity and sensitivity, showing excellent predict- feeding mice an HFD led to a decrease in the abundance
ability, with the exception of GSH, GST, and HDL, which of Firmicutes from 72.1 to 34.5% and a significant
showed poor values, with AUCs between 0.5 and 0.7. increase in the Bacteroides population from 19.8 to
The multiple regression analysis presented in Table 57.1% at the phyla level [60,61].
9 ascertained the relationship between the three In conclusion, the present study illustrated that
measured neurotransmitters and certain obesity-related obesity-related inflammation, oxidative stress, and dys-
markers. We were surprised to find that serotonin was lipidemic processes, originating from either adipose
greatly associated with leptin as an obesity-related tissue or the gut microbiota milieu, can spread to the
hormone (R2 of 0.648). This result is supported by the brain, where they lead to considerable alterations in
previous work of Yadav et al. [53], in which it was neurotransmitter metabolism and activity. Collectively,
reported that leptin controls appetite and energy these alterations contribute to obesity-related neuropsy-
expenditure at least in part through the inhibition of chiatric complications.
serotonin synthesis and release from brainstem neurons.
Moreover, Zou et al. [54] reported on the role of leptin in Acknowledgements: The authors thank the Deanship of
mood disorders, which are traditionally related to a lack Scientific Research for funding and supporting this
of serotonin [55]. Table 9 also demonstrates the research through the DSR Graduate Students Research
contributions of IL-6 and GSH as predictor markers of Support (GSR) initiative. The authors also extend their
inflammatory and oxidative stress in the reported gratitude to the RSSU at King Saud University for their
change of dopamine when used as a dependent variable technical support.
in the multiple regression analysis (R2 of 0.725). This
result is in good agreement with other studies where Funding: This work was supported by the Deanship of
obesity-related inflammatory and oxidative stress condi- Scientific Research through the DSR Graduate Students
tions have been repeatedly connected to alterations in Research Support (GSR) initiative.
reward circuitry and dopamine signaling [30,56]. Gluta-
mate as a dependent variable was affected by IL-6, GSH, Competing interests: The authors declare that they have
and triglycerides as respective inflammatory, oxidative, no competing interests.158 Ranyah Shaker M. Labban et al.
Ethics approval: This work was approved by the ethical J Neurosci. 2015;35(9):3959–65. doi: 10.1523/
committee of the College of Science, King Saud University. JNEUROSCI.4744-14.2015.
[9] James WPT. The epidemiology of obesity: the size of the
problem. J Intern Med. 2008;263(4):336–52. doi: 10.1111/
Consent for publication: All authors read the manuscript
j.1365-2796.2008.01922.x.
and approved its submission. [10] Hariri N, Thibault L. High-fat diet-induced obesity in animal
models. Nutr Res Rev. 2010;3(2):270–99. doi: 10.1017/
Availability of data and material: Data are available S0954422410000168.
upon request. [11] Hristov M, Landzhov B, Nikolov R, Yakimova K. Central, but
not systemic, thermoregulatory effects of leptin are impaired
in rats with obesity: interactions with GABAB agonist and
List of abbreviations: area under the curve, AUC; body antagonist. Amino Acids. 2019;51(7):1055–63. doi: 10.1007/
mass index, BMI; high-fat diet, HFD; glutathione, GSH; s00726-019-02746-x.
glutathione-s-transferase, GST; high-density lipopro- [12] Oh SM, Betz AL. Interaction between free radicals and
teins, HDL; interleukin, IL; low-density lipoprotein, excitatory amino acids in the formation of ischemic brain
edema in rats. Stroke. 1991;22(7):915–21. doi: 10.1161/
LDL; MCFA, medium-chain fatty acid; malondialdehyde,
01.STR.22.7.915.
MDA; MSG, monosodium glutamate; N-methyl-D-aspar-
[13] Ong WY, Tanaka K, Dawe GS, Ittner LM, Farooqui AA. Slow
tate receptors (NMDA-R); PBS, phosphate-buffered excitotoxicity in Alzheimer’s disease. J Alzheimers Dis.
saline; reactive oxygen species, ROS; receiver operating 2013;35(4):643–68. doi: 10.3233/JAD-121990.
characteristics, ROC; World Health Organization, WHO. [14] Lloret A, Monllor P, Esteve D, Cervera-Ferri A, Lloret MA.
Obesity as a risk factor for Alzheimer’s disease: implication of
leptin and glutamate. Front Neurosci. 2019;13:508. doi:
Author contributions: RL acquired the data; HA sug-
10.3389/fnins.2019.00508.
gested the topic; AA carried out feeding trial and animal [15] Hotamisligil MFG, Hotamisligil GS. Inflammatory mechanisms
modeling; WH performed the statistical analysis; RS in obesity. Annu Rev Immunol. 2011;29:415–45. doi: 10.1146/
acquired the data; NM acquired the microbiology data; annurev-immunol-031210-101322.
GB codrafted the manuscript; and AE suggested the [16] Saltiel AR, Olefsky JM. Inflammatory linking obesity and
topic and drafted the manuscript. metabolic disease and metabolic disease. J Clin Invest.
2017;127(1):1–4. doi: 10.1172/JCI92035.
[17] Schmidt FM, Weschenfelder J, Sander C, Minkwitz J,
Thormann J, Chittka T, et al. Inflammatory cytokines in general
and central obesity and modulating effects of physical
References activity. PLoS ONE. 2015;10(3):1–17. doi: 10.1371/
journal.pone.0121971.
[1] WHO, Obesity and overweight fact sheet; 2018. [18] Jung SH, Park HS, Kim KS, Choi WH, Ahn CW, Kim BT, et al.
[2] Mitchell NS, Catenacci VA, Wyatt HR, Hill JO. Obesity: overview Effect of weight loss on some serum cytokines in human
of an epidemic. Psychiatr Clin North Am. 2011;34(4):717–32. obesity: increase in IL-10 after weight loss. J Nutr Biochem.
doi: 10.1016/j.psc.2011.08.005. 2008;9(6):371–5. doi: 10.1016/j.jnutbio.2007.05.
[3] Cherbuin N, Sargent-Cox K, Fraser M, Sachdev P, Anstey KJ. 007.
Being overweight is associated with hippocampal atrophy. The [19] Ruiz-Larrea MB, Leal AM, Liza M, Lacort M, de Groot H.
path through life study. Int J Obes (Lond). 2015;39(10):1509. Antioxidant effects of estradiol and 2-hydroxyestradiol on
[4] Raji CA, Ho AJ, Parikshak N, Becker JT, Lopez OL, Kuller LH, iron-induced lipid peroxidation of rat liver microsome.
et al. Brain structure and obesity cyrus. Bone. 2011;23(1):1–7. Steroids. 1994;59:383. doi: 10.1016/0039-128X(94)90006-X.
doi: 10.1161/CIRCULATIONAHA.110.956839. [20] Jagota SK, Dani HM. A new colorimetric technique for the
[5] Nota MHC, Vreeken D, Wiesmann M, Aarts EO, Hazebroek EJ, estimation of vitamin C using folin phenol reagent. Anal
Kiliaan AJ. Obesity affects brain structure and function-rescue Biochem. 1982;127(1):178–82. doi: 10.1016/0003-2697(82)
by bariatric surgery? Neurosci Biobehav Rev. 90162-2.
2019;108:646–57. doi: 10.1016/j.neubiorev.2019.11.025. [21] Beutler E, Duron O, Kelly BM. Improved methods for
[6] Willeumier KC, Taylor DV, Amen DG. Elevated BMI is determination of blood glutathione. J Lab Clin Med.
associated with decreased blood flow in the prefrontal cortex 1963;61:882–8.
using SPECT imaging in healthy adults. Obesity. [22] Habig WH, Pabst MJ, Jakoby WB. Glutathione S-transferases.
2011;19(5):1095–7. doi: 10.1038/oby.2011.16. The first enzymatic step in mercapturic acid formation. J Biol
[7] Debette S, Wolf C, Lambert JC, Crivello F, Soumaré A, Zhu YC, et al. Chem. 1974;249(22):7130–9.
Abdominal obesity and lower gray matter volume: a Mendelian [23] Zhang Z, Peng X, Li S, Zhang N, Wang Y, Wei H. Isolation and
randomization study. Neurobiol Aging. 2014;35(2):378–86. doi: identification of quercetin degrading bacteria from human
10.1016/j.neurobiolaging.2013.07.022. fecal microbes. PLoS ONE. 2014;9(3):1–5. doi: 10.1371/
[8] Karlsson HK, Tuominen L, Tuulari JJ, Hirvonen J, Parkkola R, journal.pone.0090531.
Helin S, et al. Obesity is associated with decreased μ-opioid [24] Novelli ELB, Diniz YS, Galhardi CM, Ebaid GMX, Rodrigues HG,
but unaltered dopamine D2 receptor availability in the brain. Mani F, et al. Anthropometrical parameters and markers ofObesity and brain neurochemistry 159
obesity in rats. Lab Anim. 2007;41(1):111–9. doi: 10.1258/ [39] Durašević S, Jasnić N, Prokić M, Grigorov I, Martinović V,
002367707779399518. Dordević J, et al. The protective role of virgin coconut oil on
[25] Picklo MJ, Idso J, Seeger DR, Aukema HM, Murphy EJ. the alloxan-induced oxidative stress in the liver, kidneys and
Comparative effects of high oleic acid vs high mixed heart of diabetic rats. Food Funct. 2019;10(4):2114–24. doi:
saturated fatty acid obesogenic diets upon PUFA metabolism 10.1039/c9fo00107g.
in mice. Prostaglandins Leukot Essent Fatty Acids. [40] Famurewa AC, Maduagwuna EK, Folawiyo AM, Besong EE,
2017;119:25–37. doi: 10.1016/j.plefa.2017.03.001. Eteudo AN, Famurewa OA, et al. Antioxidant, anti-inflamma-
[26] Schwartz MW. Central nervous system regulation of food tory, and antiapoptotic effects of virgin coconut oil against
intake. Obesity (Silver Spring). 2006;14(Suppl 1):1S–8S. doi: antibiotic drug gentamicin-induced nephrotoxicity via the
10.1038/oby.2006.275. suppression of oxidative stress and modulation of iNOS/NF-
[27] Tuominen L, Tuulari J, Karlsson H, Hirvonen J, Helin S, ĸB/caspase-3 signaling pathway in Wistar rats. J Food
Salminen P, et al. Aberrant mesolimbic dopamine–opiate Biochem. 2020;44(1):1–10. doi: 10.1111/jfbc.13100
interaction in obesity. Neuroimage. 2015;122:80–6. doi: [41] Kannel WB, Wilson PWF. Efficacy of lipid profiles in prediction
10.1016/j.neuroimage.2015.08.001. of coronary disease. Am Heart J. 1992;124(3):768–74. doi:
[28] Palmiter RD. Dopamine signaling in the dorsal striatum is 10.1016/0002-8703(92)90288-7.
essential for motivated behaviors: lessons from dopamine- [42] Nam BH, Kannel WB, D’Agostino RB. Search for an optimal
deficient mice. Ann N Y Acad Sci. 2008;1129:35–46. doi: atherogenic lipid risk profile: from the Framingham study. Am J
10.1196/annals.1417.003. Cardiol. 2006;97(3):372–5. doi: 10.1016/j.amjcard.2005.08.055.
[29] Halford J, Harrold J, Lawton C, Blundell J. Serotonin (5-HT) [43] Zhang YZ, Zanotti I, Reilly MP, Glick JM, Rothblat GH, Rader DJ.
drugs: effects on appetite expression and use for the Overexpression of apolipoprotein A-I promotes reverse
treatment of obesity. Current Drug Targets. transport of cholesterol from macrophages to feces in vivo.
2012;6(2):201–213, 10.2174/1389450053174550. Circulation. 2003;108(6):661–3. doi: 10.1161/
[30] Volkow ND, Wang GJ, Baler RD. Reward, dopamine and the 01.CIR.0000086981.09834.E0.
control of food intake: implications for obesity. Trends Cogn [44] Santos HO, Howell S, Earnest CP. Coconut oil intake and its
Sci. 2011;15(1):37–46. doi: 10.1016/j.tics.2010.11.001. effects on the cardiometabolic profile-A structured literature
[31] van Galen KA, Ter Horst KW, Booij J, la Fleur SE, Serlie MJ. The review. Prog Cardiovasc Dis. 2019;62(5):436–43. doi: 10.1016/
role of central dopamine and serotonin in human obesity: j.pcad.2019.11.001.
lessons learned from molecular neuroimaging studies. [45] Eyres L, Eyres MF, Chisholm A, Brown RC. Coconut oil
Metabolism. 2018;85:325–39. doi: 10.1016/ consumption and cardiovascular risk factors in humans. Nutr
j.metabol.2017.09.007. Rev. 2016;74(4):267–80. doi: 10.1093/nutrit/nuw002.
[32] Taciak PP, Lysenko N, Mazurek AP. Drugs which influence [46] Navab M, Ananthramaiah GM, Reddy ST, Van Lenten BJ,
serotonin transporter and serotonergic receptors: pharmaco- Ansell BJ, Fonarow GC, et al. The oxidation hypothesis of
logical and clinical properties in the treatment of depression. atherogenesis: the role of oxidized phospholipids and HDL.
Pharmacol Rep. 2018;70(1):37–46. doi: 10.1016/ J Lipid Res. 2004;45(6):993–1007. doi: 10.1194/jlr.R400001-
j.pharep.2017.07.011. JLR200.
[33] Noble EE, Kanoski SE. Early life exposure to obesogenic diets [47] Lee Rodgers J, Alan Nice Wander W. Thirteen ways to look at
and learning and memory dysfunction. Curr Opin Behav Sci. the correlation coefficient. Am Stat. 1988;42(1):59–66. doi:
2016;9:7–14. doi: 10.1016/j.cobeha.2015.11.014. 10.1080/00031305.1988.10475524.
[34] Geiger BM, Haburcak M, Avena NM, Moyer MC, Hoebel BG, [48] Boonnate P, Waraasawapati S, Hipkaeo W, Pethlert S,
Pothos EN. Deficits of mesolimbic dopamine neurotransmis- Sharma A, Selmi C, et al. Monosodium glutamate dietary
sion in rat dietary obesity. Neuroscience. 2009;159(4):1193–9. consumption decreases pancreatic β-cell mass in adult Wistar
doi: 10.1016/j.neuroscience.2009.02.007. rats. PLoS ONE. 2015;10(6):1–14. doi: 10.1371/
[35] Fritz BM, Muñoz B, Yin F, Bauchle C, Atwood BK. A high-fat, journal.pone.0131595.
high-sugar ‘Western’ diet alters dorsal striatal glutamate, [49] Calis IU, Cosan DT, Saydam F, Kolac UK, Soyocak A, Kurt H,
opioid, and dopamine transmission in mice. Neuroscience. et al. The effects of monosodium glutamate and tannic acid on
2018;372:1–15. doi: 10.1016/j.neuroscience.2017.12.036. adult rats. Iran Red Crescent Med J. 2016;18(10):e37912. doi:
[36] Yu M, Huang H, Dong S, Sha H, Wei W, Liu C. High mobility 10.5812/jjm.33235.Review.
group box-1 mediates hippocampal inflammation and con- [50] Ma M, Quan Y, Li Y, He X, Xiao J, Zhan M, et al. Bidirectional
tributes to cognitive deficits in high-fat high-fructose diet- modulation of insulin action by reactive oxygen species in
induced obese rats. Brain Behav Immun. 2019;82:167–77. 3T3-L1 adipocytes. Mol Med Rep. 2018;18(1):807–14. doi:
doi: 10.1016/j.bbi.2019.08.007. 10.3892/mmr.2018.9016.
[37] Lin S, Thomas TC, Storlien LH, Huang XF. Development of high [51] Yan M, Zhu W, Zheng X, Li Y, Tang L, Lu B, et al. Effect of
fat diet-induced obesity and leptin resistance in C57B1/6J glutamate on lysosomal membrane permeabilization in
mice. Int J Obes Relat Metab Disord. 2000;24(5):639–46. primary cultured cortical neurons. Mol Med Rep.
doi: 10.1038/sj.ijo.0801209. 2016;13(3):2499–505. doi: 10.3892/mmr.2016.4819.
[38] Mzhelskaya KV, Shipelin VA, Shumakova AA, Musaeva AD, [52] Hernández Bautista RJ, Mahmoud AM, Königsberg M, López
Soto JS, Riger NA, et al. Effects of quercetin on the neuromotor Díaz Guerrero NE. Obesity: pathophysiology, monosodium
function and behavioral responses of Wistar and Zucker rats glutamate-induced model and anti-obesity medicinal plants.
fed a high-fat and high-carbohydrate diet. Behav Brain Res. Biomed Pharmacother. 2019;111:503–16. doi: 10.1016/
2020;378:112270. doi: 10.1016/j.bbr.2019.112270. j.biopha.2018.12.108.160 Ranyah Shaker M. Labban et al.
[53] Yadav VK, Oury F, Tanaka K, Thomas T, Wang Y, Cremers S, binge-eating disorders. Econ Hum Biol. 2005;3(2):329–37.
et al. Leptin-dependent serotonin control of appetite: tem- doi: 10.1016/j.ehb.2005.04.001.
poral specificity, transcriptional regulation, and therapeutic [58] Valladolid-Acebes I, Merino B, Principato A, Fole A, Barbas C,
implications. J Exp Med. 2011;208(1):41–52. doi: 10.1084/ Lorenzo MP, et al. High-fat diets induce changes in
jem.20101940. hippocampal glutamate metabolism and neurotransmission.
[54] Zou X, Zhong L, Zhu C, Zhao H, Zhao F, Cui R, et al. Role of Am J Physiol Endocrinol Metab. 2012;302(4):E396–402. doi:
leptin in mood disorder and neurodegenerative disease. Front 10.1152/ajpendo.00343.2011.
Neurosci. 2019;13:378. doi: 10.3389/fnins.2019.00378. [59] Sandoval-Salazar C, Ramírez-Emiliano J, Trejo-Bahena A,
[55] Åberg-Wistedt A, Hasselmark L, Stain-Malmgren R, Apéria B, Oviedo-Solís CI, Solís-Ortiz MS. A high-fat diet decreases
Kjellman BF, Mathé AA. Serotonergic “vulnerability” in GABA concentration in the frontal cortex and hippocampus of
affective disorder: a study of the tryptophan depletion test rats. Biol Res. 2016;49:15. doi: 10.1186/s40659-016-0075-6.
and relationships between peripheral and central serotonin [60] Du H, Zhao A, Wang Q, Yang X, Ren D. Supplementation of
indexes in citalopram-responders. Acta Psychiatr Scand. inulin with various degree of polymerization ameliorates liver
1998;97(5):374–80. doi: 10.1111/j.1600-0447.1998.tb10017.x. injury and gut microbiota dysbiosis in high fat-fed obese
[56] Volkow ND, Wang GJ, Tomasi D, Baler RD. The addictive mice. J Agric Food Chem. 2020;68(3):779–787.
dimensionality of obesity. Biol Psychiatry. 2013;73(9):811–8. [61] Salazar N, Neyrinck AM, Bindels LB, Druart C, Ruas-
doi: 10.1016/j.physbeh.2017.03.040. Madiedo P, Cani PD, et al. Functional effects of EPS-producing
[57] Hermanussen M, Tresguerres JAF. A new anti-obesity drug bifidobacterium administration on energy metabolic altera-
treatment: First clinical evidence that, antagonising gluta- tions of diet-induced obese mice. Front Microbiol.
mate-gated Ca2+ ion channels with memantine normalises 2019;10:1809. doi: 10.3389/fmicb.2019.01809.You can also read