The citation advantage of linking publications to research data
←
→
Page content transcription
If your browser does not render page correctly, please read the page content below
The citation advantage of linking publications to research data
                                        Giovanni Colavizza1,2,* , Iain Hrynaszkiewicz3,4 , Isla Staden1,5 , Kirstie Whitaker1,6 , Barbara
                                        McGillivray1,6

                                        1 The Alan Turing Institute, UK.
                                        2 University of Amsterdam, NL.
                                        3 Springer Nature, UK.
                                        4 Public Library of Science, UK.
                                        5 Queen Mary University, UK.
                                        6 University of Cambridge, UK.

                                        * g.colavizza@uva.nl
arXiv:1907.02565v1 [cs.DL] 4 Jul 2019

                                        Abstract
                                        Efforts to make research results open and reproducible are increasingly reflected by journal policies
                                        encouraging or mandating authors to provide data availability statements. As a consequence of this,
                                        there has been a strong uptake of data availability statements in recent literature. Nevertheless,
                                        it is still unclear what proportion of these statements actually contain well-formed links to data,
                                        for example via a URL or permanent identifier, and if there is an added value in providing them.
                                        We consider 531, 889 journal articles published by PLOS and BMC which are part of the PubMed
                                        Open Access collection, categorize their data availability statements according to their content
                                        and analyze the citation advantage of different statement categories via regression. We find that,
                                        following mandated publisher policies, data availability statements have become common by now,
                                        yet statements containing a link to a repository are still just a fraction of the total. We also find
                                        that articles with these statements, in particular, can have up to 25.36% higher citation impact on
                                        average: an encouraging result for all publishers and authors who make the effort of sharing their
                                        data. All our data and code are made available in order to reproduce and extend our results.

                                        Introduction
                                        More research funding agencies, institutions, journals and publishers are introducing policies that
                                        encourage or require the sharing of research data that support publications. Research data policies
                                        in general are intended to improve the reproducibility and quality of published research, to increase
                                        the benefits to society of conducting research by promoting its reuse, and to give researchers more
                                        credit for sharing their work [1]. While some journals have required data sharing by researchers
                                        (authors) for more than two decades, these requirements have tended to be limited to specific types of
                                        research, such as experiments generating protein structural data [2]. It is a more recent development
                                        for journals and publishers covering multiple research disciplines to introduce common requirements
                                        for sharing research data, and for reporting the availability of data from their research in published
                                        articles [3].
                                            Journal research data policies often include requirements for researchers to provide Data Avail-
                                        ability Statements (DAS) in published articles, and the policies of some research funding agencies,
                                        such as the UK’s Engineering and Physical Sciences Research Council (EPSRC), also require that
                                        researchers’ publications include DAS. A DAS provides a statement about where data supporting
                                        the results reported in a published article can be found, whether those data are available publicly
                                        in a data repository, available with the published article as supplementary information, available
                                        only privately, upon request or not at all. DAS can appear in different styles and with different
                                        titles depending on the publisher. They are also known as Data Accessibility Statements, Data
                                        Sharing Statements and, in this study, ‘Availability of supporting data’ and ‘Availability of data

                                                                                                                                            1/18
and materials’ statements. Many journals from multiple publishers mandate the inclusion of DAS
in published articles, and this is increasing as more large publishers have begun to standardize and
harmonize their journal research data policies [4], since 2016 in particular [5]. Consensus also grows at
funding agencies of DAS utility as a means to establish and assess compliance with data policies [6].
Research data policies of funding agencies and journals can influence researchers’ willingness to
share research data [7,8], and strong journal data sharing policies have been associated with increased
availability of research data [9]. However, surveys of researchers have also shown that researchers feel
they should receive more credit for sharing data [10]. Citations (referencing) in scholarly publications
provide evidence for claims and citation counts also remain an important measure of the impact and
reuse of research and a means for researchers to receive credit for their work.
Several studies explored compliance with journal data sharing policies [11–15]. For example,
DAS in PLOS have been found to be significantly on the rise, after a mandated policy has been
introduced, even if providing data in a repository remains a sharing method used only in a fraction
of articles [16]. This is a known problem more generally: DAS contain links to data (and software)
repositories only too rarely [17–19]. Nevertheless there are benefits to data sharing [20–22]. It is
known that, for example, the biomedical literature in PubMed has shown clear signs of improvement
in the transparency and reproducibility of results over recent years, including sharing data [23].
Some previous studies have shown that in specific research disciplines – such as gene expression
studies [24, 25], paleoceanoagraphy [26], astronomy [27] and astrophysics [28] – sharing research data
that support scholarly publications, or linking research data to publications, are associated with
increased citations to papers. However, to our knowledge, no previous study has sought to determine
if providing a DAS, and specifically providing links to supporting data files in a DAS, has an effect on
citations across multiple journals, publishers and a wide variety of research disciplines. Making data
(and code) available increases the time (and presumably cost) taken to publish papers [29], which
has implications for authors, editors and publishers. As more journals and funding agencies require
the provision of DAS, further evidence of the benefits of providing them, for example as measured
through citations, is needed – for funding agencies, publishers, institutions, and researchers.
In this study, we consider DAS in journal articles published by two publishers: BMC and PLOS.
We focus on the PubMed Open Access collection, and assess to what extent authors are complying
with DAS policies. We further study the contents of DAS, by considering three categories: data
available upon request, data available in the paper or supplementary materials, and data made
available via a direct link to it. We assume this last category to be ideal with respect to openness
and reproducibility, and further assess if there is a citation advantage for an article belonging to any
of these categories. This contribution is organized as follows: we first discuss materials and methods,
which are all made available, we then discuss the presence of DAS in the dataset under consideration
and the results of citation prediction. We conclude with a discussion and future perspectives.
Materials and methods
Data
To make this study completely reproducible, we focus only on open access publications and release
all the accompanying code (see Data and Code Availability Section). We use the PubMed Open
Access (OA) collection, up to all publications from 2018 included. 1 We consider both commercial
and non-commercial publications and work from the xml export. Publications without a known
identifier (DOI, PubMed ID, PMC ID or a publisher-specific ID), a publication date and at least one
reference are discarded. The final publication count totals N = 1, 969, 175.
Our analyses focus on a subset of these publications, specifically from two publishers: PLOS
(Public Library of Science) and BMC (BioMed Central). PLOS and BMC were selected for this
study as they were among the first publishers to introduce DAS. Further, all papers published in
the BMC and PLOS journals are open access and available under licenses that enable articles to be
1 https://www.ncbi.nlm.nih.gov/pmc/tools/openftlist. Downloaded using the FTP service in February 2019.
2/18reused, and are both well represented in the PubMed OA collection. Identifying PLOS journals is
straightforward, as they are all named starting with ‘PLOS’, e.g. ‘PLOS ONE’. We identify BMC
journals using an expert-curated list (see footnote 3 below). We further remove review articles and
editorials from this dataset, and are left with a final publication count totalling M = 531, 889 journal
articles. Our full data extraction and processing pipeline is illustrated in Figure 1. 2
Fig 1. Data extraction and processing steps. We first downloaded the PubMed open access
collection (1) and created a database with all articles with a known identifier and which contained at
least one reference (2; N = 1, 969, 175). Next we identified and disambiguated authors of these
papers (3; S = 4, 253, 172) and calculated citations for each author and each publication from within
the collection (4). We used these citation counts to calculate a within-collection H-index for each
author. Our analysis only focuses on PLOS and BMC publications as these publishers introduced
mandated DAS, so we filtered the database for these articles and extracted DAS from each
publication (5). We annotated a training dataset by labelling each of these statements into one of
four categories (6) and used those labels to train a natural language processing classifier (7). Using
this classifier we then categorised the remaining DAS in the database (8). Finally, we exported this
categorised dataset of M = 531, 889 publications to a csv file (9) and archived it (see Data and code
availability section below).
Data availability statements: policies and extraction
On 1 March 2014, PLOS introduced a mandate which required DAS to be included with all publications
and required all authors to share the research data supporting their publications [39]. In 2011 BMC
journals began to introduce a policy that either required or encouraged authors to include an equivalent
section in their publications, ‘Availability of supporting data’ [40], and the number of BMC journals
that adopted one of these policies increased between 2011 and 2015. In 2015 BMC updated and
standardised its policy and all of its journals (more than 250 journals) required – mandated – a DAS
(styled as ‘Availability of data and materials’) in all its publications. This provides sufficient time for
publications in these journals to accrue citations for the analysis. Further, all papers published in
the BMC and PLOS journals are open access and available under licenses that enable the content
and metadata of the articles to be text-mined and analysed for research purposes. We encoded the
dates in which these policies were introduced by the different BMC journals, and the type of policy
2 The processing pipeline, including DAS classification, as well as the descriptive part below were all developed in
Python [30], mainly relying on the following libraries or tools: scipy [31], scikit-learn [32], pandas [33], numpy [34], nltk
[35], matplotlib [36], seaborn [37], gensim [38], beautifulsoup (https://www.crummy.com/software/BeautifulSoup),
TextBlob (https://github.com/sloria/textblob) and pymongo (MongoDB, https://www.mongodb.com).
3/18(that is, DAS encouraged or DAS required/mandated) in the list of journals – which also include
PLOS journals.3
The extraction of DAS from the xml files is straightforward for PLOS journals, while it requires
closer inspection for BMC journals. We established a set of rules to detect and extract statements
from both sets of journals, as documented in our repository. 4 A total of Md = 184, 075 (34.6%)
publications have a DAS in our dataset. We focus this study on DAS provided in the standard
sections of articles according to the publisher styles of PLOS and BMC. While this choice does not
consider unstructured statements in publications that might describe the availability of supporting
data elsewhere, such as sentences in Methods or Results sections of articles, our analysis intentionally
focuses on articles in journals with editorial policies that include the use of a DAS.
Data availability statements: classification
The content of DAS can take different forms, which reflect varying levels of data availability, different
community and disciplinary cultures of data sharing, specific journal style recommendations, and
authors’ choices. Some statements contain standard text typically provided by publishers, e.g. ‘The
authors confirm that all data underlying the findings are fully available without restriction. All
relevant data are within the paper and its Supporting Information files.’ In other cases, the authors
may have decided to modify the standard text to add further details about the location of the data
for their study, providing a DOI or a link to a specific repository. Where research data are not
publicly available, authors may justify this with additional information or provide information on
how readers can request access to the data. In other cases, the authors may declare that the data
are not available, or that a DAS is not applicable in their case.
Table 1. Categories of DAS identified in our coding approach.
Category Definition Example
0 Not available No additional data available (common).
Supporting information is available in the
Data available on request additional files and further supporting data
1
or similar is available from the authors on request
(DOI: 10.1186/1471-2164-14-876).
The authors confirm that all data
Data available with the underlying the findings are fully available
2 paper and its without restriction. All data are included
supplementary files within the manuscript (DOI:
10.1371/journal.pone.0098191).
The authors confirm that all data
underlying the findings are fully available
without restriction. The transcriptome
Data available in a
3 data is deposited at NCBI/Gene Bank as
repository
the TSA accession SRR1151079 and
SRR1151080 (DOI:
10.1371/journal.pone.0106370).
We identified four categories of DAS, further described in Table 1. We use fewer categories
than [16], mainly due to the sparsity of most of them which would impede reliable classification
results. Our four categories cover the most well-represented categories from this study, namely: not
available or ‘access restricted’ (our category 0); ‘upon request’ (our category 1); ‘in paper’ or ‘in
paper and SI’ or ‘in SI’ (our category 2); ‘repository’ (our category 3). We consider category 3 to
3 See https://github.com/alan-turing-institute/das-public/blob/master/dataset/config/journal_list.
csv.
4 During the course of our study Europe PMC improved its tagging and classification of DAS, in their various
styles, which we did not use in our study: http://blog.europepmc.org/2018/11/mapping-out-path-to-data.html.
4/18be the most desirable one, because the data (or code) are shared as part of a publication and the
authors provide a direct link to a repository (e.g. via a unique URL, or, preferably, a persistent
identifier). We manually categorized 380 statements according to this coding approach, including
all statements repeated eight or more times in the dataset (some DAS are very frequent, resulting
from default statements left unchanged by authors) and a random selection from the rest. We used a
randomly selected set of 304 (80%) of those statements to train different classifiers and the remaining
76 statements to test the classifiers’ accuracy. The classifiers we trained are listed below:
• NB-BOW: Multinomial Naı̈ve Bayes classifier whose features are the vectors of the unique
words in the DAS texts (bag-of-words model);
• NB-TFIDF: Naı̈ve Bayes classifier whose features are the vectors of the unique words in the DAS
texts, weighted by their Term Frequency Inverse Document Frequency (TF-IDF) score [41];
• SVM: Support Vector Machines (SVM) classifier [42] whose features are the unique words in
the DAS texts, weighted by their TF-IDF score;
• ET-Word2vec: Extra Trees classifier [43] whose features are the word embeddings in the DAS
texts calculated using the word2vec algorithm [44];
• ET-Word2vec-TFIDF: Extra Trees classifier whose features are the word2vec word embeddings
in the DAS texts weighted by TF-IDF.
TF-IDF is a weighting approach commonly used in information retrieval and has the effect of
reducing the weight of words like the, is, a, which tend to occur in most documents. It is obtained by
multiplying the term frequency (i.e. the number of times a term t appears in a document d divided
by the total number of terms in d) by the inverse document frequency (i.e. the logarithm of the ratio
between the total number of documents and the number of documents containing t).
We experimented with different parameter values, as detailed below:
• Stop words filter (values: ‘yes’ or ‘no’): whether or not we remove stop words from the texts
before running the classifiers. Stop word lists include very common words (also known as
function words) like prepositions (in, at, etc.), determiners (the, a, etc.), auxiliaries (do, will,
etc.), and so on.
• Stemming (values: ‘yes’ or ‘no’): whether or not we reduce inflected (or sometimes derived)
words to their word stem, base or root, for example stemming fishing, fished, fisher results in
the stem fish.
The best combination of parameter values and classifier type was found to be an SVM with no
use of stop words and with stemming, so this was chosen as the model for our subsequent analysis.
Its accuracy is 98.7% on the test set, 100% only considering the 250 top DAS in the test set by
frequency, and the frequency-weighted accuracy is also 100%. The average precision, recall, and
F1-score weighted by support (i.e. the number of instances for each class) are 98.7%, 98.7%, and
98.6%, respectively. The classification report by category is shown in table 2. The retained classifier
was finally used to classify all DAS in the dataset, keeping manual annotations where available.
Table 2. Classification report by DAS category.
Category Precision Recall F1-score Support
0 1.00 1.00 1.00 4
1 1.00 1.00 1.00 20
2 0.98 1.00 0.99 45
3 1.00 0.86 0.92 7
5/18Results
The presence of data availability statements over time
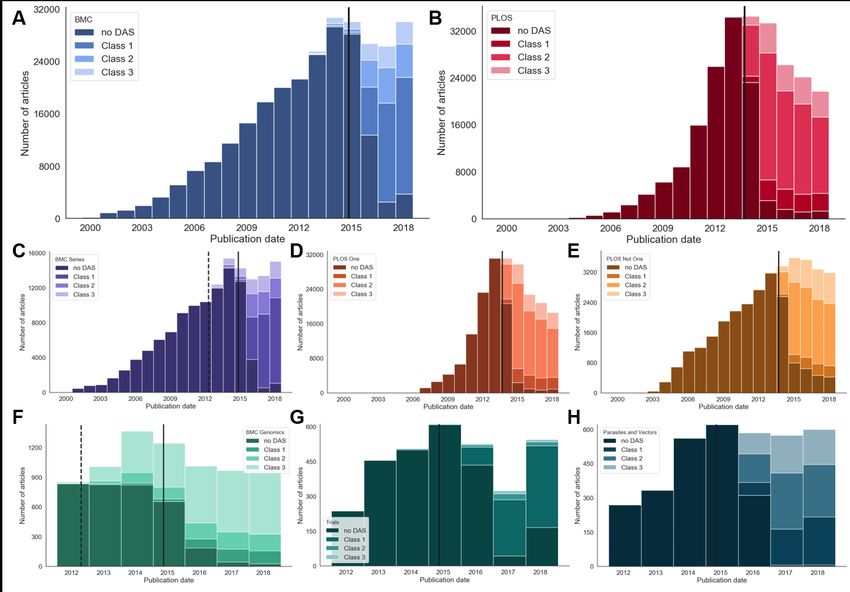
Figure 2A and 2B show the number of articles in the dataset between the years 2000 and 2018
inclusive. The solid vertical lines show when the publisher introduced a DAS mandate (1 May 2015
for BMC, 1 March 2014 for PLOS [39]). BMC journals show a delayed uptake of this policy in
published articles, presumably as it was introduced for submitted manuscripts rather than accepted
manuscripts. The delay accounts for the time these papers would have been undergoing peer review
and preparation for publication at the journals. PLOS journals, in comparison and despite PLOS
announcing its policy would apply to submitted manuscripts also, appear to have put more effort
into early enforcement and therefore have a slightly faster uptake, which may not be accounted for
by average submission to publication times. Both publishers show clear adoption of DAS after their
introduction of a mandate: in 2018 93.7% of 21,793 PLOS articles and 88.2% of 31,956 BMC articles
had data availability statements.
Where the two publishers strongly differ are in the proportion of the different categories of data
availability statements. Looking at the two most recent years in the data set, 2017 and 2018, the
largest category for BMC (60.0% of 54,719 articles with DAS) is category 1: “Data available on
request or similar”. The remaining BMC articles were 19.2% (10,500 of 54,719) category 2 DAS
and 12.2% (6,656 of 54,719) category 3 DAS. Over this same date range, the largest category for
PLOS (65.2% of 43,388 articles) is category 2: “Data available with the paper and its supplementary
files”. The remaining PLOS articles were 14.0% (6,065 of 43,388) category 1 DAS and 20.8% (9,013
of 43,388) category 3 DAS. The overrepresentation of categories 1 and 2 for BMC and PLOS articles
respectively is likely due to the two publishers having different recommendations in their guidance
for authors. For example, 37.3% (40,904 of 109,815) of all PLOS articles which contain a DAS have
identical text: “All relevant data are within the paper and its Supporting Information files”. We
note that although there are an order of magnitude more PLOS ONE articles than those published
in all other PLOS journals (20,6824 compared to 34,336 in our data set) the pattern of DAS classes
are very similar (Figure 2D and 2E). In comparison, the most common DAS (4.8%, 3,594 of 74,260)
for BMC is “Not applicable”, followed by 3.5% (2,582 of 74,260) which have “The datasets used
and/or analysed during the current study are available from the corresponding author on reasonable
request.” These most common statements are, or have been, included as example statements in
guidance to authors, suggesting authors often use these as templates, or copy them verbatim, in their
manuscripts. These statements remain the most common in the latest two years in the dataset (2017
and 2018) at 16.5% (PLOS) and 3.6% (BMC) although the proportions have decreased, hopefully
indicating a more customised engagement with the data availability requirement by authors. BMC,
in 2016, updated its data availability policy including the example DAS statements in its guidance
for authors, in conjunction with other journals published by its parent publisher, Springer Nature.
BMC Series journals were encouraged to include a section on the “Availability of supporting
data” [40] from July 2011. Although the majority of articles published between the encouraged and
mandated dates did not have a DAS, 6.0% (1927 of 31,965) of the articles did include this information
(Figure 2C). Of these articles with encouraged, rather than mandated, DAS, 65.9% of them (1,270
of 1,927) were category 3: “Data available in a repository”. Category 3 DAS are closest to “best
practice” data management recommendations, and it is unsurprising that the authors who elected to
complete this section when they were not required to do so have shared their data in the most usable
manner. Taken together with the most common standard statements described above, we conclude
that mandates are beneficial in increasing the number of data availability statements in published
articles, but note that they do not guarantee ease of access or re-use.
There are differences in the proportion of DAS classes across academic domains. For example,
BMC Genomics shows a strong representation of class 3 DAS during both the encouraged and
required time periods (Figure 2F). In comparison, and unsurprisingly given the sensitive nature of
the data presented in its articles, the journal Trials has a high proportion of class 1 DAS (Figure
2G). We select the journal Parasites and Vectors to illustrate that there are also research topics that
6/18Fig 2. Data availability statements over time. All the histograms above show the number of
publications from specific subsets of the dataset and classify them into four categories: No DAS (0),
Category 1 (data available on request), Category 2 (data contained within the article and
supplementary materials), and Category 3 (a link to archived data in a public repository). The
vertical solid line shows the date that the publisher introduced a mandated DAS policy. A dashed
line indicates the date an encouraged policy was introduced. The groups of articles are as follows. A:
all BMC articles, B: all PLOS articles, C: all BMC Series articles, D: PLOS One articles, E: PLOS
articles not published in PLOS One, F: articles from the BMC Genomics journal (selected to
illustrate a journal that had high update of an encouraged policy), G: articles from the Trials
journal (published by BMC, selected to illustrate a journal that has a very high percentage of data
that can only be made available by request to the authors), H: articles from the Parasites and
Vectors journal (selected to illustrate a journal that has an even distribution of the three DAS
categories). Articles are binned by publication year.
have high variability of DAS classes within them (Figure 2H).
Citation prediction
We focus next on predicting citation counts as a means to assess the potential influence of DAS in
this respect.
Dependent variable. Citation counts for each article are calculated using the full PubMed OA
dataset (N articles above). Citations are based on identifiers, hence only references which include a
valid ID are considered. Under these limits, we consider citations given within a certain time-window
from each article’s publication (2, 3 and 5 years), calculated considering the month of publication, in
order to allow for equal comparison over the same citation accrual time.
7/18Table 3. Summary of variables used in the regression models.
Variable Description Possible transformations
Number of citations received within
n citY a certain number of years Y ln(n citY + 1)
after publication.
Article-level
n authors Number of authors. ln(n authors)
n references tot Total number of references. ln(n ref erences tot + 1)
p year Publication year.
p month Publication month.
Mean H-index of authors at
h index mean ln(h index mean + 1)
publication time.
Median H-index of authors at
h index median
publication time.
das category simple DAS category (0 to 3. See Table 1).
Journal-level
is plos If PLOS (1) or not (0).
If published under an encouraged
das encouraged
DAS mandate (1) or not (0).
If published under a required
das required
DAS mandate (1) or not (0).
Dummy variable,
journal field
from Science-Metrix.
Independent variables. We use a set of article-level variables, commonly considered in similar
studies [45–48]. We include the year of publication, to account for citation inflation over time; the
month of publication (missing values are set to a default value of 6, that is June), to account for the
known advantage of publications published early in the year; the number of authors and the total
number of references (including those without a known ID), both usually correlated with citation
impact.
The reputation of authors prior to the article publication has also been linked to the citation
success of a paper [49]. In order to control for this, we had to identify individual authors, a challenging
task in itself [50–54]. We focus on an article-level aggregated indicator of author popularity: the mean
and median H-index of an article’s authors at the time of publication. In so doing, we minimize the
impact of errors arising from disambiguating author names [55, 56], which would have been higher if
we had used measures based on individual observations such as the maximum H-index. We therefore
used a simple disambiguation technique when compared to current state of the art, and considered
two author mentions to refer to the same individual if both full name and surname (to lowercase)
were found to be identical within all PubMed OA. The total number of authors we individuated with
this approach is S = 4, 253, 172.
We further consider the following journal-level variables: if an article was published by a PLOS
or BMC journal; if an article was published under encouraged or required DAS mandates; the
domain/field/sub-field of the journal, as given by the Science-Metrix classification [57], in order to
control for venue and research area.5 We also control for the journal as a dummy variable in some
models. An overview of the variables we use is given in Table 3, while a set of descriptive statistics
for some of them are reported in Table 4.
The dataset we analyse and discuss below uses a window of three years for citation accrual, and
includes publications until 2015 included, in order to allow for all articles to be compared on equal
5 Openly available here: http://science-metrix.com/?q=en/classification. Despite the fact that journal-level
article classifications are not as accurate as citation clustering or other alternatives, the Science-Metrix classification
has been recently found to be the best of its class and an overall reasonable choice [58, 59].
8/18Table 4. Descriptive statistics for (non-trasformed) model variables over the whole dataset under
analysis.
Variable/Statistic Minimum Median Mean Maximum
n cit2 0 0 0.68 166
n cit3 0 0 1.13 483
n cit5 0 1 1.9 1732
n cit tot 0 1 2.84 2233
n authors 1 6 6.68 2442
n references tot 1 39 41.94 1097
p year 1997 2014 2013 2018
p month 1 7 5.43 12
h index median 0 1 1.17 28
h index mean 0 1.2 1.56 28
Table 5. Correlations among a set of variables. The values on the top-right half of the table over
the diagonal are Spearman’s correlation coefficients, the values on the bottom-left half of the table
over the diagonal are Pearson’s correlation coefficients. All variables are transformed as in the
description of the model.
Variable ln(n cit3 + 1) ln(n authors) p year p month ln(h index mean + 1) h index median ln(n ref erences tot + 1)
ln(n cit3 + 1) 0.16 0.14 -0.02 0.25 0.2 0.22
ln(n authors) 0.16 0.16 -0.01 0.2 0.06 0.11
p year 0.14 0.16 -0.02 0.39 0.32 0.1
p month -0.01 -0.01 -0.03 0.01 0.01 0.02
ln(h index mean + 1) 0.25 0.18 0.41 0.02 0.85 0.12
h index median 0.19 0 0.28 0.02 0.82 0.08
ln(n ref erences tot + 1) 0.24 0.15 0.13 0.02 0.14 0.07
footing. Results using windows of two or five years are consistent. The number of publications under
consideration here is thus M 2015 = 367, 836, of which Md2015 = 45, 968 with a DAS. Correlation
values among a set of variables are given in Table 5, calculated over this specific dataset.
Model. The model we consider and discuss here is an Ordinary Least Squares (OLS) model based
on the following formula:
ln(n cit3 + 1) = ln(n authors) + ln(n ref erences tot + 1) + p year + p month
+ln(h index mean + 1) + h index median + das category simple + is plos (1)
+das encouraged + das required + journal f ield + das category ∗ is plos
An OLS model for citation counts, after a log transform and the addition of 1, has been found to
perform well in practice when compared to more involved alternatives [60, 61]. We nevertheless use
a variety of alternative models, which are made available in the accompanying repository and all
corroborate our results [62].6 We compare standard OLS and robust OLS here, noting how robust
regression results do not differ significantly. The last interaction term between PLOS and the DAS
classification is meant to single out the effect of DAS categories for the two publishers. The results
of fitted models are provided in Table 6.7
Regression results point out to a set of outcomes which are known in the literature, namely that
articles with more authors and references tend to be slightly more highly cited. We also find a known
citation inflation effect for more recent articles (reminding the reader that we consider an equal
6 The models we test include ANOVA, tobit and GLM with negative binomial (on the full dataset and on the
dataset of papers with 1 or more received citations), zero-inflated negative binomial, lognormal and Pareto 2 family
distributions. We further test different models, including logistic regression on DAS category and on whether or not a
paper is cited at least once.
7 All the modelling has been performed in R [63] and RStudio [64], mostly relying on the DMwR [65], glamss [66], mass
and nnet [67], vgam [68], ggplot2 [69], tidyverse [70] and stargazer [71] packages.
9/18citation accumulation window of three years overall). Crucially, the mean author H-index is strongly
correlated with higher citations, while not so much the median, indicating the preferential citation
advantage given to more popular authors. We also find substantial effects at the journal field level,
e.g. with General Science and Technology negatively impacting citations (we note that PLOS ONE
falls entirely within this category). Articles from PLOS are also, overall, more cited than those from
BMC.
Turning our attention to the effect of DAS on citation advantage, we note that the encouraged
and required policies play a somewhat minor role. Nevertheless, all DAS categories positively impact
citation counts, with category 3 standing out and contributing, when present, to an increase of
22.65% over the average citation rate of an article after three years from publication, which is 1.26 in
this dataset under analysis. The increase is of 25.36% considering the 1.13 average citation rate of
an article over the whole dataset instead. These positive contributions are less effective for PLOS
articles, after controlling for the publisher. When we further control for individual venues (journal),
DAS category 3 is the only one remaining significantly correlated with a positive citation impact (see
repository). These results suggest that the citation advantage of DAS is not as much related to their
mere presence, but to their contents. In particular, that DAS containing actual links to data stored
in a repository are correlated to higher citation impact.
When interpreting these results it should be noted that we consider a relatively small sample of
citations compared to the full citation counts of the papers under analysis. We, however, assume that
the distribution of citations of the sample is representative of the real citation distribution. Based
on this assumption, we conclude that there is an up to 25.36% relative gain in citation counts in
general for a paper with DAS category 3. We discuss some possible motivations for this effect in our
conclusions.
Conclusion
In this contribution we consider Data Availability Statements (DAS): a section in research articles
which is increasingly being encouraged or mandated by publishers and used by authors to state if and
how their research data are made available. We use the PubMed Open Access collection and focus
on journal articles published by BMC and PLOS, in order to address the following two questions:
1) are DAS being adopted as per publisher’s policies and, if so, can we qualify DAS into categories
determined by their contents? 2) Are different DAS categories correlated with an article’s citation
impact? In particular, are preferred DAS which include an explicit link to a repository, either via
a URL or permanent identifier (category 3 in this study) more positively correlated with citation
impact than alternatives? These questions are prompted by our intention to assess to what extent
open science practices are adopted by publishers and authors, as well as to verify whether there is a
benefit for authors who invest resources in order to (properly) make their research data available.
We find that DAS are rapidly adopted after the introduction of a mandate in the journals from
both publishers. For reasons in large part related to what is proposed as a standard text for DAS,
BMC publications mostly use category 1 (data available on request), while PLOS publications mostly
use category 2 (data contained within the article and supplementary materials). Category 3 covers,
for both publishers, just a fraction of DAS: 12.2% (BMC) and 20.8% (PLOS) respectively. This is in
line with previous literature finding that only about 20% of PLOS One articles between March 2014
and May 2016 contain a link to a repository in their DAS [16]. We also note that individual journals
show a significant degree of variation with respect to their DAS category distributions.
The results of citation prediction clearly point to a citation advantage, of up to 25.36%, for articles
with a category 3 DAS – those including a link to a repository via a URL or other permanent identifier,
consistent with the results of previous smaller, more focused studies [24–28]. This is encouraging, as
it provides a further incentive to authors to make their data available using a repository. There might
be a variety of reasons for this effect. More efforts and resources are put into papers sharing data, thus
this choice might be made for better quality articles. It is also possible that more successful or visible
research groups have also more resources at their disposal for sharing data as category 3. Sharing
10/18data likely also gives more credibility to an article’s results, as it supports reproducibility [72, 73].
Finally, data sharing encourages re-use, which might further contribute to citation counts.
Our study has a set of limitations. First of all, the willingness to operate fully reproducibly has
constrained our choices with respect to data. While the PubMed OA collection is sizable, it includes
just a minor fraction of all published literature. Even with respect to indicators based on citation
counts (H-index, received citations), we decided not to use larger commercial options such as Web of
Science or Scopus. We further focus on DAS given in dedicated sections, potentially missing those
given in other parts of an article. Furthermore, we do not assess what a given repository contains
in practice: this is not a replication study. Finally, citation counts are but one way to assess an
article’s impact, among many. These and other limitations constitute potential avenues for future
work: we believe that by sharing all our data and code, this study can be updated and built upon for
the future analyses.
Future research that evaluates the contents and accuracy of DAS in a more detailed way than in
this analysis, e.g., with more sophisticated and granular categorisation of DAS, would be valuable.
For example, by comparing whether DAS that are highly templated from journals’ guidance for
authors are associated with differences in citation counts compared to non-standard statements, and
whether DAS are an accurate description of the location of data needed to reproduce the results
reported in the article. We assume that non-templated statements imply more consideration of the
journal’s data sharing policy by the authors, and potentially more rigorous approaches to research
data management. However, we found non-templated statements to appear with a lower frequency
than statements such as “All relevant data are within the paper and its Supporting Information
files”.
There are several potential implications of our results. All stakeholders, from funding agencies to
publishers and researchers, now have further evidence of an important benefit (increased citations)
of providing access to research data. As a consequence, requests for strengthened and consistent
research data policies, from research funders, publishers and institutions, can be better supported,
enforced and accepted. Introducing stronger research data policies carry associated costs for all
stakeholders, which can be better justified with evidence of a citation benefit. Our finding that
journal policies that encourage rather than require or mandate DAS have only a small effect on the
volume of DAS published will be of interest to publishers, if their goal is to improve the availability
of DAS. However, policies often serve to create cultural and behavioural change in a community
and to signal the importance of an issue [74], and it is not uncommon for journals and publishers to
introduce new editorial policies in a progressive manner, with policies, such as on availability of data
and code, increasing in strength and rigour over time. Springer Nature, for example, have indicated
they intend to support more of their journals with data sharing policies that do not mandate a DAS
to mandate a DAS [3].
Our DAS classification approach, and release of the data and code, may be helpful for stakeholders
interested in research data policy compliance, as it enables more automated approaches to the
detection, extraction and classification of DAS across multiple journals and publishers, at least in
the open access literature. Even wider adoption of DAS as a standard data policy requirement for
publishers, funding agencies and institutions would further facilitate the visibility of links to data as
metadata, enhancing data discoverability, credit allocation and positive research practices such as
reproducibility. In fact, machine readable DAS would allow for the development of a research data
index extending existing citation indexes and allowing, potentially, to monitor sharing behaviour
by researchers and compliance with data policies of different stakeholders. DAS also provides a
mechanism for more focused search and enrichment of the literature with links between research
data/code, and scholarly articles. Links to research data provided within a DAS are most likely to
refer to research data generated by or analysed in a study, potentially increasing the accuracy of
services such as EU PubMed Central and Scholarly Link Exchange (Scholix), which can link scholarly
publications to their supporting data.
11/18Data and code availability
Code and data can be found at: https://doi.org/10.5281/zenodo.3268810 [75].
Acknowledgments
This work was supported by The Alan Turing Institute under the EPSRC grant EP/N510129/1
and by Macmillan Education Ltd, part of Springer Nature, through grant RG92108 Effect of data
sharing policies on articles’ citation counts. The authors would like to thank Jo McEntyre and
Audrey Hamelers at European Bioinformatics Institute / EUPMC for advice on using their APIs in
the planning stage of this study. We also thank Angela Dappert at Springer Nature for support in
obtaining journal metadata from Springer Nature. We finally thank James Hetherington, director of
Research Engineering at The Alan Turing Institute, for supporting and advising GC through the
project.
Competing interests
At the time of conducting and writing the study IH was an employee of Springer Nature, publisher
of the BMC journals. All other authors declare they have no competing interests.
Regression table
Table 6. OLS and robust LS estimates for the citation prediction model under discussion.
Dependent variable:
ln(n cit3 + 1)
OLS robust LS
(1) (2)
n authors 0.107∗∗∗ 0.103∗∗∗
(0.002) (0.002)
n references tot 0.197∗∗∗ 0.189∗∗∗
(0.002) (0.002)
p year 0.011∗∗∗ 0.011∗∗∗
(0.0005) (0.0005)
p month −0.011∗∗∗ −0.010∗∗∗
(0.0005) (0.0004)
h index mean 0.218∗∗∗ 0.204∗∗∗
(0.004) (0.004)
h index median 0.007∗∗∗ 0.008∗∗∗
(0.001) (0.001)
C(das category)1 0.085∗∗∗ 0.072∗∗∗
(0.024) (0.023)
C(das category)2 0.059∗∗∗ 0.057∗∗∗
(0.019) (0.018)
C(das category)3 0.252∗∗∗ 0.271∗∗∗
(0.012) (0.012)
C(journal field)Agriculture, Fisheries & Forestry −0.066∗∗∗ −0.051∗∗∗
12/18(0.011) (0.011)
C(journal field)Biology -0.009 0.007
(0.009) (0.009)
C(journal field)Biomedical Research −0.027∗∗∗ −0.012∗∗
(0.005) (0.005)
C(journal field)Chemistry −0.242∗∗∗ −0.214∗∗∗
(0.015) (0.014)
C(journal field)Clinical Medicine −0.033∗∗∗ −0.021∗∗∗
(0.004) (0.004)
C(journal field)Enabling & Strategic Technologies 0.047∗∗∗ 0.054∗∗∗
(0.005) (0.005)
C(journal field)Engineering −0.205∗∗∗ −0.177∗∗∗
(0.019) (0.019)
C(journal field)General Science & Technology −0.388∗∗∗ −0.370∗∗∗
(0.006) (0.006)
C(journal field)Information & Communication Technologies 0.007 0.025∗
(0.013) (0.013)
C(journal field)Philosophy & Theology -0.011 0.012
(0.026) (0.026)
C(journal field)Psychology & Cognitive Sciences −0.160∗∗∗ −0.135∗∗∗
(0.021) (0.021)
C(journal field)Public Health & Health Services 0.042∗∗∗ 0.057∗∗∗
(0.006) (0.006)
das requiredTrue 0.073∗∗∗ 0.070∗∗∗
(0.005) (0.004)
das encouragedTrue −0.052∗∗∗ −0.048∗∗∗
(0.004) (0.004)
is plosTrue 0.211∗∗∗ 0.213∗∗∗
(0.004) (0.004)
C(das category)1:is plosTrue −0.077∗∗∗ −0.066∗∗∗
(0.025) (0.025)
C(das category)2:is plosTrue −0.040∗∗ −0.038∗∗
(0.019) (0.019)
C(das category)3:is plosTrue −0.163∗∗∗ −0.192∗∗∗
(0.014) (0.014)
Constant −22.228∗∗∗ −23.297∗∗∗
(0.967) (0.950)
Observations 367,836 367,836
R2 0.144
Adjusted R2 0.144
Residual Std. Error (df = 367808) 0.593 0.665
F Statistic 2,285.393∗∗∗ (df = 27; 367808)
Note: ∗ pReferences
1. Hodson S, Molloy L. Current Best Practice for Research Data Management Policies.
2015;doi:10.5281/zenodo.27872.
2. New policy for structural data. Nature. 1998;394(6689). doi:10.1038/27971.
3. Jones L, Grant R, Hrynaszkiewicz I. Implementing publisher policies that inform, support
and encourage authors to share data: two case studies. Insights the UKSG journal. 2019;32.
doi:10.1629/uksg.463.
4. Hrynaszkiewicz I, Birukou A, Astell M, Swaminathan S, Kenall A, Khodiyar V. Stan-
dardising and harmonising research data policy in scholarly publishing. IJDC. 2017;12(1).
doi:10.2218/ijdc.v12i1.531.
5. Announcement: Where are the data? Nature. 2016;537(7619). doi:10.1038/537138a.
6. Murphy F, Samors RJ. Belmont Forum Data Accessibility Statement Policy and Template -
Endorsed 18 October 2018. 2018;doi:10.5281/zenodo.1476871.
7. Schmidt B, Gemeinholzer B, Treloar A. Open data in global environmental re-
search: The Belmont forum’s open data survey. PLoS ONE. 2016;11(1):e0146695.
doi:10.1371/journal.pone.0146695.
8. Giofrè D, Cumming G, Fresc L, Boedker I, Tressoldi P. The influence of journal submission
guidelines on authors’ reporting of statistics and use of open research practices. PLoS ONE.
2017;12(4):e0175583. doi:10.1371/journal.pone.0175583.
9. Vines TH, Andrew RL, Bock DG, Franklin MT, Gilbert KJ, Kane NC, et al. Mandated
data archiving greatly improves access to research data. FASEB J. 2013;27(4):1304–1308.
doi:10.1096/fj.12-218164.
10. Science D, Hahnel M, Fane B, Treadway J, Baynes G, Wilkinson R, et al. The State of Open
Data Report. 2018;.
11. Wicherts JM, Borsboom D, Kats J, Molenaar D. The poor availability of psychological research
data for reanalysis. Am Psychol. 2006;61(7):726–728. doi:10.1037/0003-066X.61.7.726.
12. Rowhani-Farid A, Barnett AG. Has open data arrived at the British Medical Journal (BMJ)?
An observational stud. BMJ Open. 2016;6(10):e011784. doi:10.1136/bmjopen-2016-011784.
13. Vasilevsky NA, Minnier J, Haendel MA, Champieux RE. Reproducible and reusable
research: are journal data sharing policies meeting the mark? PeerJ. 2017;5:e3208.
doi:10.7717/peerj.3208.
14. Naudet F, Sakarovitch C, Janiaud P, Cristea I, Fanelli D, Moher D, et al. Data sharing and
reanalysis of randomized controlled trials in leading biomedical journals with a full data sharing
policy: survey of studies published in The BMJ and PLOS Medicine. BMJ. 2018;360:k400.
doi:10.1136/bmj.k400.
15. Hardwicke TE, Mathur MB, MacDonald KE, Nilsonne G, Banks GC, Kidwell M, et al. Data
availability, reusability, and analytic reproducibility: Evaluating the impact of a mandatory
open data policy at the journal Cognition. 2018;doi:10.31222/osf.io/39cfb.
16. Federer LM, Belter CW, Joubert DJ, Livinski A, Lu YL, Snyders LN, et al. Data sharing in
PLOS ONE: An analysis of Data Availability Statements. PLOS ONE. 2018;13(5):e0194768.
doi:10.1371/journal.pone.0194768.
14/1817. McDonald L, Schultze A, Simpson A, Graham S, Wasiak R, Ramagopalan SV. A review of
data sharing statements in observational studies published in the BMJ: A cross-sectional study.
F1000Research. 2017;6:1708. doi:10.12688/f1000research.12673.2.
18. Naudet F, Sakarovitch C, Janiaud P, Cristea I, Fanelli D, Moher D, et al. Data sharing and
reanalysis of randomized controlled trials in leading biomedical journals with a full data sharing
policy: survey of studies published in The BMJ and PLOS Medicine. BMJ. 2018; p. k400.
doi:10.1136/bmj.k400.
19. Park H, Wolfram D. Research software citation in the Data Citation Index: Current practices
and implications for research software sharing and reuse. Journal of Informetrics. 2019;13(2):574–
582. doi:10.1016/j.joi.2019.03.005.
20. Longo DL, Drazen JM. Data Sharing. New England Journal of Medicine. 2016;374(3):276–277.
doi:10.1056/NEJMe1516564.
21. Milham MP, Craddock RC, Son JJ, Fleischmann M, Clucas J, Xu H, et al. Assessment of
the impact of shared brain imaging data on the scientific literature. Nature Communications.
2018;9(1). doi:10.1038/s41467-018-04976-1.
22. Popkin G. Data sharing and how it can benefit your scientific career. Nature.
2019;569(7756):445–447. doi:10.1038/d41586-019-01506-x.
23. Wallach JD, Boyack KW, Ioannidis JPA. Reproducible research practices, transparency, and
open access data in the biomedical literature, 2015–2017. PLOS Biology. 2018;16(11):e2006930.
24. Piwowar HA, Day RS, Fridsma DB. Sharing detailed research data is associated with increased
citation rate. PLoS ONE. 2007;2(3):e308. doi:10.1371/journal.pone.0000308.
25. Piwowar HA, Vision TJ. Data reuse and the open data citation advantage. PeerJ. 2013;1:e175.
doi:10.7717/peerj.175.
26. Sears JR. Data Sharing Effect on Article Citation Rate in Paleoceanography. AGU Fall
Meeting Abstracts. 2011; p. IN53B–1628.
27. Henneken EA, Accomazzi A. Linking to Data: Effect on Citation Rates in Astronomy. In:
Ballester P, Egret D, Lorente NPF, editors. Astronomical Data Analysis Software and Systems
XXI. vol. 461 of Astronomical Society of the Pacific Conference Series; 2012.Available from:
http://arxiv.org/abs/1111.3618.
28. Dorch BF, Drachen TM, Ellegaard O. The data sharing advantage in astrophysics. IAU.
2015;11(A29A):172–175. doi:10.1017/S1743921316002696.
29. Grant R, Hrynaszkiewicz I. The impact on authors and editors of introducing Data Availability
Statements at Nature journals. International Journal of Digital Curation. 2018;13(1):195–203.
doi:10.2218/ijdc.v13i1.614.
30. Python Core Team. Python: A dynamic, open source programming language; 2001–. Available
from: https://www.python.org.
31. Jones E, Oliphant T, Peterson P, et al.. SciPy: Open source scientific tools for Python; 2001–.
Available from: http://www.scipy.org.
32. Pedregosa F, Varoquaux G, Gramfort A, Michel V, Thirion B, Grisel O, et al. Scikit-learn:
Machine Learning in Python. Journal of Machine Learning Research. 2011;12:2825–2830.
33. McKinney W. Data Structures for Statistical Computing in Python. Proceedings of the 9th
Python in Science Conference. 2010; p. 51–56.
15/1834. Stéfan van der Walt CC, Varoquaux G. The NumPy Array: A Structure for Efficient Numerical
Computation. Computing in Science & Engineering. 2011;13:22–30. doi:10.1109/MCSE.2011.37.
35. Bird S, Loper E, Klein E. Natural Language Processing with Python; 2009.
36. Hunter JD. Matplotlib: A 2D Graphics Environment. Computing in Science & Engineering.
2007;9:90–95. doi:10.1109/MCSE.2007.55.
37. Waskom M, et al.. mwaskom/seaborn: v0.8.1 (September 2017); 2017. Available from:
https://doi.org/10.5281/zenodo.883859.
38. Řehůřek R, Sojka P. Software Framework for Topic Modelling with Large Corpora. In:
Proceedings of the LREC 2010 Workshop on New Challenges for NLP Frameworks. Valletta,
Malta: ELRA; 2010. p. 45–50.
39. Bloom T, Ganley E, Winker M. Data Access for the Open Access Literature: PLOS’s Data
Policy. PLoS Biology. 2014;12(2):e1001797. doi:10.1371/journal.pbio.1001797.
40. Hrynaszkiewicz I. Availability of supporting data: crediting transparency and enhancing the
literature; 2011. Available from: https://blogs.biomedcentral.com/bmcblog/2011/07/07/
availability-of-supporting-data-crediting-transparency-and-enhancing-the-literature.
41. Manning CD, Raghavan P, Schütze H. Introduction to Information Retrieval. Cambridge:
Cambridge University Press; 2008.
42. Joachims T. Text Categorization with Support Vector Machines: Learning with Many Relevant
Features. In: Proceedings of the 10th European Conference on Machine Learning. ECML’98.
Berlin, Heidelberg: Springer-Verlag; 1998. p. 137–142.
43. Wang A, Wan G, Cheng Z, Li S. An Incremental Extremely Random Forest Classifier for
Online Learning and Tracking. In: Proceedings of the 16th IEEE International Conference on
Image Processing. ICIP’09. Piscataway, NJ, USA: IEEE Press; 2009. p. 1433–1436.
44. Mikolov T, Chen K, Corrado G, Dean J. Efficient Estimation of Word Representations in
Vector Space. In: 1st International Conference on Learning Representations, ICLR 2013,
Scottsdale, Arizona, USA, May 2-4, 2013, Workshop Track Proceedings; 2013.Available from:
http://arxiv.org/abs/1301.3781.
45. Gargouri Y, Hajjem C, Larivière V, Gingras Y, Carr L, Brody T, et al. Self-Selected or
Mandated, Open Access Increases Citation Impact for Higher Quality Research. PLoS ONE.
2010;5(10):e13636. doi:10.1371/journal.pone.0013636.
46. Yegros-Yegros A, Rafols I, D’Este P. Does Interdisciplinary Research Lead to Higher Cita-
tion Impact? The Different Effect of Proximal and Distal Interdisciplinarity. PLOS ONE.
2015;10(8):e0135095. doi:10.1371/journal.pone.0135095.
47. Wang J, Veugelers R, Stephan P. Bias against novelty in science: A caution-
ary tale for users of bibliometric indicators. Research Policy. 2017;46(8):1416–1436.
doi:10.1016/j.respol.2017.06.006.
48. Struck B, Durning M, Roberge G, Campbell D. Modelling the Effects of Open Access, Gender
and Collaboration on Citation Outcomes: Replicating, Expanding and Drilling. In: STI 2018
Conference Proceedings. Leiden, The Netherlands: Centre for Science and Technology Studies
(CWTS); 2018. p. 436–447. Available from: http://hdl.handle.net/1887/65337.
49. Sekara V, Deville P, Ahnert SE, Barabási AL, Sinatra R, Lehmann S. The chaperone effect in
scientific publishing. Proceedings of the National Academy of Sciences. 2018;115(50):12603–
12607. doi:10.1073/pnas.1800471115.
16/1850. Torvik VI, Smalheiser NR. Author name disambiguation in MEDLINE. ACM Transactions on
Knowledge Discovery from Data. 2009;3(3):1–29. doi:10.1145/1552303.1552304.
51. Lu Z. PubMed and beyond: a survey of web tools for searching biomedical literature. Database.
2011;2011:baq036–baq036. doi:10.1093/database/baq036.
52. Ferreira AA, Gonçalves MA, Laender AHF. A brief survey of automatic methods for author
name disambiguation. ACM SIGMOD Record. 2012;41(2):15. doi:10.1145/2350036.2350040.
53. Liu W, Islamaj Doğan R, Kim S, Comeau DC, Kim W, Yeganova L, et al. Author Name
Disambiguation for PubMed. Journal of the Association for Information Science and Technology.
2014;65(4):765–781. doi:10.1002/asi.23063.
54. Zheng JG, Howsmon D, Zhang B, Hahn J, McGuinness D, Hendler J, et al. Entity linking
for biomedical literature. BMC Medical Informatics and Decision Making. 2015;15(S1).
doi:10.1186/1472-6947-15-S1-S4.
55. Strotmann A, Zhao D. Author name disambiguation: What difference does it make in
author-based citation analysis? Journal of the American Society for Information Science and
Technology. 2012;63(9):1820–1833. doi:10.1002/asi.22695.
56. Kim J, Diesner J. Distortive effects of initial-based name disambiguation on measurements
of large-scale coauthorship networks. Journal of the Association for Information Science and
Technology. 2016;67(6):1446–1461. doi:10.1002/asi.23489.
57. Archambault E, Beauchesne OH, Caruso J. Towards a multilingual, comprehensive and
open scientific journal ontology. In: Proceedings of the 13th International Conference of the
International Society for Scientometrics and Informetrics; 2011. p. 66–77.
58. Klavans R, Boyack KW. Which Type of Citation Analysis Generates the Most Accurate
Taxonomy of Scientific and Technical Knowledge? Journal of the Association for Information
Science and Technology. 2017;68(4):984–998. doi:10.1002/asi.23734.
59. Boyack KW. Investigating the effect of global data on topic detection. Scientometrics.
2017;111(2):999–1015. doi:10.1007/s11192-017-2297-y.
60. Thelwall M, Wilson P. Regression for citation data: An evaluation of different methods.
Journal of Informetrics. 2014;8(4):963–971. doi:10.1016/j.joi.2014.09.011.
61. Thelwall M. The discretised lognormal and hooked power law distributions for complete citation
data: Best options for modelling and regression. Journal of Informetrics. 2016;10(2):336–346.
doi:10.1016/j.joi.2015.12.007.
62. Ajiferuke I, Famoye F. Modelling count response variables in informetric studies: Comparison
among count, linear, and lognormal regression models. Journal of Informetrics. 2015;9(3):499–
513. doi:10.1016/j.joi.2015.05.001.
63. R Core Team. R: A Language and Environment for Statistical Computing; 2018. Available
from: https://www.R-project.org.
64. RStudio Team. RStudio: Integrated Development Environment for R; 2015. Available from:
http://www.rstudio.com/.
65. Torgo L. Data Mining with R, learning with case studies. London: Chapman and Hall/CRC;
2010.
66. Rigby RA, Stasinopoulos DM. Generalized additive models for location, scale and shape,(with
discussion). Applied Statistics. 2005;54:507–554.
17/18You can also read