WHAT HAPPENS IN THE SHADOWS? - A QUANTITATIVE ANALYSIS ON THE EFFECT OF SHADOWS IN BASEBALL - DIVA PORTAL
←
→
Page content transcription
If your browser does not render page correctly, please read the page content below
C-Thesis

What happens in the shadows?
A quantitative analysis on the effect of shadows in
baseball.

                               Author: Ström, Martin
                               Supervisor: Pojskic, Haris
                               Examiner: Carlsson, Bo
                               Term: VT21
                               Subject: Sports Science
                               Level: Bachelor
                               Course code: 2IV31E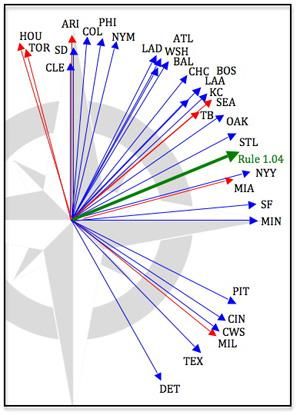
Abstract
Baseball is one of the most statistically documented sports in the world. Every
statistical outcome in baseball starts with the pitcher and the plate appearance.
In baseball, it is believed that when shadows are present between the pitcher’s
mound and the batter’s box, the pitcher is at an advantage. Therefore, the aim
of the study was to identify if there is an advantage for pitchers pitching with
shadows separating the pitcher’s mound from the batter’s box. Only games
from Major League Baseball in which the shadows were present between the
pitcher’s mound and batter’s box were analyzed. Analyzed variables were
comprised of traditional statistical outcomes categorized as good or bad
outcomes. Furthermore, good and bad outcomes were analyzed using their
ordinal subcategories rated from 1 to 4. Differences between good and bad
outcomes of plate appearances, when shadows were and were not present, was
analyzed using a Mann-Whitney U Test.

The results of the study indicate that shadows do not have a significant effect
on the outcome of plate appearances. Moreover, pitchers do not have an
advantage pitching while shadows are present between them and the batter’s
box. Frequencies of outcomes with shadows present was much the same to
outcomes without the shadows present. In conclusion, it does not appear that
shadows influence the outcome of plate appearances. However, further
research on statistical metrics and their effect on plate appearances is
necessary.

Key words
Statistics; outcome; plate appearance; pitcher; batter;
Acknowledgments
To Haris,

Whose unrelenting support is the only reason this was possible. I could not have asked
for a better supervisor. Thank you.

To my mom and dad,

Who has always supported me, believed in me, and pushed me to go as far as possible.
You introduced me to this beautiful game, and for that, I am forever grateful.

I love you both.
Table of contents
1      Introduction                                                               1
    1.1     Background                                                            2
       1.1.1    An introduction to statistics                                     2
    1.2     Objective and research questions                                      4
       1.2.1    Objective                                                         4
       1.2.2    Research questions                                                5
2      Previous research                                                          6
    2.1    General research on baseball statistics                                6
    2.2    Research on advantages                                                 7
    2.3    Research on the pitcher and batter subgame                             7
    2.4    Research on shadows in baseball                                        8
    2.5    Summary of previous research                                           9
3      Method                                                                    10
    3.1     Study design                                                         10
    3.2     Sampling of data                                                     11
       3.2.1    Alignment of Major League Ballparks                              12
       3.2.2    Angles of sunlight                                               13
    3.3     Processing of data                                                   14
       3.3.1    Definition of good outcomes                                      15
       3.3.2    Definition of bad outcomes                                       16
    3.4     Analysis of data                                                     17
    3.5     Research ethics considerations                                       17
4     Results                                                                    18
5      Discussion                                                                20
    5.1     Discussion of results                                                20
    5.2     Discussion of method                                                 23
       5.2.1    Discussion of variables                                          24
       5.2.2    Discussion of sources                                            25
       5.2.3    Delimitations and limitations                                    25
6      Conclusions                                                               27
    6.1   Implications for further research                                      28
7     References                                                                 30
8      Appendix                                                                   36
    8.1    Appendix 1 – Result of Shapiro-Wilk Test for normality in sampled data 36
    8.2    Appendix 2 - Result of Mann-Whitney U test for difference in rating of
    pitcher’s outcome variables                                                   37
    8.3    Appendix 3 - Result of Mann-Whitney U test for difference in good versus
    bad outcomes.                                                                 38
    8.4    Appendix 4 - Result of Mann-Whitney U test for difference in rating
    between all good outcomes.                                                    39
    8.5    Appendix 5 - Result of Mann-Whitney U test for difference in rating
    between all bad outcomes.                                                     40
Appendices Appendix 1 – Result of Shapiro-Wilk Test for normality in sampled data Appendix 2 - Result of Mann-Whitney U test for difference in rating of pitcher’s outcome variables Appendix 3 - Result of Mann-Whitney U test for difference in good versus bad outcomes. Appendix 4 - Result of Mann-Whitney U test for difference in rating between all good outcomes. Appendix 5 - Result of Mann-Whitney U test for difference in rating between all bad outcomes.
1 Introduction
This section presents a background to baseball, as well as the objective and research
questions of the study.

Known as America’s national pastime, baseball has a long-standing historical
and sociological connection to the country. Walt Whitman famously claimed
that baseball fits as much into America’s constitutions and is as important to
its total historical life, as any other institution in the country (Rader, 2008). It
has shaped and been shaped by the collective minds of America since the first
modern game in 1846, reaching every household and every heart of its citizens.
It is and has always been, a mirror of society, thus portraying the joy and
hardships of America in every way imaginable (Hoffmann et al., 2003). From
Jackie Robinson breaking the color barrier to the 1919 Black Sox Scandal; to
the steroid era of the early 2000s and the Cubs finally ending their curse,
baseball has had its fair share of legends and drama (Rader, 2008).

Although baseball is “America’s game” (Rader, 2008), it has not only crossed
barriers domestically but internationally as well. During and after the Civil
War, while the game spread across the states, it also reached the Caribbean
and Central America in the 1860s. It reached China in 1863, while Japan and
South Korea got their first taste of the sport in the early 1870s (Kelly, 2007).
The international spread of the sport predates soccer but is severely outclassed
in the number of global players and interest. It lacks both the attendance and
recognition to compete with a sport such as soccer on the world stage, perhaps
due to the nationalization of the sport as America’s pastime, rather than the
world’s (Kelly, 2007).

Baseball is played between two teams, each consisting of nine players, taking
turns to play offense and defense. A game consists of nine innings and the
winner is decided by whichever team has scored the most runs after said nine
innings. To score runs, the offensive team’s batters attempt to hit the ball

                                                                                 1(40)
thrown by the defensive team’s pitcher. If a player from the offensive team
can hit the ball and safely make his way across all four bases, they score a run.
The defense attempts to get the offense out by throwing, catching, tagging, or
striking the offensive team’s players out. When the defensive team gets three
outs, the teams swap sides and defense becomes offense and vice versa. When
both teams have had their three outs playing defense, one inning has passed.
The teams continue to swap between offense and defense for nine innings, or
until a winner can be decided. If the teams are tied after nine innings, the game
goes into extra innings and each team gets one more inning to try and score. If
the teams are still tied after each extra inning, the game simply continues one
inning at a time, until a winner is decided (Albert et al., 2005).
Within the game, what is known as the pitcher and batter subgame becomes
the starting point of any play and the only part of baseball where the two teams
truly “face” each other (Alamar et al., 2006). Due to this, baseball is the most
individual of all team sports (Kelly, 2007). Players on the same team only
interact through throwing the ball to each other or helping each other along the
bases through their batting. Because of its nature, statistical analysis has been
a key part of the game since as early as the 19th century (Wikipedia, 2021a).
Unlike any other sport, statistics guide managers, players, and fans alike. From
broadcasts to stadiums, from the Hall of Fame to Little League, not a single
part of baseball is unaffected by statistics.
Between all aspects of the game, statistics are what truly made me fall in love
with baseball, and it is on that love that this thesis is based.
1.1 Background
1.1.1 An introduction to statistics
One fundamental aspect of baseball that separates it from many other sports is
the sheer amount of numerical data recorded about the game. Unlike most
2(40)sports, the outcomes of the most common baseball event, a plate appearance,
is easy to evaluate as there are not a great number of differentiating outcomes.
The plate appearance is the start and finish of any game, where the batter steps
up to the plate to face the pitcher. Almost the entirety of the game depends on
the outcome of these plate appearances, thus making them highly relevant to
analyze from a statistical standpoint.
Furthermore, statistics in baseball are often used to decide the game’s best
hitter or pitcher of a certain season as well as serving as a tool for salary
arbitration and negotiating new contracts. The best hitter of a single season,
for example, is decided by the amount of hits accumulated divided by the
number of at-bats, or opportunities, the player had to get those hits. The result
of this equation is the metric known as batting average. Similarly, the best
pitcher is often decided by utilizing several metrics such as earned-run
average, strikeouts, or wins. These examples are just the tip of the iceberg of
baseball analysis and presently, most professional teams have hired analysts
to provide statistical assistance to the team’s strategy during the season (Albert
et al., 2005).
Recently, the rise of Sabermetrics, a term first introduced by baseball writer
Bill James in 1977, has shown that advanced mathematical formulas can find
underappreciated and undervalued players where traditional statistics fail to
do so (Caporale & Collier, 2012). The impact of Sabermetrics and advanced
statistical evaluation of players have even made it to the big screens, with the
2011 film adaptation of Michael Lewis’ book Moneyball (IMDB, 2011).
Moneyball depicts the 2002 Oakland Athletics’ attempt to build a playoff
winning team on a small-market budget, using Bill James’ Sabermetrics, to
compete with big-market teams. Since 2002, Sabermetrics is widely utilized
and accepted as common practice for all professional baseball teams. As the
sport continues to develop, so too will the statistical elements continue to
proliferate and evolve into new, advanced metrics.
3(40)There are elements of statistics in baseball, which sometimes fail to tell the
full story. As will be discussed in this thesis, the outcome of events is
sometimes difficult to credit any one player. In baseball, for example, pitchers
can achieve the feat of a no-hitter or a perfect game, by not giving up a single
hit or getting all 27 batters out in a row, respectively. The pitcher gets credited
with the achievement, but the feat itself depends on many other factors. The
opposing team’s offensive prowess, the defensive fielder’s abilities, or, most
importantly, the catcher’s ability to call the game, all play a part in the pitcher
earning his achievement (Grosshandler, N.D). For the sake of this thesis,
which examines the outcome between pitcher and batter, the discussion of
where credit is due, is highly relevant.
Baseball’s many facets cannot be fully comprehended or appreciated in a
single study. From the statistics to the traditions to the wonderful smell of
green grass on opening day, each aspect of the game has a unique place
amongst the hearts of Americans and fans from all over the world. The
evolution of baseball statistics and its many aspects is the foundation for this
study, which is focused on a microscopical part of baseball statistics to shed
light on one of the game’s great mysteries: shadows.
1.2 Objective and research questions
1.2.1 Objective
The shadows affecting pitchers and batters during the early days of spring and
the late afternoons of October seem to be a popular, yet an under-researched
area of the sport (Branch, 2019; Schifman, 2019; Swartz, 2009). It seems,
however, to be a topic of discussion by broadcasters and fans alike, whenever
the weather phenomenon occurs (Major League Baseball, 2021a). The
consensus appears to be that whenever the batter’s box is in the shadows, while
the pitcher’s mound remains in the sun, the batter will be at a disadvantage.
As one study shows (Schifman, 2019) there does not seem to be a correlation
4(40)between strike outs, walks, and the positioning of the sun. This study, however,
generalized plate appearances over a full season based on the position of the
sun.
What the study fails to take into consideration is the difference in single games,
when the shadows both are and are not present over the course of the game. In
any single game, where the same pitcher and same batters face the issue of
shadows, can the outcome of plate appearances be because of the shadows?
The objective of this study is to analyze Major League Baseball games, where
the weather phenomenon both is and is not present. Using quantitative
methods, the outcome of each plate appearance will be analyzed by dividing
them into good outcomes and bad outcomes, from the pitcher’s perspective.
By comparing plate appearances with and without shadows in play, I will
attempt to prove if shadows truly are an advantage to any team on the field.
1.2.2 Research questions
The research questions for this study are based on this objective and are as
follows:
• Is there an advantage for pitchers when the shadows separate the
batter’s box from the pitcher’s mound?
• Should Major League teams alter their in-game strategy based on the
position of shadows?
5(40)2 Previous research
In this section, previous research on baseball statistics relevant to the objective and
research questions are presented.
2.1 General research on baseball statistics
Statistical research in baseball goes back to the 19th century. This data,
however, was not widely spread amongst the public until the 1950s, when Hy
Turkin published his book The Complete Encyclopedia of Baseball
(Wikipedia, 2021a). Since then, statistics have been an instrument for all
aspects of the game. From recording any event in a game to computing
advanced models for predicting outcomes and developing methods to analyze
traditional statistics in modern systems. Any fan watching a ballgame will be
exposed to statistics, either at the ballpark itself or through the broadcast with
updating panels and graphs. While serving a vital role in the player’s careers
(Anstrom & Eisenstein, 2011), statistics are quite literally an everyday
phenomenon as 2,430 games are played every year, not including pre- or
postseason play.
Arth and Billings (2020) claim that no other sport has such a downright
difference between traditional and modern statistics as baseball. This is further
established by Davis (N.D.) who defines the best baseball players the past 69
years based on advanced metrics such as Wins Above Replacement (WAR),
On Base Percantage plus Slugging Percantage+ (OPS+), and Adjusted Earned
Run Advantage+ (ERA+). Rather than applying traditional statistics to his
weighting, Davis, who has been a baseball fan since 1952, is using metrics not
widely established until the early 2000s as a basis for his rankings. As also
stated by Butterworth (2010) baseball is perhaps the most traditionally rooted
of all sports. The differentiation of old and new, combined with the immense
amount of data collected since as early as 1876, further exploration of modern
angles to analyze the game is a highly regarded and common practice amongst
scholars and baseball experts.
6(40)2.2 Research on advantages
As presented by Jones (2015), the study of advantages in baseball is a common
element of the game, much like any other sport. In his article, he applies a
quantitative method to describe the difference in home-field advantage
between baseball and other popular team sports. Further examples of looking
to decipher value in advantages are studies by Fagan et al., (2018) and Winter
et al. (2009), who examine left-handed advantages in individual sports and
advantages based on time lost due to circadian synchronization, respectively.
Similar quantitative methods are used by all the authors above, which argues
the fact that quantitative methods are optimal in studies measuring advantages,
such as this one. The articles also illustrate how both specificity and broadness
are common for statistical baseball research. Examining the advantages
between pitcher and batter based on the position of shadows could therefore
be argued to be in line with previous research in this area.
2.3 Research on the pitcher and batter subgame
Like advantages are a part of this thesis’ objective, so is the aspect of pitcher
versus batter. The showdown between pitcher and batter is the foundation of
baseball, as all plays are set in motion by the pitcher. Furthermore, it is the
most researched and statistically documented event of baseball (Baseball
Reference, N.D.a) as it is the basis of the sport. As with advantages, the
research on pitchers and batters ranges from traditional, statistical
documentation of the outcome of plate appearances to predicting the path of a
pitch (Bahill et al., 2005), or isolating the pitcher and batter subgame
completely (Alamar et al., 2006). The relevance of research on the pitcher and
batter matchup not only derives from its importance on the outcome of games,
but it is also the base of all other statistics of the game, such as baserunning or
defense.
Alamar et al. (2006) explain how the outcome of the pitcher and batter
subgame influences a statistic known as Net Expected Run Value or NERV.
7(40)NERV is used to explain the value of any plate appearance. What is
problematic according to the author, is whether an outcome of a plate
appearance can be fully credited to either pitcher or batter. If, for example, a
fielder makes an exceptional defensive play the credit to change in NERV of
that plate appearance would be because of the fielder, rather than the pitcher.
Previous research on NERV, however, only takes the batter and pitcher into
consideration in calculating value, which means additional metrics are needed
to understand why plate appearances have certain outcomes.
If a defensive play is exceptional or not, can be measured using statistics such
as Batting Average on Balls In Play, or BABIP for short (Slowinski, 2010a).
The combination of statistics such as NERV and BABIP would explain
whether a pitcher is credible for the outcome of a plate appearance, or if
aspects such as defensive talent or luck played a part. Examples such as this,
with multiple levels of statistical metrics being applied, illustrate the difficulty
of crediting pitchers or batters with the outcome of plate appearances. For this
thesis, which will specifically analyze the outcome of plate appearances
between pitcher and batter, acknowledging that other statistical metrics may
influence such outcomes will be a central point of discussion.
2.4 Research on shadows in baseball
As previously stated, although baseball statistics is a thoroughly researched
topic, not much has been done on the topic of shadows. The weather, however,
is a prevalent factor in baseball, as rainouts are a common occurrence over the
course of a season. For this reason, 8 out of 30 teams have opted to build
domes, rather than open-air stadiums (Wikipedia, 2021b). Other
environmental factors such as wind, sunlight, and shadows are also more
controllable in domes, creating a more consistent environment for players
(Goodman & McAndrew, 1993). Therefore, games that are played in domes
are never affected by shadows, meaning that they are exempt from this study.
8(40)Only one study (Schifman, 2019) has examined similar weather phenomena to
this thesis. Schifman analyzed the position of the sun to see if it influenced
strikeouts and walks. By using generalized boosted regression models,
Schifman summarized over 60’000 randomly-sorted plate appearances over
the course of one season. With the article, the author concluded that the sun’s
angles did not have a significant effect on strikeouts or walks. Schifman also
claims that this in turn means that shadows do not affect the outcome of plate
appearances.
What the author fails to take into consideration are games where shadows both
are and are not in play. The author also limits his research to only strikeouts
and walks, not acknowledging any other outcomes of the pitcher and batter
subgame. Both aspects will be highly relevant for this thesis, as they are key
to answering the research questions.
2.5 Summary of previous research
Studies regarding advantages, pitcher evaluation, and modeling of outcomes
have been thoroughly published throughout the years, with each new study
assessing a different aspect of the game (Anstrom & Eisenstein, 2011;
Bradbury & Forman, 2012; Jensen et al., 2009; Jones, 2015; Huber &
Sturdivant, 2010). In different ways, these articles illustrate both the relevance
of research regarding topics related to this thesis, as well as emphasize the
purpose of further examining minuscule aspects of the game, such as the
shadows. While previous research on baseball statistics is extensive, there is a
gap specifically regarding the objective of this thesis. By analyzing how
pitchers perform in games where shadows vary, this thesis will attempt to fill
the existing gap in research.
9(40)3 Method
The method in this study is presented through a broad study design, as well as the
sampling, processing, and analysis of data.
3.1 Study design
With regards to the statistical nature of the objective presented in this thesis,
quantitative method was deemed the most appropriate approach to answer the
research questions. By using content analysis (Gratton & Jones, 2010), the aim
was to investigate the outcome of plate appearances based on the position of
shadows.
In the first phase of the study, statistical data was collected from past games in
Major League Baseball. The collected data was retrieved from the website
Baseball-Reference, which advertises itself as “The complete source for
current and historical baseball players, teams, scores and leaders.” (Baseball
Reference, N.D.a). The website collects and presents all numerical outcomes
and variables from Major League Baseball games since as early as 1876.
Another website used was MLB Film Room, as it provided necessary videos
and clips from as early as 2017. These videos were used to confirm whether
the conditions for the data collected were met, in the games that were analyzed.
These conditions will be further presented in the sampling section of this
chapter.
In the second phase, the collected data was processed to define the relevant
variables for this study. Since the objective of the study was to analyze the
outcome of plate appearances, the data was divided into good and bad
outcomes from the pitcher’s perspective, as well as outcome ratings of these
outcomes. In addition, shadows were defined as an independent variable, as it
is a dichotomous phenomenon: present, or not present.
In the third and final phase, the processed data was analyzed in SPSS, 25.0
(IBM SPSS Statistics, New York, USA). The Shapiro-Wilk Test was used to
10(40)determine the normality of the outcome variables in the sampled data. The
Mann-Whitney U-test was also applied to illustrate any possible difference in
the pitcher’s outcome variables when the shadow was and was not present.
These phases are explained in further detail below.
3.2 Sampling of data
As stated by Gratton and Jones (2010), data collected for quantitative studies
need to be sampled to properly represent the population of all available data.
Since the total sum of all baseball games was too large to analyze, data for this
study were sampled according to certain conditions. Firstly, the observed
sample was defined as any Major League Baseball game, in which a pitcher
threw at minimum three innings, and the shadows had to be both in and out of
play. Shadows being in play was defined as when the shadows are present at
any point between the pitcher’s mound and the batter’s box, as seen in figure
1. This definition is in line with previous research on the shadows affecting
play, as stated by Schifman (2019). Other sources, such as broadcasters or
general news articles that discuss the phenomenon also concur on this
definition (The New York Times, 2009; Major League Baseball, 2021).
Figure 1 - Shadows in play (Redbirdrants, 2009)
11(40)If the pitcher remains in the sun, and the batter’s box in the shadow, the
shadows are in play. Any other weather condition would deem the shadows
not being in play. If the weather suddenly got cloudy, for example, the
shadows would cover the whole field, thus not separating the pitcher and batter
resulting in the shadows not being in play.
After the inclusion criteria had been established, Baseball Reference in
combination with MLB Film Room were utilized to find games that matched
the established conditions. Due to the conditions, the sampling method used
for the study was systematic, to find any specific game that matched the
population. A systematic sampling method is a process of defining specific
inclusion criteria by which all samples used in the study must abide (Gratton
& Jones, 2010). However, since MLB Film Rooms database only records
pitches as far back as 2017, all data collected in this study are from games
2017 and onwards.
Since there are over 2400 games played every year in the Major Leagues,
several aspects affecting the weather conditions were identified to further
define which games matched the inclusion criteria. In total, 8 games were
found matching the inclusion criteria for this study. Within these 8 games, 13
different pitching performances and a total of 319 plate appearances were
analyzed.
3.2.1 Alignment of Major League Ballparks
In an article by Kagan (2014) the author explains how baseball stadiums are
built in accordance to rule 1.04 of the official rules of Major League Baseball
(2019) which states:
“It is desirable that the line from home base through the pitchers plate to
second base shall run East-Northeast.” (Major League Baseball, 2019)
Rule 1.04 determines at what angle the sun hits the field at certain times of the
day. Using data from Google Maps, Kagan established how each of the 30
12(40)ballparks aligned to the rule, as seen in figure 2. As most baseball games start
between 1:00 P.M. and 10:00 P.M. Eastern Time, ballparks that closely match
the rule would have the sun directly behind home plate between 3.00 and 4.00
P.M. Eastern Time. Thusly, games that start too early, or too late for the
shadows to be in play were disregarded for the study.
In figure 2, the red arrows represent
teams whose ballparks are called
domes, which are built with a
permanent or retractable roof, meaning
that the weather has almost no effect
on the games (Goodman &
McAndrew, 1993). Games that were
played in these ballparks were
disregarded for the study.
Additionally, Baseball Reference
provides information on any game’s
weather condition since at least 2017.
Figure 2 - Alignment of MLB Ballparks
(Kagan, 2014) Games that were not defined as
“sunny” could be disregarded before consulting MLB Film Room to confirm
if the shadows are in play at any point of the game since no sun means no
shadows.
3.2.2 Angles of sunlight
Another factor that proved important in sampling specific games was the time
of year at which the games are played. As the Major League Baseball season
stretches from late March to late October, sometimes even as late as early
November, the angle of the sun changes throughout the season. Schroeder
(2011) explains in his article how the sunlight hits the ground at different
angles at different times of the year. Late March and late September, for
13(40)example, are close to the equinoxes, meaning that sunlight hits the ground at a
larger area than they do in June, which is closer to the solstice.
The relevance of considering the sun’s angles is because it is the ballparks
themselves that cast the shadows on the field. If the sun is at too high of an
angle when baseball is played, fewer shadows will be created on the ground.
Games that are played closer to the equinoxes, however, will cause ballparks
to create more shadows on the ground, meaning that such games are more
probable to have shadows in play than those played in the middle of summer.
By utilizing the starting time of games, type of ballpark, time of year, and
weather conditions as metrics to find games matching the inclusion criteria,
the efficiency of the method was improved.
3.3 Processing of data
When the sampling process was completed, the processing of data could
commence. To establish a method for analyzing the data, plate appearances in
the games selected for the study had to be coded. The coding process was
based on the research objective and questions, meaning that plate appearances
were sorted by several aspects. These were shadows in play, outcome of plate
appearances, home or away, and rating of the outcome.
For every game selected, one pitcher on either or both teams had to pitch at
minimum three innings, and the shadows had to be both in and out of play
during these innings. For every game, each batter the pitcher faced was
numbered from 1 going up to as many total batters he faced in that game. This
was established through Baseball Reference and its record of the games chosen
for the study. To establish which of these plate appearances the shadows were
in play for, MLB Film Room was utilized. By searching the database for every
single plate appearance in each specific game, clips and videos showed
whether the shadows were in play. If the shadows were in play, that plate
appearance was marked as 1. If not, it was marked as 0. Based on this, a
14(40)categorical, dichotomous variable was created, due to shadows only having
two levels of variance.
As seen in Table 1, the outcome of each plate appearance was rated as good or
bad, from the pitcher’s and defensive team’s perspective. A good outcome was
marked as 1, meaning the batter was out. If the batter got on base, the outcome
was bad and marked as 0. Every outcome was then rated, based on how good
or bad the specific outcome was. These ratings ranged from 1, being the worst,
and 8 being the best. In addition, the ratings within good and bad outcomes
were rated based on how good or bad they were, as explained further below.
Table 1– Result of frequency tests between all outcome variables.
Rating
Outcome Type of play 1&0 1-8 1-4
Double play 1 8 4
Strike out 1 7 3
Good
Ground out 1 6 2
Fly out 1 5 1
Single 0 4 4
Walk 0 4 4
Hit-By-Pitch 0 4 4
Bad
Double 0 3 3
Triple 0 2 2
Home run 0 1 1
3.3.1 Definition of good outcomes
The rating of good outcomes was based on several aspects. Firstly, double
plays were ranked as the best outcome as the plate appearance resulted in two
outs. Triple plays were not included in this study, as they did not occur in the
games analyzed. They are, however, better than double plays as the plate
appearance results in three outs. Strike outs were rated slightly worse than
double plays, but better than both fly outs and ground outs. This is simply
because a strike out holds any possible baserunners to their base, meaning they
cannot advance or score based on the outcome of the plate appearance. A strike
out, however, only records one out so by definition a double play is better.
15(40)Ground outs were rated above fly outs, since a groundout is most likely hit to
an infielder, meaning a runner on second or third has a hard time advancing or
scoring. Fly outs, on the other hand, are more likely to be hit to the outfielders.
If a runner on base tags up before the ball is caught, he could advance or score,
meaning fly outs are slightly worse than ground outs. Even if a runner on base
scored a run due to the batter getting out, the plate appearance would still count
as good, since the plate appearance itself resulted in an out.
3.3.2 Definition of bad outcomes
Bad outcomes were also rated on several aspects. As Anstrom and Eisenstein
(2011) presents:
It seems intuitive that a triple is better than a double, which is better than
a single — observations that the batting average ignores. Other baseball
statistics, such as the slugging percentage, assign differing values to
different types of hits, with a double having twice, a triple having 3
times, and a home run having 4 times the value of a single (Anstrom &
Eisenstein, 2011).
The value of bad outcomes is, as the authors present, based on slugging
percentage, with home runs being valued the highest, and triples, doubles,
singles, walks, and hit by pitches all following suit.
It could be argued that walks and hit by pitches are worse than singles, as
singles are more likely to score runs than walks and hit by pitches. However,
unlike walks or hit by pitches, any base hit can result in outs as the ball is put
into play. A base runner on any base, or the batter himself, can be thrown out
when the ball is put into play via a base hit. When the batter is walked or hit
by a pitch, there is no chance for the defensive team to record an out. There is
also the argument presented by Themanson (2019) who explains how singles
are harder to attribute to the batter’s skill than a walk. Singles can sneak, fall,
squeeze or find a hole in the defense due to many aspects, whilst walks are
16(40)more easily attributable to the batter’s skill. Meanwhile, doubles, triples, and home runs all require the batter to hit the ball hard, far, or be extremely fast. Since a walk or hit by pitch also has the possibility of advancing or scoring base runners, and the batter reaches the same base as he does with a single, all three were valued the same in the outcome ratings. 3.4 Analysis of data Descriptive statistics, mean and standard deviation [SD], were calculated for the pitcher’s outcome variable. For all variables, frequencies and percentages were calculated in the analysis of data. The Shapiro Wilk was applied to assess the distribution of outcome variables. The test revealed that the outcome variables were not normally distributed, therefore the Mann-Whitney U test, a rank-based non-parametric test for independent samples, was used to illustrate any possible difference between the pitcher’s outcome when the shadow was and was not present. Statistical analyses were performed using SPSS, 25.0 (IBM SPSS Statistics, New York, USA) for Windows, and the alpha level was set at p
4 Results
The result of the study is based on the outcome of the different tests performed in
SPSS. These are illustrated and explained below.

The analysis of frequencies of all outcomes revealed that there was no major
difference in outcomes with or without the presence of shadows, as seen in
table 2. Some outcomes increase or decrease slightly based on the presence or
absence of shadows, which will be further discussed in the next chapter.
Overall, when high rated outcomes decrease, low rated outcomes increase,
thus balancing the rating of all good or bad outcomes, respectively.

Table 2 – Result of frequency tests between all outcome variables.
                             NO                            YES
                             Shadow                        Shadow
         Outcome             Frequency      Percent (%)    Frequency    Percent (%)
         BAD                 53             28.5           30           26.3
         GOOD                133            71.5           84           73.7
         Total               186            100.0          114          100.0

                             NO                            YES
         GOOD                Shadow                        Shadow
         Outcome             Frequency      Percent (%)    Frequency    Percent (%)
         Fly out             32             24.1           26           31.0
         Ground out          36             27.1           19           22.6
         Strike out          60             45.1           35           41.7
         Double play         5              3.8            4            4.8
         Total               133            100.0          84           100.0

                                  NO                             YES
   BAD                            Shadow                         Shadow
   Outcome                        Frequency       Percent (%)    Frequency   Percent (%)
   Hit-By-Pitch / Single / Walk   42              79.2           24          82.8
   Double                         4               7.5            3           10.3
   Triple                         2               3.8            -           -
   Home run                       5               9.4            2           6.9
   Total                          53              100.0          29          100.0

The Mann-Whitney U-test was then used to determine if there were significant
differences in the pitcher’s outcome when the shadow was and was not present,
as seen in table 3. Outcome ratings when shadow was present (mean rank =
149.4) and when it was not present (mean rank = 151.2) were not statistically
significantly different, U = 10478, z = -.175, p = 0.861. The same is the case

                                                                                       18(40)
for if the outcome was either good or bad (U = 10371, z = -.409, p = 0.683)
when the shadows were and were not present. There were no differences
neither in the pitchers good (U = 5318, z = -.634, p = 0.526), nor bad (U = 737,
z = -.442, p =0.658) outcome when the shadow was and was not present.
Table 3 – Result of Mann-Whitney U test in four pairs of non-parametric, independent variables.
SHADOW Mann- Asymp. Sig.
N Mean Rank Sum of Ranks Z
Presence Whitney U (2-tailed)
Good and Bad Shadow NO 186 151.17 28117.00
10478.00 -.175 .861
Outcome (1-8) Shadow YES 114 149.41 17033.00
Good and Bad Shadow NO 186 149.26 27762.00
Outcome (1 and 0) Shadow YES 10371.00 -.409 .683
114 152.53 17388.00
GOOD Shadow NO 133 111.02 14765.00
Outcomes (1-4) 5318.00 -.634 .526
Shadow YES 84 105.81 8888.00
BAD Shadow NO 53 42.09 2231.00
Outcomes (1-4) 737.00 -.442 .658
Shadow YES 29 40.41 1172.00
19(40)5 Discussion
In this section, the results, as well as methodological choices, are discussed.
5.1 Discussion of results
The main finding of this study is that there was no significant difference in the
pitcher’s outcome when the shadow was and was not in play during the plate
appearance. As opposed to the general assumption of how shadows affect the
outcome of plate appearances (Major League Baseball, 2021; Redbirdrants,
2012), the results indicate that shadows do not affect the outcome of plate
appearances. Based on the conducted study, it appears that shadows do not
create an advantage for pitchers, neither do they pose a disadvantage to hitters.
This was seen in multiple aspects.
Firstly, the shadows do not have a significant effect on whether a plate
appearance ends in a good or a bad outcome for the pitcher. This is the main
opposing argument to the existing consensus in baseball, which assumes that
the shadows are beneficial for the pitcher. As recent as April 26, 2021, a
pitcher for the Arizona Diamondbacks by the name of Maddison Bumgarner
threw a no-hitter, meaning he did not allow a single base-hit through the entire
game. In his post-game interview, he specifically says:
“…I want to thank the shadows in Atlanta. They helped me out a good bit, that
was pretty awesome…” (Bally Sports Arizona, 2021)
The quote above is an example of Major League Baseball’s attitude toward
shadows. The pitcher’s opinions are part of a wider argument which not only
broadcasters (Major League Baseball, 2021), but even players themselves
seem to share, on the topic of shadows (Redbirdrants, 2009).
Secondly, the result of this study illustrates that the ratings of outcomes,
whether good or bad, are not affected by shadows. For example, as seen in
table 2 of the result chapter, the rate of strike outs decreases with the presence
of shadows, further strengthening Schifman’s (2019) argument that batters do
20(40)not struggle to see the ball more in the shadows than out of it. In the analysis
of ratings within good and bad outcomes, the results showed that there was no
statistical significance in how good or bad the outcomes were, with or without
the presence of shadows. As seen in table 2, even if the amount of fly outs
increases with the presence of shadows, ground outs and strike outs decrease.
The same is seen for bad outcomes, in which singles, walks, hit-by-pitches,
and doubles increases with the presence of shadows, while triples and home
runs are less frequent.
Interestingly, the increase of fly outs would assumingly cause an increase of
home runs, as they are correlated according to statistics such as HR/FB%,
which calculates the number of home runs hit per every fly ball (Slowinski,
2010b). This, however, does not seem to be the case for games in this study,
as the rate of home runs goes down, while the amount of fly balls goes up with
the presence of shadows. According to the statistical metric of batted ball
velocity, which correlates the rate of hard-hit fly balls with the number of
home runs (Zola, 2020), we can assume that the decrease of home runs despite
the increase of fly balls are due to the batters hitting the ball at a slower velocity
in the presence of shadows. This could also explain the increase of doubles in
the presence of shadows, since a lower exit velocity of the batted ball results
in balls not traveling as far, thus resulting in either a fly out or a double.
If the ball is being hit at a lower velocity in the presence of shadows, it would
be indicative of the pitchers having an advantage in the shadows, despite what
the result of the study proves. As presented by Siegel (2015) the metric of exit
velocity has been popular in recent years to explain underlying numbers to
traditional statistics. A higher exit velocity increases the probability of getting
a base hit, as well as the probability of hitting a home run. If the batters are
hitting the ball at a lower velocity in the shadows, they would statistically have
a lower chance of getting a base hit. As the result shows, however, neither
21(40)good nor bad outcomes change significantly with the presence or absence of
shadows.
A similar statistical indifference is found in the frequencies of ground outs
versus double plays, as seen in table 2. While double plays are not necessarily
started on a ground ball hit to a fielder, a decrease of ground outs should
suggest that double plays increase as well, which is not the case for this study.
Double plays, however, are the result of a previous batter reaching base before
the current plate appearance, meaning that the decrease in double plays could
simply be a coincidence and not correlated to the change in the rate of ground
outs.
While the results prove that shadows do not influence the outcome of plate
appearances, several other factors are excluded in this study. As previously
stated, exit velocity is a statistical metric that correlates to the rate of base hits
and home runs. Even if the rate of such outcomes does not increase with the
presence of shadows, exit velocity could still be indicative to explain whether
the pitcher is at an advantage in the shadows.
Another possible factor that could affect the result is the fatigue of the pitcher
at different points in the game. For instance, the pitcher is more likely to be
less fatigued at the start of the game than he is at the end of his appearance
(Whiteside et al., 2016; Bradbury & Forman, 2012). Birfer et al. (2019)
illustrate how fatigue levels have linear codependency with decreased
performance, as pitch counts, and innings thrown increase.
Due to this, if shadows are present at the start of the game, they may not have
the same effect on the outcome of plate appearances as they would if they were
present at the end. This is simply because different pitchers in this study are
most likely at different levels of fatigue when the shadows are present. Since
the games selected for this study had to have shadows both present and absent
22(40)but could appear at different points of the game, the level of fatigue for pitchers
could be a confounding variable for the outcome of plate appearances.
Furthermore, the defensive aspect of baseball is not taken into consideration
when analyzing the significance of outcome variables. There is a multitude of
defensive metrics in baseball statistics, each explaining their specific aspect of
the game. These include, but are not limited to, fielding average, range factor,
and zone rating (Baseball Almanac, N.D.). Each of these metrics measures
different facets of the defensive fielder such as how good he is at catching the
ball, how far he can throw and how good his positioning is in comparison to
the balls hit towards him. What they all have in common, however, is they
measure the value defensive plays have on the outcome of the game.
As previously discussed, outcomes of plate appearances are impossible to
credit to only the pitcher or batter. A single can find a hole and drop for a base
hit, while a double play just as easily could be a single if the fielder’s
positioning or fielding ability was any different. Therefore, stating that the
pitcher or batter is at an advantage in the shadows should be taken with
caution, as the study conducted did not consider defensive factors. If statistical
metrics such as Batting Average on Balls In Play or Net Expected Run Value,
which were discussed in previous research, were also applied to the outcome
of each outcome in this study, other results than the ones presented may have
been evident.
Whilst the main finding of this study is that there was no significant difference
in the outcome of plate appearances when the shadow was and was not present,
it should be taken with caution. Further research on the topic of shadows is
necessary to reach a statistical conclusion.
5.2 Discussion of method
Quantitative method is defined as the collection of numerical data based on an
objective view of reality (Bryman, 2011). Since the empirical data collected
23(40)for this thesis is numerical and of a statistical nature, it seemed only logical to
apply quantitative method to this study.
The purpose of this thesis was to determine value from and reach a conclusion
based on pre-existing statistics, meaning that content analysis of statistics
proved to be the optimal collection method (Gratton & Jones, 2011). For
content analysis, the data sets, codes, and categories used in this thesis are
identified according to previous research and theories on baseball statistics.
As with any research method, however, content analysis is disadvantageous in
its own way. An inappropriate sampling of the data or failure to acknowledge
confounding variables that may influence the outcome of the analysis may
cause the result of the study to be illegitimate.
5.2.1 Discussion of variables
The most critical aspect of the method is the exclusion of other variables apart
from the strict outcome of plate appearances. If more statistical aspects, such
as exit velocity, defensive factors, or batting average on balls in play, were
included in this study, different results may or may not have been revealed.
The variables included in this study were chosen based on their direct effect
and correlation to good and bad outcomes. For the pitcher, a hit, walk or hit by
pitch is bad, while an out is good. To include all possible variables that may
or may not influence the outcome of plate appearances, however, is not as
simple. While increased exit velocity, for example, increases the probability
for the batter to get on base (Siegel, 2015), it does not always result in a good
outcome for the batter. Therefore, such variables were excluded from this
study, whilst remaining highly relevant for further research within this topic.
While the ratings of all outcomes analyzed in this study are based on the nature
of baseball as well as previous research, not all outcomes are equal. For one,
the difference between a good or a bad outcome for the pitcher is much bigger
than the difference in ratings between the lowest-rated good outcome, fly outs
24(40)(5), versus the highest-rated bad outcome, singles, walks, or hit-by-pitches (4).
If a pitcher were to get 27 good outcomes in a row, he would have pitched a
perfect game and led his team to the win. Such a feat has only been achieved
23 times in over 200’000 games played since the start of the modern era of
1901 (Baseball Reference, N.D.b). If a pitcher were to get 27 bad outcomes in
a row, he would have given up at minimum 24 runs and the game would still
be in the first inning without any outs recorded. Thus, the difference between
a 4 and a 5 in the rating of all possible outcomes does not fully illustrate the
significance of a plate appearance ending in a good or bad outcome. This,
however, is also considered in the analysis of the data, since the frequency of
good and bad outcomes also showed no statistical significance.
5.2.2 Discussion of sources
In the study conducted, popular culture references have been avoided as far as
possible, especially when developing a foundation for the objective and
research questions through previous research. While baseball statistics may be
a thoroughly researched topic, most sources that explain specific statistical
aspects are not scientifically reviewed. In this study, scientifically reviewed
articles and books were used in combination with baseball statistics to argue
or present established perspectives within the sport.
5.2.3 Delimitations and limitations
A delimitation for this study has been to analyze the outcome of plate
appearances using only the independent variables of shadows. Thus, other
factors such as wind, fatigue, opponent’s win percentage, or fielding quality
have not been considered as variables that may affect the outcome of plate
appearances. These factors could be relevant to analyze in a similar context of
what affects the outcomes of plate appearances, but since this has not been the
focus, as the aim of the thesis is to strictly analyze whether shadows affect the
outcome of plate appearances, such factors were excluded from the research.
25(40)A limitation for this study was the availability of visual data only stretching as
far back as 2017. MLB Film Room proved to be a valuable source for this
study, as the data gathered from the analyzed games could be verified through
MLB Film Room to determine whether the shadows are present. However, as
MLB Film Room is the only source for these videos, and it began collecting
the data in 2017, no game prior to 2017 was included in this study.
26(40)6 Conclusions
In this section, the conclusions based on the result and discussion are presented, as
well as implications for further research.
The main finding of this study is that there was no significant difference in the
outcome of plate appearances when the shadow was and was not present. This
finding is not in line with current opinions of Major League Baseball and its
players, coaches, or broadcasters (Bally Sports Arizona, 2021; Branch, 2009;
Major League Baseball, 2021; New York Times, Redbirdrant, 2009).
Many factors, on top of the variables taken into consideration for this study,
have a clear effect on the outcome of plate appearances. This seems to be the
case whether the shadows are present or not. Based on the study conducted, it
is impossible to conclude that simply adding or subtracting the shadows from
the equation of plate appearances, creates an advantage for either side of the
field. Analysis of which factors may affect the outcome of plate appearances,
and considering such factors, is required to create a more distinct result of how
large the effect of shadows is.
The answer to the first research questions for this study is that too many other
factors need to be taken into consideration to prove whether shadows does
affect the outcome of plate appearances. With the variables selected for this
study, however, no statistical significance was found with or without the
presence of shadows.
To answer the second research question, further research needs to be made to
reach a conclusion on the topic. If managers were to augment their strategy
based on this study alone, it would be recommended that they explain to their
batters, specifically, that the shadows do not affect their ability at the plate.
For pitchers, it might be a different problem. Even if further research were to
prove that shadows do not affect the outcome of plate appearances, it is unclear
if managers should continue to let their pitchers believe they are at advantage
27(40)in the shadows. Whether they perform better or not, thinking they are at an
advantage, is uncertain.
6.1 Implications for further research
As far as the results of this study show, it seems to point in the opposite
direction to the general assumption of Major League players and broadcasters.
If the shadows do not affect the outcome of plate appearances, it would
disprove any argument which states that such shadows impact the game
overall. Regardless of the shadows affecting the outcome of the game, the
widespread claim that the weather phenomena act in the pitcher’s favor could
be a placebo effect. Any bad outcome, for the batter, could be explained away
by the presence of shadows, and a good outcome would be credited to the
batter’s skill, rather than the pitcher making a mistake in such a situation. If
such a placebo effect exists in Major League Baseball, regarding the effect of
shadows, is unclear at this moment. It would, however, be an interesting topic
for further research.
Exit velocity is a variable not accounted for in this study, as the data for every
batted ball is not available publicly. However, it could be a deciding factor in
whether the pitcher has the advantage in the shadows or not. Incorporating
variables such as exit velocity, among others, could be of interest for research
within the topic of shadows in the future.
It could be interesting for further research to interview Major League pitchers
to see if they prefer pitching when the shadows are present. Such a study could
comprehensively show whether a consensus exists within Major League
Baseball. Based on such research, it could be further applied in combination
with studies that prove or disprove the shadows effect on the outcome of plate
appearances, to reveal whether a placebo effect exists surrounding the topic in
question.
28(40)Further research on this specific topic should include other statistical metrics
into the calculation, such as exit velocity and defensive factors. Currently, in
addition to Schifman’s (2019) article on the phenomenon, this study can serve
as a basis for further research on this topic. To determine what underlying
aspects affect the outcome of plate appearances is not a small task, as there are
plenty of factors other than statistics to take into consideration. I suggest that
further research assume that shadows do not play a part in the outcome of plate
appearance, but question that hypothesis, whilst adding more factors into the
equation.
29(40)7 References
Alamar, B., Ma, J., Desjardins, G., Ruprecht, L. (2006) Who Controls the
Plate? Isolating the Pitcher/Batter Subgame. Journal of Quantitative Analysis
in Sports, 2 (3). https://doi-org.proxy.lnu.se/10.2202/1559-0410.1012
Albert, J., Bennett, J., Cochran J. J. (Ed.) (2005). Anthology of Statistics in
Sports. American Statistical Association and the Society for Industrial and
Applied Mathematics.
Anstrom J. K., Eisenstein L. E. (2011). From batting average to wins above
replacement to composite end points – refining clinical research using
baseball statistical methods. American Heart Journal, 161(5), 805-806.
https://doi-org.proxy.lnu.se/10.1016/j.ahj.2011.01.023
Arth W. Z., Billings C. A. (2020). Batting Average and Beyond: The
Framing of Statistics Within Regional Major League Baseball Broadcasts.
International Journal of Sport Communication, Ahead of print. https://doi-
org.proxy.lnu.se/10.1123/ijsc.2020-0112
Bahill, A., Baldwin, D., Venkateswaran, J. (2005). Predicting a Baseball's
Path: A batter watches the pitcher's motion plus the spin on the ball to
calculate when and where it will cross the plate. American Scientist, 93(3),
218-225. Retrieved May 10, 2021, from
http://www.jstor.org/stable/27858576
Bally Sports Arizona [BallySportSAZ]. (April 26, 2021). The perfect answer
for the perfect day [Twitterpost].
https://twitter.com/BallySportSAZ/status/1386448705092472833
Baseball Almanac. (N.D.). Defensive Stats 101. Baseball Almanac.
https://www.baseball-almanac.com/stats3.shtml
Baseball Reference. (N.D.a). Baseball stats and history. Baseball Reference.
https://www.baseball-reference.com/
30(40)Baseball Reference. (N.D.b). No-Hitters and Perfect Games. Baseball
Reference. https://www.baseball-reference.com/friv/no-hitters-and-perfect-
games.shtml
Bradbury C. J., Forman L. S. (2012). The Impact of Pitch Counts and Days
Rest on Performance Among Major-League Baseball Pitchers. Journal of
Strength and Conditioning Research, 26(5), 1181-1187. DOI:
10.1519/JSC.0b013e31824e16fe
Branch, J. (October 9, 2009). Afternoon Starts Put Shadows in Plat. The New
York Times.
https://www.nytimes.com/2009/10/07/sports/baseball/07shadows.html
Bryman, A. (2011). Samhällsvetenskapliga metoder (2nd ed.) Stockholm:
Liber.
Butterworth L. M. (2010). Baseball and Rhetorics of Purity.
https://books.google.se/books?hl=sv&lr=&id=Xv73owGa3IMC&oi=fnd&pg
=PR7&ots=N4LV3IfpDE&sig=kO2hE56oZrs3Os6nBgSHqANboY0&redir_
esc=y#v=onepage&q&f=false
Caporale, T., Collier C. T. (2012). Scouts versus Stats: the impact of
Moneyball on the Major League Baseball draft. Applied Economics, 45(15),
1983-1990. https://doi-org.proxy.lnu.se/10.1080/00036846.2011.641933
Davis, D. (N.D.). Top baseball players of past 69 years. Lehigh University.
https://www.lehigh.edu/~dmd1/baseball.html
Fagan, F., Haugh, M., Cooper, H. (2019). The advantage of lefties in one-on-
one sports. Journal of Quantitative Analysis in Sports, 15(1), 1-25.
https://doi-org.proxy.lnu.se/10.1515/jqas-2017-0076
Goodman H. G., Mcandrew T. F. (1993). Domes and Astroturf. Environment
and Behavior, 25(1), 121-125. DOI: 10.1177/0013916593251006
31(40)Gratton, C., Jones, I. (2009). Research methods for sports studies (2nd ed.).
https://ebookcentral-proquest-com.proxy.lnu.se
Grosshandler, S. (N.D.). Unsung Heroes: No-Hit Catchers. SABR. Retrieved
May 10, 2021, from http://research.sabr.org/journals/unsung-heroes-no-hit-
catchers
Hoffmann, F., Rielly J. E., Manning J. M. (2003). Baseball and American
Culture. https://ebookcentral-proquest-com.proxy.lnu.se/lib/linne-
ebooks/reader.action?docID=1588497&ppg=16
Huber R. M.., Sturdivant. X. R. (2010). Building a Model for Scoring 20 or
More Runs in a Baseball Game. The Annals of Applied Statistics, 4(2), 791-
804. Retrieved May 10, 2021, from https://www.jstor.org/stable/29765530
IMDB. (May 10, 2021). Moneyball. https://www.imdb.com/title/tt1210166/
Jensen T. S., Shirley E., K, Wyner J. A. (2009). Bayesball: A Bayesian
Hierarchical Model for Evaluating Fielding in Major League Baseball. The
Annals of Applied Statistics, 3(2), 491-520. Retrieved May 10, 2021, from
http://www.jstor.org/stable/30244253
Jones B. M. (2015). The Home Advantage in Major League Baseball.
Perceptual & Motor Skills, 121(3), 791-804. DOI:
10.2466/26.PMS.121c25x1
Kagan, D. (July 30, 2014). Lost in the Sun: The Physics of Ballpark
Orientation. The Hardball Times. https://tht.fangraphs.com/lost-in-the-sun-
the-physics-of-ballpark-orientation/
Kelly W. W. (2007). Is baseball a global sport? America’s ‘national pastime’
as global field and international sport. Global Networks, 7(2), 187-201.
Retrieved May 10, 2021, from https://onlinelibrary-wiley-
com.proxy.lnu.se/doi/epdf/10.1111/j.1471-0374.2007.00164.x
32(40)You can also read