Network Islanding Investigation Feasibility study report - Western Power Distribution
←
→
Page content transcription
If your browser does not render page correctly, please read the page content below

Western Power Distribution
 Network Islanding Investigation
 Feasibility study report

 September 2019

Glossary
Acronym Definition
ADMD After Diversity Maximum Demand
BSP Bulk Supply Point
CBA Cost Benefits Analysis
CCGT Combined Cycle Gas Turbine
CHP Combined Heat and Power
DER Distributed Energy Resources
DG Distributed Generation
DNO Distribution Network Operator
DSO Distribution System Operator
DUOS Distribution Use of System
EfW Energy from Waste
EHV Extra High Voltage
EMID (Western Power Distribution) East Midlands
ESCo Energy Service Company
ESO Electricity System Operator
GSP Grid Supply Point
LDC Load Duration Curve
LTDS Long Term Development Statement
MD Maximum Demand
MPAN Meter Point Administration Number
MW Mega Watt
NIC Network Innovation Competition
NMS Network Management System
NPV Net Present Value
NTBM Non-traditional Business Model
OCGT Open Cycle Gas Turbine
O&M Operation and Maintenance
PCC Point Common Coupling
PMR Pole Mounted Recloser
S STN Substation
STOR Short Term Operating Reserve
TDCV Typical Domestic Consumption Value
TUOS Transmission Use of System
UOS Use of Systen
WPD Western Power Distribution

 GHD | Report for Western Power Distribution - Network Islanding Investigation, 125/040/18 | i
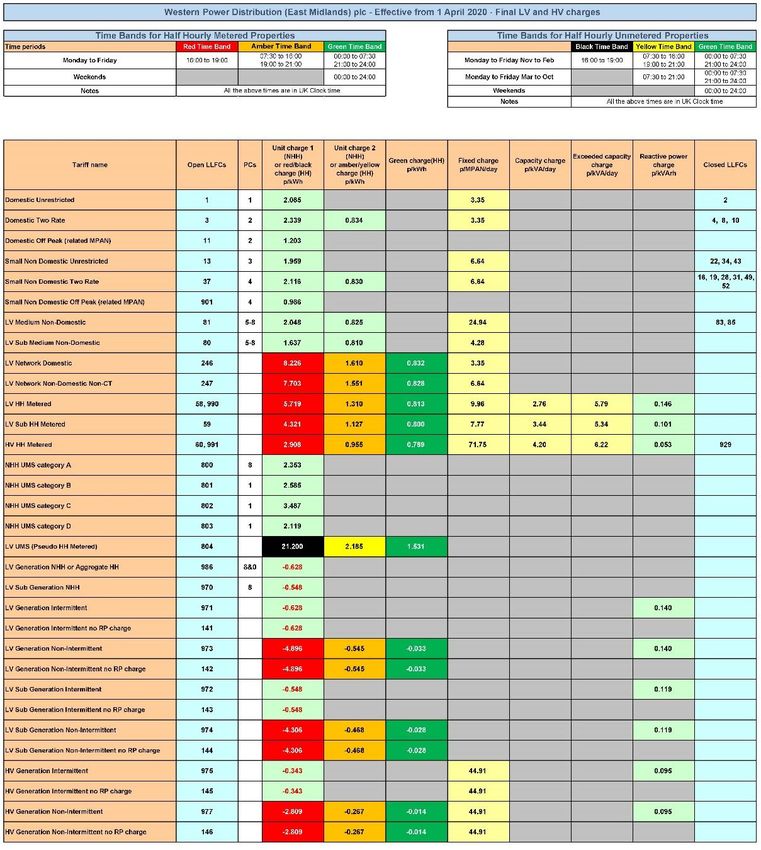
Table of contents
 Glossary .................................................................................................................................................... i

 1. Introduction..................................................................................................................................... 4
 1.1 Context of project ................................................................................................................. 4
 1.2 The aim of this report ........................................................................................................... 4
 1.3 Scope of the study ............................................................................................................... 5
 1.4 Tasks and deliverables ........................................................................................................ 5

 2. Identification of trial areas .............................................................................................................. 6
 2.1 Methodology to identify trial areas ....................................................................................... 6
 2.2 High level considerations ..................................................................................................... 9
 2.3 Technical criteria for network islands ................................................................................... 9
 2.4 Site selection ........................................................................................................................ 9
 2.5 Assessment of specific technical requirements ................................................................. 10
 3. Feasibility Study ........................................................................................................................... 14
 3.1 Methodology to undertake Feasibility Study ...................................................................... 14
 3.2 Plan to implement network islanding ................................................................................. 16
 3.3 Assessment of financial benefits ....................................................................................... 21
 3.4 Cost benefit analysis and investigation of the optimum scale of network islands ............. 27
 3.5 Further high level review .................................................................................................... 32

 4. Conclusions .................................................................................................................................. 37
 4.1 Findings ............................................................................................................................. 37
 4.2 Next steps .......................................................................................................................... 38

Table index
 Table 1-1 Network Islanding Investigation tasks ...................................................................................... 5

 Table 2-1: Selected network islands ...................................................................................................... 10

 Table 2-2: Selected new development islands ....................................................................................... 10

 Table 3-1: Fixed capex items ................................................................................................................. 17

 Table 3-2: Variable capex items ............................................................................................................. 18

 Table 3-3: WPD (EMID) DUOS charges ................................................................................................ 18

 Table 3-4: Generator unit costs .............................................................................................................. 20

 Table 3-5: Summary of NPV analysis results ......................................................................................... 27

Figure index
 Figure 2-1: Illustration of methodology adopted to identify potential trial areas ....................................... 8

 ii | GHD | Report for Western Power Distribution - Network Islanding Investigation, 125/040/18

Figure 2-2: Measured data (full year) for EM4 (Halfway, Sheffield) ....................................................... 11

 Figure 2-3: Measured data (week) for EM4 (Halfway, Sheffield) ........................................................... 11
 Figure 2-4: Measured data (day) for EM4 (Halfway, Sheffield) .............................................................. 11

 Figure 3-1: Illustration of methodology adopted for Feasibility Study .................................................... 15

 Figure 3-2: Measured data for the annual total demand of Halfway (2018) .......................................... 21
 Figure 3-3: Representative illustration of load duration curve (3-block representation) ........................ 22

 Figure 3-4: Representative illustration of load duration curve (merit order stack
 representation) ................................................................................................................... 23
 Figure 3-5: Comparison between measured and modelled substation demand for EM4
 (Halfway) ............................................................................................................................ 23

 Figure 3-6: Comparison of load duration curves for demand and generation for EM4 .......................... 24

 Figure 3-7: Illustration of DG lost revenue ............................................................................................. 26

 Figure 3-8: Centralised energy market with key parties and activities in electricity industry ................. 33

 Figure 3-9: NTBM to accommodate network islanding in the centralised energy market ...................... 34

 Figure 3-10: Illustration of interaction between parties in case of Licence Lite Supplier
 arrangement ....................................................................................................................... 35

 Figure 4-1: Annual LDC for EM1 ............................................................................................................ 60
 Figure 4-2: Total measured generation for EM1 (annual) ...................................................................... 61

 Figure 4-3: Total measured generation for EM1 (one-week – 19/02/2018 to 25/02/2018) .................... 61

 Figure 4-4: Illustration of power flows (non-islanded scenario) .............................................................. 66

 Figure 4-5: EM1 load and generation LDCs (non-islanded scenario) .................................................... 66

 Figure 4-6: Illustration of power flows (islanded scenario) ..................................................................... 69

 Figure 4-7: EM1 load and generation LDCs (islanded scenario) ........................................................... 69

Appendices
 Appendix A - Trial areas – supporting material

 Appendix B – Schedule of WPD (EMID) DUOS Charges

 Appendix C - Feasibility Study analysis worked example – EM1

 GHD | Report for Western Power Distribution - Network Islanding Investigation, 125/040/18 | iii
1. Introduction 1.1 Context of project Around the world, low carbon technologies have led to a trend of generating power locally to customers from Distributed Generation (DG) connected to the distribution system, including renewable energy resources. Due to rapid demand growth, the system requires an increasing amount of generation. Enhanced use of renewable generators within distribution networks calls for a growing level of network flexibility, whilst maintaining the existing standard for safety. It is expected that the utilisation of Distributed Energy Resources (DER) will support the transition to generate low carbon power with much lesser environmental impact and lower costs for customers. Islanding of DG under current practice should be avoided. Typical safety schemes for DG include under/over voltage and under/over frequency protection, which prevent continued supply to customers in an islanded section of the network. In addition, Loss of Grid protection ensures that disconnected circuits remain de-energised and thus enabling a safe and secure network. The Network Islanding Investigation project aims to understand whether intentional islanding of certain sections of network would allow them to be operated in a safe and secure manner, and whether this represents a new tool for Distribution Network Operators (DNOs) to increase network flexibility. The theory is that network islanding could provide significant benefits for customers and support DNOs with the transition to Distribution System Operator (DSO). 1.2 The aim of this report The aim of this report is to investigate the feasibility of network islanding by implementing a Cost Benefit Analysis (CBA) of the approach when applied to selected trial networks. The report describes the methodology that has been employed; the technical criteria and assumptions that have been used; and the subsequent results of the CBA along with associated commentary. More specifically, the report aims to formally document: The methodology for identification of possible trial networks for the study; The identification of technical criteria to allow the selection of the trial networks for the study; The assumptions used to underpin the technical requirements for the formation of the islands and implementation of the financial analysis; The methodology used to implement the CBA; and Discussion of the results of the analysis including: o Commentary on the optimum scale of network islands to maximise customer benefit; o Review of the legal, regulatory and commercial arrangements related to network islanding; and o Review of the requirements for stakeholder engagement. GHD | Report for Western Power Distribution - Network Islanding Investigation, 125/040/18
1.3 Scope of the study
The financial analysis will be applied to two types of network island:
 1. Islands formed from existing distribution network (existing islands). These are sections
 of existing network that have controllable DG that can be isolated from the main
 interconnected system for customer benefit; and
 2. Islands formed from new developments connecting to the distribution network (new
 development islands). These are new residential, commercial and/or industrial
 developments that could be operated isolated from the main interconnected system for
 customer benefit.

1.4 Tasks and deliverables
Table 1-1 highlights task 4 of the Network Islanding Investigation project, which is the subject of
this report.
Table 1-1 Network Islanding Investigation tasks

 Task 1: Data Gathering

 Task 2: High-Level Review

 Task 3: High-Level Research and Analysis

 Task 4: Feasibility Study

 Task 5: Further Investigation

 Task 6: Network Modelling

 Final project deliverable: Network Islanding Investigation Findings Report

 GHD | Report for Western Power Distribution - Network Islanding Investigation, 125/040/18 | 5
2. Identification of trial areas The following sub-sections describe the methodology adopted and results of the assessment to identify potential trial areas for implementation of network islanding. The methodology for the identification of potential trial areas looks to achieve a broad range of candidates with different characteristics, to provide an opportunity to investigate the extent of the feasibility of islanding. The potential areas identified in this section were carried forward to provide a realistic basis for the subsequent assessments, as follows: Plan to implement network islanding, presented in section 3.2; Preliminary quantification of financial costs and benefits, presented in section 3.2 and 3.3; and Investigation of the optimum scale of network islands, presented in section 3.4. 2.1 Methodology to identify trial areas The following methodology was developed for the identification of suitable network islanding trial areas: 1. A set of criteria was developed that allowed the identification of a shortlist of networks suitable for the implementation of islanding. These are as follows: a) a) Existing network islands: areas were sought from information available from the Long Term Development Statement (LTDS) and the WPD DG register: i. With capability to be isolated from the main interconnected system safely and without disruption to customers; and ii. With installed capacity of controllable generation1 greater than 150% of the peak demand. b) New development islands: areas were sought from public information produced by private developers and local authorities: 2 i. For planned developments of more than 3,000 dwellings, i.e. those that were deemed to have sufficiently high demand for electricity and high likelihood of development of generation capacity. 2. A data request was issued to WPD for EMU/PowerOn diagrams of the shortlisted areas and MW half-hourly data for the generation export and loads contained within them; 3. The shortlisted trial networks were then investigated in greater detail. This was carried out to understand whether the sites had the required technical characteristics to be considered for the study: a) For existing network islands: the EMU/PowerOn diagrams received from WPD were reviewed to confirm the switching arrangements required to form the island and whether this could be implemented safely and practically on the system. In addition, the completeness of the half-hourly data supplied by WPD was reviewed to understand whether it would be possible to implement the CBA. In cases where 1At this stage potential islands considered have exclusively comprised generation whose output can be controlled by changing the input of the fuel source, for example CHP, energy from waste, landfill gas. 6 | GHD | Report for Western Power Distribution - Network Islanding Investigation, 125/040/18
insufficient data was available and it was deemed that realistic assumptions could
 not be made, candidate islands were not taken forward for site selection.

b) For new development islands: a further review of the publically available
 documentation was undertaken to understand the exact number of dwellings and
 type of installations (i.e. commercial, industrial) contained within each of the
 shortlisted candidate sites. The sites used for the feasibility study were those that
 had detailed information on the aforementioned so that the feasibility study could
 be performed.

 GHD | Report for Western Power Distribution - Network Islanding Investigation, 125/040/18 | 7
INPUT 1: LTDS INPUT 2: EMU/PowerOn INPUT 3: Exported
 diagrams measurement data

 Criteria: controllable Verify switching
 EXISTING arrangements for Assessment of demand
 Assessment of
 generation installed Further data request Select trial areas generation control
 NETWORK ISLANDS capacity vs demand identified potential trial and generation dispatch
 methods
 areas, and compatibility profiles
 with WPD system

 INPUT 4: Public
 Information

 NEW Assumptions about
 Review public
 Criteria: size of realistic characteristics
 DEVELOPMENT information on Select trial areas
 development of future network
 ISLANDS developments
 developments

 Identification of criteria Verification of technical
 Identification of high-
 for characteristics of characteristics of
 OUTPUTS level considerations for Assessment of specific technical requirements for identified areas to provide final list of
 areas suitable for identified potential trial identified potential trial areas to be carried forward
 potential trial areas
 network islanding areas

 Figure 2-1: Illustration of methodology adopted to identify potential trial areas

GHD | Report for Western Power Distribution - Network Islanding Investigation, 125/040/18
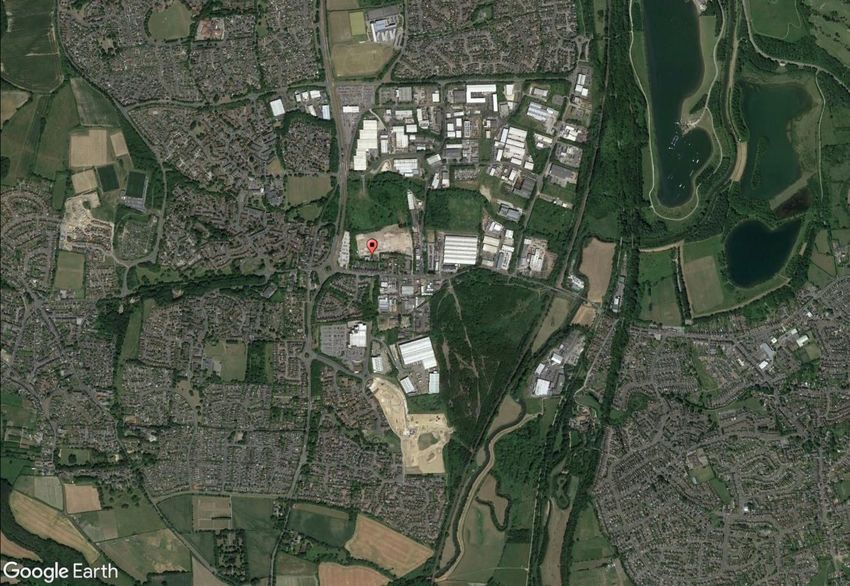
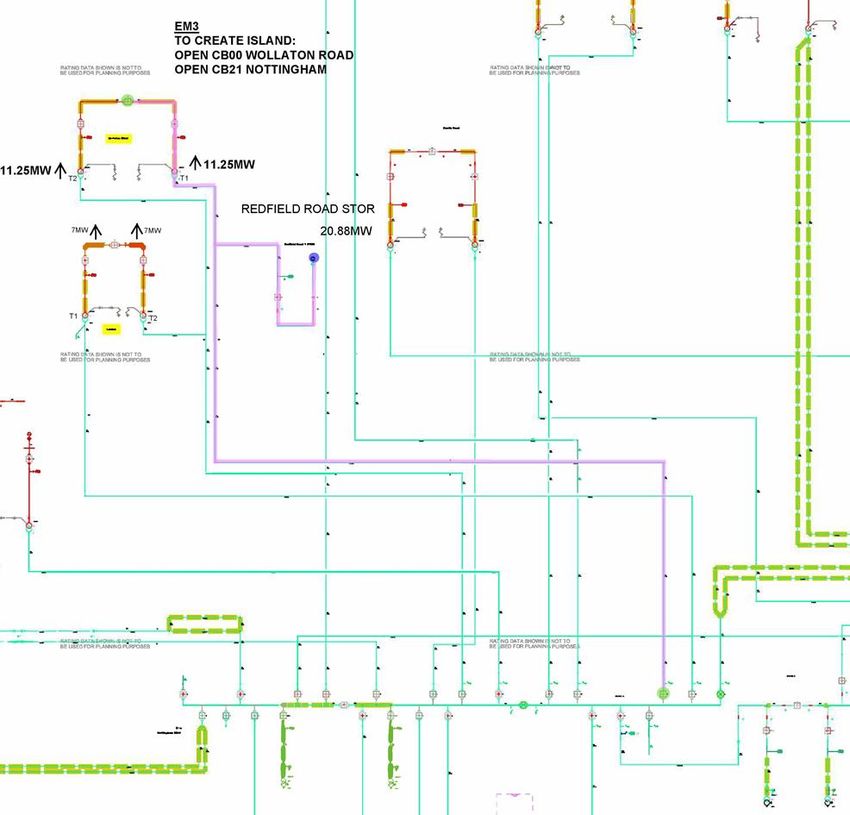
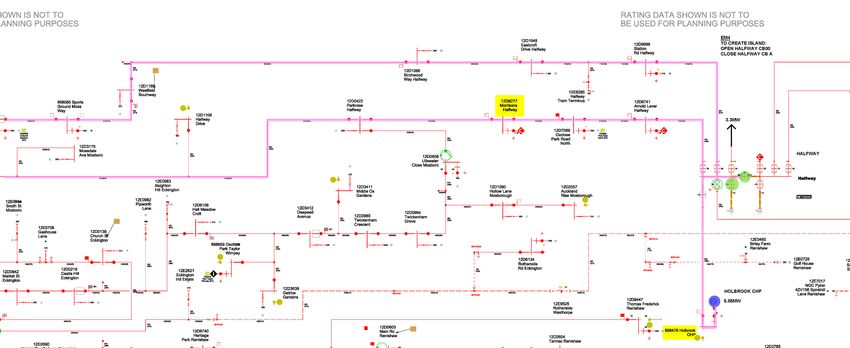
2.2 High level considerations Building on earlier work, and as agreed during the project meeting on 30/04/2019, the following high level considerations will be addressed in this Feasibility Study relating to implementation of network islanding: Applied to both existing network and new developments; At the behest of WPD, to provide financial benefits to WPD’s customers; and In the context of existing legal, regulatory and commercial arrangements, with required changes identified. 2.3 Technical criteria for network islands This study has focussed on the identification of network islands on WPD’s 33kV distribution network. The motivation for this was twofold: The majority of controllable DG is connected at this voltage level. Therefore, this voltage level was chosen to ensure there was a large selection of networks for inclusion in the feasibility study; and To understand the benefits of islanding in the most likely real-world trial scenario. Islanding is most likely to be trialled on the 33kV network because the trial areas are more manageable in size (compared with 11kV networks) and the impact on customers is much lower (compared with the 132kV and 66kV networks). Application of network islands on the 11kV network was investigated at the early stages of the feasibility study, however, it was found that the data required for CBA analysis was either not available or not sufficiently accurate/complete. It was, therefore, decided that 11kV network islands would not be investigated further in the feasibility study. A set of high level criteria has been proposed in this study to define the technical characteristics of potential trial islands. These criteria are a common set of rules that have allowed the process to select trial islands to be carried out. The criteria are as follows: The trial network islands must have at least one controllable DG; The installed capacity of controllable DG needs to be greater than 1.5 times the peak demand for the sum total of the loads within the island; and Only new developments with greater than 3,000 homes are considered to have sufficiently high electricity demand to be considered for a new development island. A combination of the WPD LTDS and detailed DG register was reviewed to generate a shortlist of candidate networks that were recorded and taken forward for more detailed investigation. 2.4 Site selection 2.4.1 Existing network islands As previously discussed, the LTDS and detailed DG register was used as an initial step to identify potential islands that could be included in the feasibility study. This analysis generated a number of potential islands on the 33kV network that could be supplied from local controllable DG. A shortlist of suitable islands was created on the basis of this detailed review. A data request was submitted to WPD for a full year (2018) of half-hourly MW data for the demands and generators contained within the shortlisted islands as well as EMU/PowerOn diagrams for the selected areas. The MW data was required to perform the feasibility study analysis that forms the basis of this report. GHD | Report for Western Power Distribution - Network Islanding Investigation, 125/040/18
The next step was to review the EMU/PowerOn diagrams of the shortlisted networks. This more
 detailed review enabled verification of whether the islands could be implemented practically by
 investigating the switching arrangements that would have to be performed to create the islands.
 Table 2-1 provides the details of the islands that were selected for analysis in this feasibility
 assessment. Further details about the characteristics of these islands are provided in Appendix
 A.
 Table 2-1: Selected network islands

 Island Licence Area Generator Generation Capacity / Load
 Code Area Name type scale Supplied
 (Primary /
 MW)
 EM1 East Wellingborough Wykes Biomass CHP 25.00 MW @ Sharnbrook /
 Midlands Generation 33 kV 5.6
 Harrold / 1.5
 EM2 East Wellingborough Wykes Biomass CHP 25.00 MW @ Little Irchester
 Midlands Generation 33 kV / 14.8
 EM3 East Nottingham Redfield Road Dedicated 20.88 MW @ Wollaton
 Midlands 1 STOR Biomass 33 kV Road / 22.5
 EM4 East Halfway, Holbrook Biomass CHP 5.85 MW @ Halfway TA /
 Midlands Sheffield 33 kV 3.3

 2.4.2 New development islands

 A list of new developments in WPD’s licence areas was produced by researching publically
 available documentation from the construction and house building industry as well as from local
 council planning applications. The developments within WPD’s licence areas that had sufficient
 information about the number of dwellings and conformed to the high level criteria were selected
 for this study. Table 2-2 provides details of the new developments that could form potential new
 development islands.
 Table 2-2: Selected new development islands

 Island Location Generation / Capacity / scale
 Code development type
 - 2022 Commonwealth Games Sport Village 3,000 homes and sport centre
 Village, Birmingham
 - Ashton Green next to Leicester Urban Village Up to 3,000 homes and
 commercial sites extended to
 130 hectors
 - Fairham Pasture, Rushcliffe Homes and workplaces 3,000 homes, 100,000 sq.
 Borough Council meters area
 - Great North Zone, Swansea Housing development 4,979 homes
 City
 ND1 Representative new Housing development plus 3,000 homes
 development typical facilities

 2.5 Assessment of specific technical requirements

 2.5.1 Assessment of demand and generation dispatch profiles

 Analogue measurement data requested for each potential area were assessed to gain an
 understanding about the historic profiles of demand and generation dispatch in the relevant
 areas of the network.

 In the first instance, where measured data were provided they have been plotted and reviewed
 for consistency and to identify figures that may correspond unusual system behaviour or data

10 | GHD | Report for Western Power Distribution - Network Islanding Investigation, 125/040/18
issues. Filtering of data included replacements or correction of unrealistic measurements,
according to neighbouring data in previous half-hour. The following figures (Figure 2-2, Figure
2-3, Figure 2-4) show examples of the measured data plotted chronologically, for the whole
year, one week and a day, respectively. Load profiles provide an idea of the demand at any
instant of time during a year, week or day.

Figure 2-2: Measured data (full year) for EM4 (Halfway, Sheffield)

Figure 2-3: Measured data (week) for EM4 (Halfway, Sheffield)

Figure 2-4: Measured data (day) for EM4 (Halfway, Sheffield)

 GHD | Report for Western Power Distribution - Network Islanding Investigation, 125/040/18 | 11
After being reviewed to inform the site selection, the measured data were carried forward to be used in the Feasibility Study analysis. The approach of converting the raw data to load duration curve (LDC) representations was adopted, as described in sub-section 3.3.2. This allows the chronological data to be plotted in a simpler form to more easily compare operating behaviour and evaluate benefits in the CBA. Examples of the simple LDC representation are provided in Figure 3-3 and Figure 3-5. 2.5.2 Assessment of generation control methods The islands were selected on the basis that each one included a single controllable generating source capable of supplying the total peak demand within the island. This approach was adopted to simplify the feasibility study analysis. Renewable generation was excluded from the study as this type of intermittent generation cannot solely be relied upon to supply islanded demand. The ratio of the generator export capacity to the total islanded peak demand has been set to a minimum of 1.5. This factor was chosen to provide a reasonable margin of generator capacity to ensure that the island can be sustained under peak demand conditions and to avoid unnecessarily high loading of the generator. For the islands identified in Table 2-1, it was assumed that each of the generators is operating with a basic control system that is only suitable for operation in grid connected mode. Therefore, the feasibility study has assumed that a more advanced control system will be need to be retrofitted onto the respective generators to provide the required voltage and frequency control to sustain islanded operation. A flat Capex cost of £100,000 has been apportioned for this control system for each generator. This covers the supply and installation of new transducers, sensors and actuators along with a new control panel in the generator control building. 2.5.3 Assumptions about realistic characteristics of future new developments A set of assumptions has been identified which enable the implementation of the feasibility analysis on the new development islands selected in Table 2-2. These are as follows: The After Diversity Maximum Demand (ADMD) has been assumed to be the standard value of 2.5 kW per customer2; The total calculated maximum demand is taken as the multiplication of the ADMD with the total number of customers in the development; The rating of the controllable generator that would have to be installed as part of the new development island is 1.5 times the estimated maximum demand; The type of generator selected for the new development islands is assumed to be a gas-fired Combined Cycle Gas Turbine (CCGT) CHP unit. This is a modern highly efficient energy generation technology that would likely be used for supplying electricity and heat demand for a new residential community of the scale identified in this study; The electrical infrastructure required to provide the connection for the new development to the main interconnected network is consistent between islanded (counterfactual) and non-islanded (base case) scenarios and is, therefore, not included in the NPV analysis; and 2 The standard ADMD is based on a typical mix of domestic, commercial and industrial customers. If the island is predominantly made up of domestic customers then the ADMD is expected to reduce to a figure of 2 kW per customer. More detailed assessment of commercial and industrial demand would be based on figures for estimated demand per unit of floor area of the premises. 12 | GHD | Report for Western Power Distribution - Network Islanding Investigation, 125/040/18
The NPV analysis for the counterfactual case includes the capex costs associated with the construction of the CCGT CHP generation to support the new development islands. GHD | Report for Western Power Distribution - Network Islanding Investigation, 125/040/18 | 13
3. Feasibility Study
 3.1 Methodology to undertake Feasibility Study
 The following section describes the methodology that has been used to implement the feasibility
 study analysis for network islanding:

 1. Plan to implement network islanding, as follows:
 b)

 a) A list of required equipment was prepared for each potential trial area identified.
 This included:
 3

 i. Generator control systems (new control panel, sensors and actuators to
 enable voltage and frequency control within the islanded network);

 ii. Earthing (to ensure earth fault current has a path to the source within the
 islanded network);
 iii. Protection relays (capable of adapting to grid-connected and island modes of
 operation);
 iv. Synchronisation equipment (advanced automatic synchronising panels and
 associated relays);

 v. Telecommunication systems (to enable the additional signal exchanges
 between equipment installed as part of the new islands);

 b) Unit costs will be used to assess the capital costs of implementation of network
 islands in each case.
 2. The high level assessment of the financial benefits of network islanding has included the
 following factors:
 c)

 a) Reduced network use of system charges (TUOS and DUOS) for islanded
 customers;

 b) Capital expenditure for the equipment required to facilitate network islanding; and
 c) Compensation to the existing DG for lost export revenue (generation output
 reduces to match demand profile).

 3. The preliminary Cost Benefit Analysis (CBA) of network islanding, which will comprise:
 d)

 a) Development of a spreadsheet to analyse the combined financial costs and
 benefits for comparison with the relevant counterfactual case;

 b) Use of the spreadsheet to assess sensitivities of the CBA to uncertain external
 factors; and

 c) Use of the spreadsheet to investigate the optimum scale of network islands through
 breakeven/tipping-point analysis of capital cost of implementing islanding vs.
 savings in operating costs.

 4. Further high level review, which comprises:
 e)

 a) High level review of legal, regulatory and commercial arrangements related to
 implementation of network islands, and necessary stakeholder engagement; and
 b) High level review of the requirements for stakeholder engagement.

 14 | GHD | Report for Western Power Distribution - Network Islanding Investigation, 125/040/18
INPUT 1: Consultant INPUT 2: Demand
 expertise and and generation
 published sources profiles

 Preparation of lists of High level review of
 required equipment for legal, regulatory and
 FEASIBILITY Cost benefit analysis,
 implementing network Assessment of capital Assessment of financial commercial
 including assessment of
 STUDY PROCESS islanding (to existing costs benefits arrangements, and
 sensitivities
 network and new necessary stakeholder
 developments) engagement

 Cost benefit analysis,
 Plan to implement including high level
 OUTPUTS network islanding, and investigation of the Further high level review
 associated costs optimum scale of
 network islands

 Figure 3-1: Illustration of methodology adopted for Feasibility Study

GHD | Report for Western Power Distribution - Network Islanding Investigation, 125/040/18
3.2 Plan to implement network islanding 3.2.1 Technical solutions and lists of required equipment To accurately consider the feasibility of network islanding it was necessary to identify the technical solutions that would need to be applied to the trial networks to allow them to operate as sustainable network islands. The technical solutions that were identified as follows: Generator control system – It is anticipated that existing controllable generators would not be configured to control the frequency and voltage for a network island. It has therefore been assumed that a new generator control system would have to be retrofitted onto the generator units to allow suitable control of frequency and voltage in islanded mode. Synchronising panel – The network island will usually have a single Point of Common Coupling (PCC) to the main interconnected network. A synchronising panel and associated synchronising check relays will need to be installed at the PCC to enable the island control system to safely connect and disconnect the island from the grid. Earthing – It has been assumed that the trial network islands will require additional earthing to be installed. The earthing is required to provide a path for earth fault current during operation in island mode. The earthing would likely be installed at the PCC, however, the exact location would have to be determined through a detailed study. Protection system updates – The transition from grid connected to island operational modes will significantly lower fault level as there will no longer be the infeed from the main grid. The protection relays inside the island will therefore require to be modern numerical relays with the group settings capability. A study will be required to identify relays that will need to be replaced and a subsequent relay replacement program will need to be implemented. Power system and protection system studies – A number of power system studies will have to be performed on the trial networks to understand the behaviour of the system under various switching and fault scenarios. The studies will also have to be performed to calculate the protection settings required for the protection schemes under both grid connected and island operational modes. Telecommunication systems –The overall control of the island i.e. disconnection/reconnection to the main grid will either be the responsibility of the incumbent DNO or there may be a third party operator such as a DSO. In both instances new telecoms interfaces will be required to the PCC and generator control systems. In the case of the third party operator they will need an additional interface system to the DNO’s NMS. Therefore, there is a requirement for new telecommunications systems to cater for this data exchange. 3.2.2 Distribution network equipment costs for islanding To implement the feasibility analysis, cost estimates have been produced for the technical solutions outlined in the section above. These costs have been derived from experience in procuring and installing equipment on the distribution network through working with WPD on multiple innovation projects in the past. They provide a reasonable estimate of the expenditure required to study, design and control a network island. The costs have been split into two categories: GHD | Report for Western Power Distribution - Network Islanding Investigation, 125/040/18
1. Fixed costs – These costs are common to each of the islands selected for this feasibility
 study have been included in Table 3-1 below.

 2. Variable costs – These costs are different for each of the islands and are attributable to
 the cost of new switchgear and the replacement of protection relays that are not
 suitable for islanded operation. The costs for the variable elements have been recorded
 in Table 3-2 for the respective trial island networks.
With regard to the variable costs, the total number of relays to be replaced was calculated by
finding the total number of 33kV circuit breakers in each of the trial networks and multiplying this
value by the average number of relays per circuit breaker that are anticipated to be replaced. It
was assumed that there would be approximately two relay replacements per circuit breaker. The
number of circuit breakers was recorded for each of the network islands after reviewing the
EMU diagrams in the trial area identification phase of the study.
Table 3-1: Fixed capex items

 Fixed Expenditure Items

 Technical Sub task Description £/day Man- Unit Units Subtotal
 solution days cost per per
 (£k) Island Island
 (£k)
 Generator Control N/A Supply and - - 100 1 100
 System install of new
 control
 equipment
 and panel for
 existing
 generator
 Synchronising N/A Supply and - - 50 1 50
 Panel install of new
 synchronising
 panel
 Earthing N/A Supply and - - 50 1 50
 install of new
 earthing for
 the island
 Telecommunication N/A Supply and - - 100 1 100
 Systems install of new
 telecoms
 equipment
 and interfaces
 Power System and Assessment Study to 400 15 - - 6
 Protection System of existing determine
 Studies protection number of
 schemes relay
 replacements
 required
 Studies to Studies to 400 15 - - 6
 determine determine
 new new
 protection protection
 settings settings
 Total 312

 GHD | Report for Western Power Distribution - Network Islanding Investigation, 125/040/18 | 17
Table 3-2: Variable capex items Variable Expenditure Items Island Technical Sub task No. new Unit Cost Cost (£k) Subtotal Solution units (£k) (£k) EM1 New 33kV N/A 1 50 50 - circuit breakers Protection Replacement 32 4 128 178 System of relays Updates EM2 New 33kV N/A 1 50 50 - circuit breakers Protection Replacement 28 4 112 162 System of relays Updates EM3 New 33kV N/A 0 50 0 - circuit breakers Protection Replacement 24 4 96 96 System of relays Updates EM4 New 33kV N/A 0 50 0 - circuit breakers Protection Replacement 16 4 64 64 System of relays Updates Total 500 3.2.3 Operating costs In addition to the equipment costs for distribution equipment to implement network islands, the operating costs in the base case and islanding counterfactual comprise the: Network use of system (UOS) charges - TUOS for the transmission and DUOS for the distribution network; and Wholesale generation cost. DUOS charges The following table presents selected DUOS charges taken from the WPD schedule of DUOS charges for customers in the East Midlands licence area, provided in Appendix B. The selected DUOS charges, used in the model, are those for demand customers (domestic unrestricted); and EHV generator (site-specific for Wykes Generation). It should be noted that normally embedded generation would be expected to have a negative variable DUOS charge (representing its contribution to reducing demand on the system). However, the site-specific charge for Wykes is zero, which indicates that the area has excess generation connected. Table 3-3: WPD (EMID) DUOS charges Assumptions Unit Rate 18 | GHD | Report for Western Power Distribution - Network Islanding Investigation, 125/040/18
DUOS - demand Domestic unrestricted: Fixed charge p/MPAN/day 3.350
 customers -
 unit charges Domestic unrestricted: Unit charge p/kWh 2.085

 DUOS - site- EHV generation: Export Super Red unit p/kWh 0.000
 specific EHV charge
 generator - unit EHV generation: Export fixed charge p/day 0.000
 charges
 EHV generation: Export capacity charge p/kVA/day 0.000
 EHV generation: Export exceeded capacity p/kVA/day 0.000
 charge

 The above fixed DUOS charges have been applied to the estimated number of customers
 (corresponding to the number of Meter Point Administration Numbers, MPANs). The number of
 customers has been estimated using a high level assumption that all demand customers fall into
 the domestic unrestricted category, with an annual Typical Domestic Consumption Value
 (TDCV) of 3,100 kWh, as published by Ofgem3.
 The above variable DUOS charges have been applied to the quantities of energy consumed
 and generated in the particular island counterfactual cases and corresponding base cases,
 based on actual measured data provided.

 TUOS charges
 In addition, the Ofgem assessment of the average electricity transmission network charge per
 domestic customer4, £35/customer/year, has been adopted for the applicable TUOS charges.

 Wholesale generation costs
 An average GB wholesale electricity price of 6.2p/kWh has been applied to the quantities of
 energy consumed and generated in the particular island counterfactual cases and
 corresponding base cases, based on actual measured data provided. The average wholesale
 price was calculated from figures presented in the Ofgem infographic on energy bills, prices and
 profits5; namely the average annual electricity bill of £577 and the portion of the bill attributed to
 wholesale energy costs (33.5%), along with the TDCV of 3,100 kWh stated above.

 The average whole price is taken to represent the average price paid by supply companies to
 generators. Precise payments to specific generators will vary by technology, location and
 agreed contractual terms. However, such details are commercially sensitive and not available
 for our work.

 3.2.4 Generator costs in the case of islanding for new developments

 In the case of islands for new developments, the capital and operation and maintenance costs
 of the generator required for the new development has been added to the costs for
 implementation of the island. This is a conservative approach to allocate all of this cost to the
 implementation of the island, since there are other benefits and revenue streams. However, the
 generation capacity is critical to being able to implement an island. Typical generator units
 capex and opex costs used within the assessments are detailed in Table 3-4.

3 https://www.ofgem.gov.uk/electricity/retail-market/monitoring-data-and-statistics/typical-domestic-
consumption-values
4 https://www.ofgem.gov.uk/data-portal/estimated-network-costs-domestic-customer-gb-average
5 https://www.ofgem.gov.uk/publications-and-updates/infographic-bills-prices-and-profits

 GHD | Report for Western Power Distribution - Network Islanding Investigation, 125/040/18 | 19
Table 3-4: Generator unit costs

 Technical solution Description Unit
 cost
 Capex (£/kW) CCGT CHP 841
 OCGT 811
 Recip Diesel 420
 Recip Gas 480
 Dedicated Biomass 3,027
 Biomass CHP 4,836
 EfW 8,582
 Fixed O&M (£/MW/year) CCGT CHP 28,200
 OCGT 9,900
 Recip Diesel 10,000
 Recip Gas 10,000
 Dedicated Biomass 65,500
 Biomass CHP 223,500
 EfW 139,500
 Variable O&M (£/MWh) CCGT CHP 5
 OCGT 4
 Recip Diesel 2
 Recip Gas 2
 Dedicated Biomass 8
 Biomass CHP 11
 EfW 25
 Fuel cost (£/MWh) CCGT CHP 54
 OCGT 52
 Recip Diesel 119
 Recip Gas 53
 Dedicated Biomass 33
 Biomass CHP 41
 EfW -110

20 | GHD | Report for Western Power Distribution - Network Islanding Investigation, 125/040/18
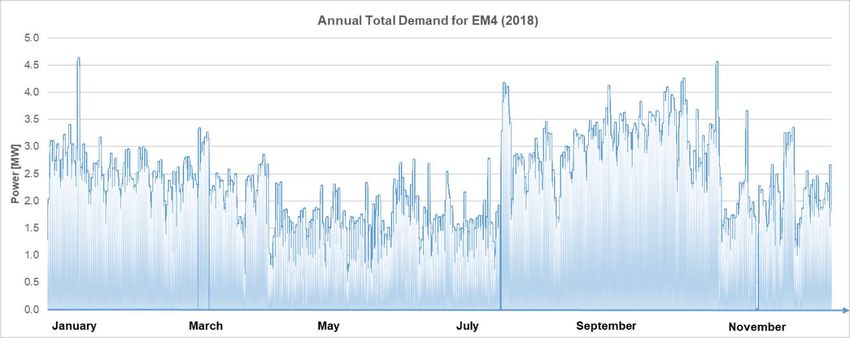
3.3 Assessment of financial benefits

3.3.1 Nature of benefits

The primary focus of this project is to determine whether network islands can be implemented
by WPD to provide financial benefits to customers. As such, the potential financial benefits
identified in the High Level Research and Analysis Report have been explored further in this
Feasibility Study. The scope of this part of the study is limited to the assessment of financial
costs and benefits to customers. Possible additional benefits have not been investigated in this
Feasibility Study, but will be considered in the next phase including monetisation of intangible
benefits where appropriate.
In developing the Feasibility Study analysis, assumptions have been adopted to reflect the
fundamental principle that costs and benefits should be socialised. This is a requirement under
the regulatory framework that WPD should observe if it implements islanding.

Cost savings for customers would be manifested in reductions to TUOS and DUOS. The
requirements for socialised benefits means that, for islanding to be feasible, it must reduce
WPD’s overall cost base. This means that there should either be a reduction to DUOS and
TUOS for all customers, or for a group of customers without negatively impacting any other
customers. As such, reduction of use of system charges corresponds to real world cost
reductions associated with avoided investment in network reinforcements.
It has not been possible to investigate the nature of the specific network reinforcement works
that would be avoided through implementation of islands. It is proposed to consider the costs of
typical reinforcements in the next stage of the project. However, for the purpose of this
Feasibility Study analysis, the results of the NPV analysis have been provided for a range of
factors applied to the DUOS and TUOS cost elements. These factors allow us to evaluate the
feasibility of network islanding for a range of combined reductions in TUOS and DUOS (for
customers in the island), and to make judgements about whether those reductions are realistic.
The results of this analysis are presented in sub-section 3.4.1.

3.3.2 Representation of demand and generation profiles

Historic demand measurements were requested to be extracted from PowerON at identified
locations, for example, the total demand of the Halfway substation is shown in Figure 3-2.

Figure 3-2: Measured data for the annual total demand of Halfway (2018)

For the purposes of the feasibility study, we have filtered the data for any obvious discrepancies
(such as large spikes and periods with negative or zero demand measurements). The above
figure is presented as an example for illustration, and includes the raw zero measurement

 GHD | Report for Western Power Distribution - Network Islanding Investigation, 125/040/18 | 21
values that are evident for Halfway. Please note that an alternative example is provided in
 Appendix C, for Harrold and Sharnbrook, where negative values are evident.

 It should be noted that complete substation demand profiles can be used to improve techno-
 economic analysis of network islanding, however, the measured historic data could not be
 readily understood in their raw form.
 There are a few methods to present generation or demand profiles to consider the relationship
 between demand and time. Here we propose the use of the concept of Load Duration Curve
 (LDC) to fill the gap in the analysis. An LDC is another term for a demand frequency distribution
 graph6. Such a curve presents the connection between time and demand, showing the
 percentage of time the load is greater or equal to a certain level (peak value) 7.

 As such, LDCs are used to illustrate the changing behaviour of a power system over time, and
 the overall energy requirement corresponding to the changing demand level (since the analysis
 requires consideration of energy as opposed to solely peak demand that is the basis of planning
 for network infrastructure). They are valuable for making comparisons between different
 systems or groups within them by simplifying the chronological demand data into periods sorted
 from highest to lowest demand. It should be noted that LDCs can be derived for a range of time
 periods, i.e. periods sorted from highest to lowest demand within a single day, week, month,
 year etc. Depending on data availability, LDCs can also be derived for the aggregate system
 demand, or demand (or generation) for particular groups or feeders.

 The following figures illustrate two different ways of thinking about LDCs to aid understanding.
 In Figure 3-3, the LDC is divided into vertical blocks (blue, orange and grey). These correspond
 to time periods separated by vertical lines through shoulder and knee points, which are shown
 at durations of 10% and 90% of the year for illustration, respectively (although these points are
 movable). The coloured blocks do not correspond to physical changes to the system, since the
 curve is no longer chronological, but are applied as theoretical constructs to derive the
 representative curve. As the system operates through each day it makes transitions between
 these operating blocks.

 Load Duration Curve - 3-block representation

 LDC block 1
 Max. demand (peak-shoulder)
 Peak
 Power (MW)

 Min. demand LDC block 2
 (shoulder-knee)

 LDC block 3
 Shoulder

 (knee-
 minimum)
 Knee

 0% 10% 20% 30% 40% 50% 60% 70% 80% 90% 100%
 % of time of year

 Figure 3-3: Representative illustration of load duration curve (3-block
 representation)

6 “Is there still merit in the merit order stack? The impact of dynamic constraints on optimal plant mix”
by Iain Staffell and Richard Green (Imperial College Business School, London)
7 “Load duration curve: A tool for technical-economic analysis of energy solution” by A. Poulin, M.

Dostie, M. Fournier and S. Sansreget.

22 | GHD | Report for Western Power Distribution - Network Islanding Investigation, 125/040/18
Figure 3-4 shows the same curve divided into horizontal coloured blocks. Again, this does not
correspond directly to physical changes to the system, but allows us to visualise the varying
requirements for generation to meet the changing demand. The terms baseload, mid-merit and
peak are applied to provide broad distinctions about how generators operate – corresponding to
the economic modes of operation of different types of generation.

 Load Duration Curve - merit order stack representation

 Peak
 Max. demand
 Mid-merit
 Peak

 Baseload
 Power (MW)

 Min. demand
 Shoulder

 Knee
 0% 10% 20% 30% 40% 50% 60% 70% 80% 90% 100%
 % of time of year

Figure 3-4: Representative illustration of load duration curve (merit order
 stack representation)

The LDC technique has been used to convert chronological demand data (load profiles from
January to December) provided for identified locations into periods sorted from highest to lowest
demand. A three-block LDC has then been adopted to represent the measured demand for
comparison and analysis. An illustration of the LDC is shown below (in this case normalised,
such that 100% on the x-axis corresponds to the whole year, 8,760 hours or 17,520 half-hour
periods). It is to be noted that the area under that curve gives the total energy consumption of
substations. Parameters for the points that represent the three load blocks (with straight line
relationships between these points) have been determined from the data through calculation
and visual inspection, as illustrated in Figure 3-3. An example of the comparison between the
modelled substation demand and the total measured demand for Halfway substation is shown
Figure 3-5 (blue and orange lines, respectively).

Figure 3-5: Comparison between measured and modelled substation demand
 for EM4 (Halfway)

 GHD | Report for Western Power Distribution - Network Islanding Investigation, 125/040/18 | 23
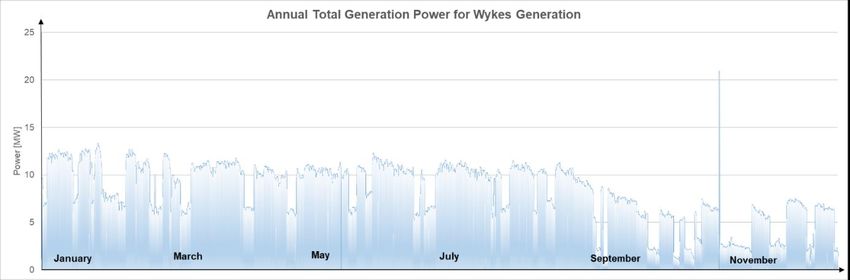
It should be noted that: The measured data have been subjected to very limited filtering (removal of unrealistic spikes); No adjustment has been made for the substation demand at the time of system peak; and The number of customers within the island has been based on an assumed value of 2.5 kW per customer. The number of customers was required for calculation of the DUOS charges. More detailed analysis of customer numbers and types can be performed in the next stage of the project. Historic generator output measurements have been converted to three-block LDCs in the same way as the demand measurements. The following figure shows the LDC used to model the output from the Holbrook (CHP) generator, with the LDC representing the total measured demand for Halfway substation plotted for reference. The measured generation output from the generator connected to Halfway has not been recorded correctly, and obtained data were unrealistic. The output from the Wykes Generator was used in this case as the generic generator scaled to the rated capacity of the generator located within the selected island (rated at 5.85 MW installed capacity). The LDC representing the scaled generator output is presented in Figure 3-6 and compared with demand at Halfway substation used in the feasibility assessment for this island. 8.00 6.00 4.00 2.00 0.00 0.0% 20.0% 40.0% 60.0% 80.0% 100.0% Generator non-islanded o/p Substation demand Figure 3-6: Comparison of load duration curves for demand and generation for EM4 It can be seen that the generator output exceeds the substation demand. It is envisaged that in the majority of cases implementation of network islands would result in curtailment of excess generation output to match the demand within the island. As such, the raw measured generation output is taken to be the non-island base case and compared with the case where the generation output is forced to match the island demand. 3.3.3 Calculation of net benefits As discussed in sub-section 3.3.1, the financial benefits to customers from network islanding correspond to reductions to the TUOS and DUOS charges. The net financial benefits correspond to the benefits minus the costs, which are discussed in sub-sections 3.2.2 to 3.2.4. Finally, however, there is an additional cost item that must be considered in the calculation of the net benefits. This is the compensation to DG for lost revenue that is shown in the following formula used to calculate the net benefits of islanding: = & − − 24 | GHD | Report for Western Power Distribution - Network Islanding Investigation, 125/040/18
The effect of islanding requires the DG plant to reduce its output to match the demand within the island, and for other generation plant to increase their output to provide the additional power to the customers outside of the island. In order to implement the island, it is assumed that the overall cost of power consumed remains the same, on average. However, there is an additional requirement to maintain the revenue to the DG whose output is reduced. As such, the additional term is added to the formula for a compensation payment to the DG. This is illustrated in Figure 3-7. The amount of the compensation payment is calculated with an additional percentage factor applied to the cost of the curtailed generation (calculated using the average wholesale price of 6.2p/kWh) to account for the net revenue after costs. The current working assumption for this factor is 10%, but sensitivity to this factor has been tested in the results presented in sub- section 3.4.1. It should be noted that what DG are paid to generate does not necessarily cover all of the associated costs. Motivations for installing DG vary, but in many cases the principal objective is to improve security of supply of electricity (and heat) to the individual’s site. The payments are dependent on specific contractual arrangements, which may be researched further in the next phase of the project, subject to details being available. It is expected that the agreement about prices would be subject to: Costs incurred by the DG, dependent on: – Technology (operational behaviour, efficiency, maintenance requirements); – Fuel prices; – Other drivers and contractual obligations (provision of electricity and/or heat for other purposes); Market forces determining contract prices from alternative generators to provide electricity to suppliers. In the case of islanding for new developments, two additional terms are added to the net benefits formula, as follows: ℎ = & + − − − The ‘other opex reduction’ corresponds to the cost of generation in the non-islanded base case minus the cost of generation from the generator that is developed as part of the new development in the island case. GHD | Report for Western Power Distribution - Network Islanding Investigation, 125/040/18 | 25
Island Base Case Island Case
 Base Case Island Case
 Network Generation Generation
 Generation Generation
 Demand Costs Costs
 MWh MWh
 MWh £ £

 Reduced
 output to COST OF ALL COST OF ALL
 match island ALL OTHER
 ALL OTHER OTHER OTHER
 demand GENERATORS
 GENERATORS GENERATORS GENERATORS
 in UK
 in UK in UK in UK

 COST OF
 Gap to be filled by
 OTHER
 other generators GAP GENERATORS
 (exported (CURTAILED USED TO FILL
 generation curtailed EXPORTS) GAP
 from Generator 1) Net revenue of
 Total generation curtailed exports paid
 required to meet NET REVENUE to DG
 NET REVENUE
 demand in UK

 GENERATOR 1 Net revenue from
 GENERATOR 1 COSTS generation is
 assumed to be 10% of
 Islanded GENERATOR 1 total wholesale costs
 GENERATOR 1 COSTS of energy
 Network
 (IN ISLAND) (IN ISLAND)
 DEMAND

 Currently feeds
 more than just the
 island (i.e.
 exports)

 Figure 3-7: Illustration of DG lost revenue

GHD | Report for Western Power Distribution - Network Islanding Investigation, 125/040/18
3.4 Cost benefit analysis and investigation of the optimum scale of network islands 3.4.1 Cost benefit analysis for identified potential trial areas This section presents the results of the NPV analysis for evaluation of the feasibility of network islanding. In each case, the island counterfactual case is compared with the corresponding non- islanded base case. The stream of annual capex and opex costs for each case is discounted according to the conventional method for calculating the NPV (with a 2019 reference year) and the following interest rates, taken from the Ofgem template for NIC submissions: Period Interest rate 2020-2028 3.5% 2029-2039 3.0% The analysis is carried out based on the assumption that islanding solutions would be implemented in 2020 and have a lifetime of 20 years. As such, 20 years is taken to be the lifetime of the island solution that is broadly consistent with the lifetime of generation plant. The full results of the NPV analysis are presented in sub-section 3.4.3, and a detailed worked example (for EM1) is presented in Appendix C for reference. A summary of the results is presented in Table 3-5, below, which shows the cumulative NPV in 2039 for each case based on fixed parameters for comparison, as follows: Factor applied to TUOS: 40% Factor applied to DUOS: 60% Factor applied to wholesale cost of curtailed generation for repayment to DG: 10% Factor for scaling generation capacity to MD (relevant to cases EM4 and ND1 where this scaling is applied to scale the generic generator and generator to be developed as part of the new development, respectively): 150% Table 3-5: Summary of NPV analysis results Summary of NPV analysis results for specified TUOS and DUOS reductions Island EM1 EM2 EM3 EM4 ND1 Peak demand (MW) 9.1 12.4 24.7 4.6 7.5 Generator capacity (MW) 25.0 25.0 20.9 5.9 11.3 Cumulative NPV in 2039 82,449 3,979,757 17,288,972 1,596,951 -8,996,102 (2019 £) Factor applied to TUOS 40% 40% 40% 40% 40% Factor applied to DUOS 60% 60% 60% 60% 60% Factor applied to wholesale cost 10% 10% 10% 10% 10% of curtailed generation for repayment to DG Factor for scaling generation - - - 150% 150% capacity to MD From this Feasibility Study analysis it is clear that curtailing the export of a generator to match the demand of an island can have a significant effect on the financial benefits. For example, islands EM1 and EM2 use the same generator, however, EM1 has a lower peak demand which requires the generator to be curtailed by an additional 3.3 MW during this half-hour period GHD | Report for Western Power Distribution - Network Islanding Investigation, 125/040/18
You can also read