Spectrum Analyzer RSA500A Series Portable Spectrum Analyzer Datasheet
←
→
Page content transcription
If your browser does not render page correctly, please read the page content below
Spectrum Analyzer
RSA500A Series Portable Spectrum Analyzer Datasheet
                                                                               Application programming interface included for development of custom
                                                                               programs
                                                                               Accessories including tablet PC, calibration kits, adapters and phase-
                                                                               stable cables offer a complete field solution for interference hunting and
                                                                               transmitter maintenance

                                                                           Applications
                                                                               General purpose spectrum analysis
                                                                               Radio network installation and maintenance
                                                                               Spectrum monitoring
                                                                               Spectrum management
                                                                               Interference hunting
The RSA500A Series USB spectrum analyzers offer high performance
portable spectrum analysis in a rugged battery-powered package.                EMI/EMC compliance testing and troubleshooting
                                                                               Spectrum operations
Features and benefits
                                                                               Radiation hazard (RADHAZ) testing
   9 kHz to 3.0/7.5/13.6/18.0 GHz frequency range covers a broad range
                                                                               Emissions control (EMCON) monitoring
   of analysis needs
                                                                               Signal intelligence (SIGINT) monitoring
   40 MHz acquisition bandwidth enables real time analysis for transient
   capture and vector analysis
   High speed full-span sweeps (70 GHz/sec) for fast setup and discovery   The RSA500 Series saves you time and helps
                                                                           you succeed
   Standard GPS/GLONASS/Beidou receiver for mapping
                                                                           The RSA500 series was built to bring real-time spectrum analysis to solving
   Optional tracking generator for gain/loss, antenna and cable
                                                                           the problems of spectrum managers, interference hunters and network
   measurements
                                                                           maintenance personnel who need to track down hard to find interferers,
   DataVu-PC software enables multi-unit recording in variable             maintain RF networks and keep records of their efforts. The heart of the
   bandwidths                                                              system is the USB-based RF spectrum analyzer that captures 40 MHz real-
                                                                           time bandwidths with great fidelity in harsh environments. With 70 dB
   Mil-Std 28800 Class 2 environmental, shock and vibration
                                                                           spurious free dynamic range and frequency coverage to 18.0 GHz, all
   specifications for use in harsh conditions
                                                                           signals of interest can be examined with high confidence in your
   Internal battery for extended field operations                          measurement results. The USB form factor moves the weight of the
                                                                           instrument off of your hands, and replaces it with a lightweight Windows
   SignalVu-PC software offers real time signal processing with DPX®
                                                                           tablet or laptop. Holding a light PC instead of a heavy spectrum analyzer
   Spectrum/Spectrogram to minimize time spent on transient and
                                                                           means you can move faster, for longer, and get your work done faster.
   interference hunting
                                                                           The optional tracking generator enables gain/loss measurements for quick
   EMC/EMI pre-compliance and troubleshooting - CISPR detectors,
                                                                           tests of filters, duplexers and other network elements, and you can add
   predefined standards, limit lines, easy accessory setup, ambient
                                                                           cable and antenna measurements of VSWR, return loss, distance to fault
   capture, failure analysis, and report generation
                                                                           and cable loss as needed.
   15 μsec minimum signal duration with 100% probability of intercept
   ensure you see problems first time, every time

                                                                                                                                       www.tek.com 1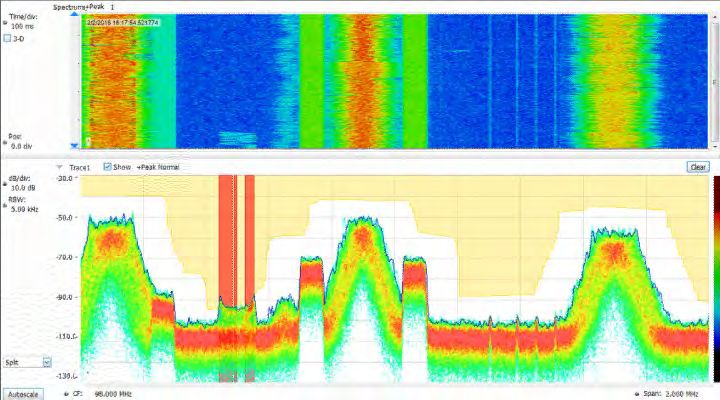
Datasheet

SignalVu-PC software offers rich analysis
capability in the field
The RSA500 series operates with SignalVu-PC, a powerful program used
as the basis of Tek’s traditional spectrum analyzers. SignalVu-PC offers a
deep analysis capability previously unavailable in high performance battery-
operated solutions. Real-time processing of the DPX® spectrum/
spectrogram is enabled in your PC, further reducing the cost of hardware.
Customers who need programmatic access to the instrument can choose
either the SignalVu-PC programmatic interface or use the included
application programming interface (API) that provides a rich set of
commands and measurements directly. Basic functionality of the free
SignalVu-PC program is far from basic. Base version measurements are
shown below.
                                                                               Direction finding and signal strength measurements are quick and easy
                                                                               with the standard SignalVu-PC software. In the illustration below, using the
The RSA500A combined with SignalVu-PC offers                                   available Alaris smart antenna, a compass continuously monitors antenna
advanced field measurements                                                    direction while the signal strength monitor performs measurements and
                                                                               provide audio indication of signal strength. When combined with the MAP
With 40 MHz of real-time bandwidth, the unique DPX® spectrum/
                                                                               option for SignalVu-PC, signal strength and azimuth are automatically
spectrogram shows you every instance of an interfering or unknown signal,
                                                                               placed on the map of your choice.
even down to 15 μs in duration. The following image shows a WLAN
transmission (green and orange), and the narrow signals that repeat across
the screen are a Bluetooth access probe. The spectrogram (upper part of
the screen) clearly separates these signals in time to show any signal
collisions.

                                                                               The tracking generator (Option 04 on the RSA500) is controlled via
                                                                               SignalVu-PC. A bandpass filter response from 800 MHz to 3 GHz is shown
                                                                               below. Option SV60 adds return loss, cable loss, and distance to fault.
Finding unexpected signals is easy with unattended mask monitoring. A
mask can be created on the DPX® spectrum display, and actions taken
upon every violation, including stop, save a picture, save acquisition, or
send an audible alert. In the illustration below, a mask violation has
occurred in red on the mask, and a picture of the screen was saved as a
result. Mask testing can be used for unattended monitoring and when
playing back recorded signals, enabling testing for different violations on
the same signals.

2 www.tek.com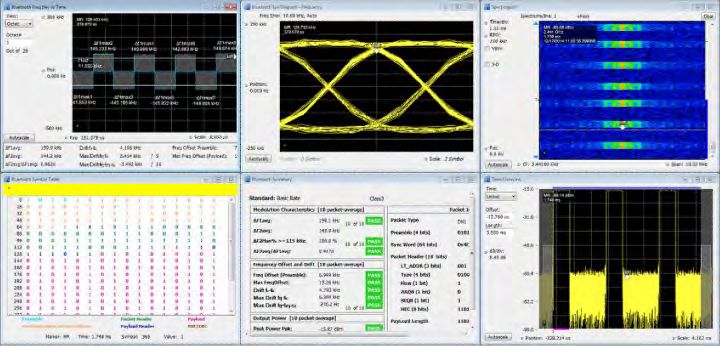
Spectrum Analyzer

SignalVu-PC application-specific licenses
SignalVu-PC offers a wealth of application-oriented options available either
installed on the instrument, or as a floating license that can be moved
between instruments or attached to your PC. Applications include:
    General-purpose modulation analysis (27 modulation types including
    16/32/64/256 QAM, QPSK, O-QPSK, GMSK, FSK, APSK)
    EMC/EMI analysis with CISPR peak, quasi-peak, and average
    detectors
    Buetooth® analysis of Basic Rate, Low Energy, and Bluetooth 5. Some
    support of Enhanced Data Rate
    P25 analysis of phase I and phase 2 signals
                                                                                    Bluetooth – Two new options have been added to help with Bluetooth SIG
    WLAN analysis of 802.11a/b/g/j/p, 802.11n, 802.11ac                             standardbase transmitter RF measurements in the time, frequency and
                                                                                    modulation domains. Option SV27 supports Basic Rate and Low Energy
    LTE™ FDD and TDD Base Station (eNB) Cell ID and RF                              Transmitter measurements defined by RF.TS.4.2.0 and RF-PHY.TS.
    measurements                                                                    4.2.0 Test Specification. It also demodulates and provides symbol
    Mapping                                                                         information for Enhanced Data Rate packets. Option SV31 supports
                                                                                    Bluetooth 5 standards (LE 1M, LE 2M, LE Coded) and measurements
    Pulse analysis                                                                  defined in the Core Specification. Both options also decode the physical
    AM/FM/PM/Direct Audio Measurement including SINAD, THD                          layer data that is transmitted and color-encode the fields of packet in the
                                                                                    Symbol Table for clear identification.
    Playback of recorded files, including complete analysis in all domains
    Signal classification and survey
See the separate SignalVu-PC data sheet for complete details and ordering
information. Selected applications are illustrated below.
EMC/EMI – EMI pre-compliance and diagnostic measurements are easy
with the instrument and SignalVu-PC. Transducer, antenna, preamplifier,
and cable gain/loss can be entered and stored in correction files, and the
standard spurious measurement feature of SignalVu-PC can be used to
establish limit lines for your test. The following illustration shows a test from
30MHz to 960 MHz against the FCC Part 15 Class A limit shown shaded.
The blue trace is the capture of Ambient. Violations are recorded in the
results table below the graph. CISPR quasi peak and average detectors               Pass/Fail results are provided with customizable limits. Measurement below
can be added with option SVQP.                                                      shows deviation vs. time, frequency offset and drift and a measurement
                                                                                    summary with Pass/Fail results.
The EMC pre-compliance solution can be added with option EMCVU. It
supports many predefined limit lines. It also adds a wizard for easy setup of
recommended antennas, LISN, and other EMC accessories with a one-
button push. When using the new EMC-EMI display, you can accelerate the
test by applying the time consuming quasi peak only on failures. This
display also provides a push-button ambient measurement. The Inspect
tool lets you measure frequencies of interest locally, removing the need for
scanning.

                                                                                                                                              www.tek.com 3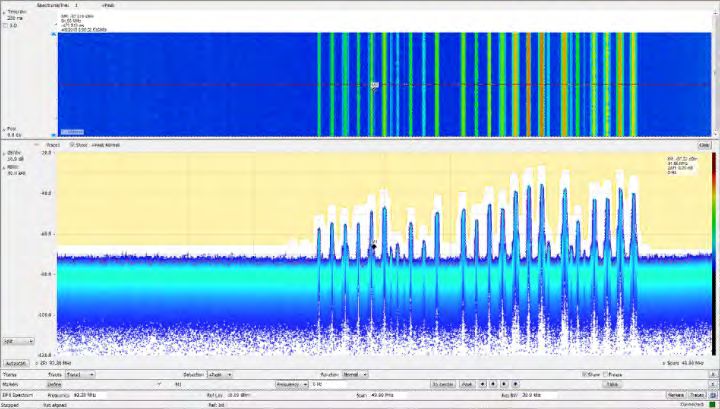
Datasheet
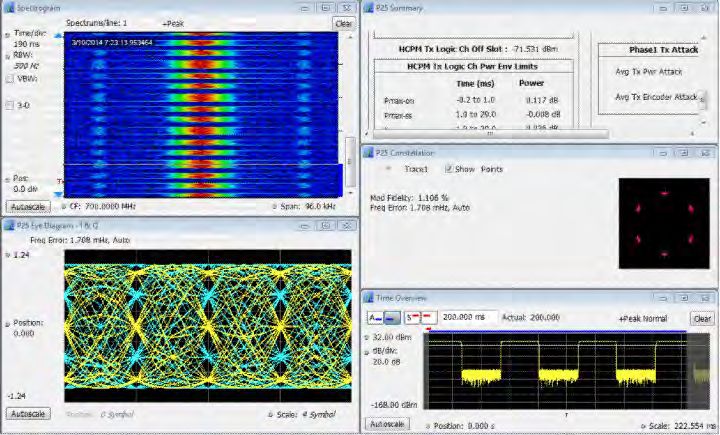
APCO 25 – SignalVu-PC application SV26 enables quick, standards- Mapping – The SignalVu-PC MAP application enables interference
based transmitter health checks on APCO P25 signals. The following hunting and location analysis. Locate interference with an azimuth function
image shows a Phase II HCPM signal being monitored for anomalies with that lets you draw a line or an arrow on a mapped measurement to indicate
the spectrogram while performing transmitter power, modulation and direction, or use the available Alaris smart antenna with automated azimuth
frequency measurements to the TIA-102 standards specification. placement.
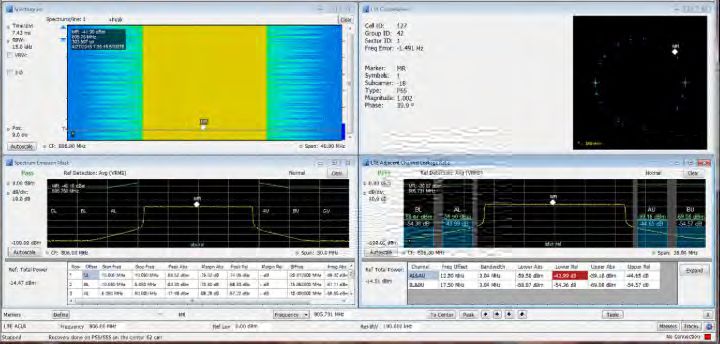
LTE – Application SV28 enables the following LTE base station transmitter
measurements:
Cell ID
Signal survey/classification – Application SV54 enables expert systems
Channel power guidance to aid the user in classifying signals. You can quickly create a
Occupied bandwidth spectral region of interest, enabling users to identify and sort signals
efficiently. The spectral profile mask, when overlaid on top of a trace,
Adjacent channel leakage ratio (ACLR) provides signal shape guidance while frequency, bandwidth, and channel
Spectrum emission mask (SEM) number are displayed allowing for fast classification. WLAN, GSM, W-
CDMA, CDMA, Bluetooth standard and enhanced data rate, LTE FDD and
Transmitter off power for TDD TDD, ATSC and other signals can be quickly and simply identified.
Reference Signal (RS) Power Databases can be imported from your H500/RSA2500 signal database
library for easy transition to the new software base.
The measurements follow the definition in 3GPP TS Version 12.5 and
support all base station categories, including picocells and femtocells. A typical signal survey is show below. The survey is of a portion of the TV
Pass/Fail information is reported and all channel bandwidths are supported. broadcast band, and 7 regions have been declared as either Permitted,
Unknown, or Unauthorized, as indicated by the color bars for each region.
The Cell ID preset displays the Primary Synchronization Signal (PSS) and In the detail illustration, a single region has been selected, and since we’ve
the Secondary Synchronization Signal (SSS) in a Constellation diagram. It declared this to be an ATSC video signal, the spectrum mask for the ATSC
also provides Frequency Error. signal is shown overlaid in the region. The signal is a close match to the
spectrum mask, including the vestigial carrier at the lower side of the signal,
The illustration below shows spectral monitoring with the spectrogram
characteristic of ATSC broadcasts.
display combined with a Cell ID/Constellation, Spectrum Emission Mask
and ACLR measurements.
4 www.tek.com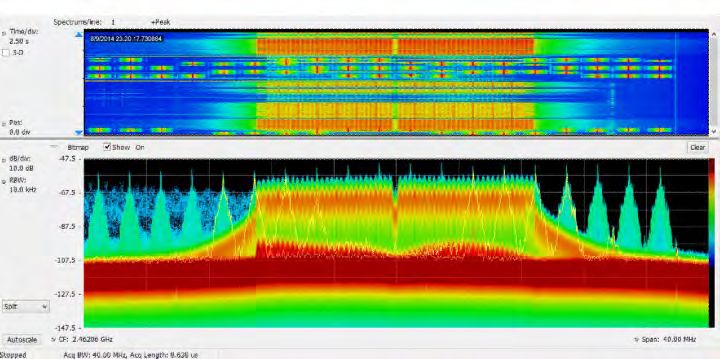
Spectrum Analyzer

                                                                                          Recording length is limited only by storage media size, and recording is a
                                                                                          basic feature included in SignalVu-PC. SignalVu-PC application SV56
                                                                                          (Playback) allows for complete analysis by all SignalVu-PC measurements,
                                                                                          including DPX Spectrogram. Minimum signal duration specifications are
                                                                                          maintained during playback. AM/FM audio demodulation can be performed.
                                                                                          Variable span, resolution bandwidth, analysis length, and bandwidth are all
                                                                                          available. Frequency mask testing can be performed on recorded signals,
                                                                                          with actions on mask violation including beep, stop, save trace, save
                                                                                          picture, and save data. Portions of the playback can be selected and
                                                                                          looped for repeat examination of signals of interest. Playback can be skip-
                                                                                          free, or time gaps can be inserted to reduce review time.
Return loss/VSWR, distance to fault, cable loss – Perform maintenance
and troubleshooting tasks with ease. When equipped with the option                        Clock time of the recording is displayed in the spectrogram markers for
04 tracking generator, the RSA500A series with application license                        correlation to real world events. In the illustration below, the FM band is
SV60xx-SVPC makes one-port measurements on cables, devices and                            being replayed, with a mask applied to detect spectral violations,
antennas.                                                                                 simultaneous with listening to the FM signal at the center frequency of
                                                                                          92.3 MHz.

Return loss vs distance for a cable with an inserted barrel and an extension cable. The
point at M2 (17.638 m, MR) is the barrel connector and the point marked by M1 at
19.725 m is the end of the cable.

                                                                                          DataVu-PC for multi-instrument recording
                                                                                          and analysis of large recordings
                                                                                          DataVu-PC software can control two spectrum analyzers simultaneously
                                                                                          with independent settings. This allows you to monitor a wide span, while
                                                                                          recording at up to 40 MHz bandwidth at any frequency in the range of the
                                                                                          instrument. Once recorded, DataVu-PC can find and mark signals of
                                                                                          interest based on amplitude and frequency-mask characteristics,
                                                                                          eliminating the need for manual inspection of long recordings. Pulse
                                                                                          measurements are available on up to 2,000,000 pulses.

Return loss of a bandpass filter measured from 700 MHz to 2.6 GHz. Markers have been
placed a 1.48 GHz (-34.4 dB return loss) and at 1.73 GHz (-11.68 dB return loss),
indicating the best and worse match in the passband of the filter.

Playback – Application SV56, Playback of recorded signals, can reduce
hours of watching and waiting for a spectral violation to minutes at your
desk reviewing recorded data.

                                                                                                                                                       www.tek.com 5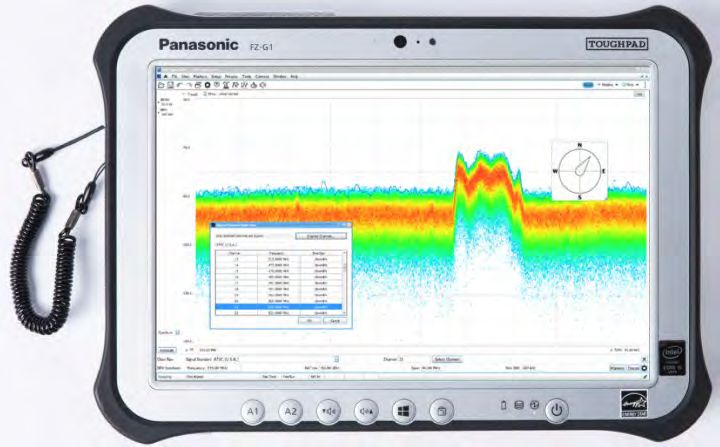
Datasheet

Instrument controller for USB spectrum                                                               Integrated battery backup for hot-swap of battery packs
analyzers
                                                                                                     3-year Warranty with Business Class Support (provided by Panasonic
For field operations, a complete solution requires a Windows Tablet or                               in your region)
laptop for instrument operation, record keeping and communication.
Tektronix recommends the Panasonic FZ-G1 tablet computer for controlling
the RSA500 series and as a standalone unit.                                                     Smart antenna for interference hunting
                                                                                                Tektronix offers the Alaris DFA-0047 1 smart antenna with built-in USB
                                                                                                compass for direction finding and interference hunting applications. Full
                                                                                                details on the antenna are available in the Alaris data sheet available on
                                                                                                Tek.com by searching on Alaris. A summary of features and specifications
                                                                                                is shown below.
                                                                                                     Frequency Range: 20 MHz – 8.5 GHz
                                                                                                          9 kHz-20 MHz extension available(0.3m loop antenna), order DF-
                                                                                                          A0047-01 1
                                                                                                     Trigger control for one-hand operation with functions for:
                                                                                                          Preamp on/off
                                                                                                          Band switch
                                                                                                          Push to measure with SignalVu-PC with MAP option
                                                                                                     Standard armrest extension for ease in long interference hunting
The Panasonic FZ-G1 tablet computer is sold separately and is available
                                                                                                     sessions
for purchase from Panasonic at https://na.panasonic.com/us/computers-
tablets-handhelds/tablets/tablets/toughbook-g1 and a variety of third party                          Transit case available
vendors. Tektronix recommends the FZ-G1 over other tablets because of
its performance, portability, and ruggedized form-factor and it has been
tested to work with all USB RSA products.

Key specifications, instrument controller
     Windows 10 Pro 64-bit operating system
     Intel(R) CoreTM i5-6300U vProTM 2.4-3.0 GHz Processor
     8GB RAM
     256 GB Solid State Drive
     10.1" (25.6 cm) Daylight-readable screen
     10-point Multi Touch+ Digitizer screen plus included pen interface
     USB 3.0 + HDMI Ports, 2nd USB Port                                                         Alaris direction-finding smart antenna.

     Wi-Fi, Bluetooth® and 4G LTE Multi Carrier Mobile Broadband with
     Satellite GPS
     MIL-STD-810G certified (4' drop, shock, vibration, rain, dust, sand,
     altitude, freeze/thaw, high/low temperature, temperature shock,
     humidity, explosive atmosphere)
     IP65 certified sealed all-weather design
     Integrated microphone
     Integrated speaker
     On-screen and button volume and mute controls

1   Alaris antenna is available in limited geographies. See ordering information for details.

6 www.tek.com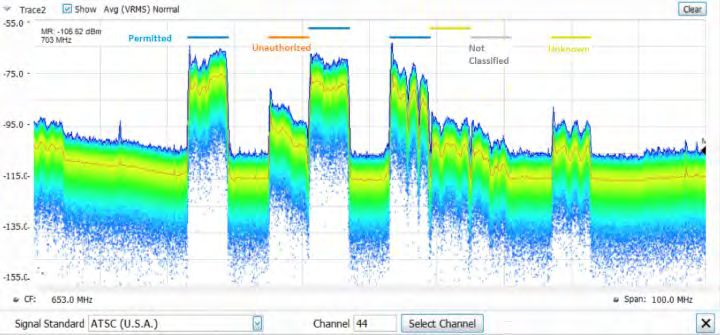
Spectrum Analyzer

Calibration kits, phase-stabilized cables,
adapters, antennas and other accessories
Tektronix offers a variety of accessories to simplify your shopping for the
complete solution for field test. See the ordering information section for
further details.

The RSA56RACK holds one RSA500A for rackmount applications                          The soft case PN 016-2109-01 is standard with every RSA500A and has room for the
                                                                                    unit, a tablet PC and accessories

The RSA500TRANSIT case has room for the instrument in its soft case, a tablet PC,
power supply and accessories.

                                                                                                                                                     www.tek.com 7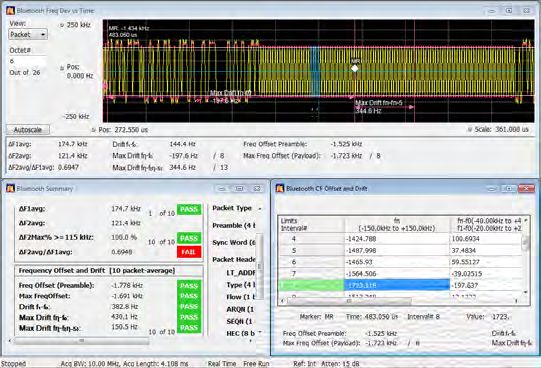
Datasheet

8 www.tek.com
Spectrum Analyzer

Specifications
All specifications are guaranteed unless noted otherwise. All specifications apply to all models unless noted otherwise.

Frequency
    Frequency range
         RSA503A                             9 kHz to 3 GHz
         RSA507A                             9 kHz to 7.5 GHz
         RSA513A                             9 kHz to 13.6 GHz
         RSA518A                             9 kHz to 18.0 GHz

    Frequency marker readout                 ±(RE × MF + 0.001 × Span) Hz
    accuracy
                                             RE: Reference Frequency Error
                                             MF: Marker Frequency [Hz]

    Reference frequency accuracy
         Initial accuracy at Cal (30 min     ±1 x 10⁻⁶
         warm-up)
         First year aging, typical           ±1 x 10⁻⁶ (1 year)
         Cumulative error (Initial           3 x 10⁻⁶ (1 year)
         accuracy + temperature +
         aging), typical
         Temperature drift                   ±0.9 x 10⁻⁶ (-10 to 60 °C)
         External reference input            BNC connector, 50 Ω nominal
         External reference input            Every 1 MHz from 1 to 20 MHz plus the following: 1.2288 MHz, 2.048 MHz, 2.4576 MHz, 4.8 MHz, 4.9152 MHz, 9.8304 MHz,
         frequency                           13 MHz, and 19.6608 MHz.
                                             The spurious level on the input signal must be less than -80 dBc within 100 kHz offset to avoid on-screen spurious.
         External reference input range ± 5 ppm
         External reference input level      -10 to +10 dBm

                                                                                                                                                            www.tek.com 9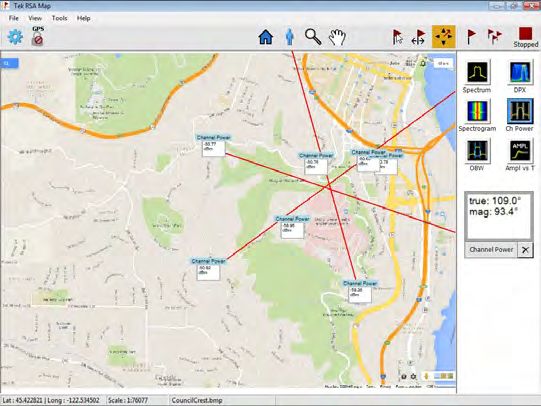
Datasheet

GNSS

           Accuracy, when locked to                   ±0.025 ppm 3
           GNSS 2
           GNSS Trained Accuracy, when ±0.025 ppm 6
           GNSS antenna is
           disconnected 4 , 5          ±0.08 ppm 7

RF input
     RF input
           RF Input Impedance                         50 Ω
           RF VSWR (RF Attn = 20 dB),                 < 1.2 (10 MHz to 3 GHz)
           typical
                                                      < 1.5 (>3 GHz to 7.5 GHz)
                                                      7.5 GHz to 18 GHz)
           RF VSWR preamp ON, typical                 < 1.5 (10 MHz to 6 GHz, RF ATT=10 dB, preamp on)
                                                      < 1.7 (> 6 GHz to 7.5 GHz, RF ATT=10 dB, preamp on)
                                                      7.5 GHz to 18 GHz, RF ATT = 10 dB, preamp ON)

     Maximum RF input level
           Maximum DC voltage                         ±40 V (RF input)
           Maximum safe input power                   +33 dBm (RF input, 10 MHz to 18.0 GHz, RF Attn ≥ 20 dB)
                                                      +13 dBm (RF input, 9 kHz to 10 MHz, RF Attn ≥ 20 dB)
                                                      +20 dBm (RF input, RF Attn < 20 dB)
           Maximum safe input power                   +33 dBm (RF input, 10 MHz to 18.0 GHz, RF Attn ≥ 20 dB)
           (Preamp On)
                                                      +13 dBm (RF input, 9 kHz to 10 MHz, RF Attn ≥ 20 dB)
                                                      +20 dBm (RF input, RF Attn < 20 dB)
           Maximum measurable input                   +30 dBm (RF input, ≥10 MHz to Fmax, RF ATT Auto)
           power
                                                      +20 dBm (RF input,
Spectrum Analyzer
Sweep speed
Full span sweep speed, typical 70 GHz/sec (RBW = 1 MHz)
mean 8
60 GHz/sec (RBW = 100 kHz)
15.7 GHz/sec (RBW = 10 kHz)
1.7 GHz/sec (RBW = 1 kHz)
Tuning step time via API ≤1 ms
Amplitude and RF
Amplitude and RF flatness
Reference level setting range -170 dBm to +40 dBm, 0.1 dB step, (Standard RF input)
Frequency response at 18 ℃
to 28 ℃ (At 10 dB RF Amplitude accuracy at all center frequencies
Attenuator Setting) Center frequency range 18 ⁰C to 28 ⁰C
9 kHz ≤ 3.0 GHz ±0.8 dB
> 3 to 7.5 GHz (RSA507A) ±1.5 dB
>7.5 GHz to 13.6 GHz (RSA513A/RSA518A) ±1.55 dB
>13.6 GHz to 18.0 GHz (RSA518A) ±1.55 dB
Amplitude Accuracy at All Center frequency range 18 ⁰C to 28 ⁰C
Center Frequencies - Preamp
200 kHz to ≤3.0 GHz ±1.0 dB
ON (18 ℃ to 28 ℃ , 10 dB RF
Attenuator) > 3 GHz to 7.5 GHz ±1.75 dB
>7.5 GHz to 13.6 GHz ±2.0 dB
>13.6 GHz to 18.0 GHz ±2.0 dB
Preamp gain 27 dB at 2 GHz
21 dB at 6 GHz (RSA507A)
25 dB at 10 GHz (RSA513A)
25 dB at 15 GHz (RSA518A)
Channel response (amplitude and For these specifications, use a flat top window for maximum CW amplitude verification accuracy with the RF attenuator setting at
phase deviation), typical 10 dB.
Characteristic Description
Measurement center Span Amplitude flatness, Amplitude flatness, Phase linearity, RMS,
frequency typical RMS, typical typical
9 kHz to 40 MHz ≤40 MHz 9 ±1.0 dB 0.60 dB
>40 MHz to 4.0 GHz ≤20 MHz ±0.10 dB 0.08 dB 0.3°
>4 GHz to 7.5 GHz ≤20 MHz ±0.35 dB 0.20 dB 0.7°
>7.5 GHz to 13.6 GHz ≤20 MHz ±0.35 dB 0.20 dB 0.7°
>13.6 GHz to 18.0 GHz ≤20 MHz ±0.35 dB 0.20 dB 0.7°
>40 MHz to 4 GHz ≤40 MHz ±0.35 dB 0.14 dB 0.8°
>4 GHz to 7.5 GHz ≤40 MHz ±0.40 dB 0.20 dB 1.0°
>7.5 GHz to 13.6 GHz ≤40 MHz ±0.60 dB 0.40 dB 1.5°
>13.6 GHz to 18.0 GHz ≤40 MHz ±0.60 dB 0.40 dB 1.5°
8 Measured using a Dell Latitude E5540, i7, Windows®7 Pro. Spectrum display is only measurement on screen.
9 Span extents cannot exceed lower frequency limit of the instrument
www.tek.com 11Datasheet
Trigger
Trigger/Sync input, typical Voltage range: TTL, 0.0 V to 5.0 V
Trigger level (Schmitt trigger):
Positive-going threshold voltage: 1.6 V min, 2.1 V max
Negative-going threshold voltage: 1.0 V min., 1.35 V max
Impedance: 10 k ohms with schottky clamps to 0 V, +3.4 V
External trigger timing uncertainty >20 MHz to 40 MHz acquisition bandwidth: ±250 ns
Uncertainty increases as acquisition bandwidth is decreased.
Power trigger
Power trigger, typical Range: 0 dB to -50 dB from reference level, for trigger levels > 30 dB above the noise floor.
Type: Rising or falling edge
Trigger re-arm time: ≤ 100 μsec
Power trigger position timing >20 MHz to 40 MHz acquisition bandwidth: ±250 ns
uncertainty
Uncertainty increases as acquisition bandwidth is decreased.
Power trigger level accuracy ±1.5 dB for CW signal at tuned center frequency for trigger levels > 30 dB above the noise floor.
This specification is in addition to the overall amplitude accuracy uncertainty for SA mode.
Noise and distortion
3rd Order IM intercept (TOI) +14 dBm at 2.130 GHz
3rd Order IM intercept (TOI),
Preamp off, typical +17 dBm (9 kHz to 25 MHz)
+15 dBm (25 MHz to 3 GHz)
+15 dBm (3 GHz to 4 GHz, RSA507A )
+10 dBm (4 GHz to 7.5 GHz, RSA507A)
+15 dBm (7.5 GHz to Max CF GHz, RSA513A/RSA518A)
Preamp on, typical -20 dBm (9 kHz to 25 MHz)
-15 dBm (25 MHz to 3 GHz)
-15 dBm (3 GHz to 4 GHz, RSA507A )
-20 dBm (4 GHz to 7.5 GHz, RSA507A)
-15 dBm (7.5 GHz to Max CF, RSA513A/RSA518A)
3rd Order Inter-modulation -78 dBc at 2.130 GHz
distortion
Each signal level -25 dBm at the RF input. 2 MHz tone separation. Attenuator = 0, Reference level = -20 dBm.
12 www.tek.comSpectrum Analyzer
Noise and distortion
3rd Order inter-modulation
distortion
Preamp off, typical < -70 dBc (10 kHz to 25 MHz)
< -80 dBc (25 MHz to 3 GHz)
< -80 dBc (3 GHz to 4 GHz, RSA507A)
< -70 dBc (4 GHz to 7.5 GHz, RSA507A)
< -80 dBc (7.5 GHz to Max CF, RSA513A/RSA518A)
Each signal level -25 dBm at the RF input. 2 MHz tone separation. Attenuator = 0, Reference level = -20 dBm.
Preamp on, typical < -70 dBc (9 kHz to 25 MHz)
< -80 dBc (25 MHz to 3 GHz)
< -80 dBc (3 GHz to 4 GHz, RSA507A)
< -70 dBc (4 GHz to 7.5GHz, RSA507A)
< -80 dBc (7.5 GHz to Max CF, RSA513A/RSA518A)
Each signal level -55 dBm at the RF input. 2 MHz tone separation. Attenuator = 0, Reference level = -50 dBm.
2nd Harmonic distortion, typical
2nd Harmonic distortion < -75 dBc (40 MHz to 1.5 GHz)
< -75 dBc (1.5 GHz to 3.75 GHz, RSA507A)Datasheet
Noise and distortion
Displayed average noise level (Normalized to 1 Hz RBW, with log-average detector)
(DANL)
For the RSA503A and RSA507A:
Frequency range Preamp on Preamp on, typical Preamp off, typical
500 kHz to 1 MHz -138 dBm/Hz -145 dBm/Hz -130 dBm/Hz
1 MHz to 25 MHz -153 dBm/Hz -158 dBm/Hz -130 dBm/Hz
>25 MHz to 1 GHz -161 dBm/Hz -164 dBm/Hz -141 dBm/Hz
>1 GHz to 2 GHz -159 dBm/Hz -162 dBm/Hz -141 dBm/Hz
>2 GHz to 3 GHz -156 dBm/Hz -159 dBm/Hz -138 dBm/Hz
>3 GHz to 4 GHz, RSA507A -153 dBm/Hz -156 dBm/Hz -138 dBm/Hz
>4 GHz to 6 GHz, RSA507A -159 dBm/Hz -162 dBm/Hz -147 dBm/Hz
>6 GHz to 7.5 GHz, RSA507A -155 dBm/Hz -158 dBm/Hz -145 dBm/Hz
For the RSA513A and RSA518A:
Frequency range Preamp on Preamp on, typical
500 kHz to 1 MHz -138 dBm/Hz -145 dBm/Hz
1 MHz to 25 MHz -153 dBm/Hz -158 dBm/Hz
>25 MHz to 1 GHz -158 dBm/Hz -161 dBm/Hz
>1 GHz to 2 GHz -156 dBm/Hz -159 dBm/Hz
>2 GHz to 2.75 GHz -153 dBm/Hz -157 dBm/Hz
>2.75 GHz to 4 GHz -149 dBm/Hz -152 dBm/Hz
>4 GHz to 6 GHz -155 dBm/Hz -159 dBm/Hz
>6 GHz to 7.5 GHz -151 dBm/Hz -155 dBm/Hz
>7.5 GHz to 14 GHz -161 dBm/Hz -165 dBm/Hz
>14 GHz to 14.8 GHz -159 dBm/Hz -165 dBm/Hz
>14.8 GHz to 15.2 GHz -157 dBm/Hz -161 dBm/Hz
>15.2 GHz to 17.65 GHz -159 dBm/Hz -165 dBm/Hz
>17.65 GHz to 18.0 GHz -157 dBm/Hz -161 dBm/Hz
Phase noise
Phase noise Offset 10 kHz 100 kHz 1 MHz
1 GHz CF -94 dBc/Hz -94 dBc/Hz -116 dBc/Hz
10 MHz, typical (RSA503A, -120 dBc/Hz -124 dBc/Hz -124 dBc/Hz
RSA507A)
1 GHz CF (typical) -97 dBc/Hz -98 dBc/Hz -121 dBc/Hz
2 GHz CF (typical) -96 dBc/Hz -97 dBc/Hz -120 dBc/Hz
6 GHz CF, typical (RSA507A) -94 dBc/Hz -96 dBc/Hz -120 dBc/Hz
10 GHz, typical (RSA513A, -89 dBc/Hz -90 dBc/Hz -113 dBc/Hz
RSA518A)
15 GHz, typical (RSA513A, -86 dBc/Hz -87 dBc/Hz -110 dBc/Hz
RSA518A)
14 www.tek.comSpectrum Analyzer
Spurious response
Residual spurious response 60 MHz to 80 MHz), typical
80 MHz to Max CF), typical
(Exceptions: 40 MHz
Typical
1 MHz - 100 MHz -- -75 dBc
100 MHz - 3 GHz -72 dBc -75 dBc
3 GHz - 7.5 GHz (RSA507A) -72 dBc -75 dBc
7.5 GHz to 13.6 GHz (RSA513A/RSA518A) -72 dBc -75 dBc
13.6 GHz to 18.0 GHz (RSA518A) -72 dBc -75 dBc
Spurious response with signal at (150 kHz ≤ offset 40 MHz
other than CF, typical
1 MHz – 25 MHz (LF Band) -73 dBc
25 MHz – 3 GHz -73 dBc
3 GHz – 7.5 GHz (RSA507A) -73 dBc
7.5 GHz - 13.6 GHz (RSA513A/RSA518A) -73 dBc
13.6 GHz - 18.0 GHz (RSA518A) -73 dBc
Spurious response with signal at < -75 dBc, (CF: 30 MHz to Max CF, Ref = -20 dBm, Atten = 10 dB, RBW = 10 Hz, Span = 10 kHz)
half-IF 10
Signal frequency = 2310 MHz, RF input level = -20 dBm
Local oscillator feed-through to < -70 dBm, preamp off.
input connector, typical
< -90 dBm, preamp on.
Attenuator = 10 dB.
10 This is an input signal at half of the IF frequency.
www.tek.com 15Datasheet
Acquisition
IF bandwidth 40 MHz.
A/D converter 14 bits, 112 Ms/s.
Real-Time IF Acquisition Data 112 Ms/s, 16-bit integer samples.
ACLR
ACLR for 3GPP Down Link, -57 dB (Adjacent Channel)
1 DPCH (2130 MHz)
-68 dB w/Noise Correction (Adjacent Channel)
-57 dB (First Alternate Channel)
-69 dB w/Noise Correction (First Adjacent Channel)
ACLR LTE -58 dB (Adjacent Channel)
-61 dB w/Noise Correction (Adjacent Channel)
-61 dB (First Alternate Channel)
-63 dB w/Noise Correction (First Adjacent Channel)
GPS location
Format GPS/GLONASS/BeiDou
GPS antenna power 3 V, 100 mA maximum
Time to first fix, maximum Lock time ranges from 2 sec (hot) to 46 sec (cold start). -130 dBm input signal power.
Horizontal position accuracy GPS: 2.6 m
Glonass: 2.6 m
BeiDou: 10.2 m
GPS + Glonass: 2.6 m
GPS + BeiDou: 2.6 m
Test conditions: 24 hr. static, -130 dBm, full power
Tracking generator (Option 04)
Tracking Generator (Option 04)
Frequency range 10 MHz to 3 GHz (RSA503)
10 MHz to 7.5 GHz (RSA507A/513A/518A)
Sweep speed, typical mean 0.192 sec/sweep, 101 points, 50 kHz RBW, 980 to 1020 MHz sweep (1.9 mS per point)
Measured using a Dell Latitude E5540, i7, Windows®7 Pro. Transmission Gain display is only measurement on screen.
Frequency resolution 100 Hz
TG output connector N type
VSWR < 1.8:1, 10 MHz to 7.5 GHz, -20 dBm output level
Maximum output power -3 dBm,10 MHz to 7.5 GHz
Output power level setting 40 dB, 10 MHz to 7.5 GHz
range
Output power level step size 1 dB, 10 MHz to 7.5 GHz
16 www.tek.comSpectrum Analyzer
Tracking generator (Option 04)
Output power level step size ± 0.5 dB
accuracy
Harmonics < -22 dBc, ≥20 MHz
Non-harmonic spurious < -30 dBc; spurious < 2 GHz from TG output frequency
< -25 dBc; spurious ≥ 2 GHz from TG output frequency
Reverse power without 40 Vdc, +20 dBm RF
damage
SignalVu-PC standard measurements and performance
Measurements included. General signal analysis
Spectrum analyzer Spans from 1 kHz to 18.0 GHz
Three traces plus math and spectrogram trace
Five markers with power, relative power, integrated power,
power density and dBc/Hz functions
DPX Spectrum/Spectrogram Real time display of spectrum with 100% probability of intercept
of up to 15 μsec signals in up to 40 MHz span
Amplitude, frequency, phase vs. time, RF I and Q vs. time Basic vector analysis functions
Time Overview/Navigator Enables easy setting of acquisition and analysis times for deep
analysis in multiple domains
Spectrogram Analyze and re-analyze your signal with a 2-D or 3-D waterfall
display
AM/FM listening Hear, and record to file, FM and AM signals
Analog modulation analysis
AM, FM, PM analysis Measures key AM, FM, PM parameters
RF measurements
Spurious measurement User-defined limit lines and regions provide automatic spectrum
violation testing across the entire range of the instrument. Four
traces can be saved and recalled; CISPR Quasi-Peak and
Average detectors available with option SVQP.
Spectrum emission mask User-defined or standards-specific masks
Occupied Bandwidth Measures 99% power, -xdB down points
Channel Power and ACLR Variable channel and adjacent/alternate channel parameters
MCPR Sophisticated, flexible multi-channel power measurements
CCDF Complementary Cumulative Distribution Function plots the
statistical variations in signal level
SignalVu-PC/RSA507A key
characteristics
Maximum span 40 MHz real-time
9 kHz - 3 GHz swept (RSA503A)
9 kHz - 7.5 GHz swept (RSA507A)
9 kHz - 13.6 GHz swept (RSA513A)
9 kHz - 18.0 GHz swept (RSA518A)
Maximum acquisition time 2.0 s
www.tek.com 17Datasheet
SignalVu-PC standard measurements and performance
Minimum IQ resolution 17.9 ns (acquisition BW = 40 MHz)
Tuning Tables Tables that present frequency selection in the form of standards-based channels are available for the following.
Cellular standards families: AMPS, NADC, NMT-450, PDC, GSM, CDMA, CDMA-2000, 1xEV-DO WCDMA, TD-SCDMA, LTE,
WiMax
Unlicensed short range: 802.11a/b/j/g/p/n/ac, Bluetooth
Cordless phone: DECT, PHS
Broadcast: AM, FM, ATSC, DVBT/H, NTSC
Mobile radio, pagers, other: GMRS/FRS, iDEN, FLEX, P25, PWT, SMR, WiMax
DPX spectrum display
Spectrum processing rate ≤10,000 spectrums per second
(RBW = auto, trace length 801)
DPX bitmap resolution 201 pixels vertical x 801 pixels horizontal
DPX Spectrogram minimum 1 ms
time resolution 11
≤10,000 per second (span independent)
Marker information Amplitude, frequency, signal density
Minimum signal duration for 15 μs up to 40 MHz span
100% probability of intercept
(POI), typical
Span range (continuous 1 kHz to 40 MHz
processing)
Span range (swept) Up to maximum frequency range of instrument
Dwell time per step 5 ms to 100 s
Trace processing Color-graded bitmap, +Peak, -Peak, average
Trace length 801, 2401, 4001, 10401
RBW range 1 kHz to 4.99 MHz
DPX spectrogram display
Trace detection +Peak, -Peak, Average(VRMS)
Trace length, memory depth 801 (60,000 traces)
2401 (20,000 traces)
4001 (12,000 traces)
Time resolution per line 1 ms to 6400 s, user selectable
Spectrum and Spurious display
Traces Three traces + 1 math trace + 1 trace from spectrogram for Spectrum display; four traces for Spurious display
Trace functions Normal, Average (VRMS), Max Hold, Min Hold, Average of Logs
Detector Average (VRMS), Average (of logs), CISPR peak, +Peak, Sample for Spectrum only -Peak; when Option SVQP is enabled, CISPR
Quasi Peak and Average
Spectrum trace length 801, 2401, 4001, 8001,10401, 16001, 32001, and 64001 points
RBW range 1.18 Hz to 8 MHz for Spectrum display
11 Due to the non-deterministic execution time of programs running under the Microsoft Windows™ OS, this specification may not be met when the host PC is heavily loaded with other processing tasks.
18 www.tek.comSpectrum Analyzer
SignalVu-PC standard measurements and performance
Analog modulation analysis
(standard)
AM demodulation accuracy, ±2%
typical
0 dBm input at center, carrier frequency 1 GHz, 1 kHz/5 kHz input/modulated frequency, 10% to 60% modulation depth
0 dBm input power level, reference level = 10 dBm, Atten=Auto
FM demodulation accuracy, ±1% of span
typical
0 dBm input at center, carrier frequency 1 GHz, 400 Hz/1 kHz input/modulated frequency
0 dBm input power level, reference level = 10 dBm, Atten=Auto
PM demodulation accuracy, ±3% of measurement bandwidth
typical
0 dBm input at center, carrier frequency 1 GHz, 1 kHz/5 kHz input/modulated frequency
0 dBm input power level, reference level = 10 dBm, Atten=Auto
SignalVu-PC applications performance summary
AM/FM/PM and direct audio
measurement (SVAxx-SVPC)
Carrier frequency range (for (1/2 × audio analysis bandwidth) to maximum input frequency
modulation and audio
measurements)
Maximum audio frequency 10 MHz
span
FM measurements (Mod. index Carrier Power, Carrier Frequency Error, Audio Frequency, Deviation (+Peak, -Peak, Peak-Peak/2, RMS), SINAD, Modulation
>0.1) Distortion, S/N, Total Harmonic Distortion, Total Non-harmonic Distortion, Hum and Noise
AM measurements Carrier Power, Audio Frequency, Modulation Depth (+Peak, -Peak, Peak-Peak/2, RMS), SINAD, Modulation Distortion, S/N, Total
Harmonic Distortion, Total Non-harmonic Distortion, Hum and Noise
www.tek.com 19Datasheet
SignalVu-PC applications performance summary
PM measurements Carrier Power, Carrier Frequency Error, Audio Frequency, Deviation (+Peak, -Peak, Peak-Peak/2, RMS), SINAD, Modulation
Distortion, S/N, Total Harmonic Distortion, Total Non-harmonic Distortion, Hum and Noise
Audio filters Low pass, kHz: 0.3, 3, 15, 30, 80, 300, and user-entered up to 0.9 × audio bandwidth
High pass, Hz: 20, 50, 300, 400, and user-entered up to 0.9 × audio bandwidth
Standard: CCITT, C-Message
De-emphasis (μs): 25, 50, 75, 750, and user-entered
File: User-supplied .TXT or .CSV file of amplitude/frequency pairs. Maximum 1000 pairs
Performance Conditions: Unless otherwise stated, performance is given for:
characteristics, typical Modulation rate = 5 kHz
AM depth: 50%
PM deviation 0.628 Radians
FM AM PM Conditions
Carrier Power accuracy Refer to instrument amplitude accuracy
Carrier Frequency ± 0.5 Hz + (transmitter Refer to instrument ± 0.2 Hz + (transmitter FM deviation: 5 kHz /
accuracy frequency × ref. freq. frequency accuracy frequency × ref. freq. 100 kHz
error) error)
Depth of Modulation NA ± 0.2%+(0.01 * NA Rate: 5 kHz
accuracy measured value) Depth: 50%
Deviation accuracy ± (1% × (rate + NA ± 100% * (0.01 + FM deviation: 100 kHz
deviation)+50 Hz) (measured rate/1 MHz))
Rate accuracy ± 0.2 Hz ± 0.2 Hz ± 0.2 Hz FM deviation: 5 kHz /
100 kHz
Residual THD 0.10% 0.16% 0.1% FM Deviation: 5 kHz /
100 kHz
Rate: 1 kHz
Residual SINAD 43 dB 56 dB 40 dB FM deviation 5 kHz
FM deviation 100 kHz
Rate: 1 kHz
APCO P25 Measurements
Application (SV26xx-SVPC)
Measurements RF output power, operating frequency accuracy, modulation emission spectrum, unwanted emissions spurious, adjacent channel
power ratio, frequency deviation, modulation fidelity, frequency error, eye diagram, symbol table, symbol rate accuracy, transmitter
power and encoder attack time, transmitter throughput delay, frequency deviation vs. time, power vs. time, transient frequency
behavior, HCPM transmitter logical channel peak adjacent channel power ratio, HCPM transmitter logical channel off slot power,
HCPM transmitter logical channel power envelope, HCPM transmitter logical channel time alignment, cross-correlated markers
Modulation fidelity, typical C4FM ≤ 1.0%
HCPM ≤ 0.5%
HDQPSK ≤ 0.25%
Input signal level is optimized for best modulation fidelity.
Bluetooth Measurements
Application (SV27xx-SVPC and
SV31xx-SVPC)
Supported standards Bluetooth® 4.2 Basic Rate, Bluetooth® 4.2 Low Energy, Bluetooth® 4.2 Enhanced Data Rate. Bluetooth® 5 when SV31 is enabled.
Measurements Peak Power, Average Power, Adjacent Channel Power or InBand Emission mask, -20 dB Bandwidth, Frequency Error, Modulation
Characteristics including ΔF1avg (11110000), ΔF2avg (10101010), ΔF2 > 115 kHz, ΔF2/ΔF1 ratio, frequency deviation vs. time
with packet and octet level measurement information, Carrier Frequency f0, Frequency Offset (Preamble and Payload), Max
Frequency Offset, Frequency Drift f1-f0, Max Drift Rate fn-f0 and fn-fn-5, Center Frequency Offset Table and Frequency Drift table,
color-coded Symbol table, Packet header decoding information, eye diagram, constellation diagram
20 www.tek.comSpectrum Analyzer
SignalVu-PC applications performance summary
Output power (BR and LE), Supported measurements: Average power, peak power
typical mean
Level uncertainty: refer to instrument amplitude and flatness specification
Measurement range: signal level > –70 dBm
Modulation characteristics, Supported measurements: ΔF1avg, ΔF2avg, ΔF2avg/ ΔF1avg, ΔF2max%>=115kHz (basic rate), ΔF2max%>=115kHz (low energy)
typical mean
Deviation range: ±280 kHz
Deviation uncertainty (at 0 dBm):Datasheet
SignalVu-PC applications performance summary
LTE Downlink RF measurements
(SV28xx-SVPC)
Standard Supported 3GPP TS 36.141 Version 12.5
Frame Format supported FDD and TDD
Measurements and Displays Adjacent Channel Leakage Ratio (ACLR), Spectrum Emission Mask (SEM), Channel Power, Occupied Bandwidth, Power vs. Time
Supported showing Transmitter OFF power for TDD signals and LTE constellation diagram for Primary Synchronization Signal and
Secondary Synchronization Signal with Cell ID, Group ID, Sector ID, RS (Reference Signal) Power and Frequency Error.
ACLR with E-UTRA bands 1st Adjacent Channel 60 dB (RSA507A)
(typical, with noise correction)
2nd Adjacent Channel 62 dB (RSA507A)
Mapping (MAPxx-SVPC)
Supported map types Pitney Bowes MapInfo (*.mif), Bitmap (*.bmp), Open Street Maps (.osm)
Saved measurement results Measurement data files (exported results)
Map file used for the Google Earth KMZ file
measurements
Recallable results files (trace MapInfo-compatible MIF/MID files
and setup files)
Pulse measurements (SVPxx-
SVPC)
Measurements (nominal) Pulse-Ogram™ waterfall display of multiple segmented captures, with amplitude vs time and spectrum of each pulse. Pulse
frequency, Delta Frequency, Average on power, Peak power, Average transmitted power, Pulse width, Rise time, Fall time,
Repetition interval (seconds), Repetition interval (Hz), Duty factor (%), Duty factor (ratio), Ripple (dB), Ripple (%), Droop (dB),
Droop (%), Overshoot (dB), Overshoot (%), Pulse- Ref Pulse frequency difference, Pulse- Ref Pulse phase difference, Pulse-
Pulse frequency difference, Pulse- Pulse phase difference, RMS frequency error, Max frequency error, RMS phase error, Max
phase error, Frequency deviation, Phase deviation, Impulse response (dB),Impulse response (time), Time stamp.
Minimum pulse width for 150 ns
detection, typical
Average ON power at 18 °C to ±0.4 dB + absolute amplitude accuracy
28 °C, typical
For pulses of 300 ns width or greater, duty cycles of .5 to .001, and S/N ratio ≥ 30 dB
Duty factor, typical ±0.2% of reading
For pulses of 450 ns width or greater, duty cycles of .5 to .001, and S/N ratio ≥ 30 dB
Average transmitted power, ±0.5 dB + absolute amplitude accuracy
typical
For pulses of 300 ns width or greater, duty cycles of .5 to .001, and S/N ratio ≥ 30 dB
Peak pulse power, typical ±1.2 dB + absolute amplitude accuracy
For pulses of 300 ns width or greater, duty cycles of .5 to .001, and S/N ratio ≥ 30 dB
Pulse width, typical ±0.25% of reading
For pulses of 450 ns width or greater, duty cycles of .5 to .001, and S/N ratio ≥ 30 dB
Playback of recorded signals
(SV56)
Playback file type R3F recorded by RSA306, RSA500, or RSA600
Recorded file bandwidth 40 MHz
22 www.tek.comSpectrum Analyzer
SignalVu-PC applications performance summary
File playback controls General: Play, stop, exit playback
Location: Begin/end points of playback settable from 0-100%
Skip: Defined skip size from 73 μs up to 99% of file size
Live rate: Plays back at 1:1 rate to recording time
Loop control: Play once, or loop continuously
Memory requirement Recording of signals requires storage with write rates of 300 MB/sec. Playback of recorded files at live rates requires storage with
read rates of 300 MB/sec.
WLAN Measurements, 802.11a/b/g/
j/p (SV23xx-SVPC)
Measurements WLAN power vs. time; WLAN symbol table; WLAN constellation; spectrum emission mask; error vector magnitude (EVM) vs.
symbol (or time), vs subcarrier (or frequency); mag error vs symbol (or time), vs. subcarrier (or frequency); phase error vs symbol
(or time), vs. subcarrier (or frequency); channel frequency response vs. symbol (or time), vs. subcarrier (or frequency); spectral
flatness vs. symbol (or time), vs. subcarrier (or frequency)
Residual EVM - 802.11a/g/j /p 2.4 GHz, 20 MHz BW: -39 dB
(OFDM), 64-QAM, typical
5.8 GHz, 20 MHz BW: -38 dB
Input signal level optimized for best EVM, average of 20 bursts, ≥16 symbols each
Residual EVM - 802.11b, 2.4 GHz, 11 Mbps: 1.3 %
CCK-11, typical
Input signal level optimized for best EVM, average of 1,000 chips, BT = .61
WLAN Measurements 802.11n
(SV24xx-SVPC)
Measurements WLAN power vs. time; WLAN symbol table; WLAN constellation; spectrum emission mask; error vector magnitude (EVM) vs.
symbol (or time), vs subcarrier (or frequency); mag error vs symbol (or time), vs. subcarrier (or frequency); phase error vs symbol
(or time), vs. subcarrier (or frequency); channel frequency response vs. symbol (or time), vs. subcarrier (or frequency); spectral
flatness vs. symbol (or time), vs. subcarrier (or frequency)
EVM performance - 802.11n, 2.4 GHz, 40 MHz BW: -38 dB
64-QAM, typical
5.8 GHz, 40 MHz BW: -38 dB
Input signal level optimized for best EVM, average of 20 bursts, ≥16 symbols each
WLAN Measurements 802.11ac
(SV25xx-SVPC)
Measurements WLAN power vs. time; WLAN symbol table; WLAN constellation; spectrum emission mask; error vector magnitude (EVM) vs.
symbol (or time), vs subcarrier (or frequency); mag error vs symbol (or time), vs. subcarrier (or frequency); phase error vs symbol
(or time), vs. subcarrier (or frequency); channel frequency response vs. symbol (or time), vs. subcarrier (or frequency); spectral
flatness vs. symbol (or time), vs. subcarrier (or frequency)
EVM performance - 802.11ac, 5.8 GHz, 40 MHz BW : -38 dB
256-QAM, typical
Input signal level optimized for best EVM, average of 20 bursts, ≥16 symbols each
EMC pre-compliance and
troubleshooting (EMCVUxx-SVPC)
Standards EN55011, EN55012, EN55013, EN55014, EN55015, EN55025, EN55032, EN60601, DEF STAN, FCC Part 15, FCC Part18, MIL-
STD 461G
Features EMC-EMI display, Wizard to setup accessories and limit lines, Inspect, Harmonic Markers, Level Target, Compare Traces,
Measure Ambient, Report generation, Re-measure Spot
Detectors +Peak, Avg, Avg (of logs), Avg (VRMS), CISPR QuasiPeak, CISPR Peak, CISPR Average, CISPR Average of Logs, MIL +Peak,
DEF STAN Avg, DEF STAN Peak
Limit lines Up to 3 Limit Lines with corresponding margins
Resolution BW Set per standard or user definable
Dwell time Set per standard or user definable
Report format PDF, HTML, MHT,RTF, XLSX, Image File format
www.tek.com 23Datasheet
SignalVu-PC applications performance summary
Accessory type Antenna, Near Field Probe, Cable, Amplifier, Limiter, Attenuator, Filter, Other
Correction format Gain/Loss Constant, Gain/loss table, Antenna Factor
Traces Save/recall up to 5 traces, Math trace (trace1 minus trace2), Ambient trace
Return Loss, Distance-to-Fault,
and Cable Loss measurements
Measurements Return Loss, Cable Loss, Distance-to-Fault (DTF)
Frequency range 10 MHz to 3 GHz (RSA503A)
10 MHz to 7.5 GHz (RSA507A/513A/518A)
Sweep speed 14
5 ms/point, Return Loss measurement
5 ms/point, Distance-to-Fault measurement
5 ms/point, Cable Loss measurement
Frequency resolution 500 Hz
Return Loss measurement Return Loss of 0 to 15 dB: ±0.5 dB
error
Return Loss of 15 to 25 dB: ±1.5 dB
Return Loss of 25 to 35 dB: ±4.0 dB
Return Loss measurement ±1.5 dB from 10 MHz to 6.8 GHz
error at 14 dB Return Loss
±3.0 dB from 6.8 GHz to 7.5 GHz
Return Loss measurement 50 dB
range
Interference immunity Return Loss Measurement Error within specifications for the following conditions:
+5 dBm interferer power within 800 kHz of measurement point
+5 dBm interferer power more than 800 kHz away from measurement point
(High power test level. Interferer not included in accuracy assessment.)
Distance-to-Fault range 1500 m or 15 dB one-way cable loss capable, user defined
Maximum range is a function of the cable velocity factor and the frequency step size as follows:
Range = ( Vp2× c ) × ( FstopN −− F1start )
Where:
Vp = Cable velocity factor relative to the speed of light
c = Speed of light (m/s)
Fstart = Sweep start frequency (Hz)
Fstop = Sweep stop frequency (Hz)
N = number of sweep points
Distance-to-Fault resolution RSA503A, (RG-58Vp=0.66): 0.03 m (User Definable)
RSA507A, (RG-58Vp=0.66): 0.01 m (User Definable)
Minimum resolution is a function of the cable velocity factor and the frequency step size as follows:
Resolution = ( Vp2× c ) × ( Fstop −1 Fstart )
or
Range
Resolution = ( )
N−1
14 201 point sweep Measured using a Panasonic Toughpad FZ-G1, Intel® Core™ i5-5300U 2.3GHz Processor, 8GB RAM, 256GB SSD, Windows®7 Pro. Return Loss,Cable Loss, or Distance-to-Fault display is
the only measurement on screen.
24 www.tek.comSpectrum Analyzer
Input and output ports
Inputs, outputs, and inferfaces
RF input RSA503A/507A: N type, female
RSA513A/518A: N type, female (ships standard with this connector)
RSA513A/518A: Planar Crown, 50 Ω. Users can select this connector instead of the N type in order to select the connector that
best fits their applications. (Users can use adapters compatible with the planar crown that best fits their application.)
External frequency reference BNC, female
input
Trigger/Sync input BNC, female
Tracking Generator Source N type, female
Output
GPS Antenna SMA, female
USB Device Port USB 3.0 – Type A
USB Status LED LED, dual color red/green
LED states:
Steady Red: USB power applied, or resetting
Steady Green: Initialized, ready for use
Blinking Green: Transferring data to host
Battery Status LED LED, green
LED states:
Blinking Green: External power connected, charging battery
Off – no external power connected or battery fully charged
Installation requirements
Maximum power dissipation (fully 15 W maximum. Maximum line current is 0.2 A at 90 V line.
loaded)
Surge current 2 A peak maximum, at 25 °C (77 °F) for ≤ 5 line cycles, after the product has been turned off for at least 30 seconds.
Cooling clearance Bottom, top
25.4 mm ( 1.0 in.)
Sides
25.4 mm (1.0 in.)
Rear: 25.4 mm (1.0 in.)
External DC input
Voltage 18 V
Voltage range limits Operation: +12.0 V to +19.95 V
Battery Charging: +17.5 V to +19.95 V
Connector type 2.5mm male
Center conductor: positive
Outer conductor: negative
AC Adapter Output 18 V ± 5%, 5 A (90 W max)
Center conductor: positive
Outer conductor: negative
www.tek.com 25Datasheet
Installation requirements
Battery
Nominal voltage 14.4 V
Nominal capacity 6140 mAh
Battery technology Li-Ion, Smart Battery compatible with SMBus interface.
Battery operational life 4 hours of continuous operation per battery
Battery operating temperature Operating (discharge) 15: -10 °C to +45 °C (14 °F to 113 °F) 16 Charging: 0 °C to 45 °C (32 °F to 113 °F)
Battery storage life 2 years at +20 °C (68 °F) nominal Max storage duration between recharge: 10 months @ +20 °C (68 °F)
Physical characteristics
Physical characteristics
Height 67.3 mm (2.65 in)
Width 299.1 mm (11.78 in)
Depth 271.3 mm (10.68 in)
Net weight RSA503A/507A: 2.54 kg (5.6 pounds) without battery 2.99 kg (6.6 pounds) with battery
RSA513A/518A: 3.40 kg (7.5 pounds) without battery 3.85 kg (8.5 pounds) with battery
Environmental and safety
Temperature
Without battery installed Operating: -10 °C to +55 °C (+14 °F to +131 °F)
Non-operating: -51 °C to +71 °C (-60 °F to +160 °F)
With battery installed Operating (discharge) 15 : -10 °C to +45 °C (+14 °F to +113 °F) 16
Charging: 0 °C to 45 °C (32 °F to +113 °F)
Humidity
Without battery Installed MIL-PRF-28800F Class 2
Operating:
5% to 95±5%RH (relative humidity) in the temperature range of +10 °C to 30 °C (+50 °F to 86 °F)
5% to 75±5% RH above +30 °C to 40 °C (+86 °F to 104 °F)
5% to 45±5% RH above +40 °C up to +55 °C (+86 °F to +131 °F)Spectrum Analyzer
Environmental and safety
Exposure
Splash-Proof test, operating No potential of shock hazard after exposure to non-operating Splash Proof Test per IEC529, level IP52
and non-operating
Dust resistance test, operating Test method per IEC529, level IP52, test conditions 13.4 and 13.5.
and non-operating
Salt exposure test, structural Standard MIL-STD-810, Method 509.1, Procedure 1
parts
Dynamics
Vibration
Operating Tektronix Class 2 Random Vibration Test at 2.66 GRMS: 5-500 Hz, 3 Axes at 10 min/axis
Non-Operating MIL-PRF-28800F Class 2
0.030 g2/Hz., 10 500 Hz, 30 minutes per axis, 3 axes (90 minutes total)
Shock
Operating Test method per Military Standard MIL-PRF-28800F 1-4
Non-Operating Exceeds the requirements of Military Standard MIL-PRF-28800F
Handling and transit
Bench handling, operating MIL-PRF-28800F Class 2
Transit drop, non-operating MIL-PRF-28800F Class 2
Free-Fall drop, non-operating 32 inches
www.tek.com 27Datasheet
Ordering information
Instrument models
RSA503A: USB real time spectrum analyzer, 9 kHz - 3.0 GHz, 40 MHz acquisition bandwidth
RSA507A: USB real time spectrum analyzer, 9 kHz - 7.5 GHz, 40 MHz acquisition bandwidth
RSA513A: USB real time spectrum analyzer, 9 kHz - 13.6 GHz, 40 MHz acquisition bandwidth
RSA518A: USB real time spectrum analyzer, 9 kHz - 18.0 GHz, 40 MHz acquisition bandwidth
The RSA500 series instruments require a PC with Windows 7, Windows 8/8.1, or Windows 10, 64-bit operating system and a USB
3.0 connection. 8 GB RAM and 20 GB free drive space is required for installation of SignalVu-PC. For full performance of the real
time features of the RSA500, an Intel Core i7 4th generation processor is required. Processors of lower performance can be used,
with reduced real-time performance. Storage of streaming data requires that the PC be equipped with a drive capable of streaming
storage rates of 300 MB/sec.
Includes: USB 3.0 cable (2 M), A-A connection, screw lock, shoulder strap, carrying case (with room for unit, tablet, accessories),
quick-start manual (printed), connector covers, WFM200BA Li-Ion rechargeable battery pack, WFM200BA Li-Ion battery pack
instructions (printed), AC power adapter, power cord (see power plug options), USB memory device with SignalVu-PC, API and
documentation files. A GPS antenna is not included with the instrument. See Accessories for available GPS antennas.
Instrument options
Option Description
Option 04 Tracking generator:
10 MHz to 3 GHz (RSA503A)
10 MHz to 7.5 GHz (RSA507A, RSA513A, RSA518A)
Options
RSA500A power plug options
Opt. A0 North America power plug (115 V, 60 Hz)
Opt. A1 Universal Euro power plug (220 V, 50 Hz)
Opt. A2 United Kingdom power plug (240 V, 50 Hz)
Opt. A3 Australia power plug (240 V, 50 Hz)
Opt. A4 North America power plug (240 V, 50 Hz)
Opt. A5 Switzerland power plug (220 V, 50 Hz)
Opt. A6 Japan power plug (100 V, 50/60 Hz)
Opt. A10 China power plug (50 Hz)
Opt. A11 India power plug (50 Hz)
Opt. A12 Brazil power plug (60 Hz)
Opt. A99 No power cord
Language options for the RSA500
Opt. L0 English manual
Opt. L1 French manual
Opt. L2 Italian manual
28 www.tek.comSpectrum Analyzer
Opt. L3 German manual
Opt. L4 Spanish manual
Opt. L5 Japanese manual
Opt. L6 Portuguese manual
Opt. L7 Simplified Chinese manual
Opt. L8 Traditional Chinese manual
Opt. L9 Korean manual
Opt. L10 Russian manual
RSA500A service options
Opt. C3 Calibration Service 3 Years
Opt. C5 Calibration Service 5 Years
Opt. D1 Calibration Data Report
Opt. D3 Calibration Data Report 3 Years (with Opt. C3)
Opt. D5 Calibration Data Report 5 Years (with Opt. C5)
Opt. R5 Repair Service 5 Years (including warranty)
Warranty
RSA500 series warranty: 3 years.
Alaris DF-A0047 antenna: 1-year warranty, provided by Alaris in South Africa. Service and calibration provided by Alaris.
Tablet
Tablets ordered separately The Panasonic FZ-G1 Toughbook tablet controller is recommended for use with the RSA500 series for portable field applications.
The Windows 10 version of the tablet is available for purchase from Panasonic at https://na.panasonic.com/us/computers-tablets-
handhelds/tablets/tablets/toughbook-g1 and other third party Web sites.
Licenses
Licenses
A variety of optional, licensed applications are available for purchase for SignalVu-PC. These licenses can be associated with and stored on either your PC or any RSA300
series, RSA500 series, RSA600 series, and RSA7100A spectrum analyzers. Licenses can be purchased as an option to your hardware or separately as a Node-locked or a
Floating license.
Contact your local Tektronix Account Manager to purchase a license. If your purchased license is not ordered as an option to your instrument, you will receive an email with a
list of the applications purchased and the URL to the Tektronix Product License Web page, where you will create an account and can then manage your licenses using the
Tektronix Asset Management System (AMS): http://www.tek.com/products/product-license.
AMS provides an inventory of the license(s) in your account. It enables you to check out or check in a license and view the history of licenses.
Optional applications are enabled by one of the following license types.
www.tek.com 29Datasheet
License type Description
Node locked license (NL) purchased as an option to your instrument This license i s initially assigned to a specific host id, which can be either a PC or
an instrument. It can be reassociated to either a PC or another spectrum analyzer
two times using Tek AMS.
When associated with an instrument, this license is factory-installed on that
instrument at the time of manufacture. It will be recognized by any PC operating
with SignalVu-PC when the instrument is connected. However, the licensed
application is deactivated from the PC if the licensed instrument is disconnected.
This is the most common form of licensing, as it simplifies management of your
applications.
Node locked license (NL) purchased separately This license is initially assigned to a specific host id, which can be either a PC or an
instrument. It can be reassociated to either a PC or instrument two times using Tek
AMS.
This license is delivered via email and is associated with either your PC or with an
instrument when you install the license.
This license should be purchased when you want your license to stay on your PC,
or if you have an existing USB instrument on which you would like to install a
license.
Floating license(FL) purchased separately This license can be moved between different host ids, which can be either PCs or
instruments. It can be reassociated to different PCs or instruments an unlimited
number of times using Tek AMS.
This license is delivered via email and is associated with either your PC or with an
instrument when you install the license.
This is the most flexible license and is recommended in applications where the
license needs to be moved frequently.
SignalVu-PC application-specific modules
The following SignalVu-PC license options are available.
Application license Description
SVANL-SVPC AM/FM/PM/Direct Audio Analysis - Node Locked License
SVAFL-SVPC AM/FM/PM/Direct Audio Analysis - Floating License
SVTNL-SVPC Settling Time (frequency and phase) measurements - Node Locked License
SVTFL-SVPC Settling Time (frequency and phase) measurements - Floating License
SVMNL-SVPC General Purpose Modulation Analysis to work with analyzer of acquisition bandwidthSpectrum Analyzer
Application license Description
SV31NL-SVPC Bluetooth 5 measurements (requires SV27) - Node Locked License
SV31FL-SVPC Bluetooth 5 measurements (requires SV27) - Floating License
MAPNL-SVPC Mapping - Node Locked License
MAPFL-SVPC Mapping - Floating License
SV56NL-SVPC Playback of recorded files - Node Locked License
SV56FL-SVPC Playback of recorded files - Floating License
CONNL-SVPC SignalVu-PC connection to the MDO4000B series mixed-domain oscilloscopes - Node Locked License
CONFL-SVPC SignalVu-PC connection to the MDO4000B series mixed-domain oscilloscopes - Floating License
SV2CNL-SVPC WLAN 802.11a/b/g/j/p/n/ac and live link to MDO4000B to work with analyzer of acquisition bandwidthYou can also read