Enhanced structural connectivity within the motor loop in professional boxers prior to a match - Nature
←
→
Page content transcription
If your browser does not render page correctly, please read the page content below
www.nature.com/scientificreports
OPEN Enhanced structural connectivity
within the motor loop
in professional boxers prior
to a match
Yuichi Ogino 1,8*, Hiroaki Kawamichi 1,8, Daisuke Takizawa2, Sho K. Sugawara3,
Yuki H. Hamano4, Masaki Fukunaga 4, Keiko Toyoda 6, Yusuke Watanabe5, Osamu Abe 5
,
Norihiro Sadato 4, Shigeru Saito1 & Shigeru Furui7
Professional boxers train to reduce their body mass before a match to refine their body movements.
To test the hypothesis that the well-defined movements of boxers are represented within the motor
loop (cortico-striatal circuit), we first elucidated the brain structure and functional connectivity
specific to boxers and then investigated plasticity in relation to boxing matches. We recruited 21 male
boxers 1 month before a match (Time1) and compared them to 22 age-, sex-, and body mass index
(BMI)-matched controls. Boxers were longitudinally followed up within 1 week prior to the match
(Time2) and 1 month after the match (Time3). The BMIs of boxers significantly decreased at Time2
compared with those at Time1 and Time3. Compared to controls, boxers presented significantly higher
gray matter volume in the left putamen, a critical region representing motor skill training. Boxers
presented significantly higher functional connectivity than controls between the left primary motor
cortex (M1) and left putamen, which is an essential region for establishing well-defined movements.
Boxers also showed significantly higher structural connectivity in the same region within the motor
loop from Time1 to Time2 than during other periods, which may represent the refined movements of
their body induced by training for the match.
Plasticity is an intrinsic property of the human b rain1 and refers to structural or functional changes (which may
trigger each other) that occur in the human brain to adjust to changes in the external or internal environment2,3.
Recently, because physical training and learning skills alter the human brain structure, there has been a growing
interest in the study of the structural and functional plasticity of elite athletes’ brains, which results in exceptional
performance through training4,5. Brain structure differs among different sports because different motor and
cognitive abilities are required for each type of s port6. Training also induces structural changes corresponding
to the required skill for each s port7. For example, after training, jugglers showed increased gray matter volume
(GMV) in the mid-temporal cortex, the brain area responsible for analyzing visual movement8. However, the
jugglers in the s tudy8 were non-athlete volunteers, and the training for juggling was not training for a match
that would discriminate between “winners” and “losers.” To achieve victory in a match, appropriate and elabo-
rate training is required b eforehand9–11. From this viewpoint, the neural correlates underlying training before a
match should be investigated.
For approximately 1 month before the weigh-in (24 h before the match), professional boxers undergo physical
training to reduce their body weight and restrict their oral intake to compete in several pre-designated weight
1
Department of Anesthesiology, Gunma University Graduate School of Medicine, 3‑39‑15 Maebashi,
Gunma 371‑8510, Japan. 2Department of Anesthesiology, Japanese Red Cross Medical Center, 1‑22 Hiroo,
Shibuya‑ku, Tokyo 150‑8935, Japan. 3Neural Prosthesis Project, Tokyo Metropolitan Institute of Medical Science,
2‑1‑6 Kamikitazawa, Setagaya‑ku, Tokyo 156‑8506, Japan. 4Division of Cerebral Integration, Department
of System Neuroscience, National Institute for Physiological Sciences, 38 Nishigonaka, Myodaiji, Okazaki,
Aichi 444‑8585, Japan. 5Department of Radiology, Graduate School of Medicine, The University of Tokyo, 7‑3‑1
Hongo, Bunkyo‑ku, Tokyo 113‑8655, Japan. 6Department of Radiology, The Jikei University School of Medicine,
3‑28‑8 Nishi‑Shimbashi, Minato‑Ku, Tokyo 105‑864, Japan. 7Department of Radiology, Graduate School of
Medicine, Teikyo University, 2‑11‑1 Kaga, Itabashi‑ku, Tokyo 173‑8605, Japan. 8These authors contributed equally:
Yuichi Ogino and Hiroaki Kawamichi. *email: oginoyuichi@me.com
Scientific Reports | (2021) 11:9015 | https://doi.org/10.1038/s41598-021-88368-4 1
Vol.:(0123456789)
www.nature.com/scientificreports/
Figure 1. General design. We included 21 licensed male boxers and 22 age-, sex-, and BMI-matched controls.
We followed up boxers at time points Time2 and Time3. All imaging statistical thresholds for VBM and rs-fMRI
were set to uncorrected p < 0.001 at the voxel level, and FWE-corrected p < 0.05, at the cluster level. FWE, family-
wise error; rs-fMRI, resting-state functional magnetic resonance imaging; VBM, voxel-based morphometry.
divisions (body mass is used as a proxy for body size)9–12. The significance of weight reduction for boxers before
a match is described by the Japanese Boxing Commission (JBC), the governing body of Japan’s professional
boxing league (https://www.jbc.or.jp/), to refine the accurate and smooth movements by trimming off excess
body fat. The “increasing well-defined movement of the body” in boxers can be defined as the smoothness of the
sequential motor movements acquired through skill training13. For instance, the one-two combination punch (a
left jab and a straight punch of the dominant right arm) is a representative sequential motor movement in the
training of b oxers14. The smoothness of the body movement is highly correlated and represented by neuronic
activity in the distributed network of the cortico-striatal circuit (also called the “motor loop”). This circuit
mainly involves the striatum, thalamus, and motor cortical regions (premotor area, supplementary motor area,
and primary motor area)15,16. When a motor skill is well learned and acquired, the representation of the motor
sequence is distributed within the motor l oop17,18. The well-defined movement acquired by motor skill training
has also been shown to be associated with an increase in myelin, as measured by diffusion-weighted imaging
(DWI), suggesting that the skilled movement increases structural connectivity in white matter in addition to
improving functional c onnectivity19.
Thus, we hypothesized that the heightened well-defined movements of the body of boxers before the match
would be represented by enhanced functional and structural connectivity within the motor loop. We first elu-
cidated the brain structure specific to boxers. Then, we investigated their functional and structural plasticity
around the time of the match. To elucidate the boxer-specific brain structure, voxel-based morphometry (VBM)20
was conducted to examine the structural differences between boxers and age-, sex-, and BMI (body mass index:
weight [kg/height [m]2)-matched non-athlete controls. Based on the results of the VBM analysis, we then con-
ducted seed-based functional connectivity analyses21 of resting-state functional magnetic resonance imaging
(rs-fMRI) data to elucidate boxers’ specific functional connectivity. We then investigated the brain plasticity
of functional and structural connectivity in boxers by measuring the following three time points: 1 month
before a match (Time1), within 1 week of the match (Time2), and 1 month after the match (Time3) (Fig. 1). We
anticipated that any structure specific to boxers would be represented in the brain regions associated with motor
skill training and that boxers’ functional and structural connectivity within the motor loop would be enhanced
before the match.
Results
BMI and match results. The BMIs of boxers were as follows: 21.9 ± 4.0 at Time1, 20.6 ± 1.1 at Time2, and
22.3 ± 1.4 at Time3, while the BMIs of the controls were 21.4 ± 1.6 (Fig. 2). The BMI decrease in boxers from
Time1 to Time2 was − 1.37 ± 0.7. The BMIs of boxers were significantly decreased in Time2 [F(2, 59) = 10.21,
p < 0.01] in repeated measures ANOVA. Bonferroni correction was used for post-hoc analysis. The demograph-
ics of the participants are presented in Table 1. A total of 21 match outcomes were as follows: 14 wins, one draw,
and six defeats.
Scientific Reports | (2021) 11:9015 | https://doi.org/10.1038/s41598-021-88368-4 2
Vol:.(1234567890)
www.nature.com/scientificreports/

                                  Figure 2.  Body mass index of controls and boxers. The boxer BMI at Time2 was significantly decreased [F(2,
                                  59) = 10.21, p < 0.01] in repeated measures ANOVA. Bonferroni correction was used for the post-hoc analysis.
                                  BMI, body mass index; n.s., not significant.

                                                                  Controls           Boxers Time1       Boxers Time2   Boxers Time3
                                   N                              22                 21
                                   Age                            27.2 ± 3.8         26.7 ± 4.0
                                   BMI                            21.4 ± 1.6         21.9 ± 4.0         20.6 ± 1.1 *   22.3 ± 1.4
                                   Handedness                     All right-handed   All right-handed
                                   Stanford Sleepiness Scale      2.5 ± 1.1          2.8 ± 0.6           2.9 ± 0.8      2.7 ± 1.0

                                  Table 1.  Controls and boxers (Time1, Time2, and Time3). Controls were non-athlete male participants age-,
                                  sex-, and BMI-matched with boxers at Time1. The BMI at Time2 was significantly decreased [F(2, 59) = 10.21,
                                  *p < 0.01] in repeated measures ANOVA. Bonferroni correction was used for the post-hoc analysis. BMI, body
                                  mass index; N, number of participants; Time1, 1 month before the match; Time2, within 1 week before the
                                  match; and Time3, 1 month after the match.

                                  Figure 3.  Boxers’ specific structural anatomy ([Boxers (Time1) > Controls]). The location of a significantly
                                  larger cluster in the left OFC and left putamen of boxers are shown as red and blue regions, respectively, on the
                                  z-axis. The statistical threshold for significant differences was set to FWE-corrected p < 0.05, at the cluster level,
                                  with uncorrected p < 0.001 at the voxel level. Lt, left; OFC, orbitofrontal cortex.

                                  VBM results. Compared with controls, boxers showed significantly larger GMV in the left putamen in the
                                  striatum [top peak = (− 22, − 18, − 5); cluster FWE-corrected p = 0.016; number of voxels = 1,299], and the left
                                  orbitofrontal cortex (OFC) [top peak = (21, 2, − 6); cluster FWE-corrected p < 0.001; number of voxels = 1,969] in
                                  contrast [Boxers (Time1) > Controls]. Otherwise, we did not find any significant clusters in the opposite contrast
                                  [Controls > Boxers (Time1)] (Fig. 3 and Table 2).

Scientific Reports |   (2021) 11:9015 |                        https://doi.org/10.1038/s41598-021-88368-4                                                  3

                                                                                                                                                   Vol.:(0123456789)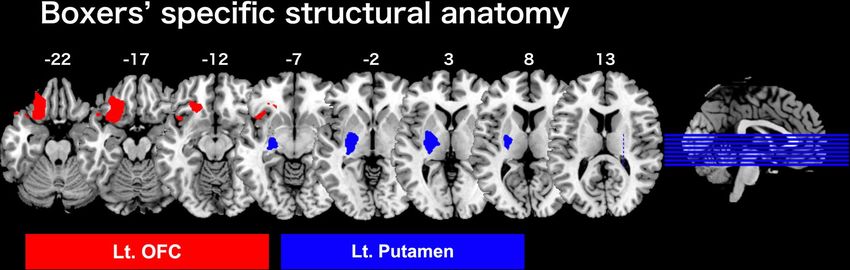
www.nature.com/scientificreports/

                                                                   Cluster FWE p           Cluster size          t Value          Peak (x, y, z)
                                                                                                                 5.80             (− 18, 29, − 20)
                                             Lt. OFC               < 0.001                 1969                  5.65             (− 24, 27, − 18)
                                                                                                                 5.63             (− 27, 36, − 21)
                                                                                                                 5.55             (− 22, − 18, − 5)
                                             Lt. putamen           0.016                   1299
                                                                                                                 5.08             (− 27, − 26, − 2)

                                            Table 2.  Boxers specific anatomical structures ([Boxers (Time1) > Controls]). The statistical threshold for
                                            significant differences was set at FWE corrected p < 0.05, at the cluster level with uncorrected p < 0.001 at the
                                            voxel level. Lt, left; OFC, orbitofrontal cortex.

                                            Figure 4.  Boxers’ specific functional connectivity ([Boxers (Time1) > Controls]). (a) The statistical contrast
                                            between boxers and controls when seeding the left OFC (shown in red) delineated significant functional
                                            connectivity with the left hippocampus and the right MTG (shown in yellow colour respectively). (b) The
                                            statistical contrast between boxers and controls when seeding the left putamen (shown in blue) delineated
                                            significant functional connectivity with the left M1 cluster including the left premotor and anterior insular
                                            cortex, the left postCG, and Rt. IFG cluster including the right anterior insular cortex (shown in cyan colour
                                            respectively). The statistical threshold for significance was set at FWE-corrected p < 0.05 at the cluster level, with
                                            an uncorrected p < 0.001 at the voxel level. Lt, left; Rt, right; M1, primary motor cortex; MTG, middle temporal
                                            gyrus; postCG, postcentral gyrus; IFG, inferior frontal gyrus.

                                            rs‑fMRI results.       We compared the rs-fMRI data between boxers and controls to elucidate the functional
                                            connectivity specific to boxers. When seeding the left putamen cluster (Fig. 4b and Table 3), the contrast [Box-
                                            ers [(Time1) > Controls] demonstrated a significant difference in functional connectivity between the left puta-
                                            men (seed) and the following regions: the right inferior frontal gyrus (IFG) [top peak = (58, 14, 12); cluster
                                            FWE-corrected p < 0.001; number of voxels = 692], left primary motor cortex (M1) located in the precentral
                                            gyrus [top peak = (− 54, 4, 14); cluster FWE-corrected p < 0.001; number of voxels = 608], and left postcentral
                                            gyrus (postCG) [top peak = (− 42, − 38, 54); cluster FWE-corrected p = 0.006; number of voxels = 236]. When
                                            seeding the left OFC (Fig. 4a and Table 3), in the same contrast [Boxers [(Time1) > Controls], we found a sig-
                                            nificant difference in functional connectivity between the left OFC cluster (seed) and the following regions: the
                                            left hippocampus [top peak = (− 24, − 14, − 26); cluster FWE-corrected p = 0.033; number of voxels = 175] and
                                            the right middle temporal gyrus (MTG) [top peak = (60, − 40, − 4); cluster FWE-corrected p = 0.040; number of
                                            voxels = 168]. Otherwise, we did not find any significant difference in functional connectivity in the opposite
                                            contrast [Controls > Boxers (Time1)]. In addition, there was no significant difference in the functional con-
                                            nectivity in the contrasts [Boxers (Time2) > Boxers (Time1)] and [Boxers (Time2) > Boxers (Time3)], that is, no
                                            significant change in the functional connectivity in boxers was observed.

          Scientific Reports |   (2021) 11:9015 |                https://doi.org/10.1038/s41598-021-88368-4                                                      4

Vol:.(1234567890)
www.nature.com/scientificreports/
Cluster FWE p Cluster size t Value Peak (x, y, z)
Seed: Lt. OFC
5.05 (− 24, − 14, − 26)
Lt. hippocampus 0.033 175
3.70 (− 26, − 24, − 20)
4.18 (60, − 40, − 4)
Rt. MTG 0.040 168 4.07 (52, − 38, 12)
3.90 (52, − 44, 2)
Seed: Lt. putamen
6.97 (58, 14, 12)
Rt. IFG < 0.001 692 4.30 (50, 6, 14)
4.06 (40, 10, 4)
5.21 (− 54, 4, 14)
Lt. M1 < 0.001 608 4.06 (− 44, 4, 12)
3.98 (− 58, 12, 4)
4.76 (− 42, − 38, 54)
Lt. postCG 0.006 236 3.92 (− 48, − 30, 38)
3.61 (− 56, − 28, 40)
Table 3. Boxer specific functional connectivity ([Boxers (Time1) > Controls]). The statistical threshold for
significant differences was set at FWE corrected p < 0.05, at the cluster level with uncorrected p < 0.001 at the
voxel level. Lt, left; Rt, right; MTG, middle temporal gyrus; IFG, inferior frontal gyrus; M1, primary motor
cortex; postCG, postcentral gyrus.
Figure 5. The functional connectivity area correlated with BMI decrease in Time2. The functional connectivity
area (shown in red) that correlated with a decrease in BMI, seeding the left putamen cluster (shown in blue)
at Time2, is shown. The M1 cluster is indicated by a red arrow. Using the eigenvariate function in SPM, we
extracted the average beta value (as the functional connectivity value) in the sphere of an 8-mm radius (16-mm
diameter) located at the peak of the left M1 cluster, based on our hypothesis testing the representation within the
motor loop of boxers. The right scatter graph indicates a significant correlation ( R2 = 0.3076, [p = 0.011]) between
the decrease in BMI and the average beta value within the sphere of the left M1 cluster at Time2. BMI, body
mass index; M1, primary motor cortex; SPM, statistical parametric mapping.
In a regression analysis between the BMI reduction data and functional connectivity data for seeding the
putamen cluster at Time2, boxers showed significant BMI decreases covaried with functional connectivity
between the putamen and brain regions, such as the left insula [top peak = (− 40, 2, 12); cluster FWE-corrected
p < 0.001; number of voxels = 8897], right insula [top peak = (36, 6, 8); cluster FWE-corrected p < 0.001; number
of voxels = 7927], cingulate gyrus (dorsal part of the anterior cingulate cortex) [top peak = (36, 6, 8); cluster
FWE-corrected p < 0.001; number of voxels = 2463], and left M1 cluster [top peak = (− 30, − 4, 50); cluster FWE-
corrected p = 0.002; number of voxels = 293) (Fig. 5 and Table 4).
Scientific Reports | (2021) 11:9015 | https://doi.org/10.1038/s41598-021-88368-4 5
Vol.:(0123456789)www.nature.com/scientificreports/
Cluster FWE p Cluster size t Value Peak (x, y, z)
11.90 (− 40, 2, 12)
Lt. insula < 0.001 8897 9.23 (− 28, 12, 4)
9.05 (− 38, 6, − 2)
8.42 (36, 6, 8)
Rt. insula < 0.001 7927 8.36 (62, 14, 18)
7.94 (32, − 16, 8)
7.73 (− 10, 8, 48)
Cingulate gyrus (dorsal part of ACC) < 0.001 2463 7.28 (− 2, 6, 52)
7.07 (− 6, 4, 40)
6.67 (− 30, − 4, 50)
Lt. M1 0.002 293 6.04 (− 34, − 14, 46)
5.27 (− 34, − 4, 42)
Table 4. The functional connectivity area correlated with BMI decrease seeding the left putamen cluster at
Time2. We present only the significant brain regions within the cerebral cortex (excluding the cerebellum
and brainstem clusters for presentation purposes). The statistical threshold for significant differences was
set at FWE corrected p < 0.05, at the cluster level with uncorrected p < 0.001 at the voxel level. ACC, anterior
cingulate cortex; BMI, body mass index; FWE, family-wise error; Lt, left; Rt, right; M1, primary motor cortex.
DWI results. Based on the results of the functional connectivity analysis, we calculated the number of
streamlines (structural connectivity strength) in controls and boxers (Time1, Time2, and Time3) from two seed
regions (the left OFC or the left putamen) to the following five target regions (Fig. 6a): 1. the left hippocampus
(from the left OFC), 2. the right MTG (from the left OFC), 3. the left postcentral gyrus (from the left puta-
men), 4. the left M1 (from the left putamen) and 5. the right IFG (from the left putamen). Figure 6b illustrates
a representative image of tractography results from the left putamen to the left M1 for a subject, and Fig. 6c
illustrates the number of streamlines from the left putamen to the left M1 in boxers (Time1, Time2, and Time3)
and controls. A significant increase in the number of streamlines between the left M1 and the left putamen was
found uniquely between Time1 and Time2 (Fig. 6c) [F(2, 40) = 4.76, p = 0.02] in repeated measures ANOVA.
Bonferroni correction was used for the post-hoc analysis. No significant change in the number of streamlines in
other contrasts was found.
Discussion
Boxers showed enhanced structural connectivity between the M1 and putamen within the motor loop before the
match (from Time1 to Time2). As discussed below, we suggest that the current findings may represent physi-
cally reinforced well-defined movements of the body of the boxer, induced by training with weight reduction
for the match.
Boxing is a sport that comprises a wide variety of sequential movements, including offensive, defensive, and
counterattack skills14. The M1 (located in the precentral gyrus) is the primary site for movement generation22,23.
Functional and structural changes occur in M1 during motor skill t raining17. For example, rigorous motor skill
training in athletes induces an expansion of the proximal muscle representation in the M1 contralateral to the
dominant arm24. The smoothness of the movement is represented by the neuronal activity in the motor loop15,16.
M1 plays an especially important role in the smoothness of movement, as well as in the acquisition and optimiza-
tion of a novel series of inter-related movements induced by repeated motor skill training13,25. Such well-trained
smooth movement is accurate and well-defined, leading to performance i mprovement13.
We first showed that one of the specifically altered brain structures in boxers was the left putamen (Fig. 3). The
putamen of the basal ganglia is the main corticostriatal input station26. Neurophysiological studies have identi-
fied the putamen, together with the M1 and cerebellum, to be the major brain regions involved in motor skill
learning26. The essential brain module dedicated to motor sequence learning resides in the p utamen13. Together
with a previous finding that increased GMV in the putamen was accompanied by repetitive motor skill training
in athletes27, it is conceivable that boxers’ higher GMV in the putamen, relative to controls, would be the result
of repeated motor skill training before a match.
Boxers exhibited significantly enhanced structural connectivity between the M1 and putamen within the
motor loop before the match (from Time1 to Time2) (Fig. 6). The putamen exhibits a somatotopic organization
from the forelimb region of the M1 in monkeys, indicating functional and structural connectivity between the
M1 and putamen within the motor loop28. Doyon et al.29 reviewed human functional neuroimaging studies that
demonstrated that as motor skill training gradually progresses and consolidates, the contribution between the
M1 and putamen progressively increases and enables sequential movements, indicating that the connectivity
between the M1 and putamen is crucial for establishing the well-defined physical movements induced by motor
skill training. Larger white matter volume has often been associated with higher motor skill t raining30. Thus, we
suggest that the enhanced structural connectivity in the white matter before the match is a representation of the
well-defined movements of the body induced by motor skill training for the match in boxers.
Scientific Reports | (2021) 11:9015 | https://doi.org/10.1038/s41598-021-88368-4 6
Vol:.(1234567890)www.nature.com/scientificreports/
Figure 6. Diffusion tractography and the number of streamlines from the Lt. putamen to Lt. M1. (a) Seed and
target brain regions used in diffusion tractography analysis are shown in red; These region-of-interests were
defined based on the results from group-level analyses in the resting-state functional connectivity: from Lt.
OFC (seed) to Lt. hippocampus and right MTG, and from Putamen (seed) to Lt. M1, Lt. postcentral gyrus and
right IFG. b) Representative images of tractography results from the Lt. Putamen to Lt. M1 for a subject, are
illustrated. Streamlines were originally drawn in native space, and then were transformed into MNI space. (c)
The number of streamlines from the Lt. putamen to Lt. M1 in controls and boxers (Time1, Time2, and Time3).
Only the number of streamlines from Lt. putamen to Lt. M1 between Time1 and Time2 in boxers shows a
significant increase [F(2, 40) = 4.76, p = 0.02] in repeated measures ANOVA. Bonferroni correction was used in
post-hoc analysis. Lt, left; OFC, orbitofrontal cortex; M1, primary motor cortex; MTG, middle temporal gyrus;
IFG, inferior frontal gyrus; ANOVA, analysis of variance.
In addition, we found that controls (non-athletes who did not undergo daily training) had equivalent num-
bers of streamlines from the left putamen to Lt. M1 as boxers did at Time2 (Fig. 6b). In this regard, one r eview30
described the interpretation of white matter plasticity findings in elite athletes and controls as “challenging.” For
example, compared to controls, professional ballet dancers have been found to have lower white matter volume
and lower fractional anisotropy underlying motor skill t raining31. Variables such as the sports discipline in
question, the amount of training, training content, training stage, or strategy might underlie the discrepancies
among the studies30. Histologically, de novo myelination in the white matter with long timescales, such as weeks
or months, has been found to be important for motor skill t raining32,33. Therefore, longitudinal observation in
such timescales is a crucial factor for assessing white matter plasticity using MRI measures30, as we present here
in boxers.
Sensorimotor coordination in boxers is also worth discussing. When training a new motor sequence, we
must execute the correct order of movements while simultaneously optimizing sensorimotor parameters, such as
trajectory, timing, velocity, and force, otherwise known as sensorimotor c oordination17,26. In the current rs-fMRI
results, the M1 cluster contains activation not only in the precentral gyrus but also in the premotor cortex and
anterior insular cortex (Fig. 4b). Although we labeled the identified cluster “M1” because the cluster contains the
most active voxels, in the precentral gyrus, the peak coordinates (− 54, 4, 14) in the “M1” cluster (Table 3) reside
in the ventral premotor cortex34. The ventral premotor cortex is directly connected to the precentral gyrus and
receives rich input from the second somatosensory area and the anterior insular cortex35. This area is also known
to be important for sensorimotor coordination, especially visuo-motor coordination35,36. In monkeys, electrical
stimulation of this area causes an apparent defensive movement as if protecting the body, suggesting that the
ventral premotor region may play a role in maintaining a safety margin around the body and guiding the move-
ment in response to nearby objects with sensory-motor coordination37. In addition, activation in the precentral
gyrus in the M1 cluster was located dorsal to that of the ventral premotor cortex (Fig. 4b). From a traditional
somatotopic view of the human M1, the current precentral activation corresponds to the lip, tongue, and face as
ventral sensorimotor c ortex38 or borderline h and39. However, such a somatotopic map in the M1 becomes more
overlapping as we learn coordinated movements, suggesting that the M1 may participate in integrating muscles in
meaningful ways rather than in segregating the control of individual m uscles40,41. In a mapping study, polysensory
Scientific Reports | (2021) 11:9015 | https://doi.org/10.1038/s41598-021-88368-4 7
Vol.:(0123456789)www.nature.com/scientificreports/
neurons, which respond to tactile, visual, and auditory stimuli, were found to be clustered in the precentral gyrus,
dorsal to the ventral premotor cortex (the same position as that of current precentral activation in the M1 cluster),
suggesting that the current zone in the precentral gyrus plays an important role in sensorimotor c oordination42.
Additionally, electrical stimulation of this precentral zone evokes a specific set of movements typically used to
defend the body from objects that are near approaching42. Sensorimotor coordination and defensive movements
are required for boxer training. Therefore, we consider that the current activation in the M1 cluster represents
activation associated with sensorimotor coordination, especially with defensive movements in boxers before the
match, rather than the somatotopic representation of the body parts.
In contrast to the enhanced structural connectivity observed in boxers in this study, we could not find any
functionally corresponding enhanced changes between the M1 cluster and putamen from Time1 to Time2.
Boxers instead showed a correlation between BMI reduction and average beta value within M1 in the functional
connectivity area, seeding the putamen at Time2 (within 1 week prior to a match; Fig. 5). These findings imply
that the functional connectivity between the M1 cluster and putamen in boxers was associated with training
and weight reduction before the match.
It is important to discuss another specific finding in boxers: the OFC (Fig. 3). The OFC has been regarded as
the strongest brain region linking food intake, appetite, and other types of rewards and hedonic experiences43.
In humans and higher primates, the OFC receives multimodal information about the sensory properties of food,
representing incentive salience, hedonic impact, and subjective hedonic e xperience44. The subjective pleasant-
ness of food is represented in the OFC, together with the reward value of taste, olfactory, and somatosensory
components of food44. Similarly, the OFC encodes food reward value only when hunger is present45. Body
mass regulation in boxing creates a number of unique challenges, and practices related to the manipulation of
body mass before the match must be integrated into diet strategies and performance c onsiderations11. Boxers
typically reduce their weight by continuous physical training and restricting oral intake in both the short- and
long-term, prior to the weigh-in9–11. The boxer’s typical approach to weight reduction usually results in a 5–6 kg
average weight reduction via severe acute and chronic energy restriction and dehydration46. Hunger is the most
frequently mentioned claim during weight r eduction47. In the current rs-fMRI results, the left OFC of boxers
showed significant functional connectivity with the left hippocampus and right MTG (Table 3). The hippocampus
is not only central to memory but is also involved in appetite by monitoring the state of hunger and satiety in
humans48. The MTG also has a functional interaction with the OFC in long-term memory, especially with regard
to food s timuli49,50. Therefore, we suppose that the higher GMV in OFC than controls might represent the strong
hunger and food craving observed during the weight reduction period in boxers, and boxers’ OFC might have
functional connectivity with the regions associated with appetite and food memory.
Future investigations into the physical and physiological attributes of boxers are required to enrich the current
data set. Because the strategies before a match in combat sports are generally associated with multiple factors,
such as diet, training strategies, and time m anagement10, the relationship between weight reduction before the
match and athletes’ performance improvement would be qualitative assessments. Nevertheless, future studies
may require real quantitative performance values and psychological values, such as hunger or distress before
the match, as well as event-related potentials in a go/no-go task of professional fencers and boxers51, hand speed
measurement in b oxers52, or reaction time and punch analysis in b
oxers53. Such measurements could enable us
to validate the correlations between these physiological performance values (improvement) and brain plasticity
in athletes.
In conclusion, boxers showed enhanced structural connectivity between the M1 and putamen within the
motor loop before the match. We suggest that the current findings might represent physically reinforced well-
defined movements of the body of the boxer, induced by training with weight reduction for the match. The
current finding might provide a newly grounded significance of the training accompanying weight reduction
before a match for a combat sports match.
Methods
General design and participants. A cross-sectional and longitudinal approach was used to test our
hypothesis, as shown in Fig. 1. Two groups of participants (boxers and controls) were recruited. The boxer group
consisted of 21 male professional licensed boxers from the Japanese Boxing Commission (aged 26.7 ± 4.0 years),
who had experienced 13.4 ± 8.9 professional matches before enrolment in this study (data are presented as
means ± standard deviation, unless otherwise indicated). The control group consisted of 22 healthy non-athletic
males (aged 27.2 ± 3.8 years). Controls were age-, sex-, and BMI-matched with boxers. These inclusion criteria
for controls were based on previous studies in the sports domain, especially after findings showing that BMI
correlates with regional morphology54,55. Boxers underwent MRI scanning at three time points for longitudinal
investigation: Time1 (1 month before the match), Time2 (within 1 week before the match), and Time3 (1 month
after the match), while controls underwent scanning only once. The Time3 measurements were conducted to
explore whether the boxer’s BMI would reverse after the match as an indicator of their training load after the
match, based on the results of a previous study on marathon runners56.
All participants were right-handed according to the Edinburgh Handedness I nventory57, with no history of
psychiatric or neurological disorders. All participants received monetary compensation for their time. The proto-
col was approved by the ethical committee of Teikyo University, Tokyo, Japan (UMIN000017635). All participants
completed the Stanford Sleepiness Scale, which examines drowsiness before MRI scanning (a seven-grade evalu-
ation)58. All participants provided written informed consent and underwent weight and height measurements
immediately before MRI scanning.
Scientific Reports | (2021) 11:9015 | https://doi.org/10.1038/s41598-021-88368-4 8
Vol:.(1234567890)www.nature.com/scientificreports/
Imaging measurement protocol. All MRI data were acquired using a 3 T scanner (MAGNETOM Skyra;
Siemens, Ltd., Erlangen, Germany) at Teikyo University. Each participant’s head was immobilized within a
20-channel phased-array head coil. The total experiment time was approximately 45 min, including body weight
and height measurements, and the MRI scan (total imaging acquisition time was 30 min 22 s).
VBM. Whole-brain high-resolution T1-weighted anatomical MRI scan using a magnetization prepared
rapid acquisition gradient echo (MP-RAGE) was conducted on each participant (echo time [TE] = 2.28 ms;
repetition time [TR] = 2,300 ms; field of view [FOV] = 256 mm × 256 mm; flip angle [FA] = 9°; matrix
size = 1 mm × 1 mm × 1 mm; slice thickness = 1 mm; and slice numbers = 240 coronal slices).
rs‑fMRI. rs-fMRI scans were obtained while participants were resting comfortably in the scanner with their
eyes open for a period of 6 min 15 s, using an echo planar imaging (EPI) gradient-echo sequence (TE = 30 ms;
TR = 2,500 ms; FOV = 212 mm2 × 212 mm2; FA = 80°; matrix size = 3.31 mm × 3.31 mm × 4 mm; 40 slices; slice
thickness = 3.2 mm; total number of volumes = 148).
DWI. Diffusion-weighted spin echo EPI sequence scans were obtained with 2.0 mm slice thickness and a
reconstructed image matrix = 1 mm × 1 mm × 2 mm (TE = 71 ms, TR = 10,400 ms, FOV = 220 mm × 220 mm,
FA = 90°, b-value = 1,000 s/mm2, bandwidth = 1818 Hz/pixel; slice numbers = 80 transverse slices without inter-
slice gap, covering the whole brain). Diffusion was measured in 30 non-collinear directions with a b-value of
1000 s/mm2, followed by a non-diffusion-weighted volume (reference volume).
Data processing and statistical analyses. VBM. For voxel-based morphometry, the VBM8 toolbox
(revision 435) implemented in Statistical Parametric Mapping (SPM) 8 (revision 5236; The Wellcome Trust
Centre for Neuroimaging; www.fil.ion.ucl.ac.uk/spm) was applied20,59. Structural images were corrected for bias-
field inhomogeneity and spatially normalized with diffeomorphic anatomical registration through exponenti-
ated Lie algebra (DARTEL) to the Montreal Neurological Institute (MNI) template. Tissues were classified as
gray matter, white matter, or cerebrospinal fluid. In the modulation process, nonlinear deformation was used for
normalization so that voxel intensities reflected regional GMVs adjusted for individual brain sizes. Images were
then smoothed to a Gaussian kernel with a full width at half maximum (FWHM) of 8 mm.
After pre-processing the structural images, we conducted a group analysis. We further conducted a whole-
brain analysis to investigate GMV differences between the groups using a two-sample t-test, using age as the
’effects of no interest.’ The statistical threshold of significant difference was set at the family-wise error (FWE)
corrected p < 0.05 at the cluster level, with uncorrected p < 0.001 as a cluster-forming threshold using the non-
stationary correction60. The clusters identified in the group analysis were labeled using the Talairach d aemon61
after accounting for the discrepancy between the MNI space and Talairach s pace62. Significant clusters specific to
boxers were revealed by the contrasts [Boxers (Time1) > Controls] and [Controls > Boxers (Time1)] were defined
as the seed regions for the following longitudinal connectivity analysis.
rs‑fMRI. The functional images were pre-processed using SPM8 (revision 5236; The Wellcome Trust Centre
for Neuroimaging). The first four volumes of each resting-state fMRI run were discarded to allow the blood-
oxygen-level-dependent (BOLD) signal to reach a steady state. After performing motion correction, we used
Fourier phase-shift interpolation to correct the slice timing of each image to the middle slice. The mean of
the realigned EPI images was then co-registered with the T1-weighted MP-RAGE image. Subsequently, the
co-registered T1-weighted MP-RAGE image was normalized to the MNI template using linear and nonlinear
three-dimensional transformations. The parameters from this normalization process were applied to each EPI
image. Finally, the anatomically normalized EPI images were resampled to a voxel size of 2 mm × 2 mm × 2 mm
and spatially smoothed using a Gaussian kernel of 8 mm FWHM. After realignment, we examined head move-
ment parameters.
After pre-processing the functional images, we conducted a functional connectivity analysis using the CONN
toolbox (version 15.h) on SPM8. In the functional connectivity analysis, we set the clusters as seed regions based
on the cross-sectional VBM analysis above. Using the CONN toolbox, we conducted a seed-driven functional
connectivity analysis (seed-to-voxel analysis) in which Pearson’s correlation coefficient was calculated between
the seed time course and the time course of all other v oxels63. The correlation coefficients were then converted
to normally distributed scores using Fisher’s transformation to allow for general linear model analysis, using the
same significance threshold (FWE corrected p < 0.05 at the cluster level, with uncorrected p < 0.001 at the voxel
level). Differences between groups were assessed using t-tests. To elucidate the functional connectivity specific
to boxers, we compared boxers with controls [Boxers (Time1) > Controls] and [Controls > Boxers (Time1)]. To
investigate enhanced functional connectivity within the motor loop before the match, we conducted the following
contrasts: [boxers (Time2) > boxes (Time1)] and [boxes (Time2) > boxes (Time3)]. Furthermore, to investigate
the effect of weight reduction on functional connectivity at the time point before the match (Time2), we also
conducted a regression analysis using the BMI reduction data ([boxers’ BMI in Time2] minus [boxers’ BMI in
Time1]) and Time2 functional connectivity data. In the regression analysis, we defined BMI decrease as an effect
of interest, sex, and age as the effects of no interest. The clusters identified were labeled using automated anatomi-
cal labeling (AAL) atlases64 implemented in CONN. We adopted the label of the AAL atlas, whose region was the
most covered with voxels in the identified cluster. This labeling procedure is because the cluster correction we
adopted (FWE-corrected p < 0.05 at the cluster level) measures in units of contiguous voxels and is determined
based on the estimated distribution of cluster sizes, rather than the location of the peak c oordinate65.
Scientific Reports | (2021) 11:9015 | https://doi.org/10.1038/s41598-021-88368-4 9
Vol.:(0123456789)www.nature.com/scientificreports/
DWI. Individual DWI data were pre-processed using the Diffusion Toolbox in the FMRIB Software Library
(FSL: www.fmrib.ox.ac.uk/analysis)66,67. Motion and eddy-current corrections were performed using affine
registration of the b0 images. The skull and non-brain tissues were removed using the brain extraction tool.
Probability density functions for up to two principal fiber directions were estimated at each voxel in the brain
using the Bayesian estimation of diffusion parameters that were obtained via a sampling technique toolbox
(BedpostX)68. Finally, to illustrate the streamlines from the seed to the target region, we performed multi-fiber
probabilistic tractography using ProbtrackX implemented in FSL (maximum number of steps = 2,000, curvature
threshold = 0.2, step length = 0.5). We drew 5,000 streamlines from each voxel in each seed region to the target
regions. We defined the seed and target regions based on the results of functional connectivity a nalysis69.
To compare the number of streamlines in each white matter pathway between groups or times, we defined the
mask for each white matter pathway based on the individual streamline maps from each seed to the target region.
First, the individual tract was defined as the voxels where the number of passing streamlines was above 100 and
was binarized. Second, we defined group-level masks of each tract as voxels that were included in the individual
tract from half of the subjects in each group. Then, the mask for each tract was defined as the shared voxels
between the two group-level tracts (i.e., the boxer’s tract and control’s tract). Finally, the number of streamlines
was estimated by averaging the number within each mask of the tracts in each individual and at each time point.
Ethics approval. The protocol was approved by the ethical committee of Teikyo University, Tokyo, Japan
(UMIN000017635).
Data availability
Available from the corresponding author upon reasonable request.
Received: 12 September 2020; Accepted: 12 April 2021
References
1. Pascual-Leone, A., Amedi, A., Fregni, F. & Merabet, L. B. The plastic human brain cortex. Annu. Rev. Neurosci. 28, 377–401 (2005).
2. May, A. Experience-dependent structural plasticity in the adult human brain. Trends Cogn. Sci. 15, 475–482 (2011).
3. Zatorre, R. J., Fields, R. D. & Johansen-Berg, H. Plasticity in gray and white: Neuroimaging changes in brain structure during
learning. Nat. Neurosci. 15, 528–536 (2012).
4. Yarrow, K., Brown, P. & Krakauer, J. W. Inside the brain of an elite athlete: The neural processes that support high achievement in
sports. Nat. Rev. Neurosci. 10, 585–596 (2009).
5. Makris, S. Sport neuroscience revisited (?): A commentary. Front. Hum. Neurosci. 8, 929 (2014).
6. Nakata, H., Yoshie, M., Miura, A. & Kudo, K. Characteristics of the athletes’ brain: Evidence from neurophysiology and neuroim-
aging. Brain Res. Rev. 62, 197–211 (2010).
7. Chang, Y. Reorganization and plastic changes of the human brain associated with skill learning and expertise. Front. Hum. Neurosci.
8, 35 (2014).
8. Draganski, B. et al. Neuroplasticity: Changes in grey matter induced by training. Nature 427, 311–312 (2004).
9. Craig, A. H. Making Weight in Combat Sports. Combat Sports Medicine Ch Vol. 2, 21–39 (Springer, London, 2009).
10. Franchini, E., Brito, C. J. & Artioli, G. G. Weight loss in combat sports: Physiological, psychological and performance effects. J.
Int. Soc. Sports. Nutr. 9, 52 (2012).
11. Reale, R., Slater, G. & Burke, L. M. Acute-weight-loss strategies for combat sports and applications to Olympic success. Int. J. Sports.
Physiol. Perform. 12, 142–151 (2017).
12. Chaabène, H. et al. Amateur boxing: Physical and physiological attributes. Sports Med. 45, 337–352 (2015).
13. Orban, P. et al. The multifaceted nature of the relationship between performance and brain activity in motor sequence learning.
Neuroimage 49, 694–702 (2010).
14. Ashker, E. I. S. Technical performance effectiveness subsequent to complex motor skills training in young boxers. Eur. J. Sport Sci.
12, 475–484 (2012).
15. Nambu, A. A new dynamic model of the cortico-basal ganglia loop. Prog. Brain Res. 143, 461–466 (2004).
16. Middleton, F. A. & Strick, P. L. Basal ganglia and cerebellar loops: Motor and cognitive circuits. Brain Res. Rev. 31, 236–250 (2000).
17. Hikosaka, O., Nakamura, K., Sakai, K. & Nakahara, H. Central mechanisms of motor skill learning. Curr. Opin. Neurobiol. 12,
217–222 (2002).
18. Doyon, J. et al. Contributions of the basal ganglia and functionally related brain structures to motor learning. Behav. Brain Res.
199, 61–75 (2009).
19. Lakhani, B. et al. Motor skill acquisition promotes human brain myelin plasticity. Neural Plast. 2016, 7526135 (2016).
20. Ashburner, J. & Friston, K. J. Voxel-based morphometry–the methods. Neuroimage 11, 805–821 (2000).
21. Fox, M. D., Zhang, D., Snyder, A. Z. & Raichle, M. E. The global signal and observed anticorrelated resting state brain networks.
J. Neurophysiol. 101, 3270–3283 (2009).
22. Omrani, M., Kaufman, M. T., Hatsopoulos, N. G. & Cheney, P. D. Perspectives on classical controversies about the motor cortex.
J Neurophysiol. 118, 1828–1848 (2017).
23. Banker, L. & Tadi, P. Neuroanatomy, Precentral Gyrus (StatPearls Publishing, 2020).
24. Tyc, F., Boyadjian, A. & Devanne, H. Motor cortex plasticity induced by extensive training revealed by transcranial magnetic
stimulation in human. Eur. J. Neurosci. 21, 259–266 (2005).
25. Shibasaki, H. et al. Both primary motor cortex and supplementary motor area play an important role in complex finger movement.
Brain 116, 1387–1398 (1993).
26. Penhune, V. B. & Steele, C. J. Parallel contributions of cerebellar, striatal and M1 mechanisms to motor sequence learning. Behav.
Brain Res. 226, 579–591 (2012).
27. Park, I. S. et al. Basketball training increases striatum volume. Hum. Mov. Sci. 30, 56–62 (2011).
28. Nambu, A., Kaneda, K., Tokuno, H. & Takada, M. Organization of corticostriatal motor inputs in monkey putamen. J. Neurophysiol.
88, 1830–1842 (2002).
29. Doyon, J., Gabitov, E., Vahdat, S., Lungu, O. & Boutin, A. Current issues related to motor sequence learning in humans. Curr. Opin.
Behav. Sci. 20, 89–97 (2018).
30. Sampaio-Baptista, C. & Johansen-Berg, H. White matter plasticity in the adult brain. Neuron 96, 1239–1251 (2017).
Scientific Reports | (2021) 11:9015 | https://doi.org/10.1038/s41598-021-88368-4 10
Vol:.(1234567890)www.nature.com/scientificreports/
31. Hänggi, J., Koeneke, S., Bezzola, L. & Jäncke, L. Structural neuroplasticity in the sensorimotor network of professional female ballet
dancers. Hum. Brain Mapp. 31, 1196–1206 (2010).
32. McKenzie, I. A. et al. Motor skill learning requires active central myelination. Science 34, 318–322 (2014).
33. Xiao, L. et al. Rapid production of new oligodendrocytes is required in the earliest stages of motor-skill learning. Nat. Neurosci.
19, 1210–1217 (2016).
34. Mayka, M. A., Corcos, D. M., Leurgans, S. E. & Vaillancourt, D. E. Three-dimensional locations and boundaries of motor and
premotor cortices as defined by functional brain imaging: A meta-analysis. Neuroimage 31, 1453–1474 (2006).
35. Binkofski, F. & Buccino, G. The role of ventral premotor cortex in action execution and action understanding. J. Physiol. 99, 396–405
(2006).
36. Picard, N. & Strick, P. L. Imaging the premotor areas. Curr. Opin. Neurobiol. 11, 663–672 (2001).
37. Graziano, M. S. & Cooke, D. F. Parieto-frontal interactions, personal space, and defensive behavior. Neuropsychologia 44, 845–859
(2006).
38. Conant, D., Bouchard, K. E. & Chang, E. F. Speech map in the human ventral sensory-motor cortex. Curr. Opin. Neurobiol. 24,
63–67 (2014).
39. Meier, J. D., Aflalo, T. N., Kastner, S. & Graziano, M. S. Complex organization of human primary motor cortex: A high-resolution
fMRI study. J. Neurophysiol. 100, 1800–1812 (2008).
40. Graziano, M. S. & Aflalo, T. N. Mapping behavioral repertoire onto the cortex. Neuron 56, 239–251 (2007).
41. Harrison, T. C. & Murphy, T. H. Motor maps and the cortical control of movement. Curr. Opin. Neurobiol. 24, 88–94 (2014).
42. Cooke, D. F. & Graziano, M. S. Sensorimotor integration in the precentral gyrus: Polysensory neurons and defensive movements.
J. Neurophysiol. 91, 1648–1660 (2004).
43. Kringelbach, M. L. The human orbitofrontal cortex: Linking reward to hedonic experience. Nat. Rev. Neurosci. 6, 691–702 (2005).
44. Kringelbach, M. L., O’Doherty, J., Rolls, E. T. & Andrews, C. Activation of the human orbitofrontal cortex to a liquid food stimulus
is correlated with its subjective pleasantness. Cereb. Cortex 13, 1064–1071 (2003).
45. Rolls, E. T. Reward systems in the brain and nutrition. Annu. Rev. Nutr. 36, 435–470 (2016).
46. Morton, J. P., Robertson, C., Sutton, L. & MacLaren, D. P. Making the weight: A case study from professional boxing. Int. J. Sport
Nutr. Exerc. Metab. 20, 80–85 (2010).
47. Pettersson, S., Pipping, E. M. & Berg, C. M. The food and weight combat. A problematic fight for the elite combat sports athlete.
Appetite 59, 234–242 (2012).
48. Volkow, N. D., Wang, G. J. & Baler, R. D. Reward, dopamine and the control of food intake: Implications for obesity. Trends Cogn.
Sci. 15, 37–46 (2011).
49. Simons, J. S. & Spiers, H. J. Prefrontal and medial temporal lobe interactions in long-term memory. Nat. Rev. Neurosci. 4, 637–648
(2003).
50. Simmons, W. K., Martin, A. & Barsalou, L. W. Pictures of appetizing foods activate gustatory cortices for taste and reward. Cereb.
Cortex 15, 1602–1608 (2005).
51. Bianco, V., Di Russo, F., Perri, R. L. & Berchicci, M. Different proactive and reactive action control in fencers’ and boxers’ brain.
Neuroscience 343, 260–268 (2017).
52. Kimm, D. & Thiel, D. V. Hand speed measurements in boxing. Procedia Eng. 112, 502–506 (2015).
53. Chadli, S., Ababou, N. & Ababou, A. A new instrument for punch analysis in boxing. Procedia Eng. 72, 411–416 (2014).
54. Bobb, J. F., Schwartz, B. S., Davatzikos, C. & Caffo, B. Cross-sectional and longitudinal association of body mass index and brain
volume. Hum. Brain Mapp. 35, 75–88 (2014).
55. Schlaffke, L. et al. Sports and brain morphology—A voxel-based morphometry study with endurance athletes and martial artists.
Neuroscience 259, 35–42 (2014).
56. Freund, W. et al. Regionally accentuated reversible brain grey matter reduction in ultra marathon runners detected by voxel-based
morphometry. BMC Sports Sci. Med. Rehabil. 6, 4 (2014).
57. Oldfield, R. C. The assessment and analysis of handedness: The Edinburgh Inventory. Neuropsychologia 9, 97–113 (1971).
58. Hoddes, E. & Dement, W. Z. V. The development and use of the Stanford Sleepiness Scale (SSS). Psychophysiology 9, 150 (1972).
59. Ashburner, J. A fast diffeomorphic image registration algorithm. Neuroimage 38, 95–113 (2007).
60. Hayasaka, S., Phan, K. L., Liberzon, I., Worsley, K. J. & Nichols, T. E. Nonstationary cluster-size inference with random field and
permutation methods. Neuroimage 22, 676–687 (2004).
61. Lancaster, J. L. et al. Automated Talairach atlas labels for functional brain mapping. Hum. Brain Mapp. 10, 120–131 (2000).
62. Lancaster, J. L. et al. Bias between MNI and Talairach coordinates analyzed using the ICBM-152 brain template. Hum. Brain Mapp.
28, 1194–1205 (2007).
63. Whitfield-Gabrieli, S. & Nieto-Castanon, A. Conn: A functional connectivity toolbox for correlated and anticorrelated brain
networks. Brain Connect. 2, 125–141 (2012).
64. Tzourio-Mazoyer, N. et al. Automated anatomical labeling of activations in SPM using a macroscopic anatomical parcellation of
the MNI MRI single-subject brain. Neuroimage 15, 273–289 (2002).
65. Friston, K. J., Worsley, K. J., Frackowiak, R. S., Mazziotta, J. C. & Evans, A. C. Assessing the significance of focal activations using
their spatial extent. Hum. Brain Mapp. 1, 210–220 (1994).
66. Smith, S. M. et al. Advances in functional and structural MR image analysis and implementation as FSL. Neuroimage 23, S208–S219
(2004).
67. Woolrich, M. W. et al. Bayesian analysis of neuroimaging data in FSL. Neuroimage 45, S173–S186 (2009).
68. Behrens, T. E., Berg, H. J., Jbabdi, S., Rushworth, M. F. & Woolrich, M. W. Probabilistic diffusion tractography with multiple fibre
orientations: What can we gain?. Neuroimage 34, 144–155 (2007).
69. van den Heuvel, M. P., Mandl, R. C., Kahn, R. S. & Hulshoff Pol, H. E. Functionally linked resting-state networks reflect the
underlying structural connectivity architecture of the human brain. Hum. Brain Mapp. 30, 3127–3141 (2009).
Acknowledgements
We thank all participants involved in this study. We would like to thank Editage (www.editage.com) for English
language editing.
Author contributions
Y.O. and H.K. analyzed the data, wrote the manuscript, and contributed equally to the work. Y.O. and D.T.
invented a draft plan for the project. Y.O., H.K., D.T., K.T., and S.F. designed and conducted the research. S.S.K.,
Y.H.H., M.F., and N.S. collaborated in this project to analyze and discuss the data. Y.W. and O.A. conducted the
experiments. N.S., S.S., and S.F. supervised the project and edited the manuscript.
Scientific Reports | (2021) 11:9015 | https://doi.org/10.1038/s41598-021-88368-4 11
Vol.:(0123456789)www.nature.com/scientificreports/
Funding
This work was supported by JSPS KAKENHI from the Ministry of Education, Culture, Sports, Science, and
Technology of Japan (MEXT): Grant Number 19K09368, and JP16H06280, Grant-in-Aid for Scientific Research
on Innovative Areas-Resource and technical support platforms for promoting research ’Advanced Bioimaging
Support’.
Competing interests
The authors declare no competing interests.
Additional information
Correspondence and requests for materials should be addressed to Y.O.
Reprints and permissions information is available at www.nature.com/reprints.
Publisher’s note Springer Nature remains neutral with regard to jurisdictional claims in published maps and
institutional affiliations.
Open Access This article is licensed under a Creative Commons Attribution 4.0 International
License, which permits use, sharing, adaptation, distribution and reproduction in any medium or
format, as long as you give appropriate credit to the original author(s) and the source, provide a link to the
Creative Commons licence, and indicate if changes were made. The images or other third party material in this
article are included in the article’s Creative Commons licence, unless indicated otherwise in a credit line to the
material. If material is not included in the article’s Creative Commons licence and your intended use is not
permitted by statutory regulation or exceeds the permitted use, you will need to obtain permission directly from
the copyright holder. To view a copy of this licence, visit http://creativecommons.org/licenses/by/4.0/.
© The Author(s) 2021
Scientific Reports | (2021) 11:9015 | https://doi.org/10.1038/s41598-021-88368-4 12
Vol:.(1234567890)You can also read