Estimating Blood Pressure from the Photoplethysmogram Signal and Demographic Features Using Machine Learning Techniques - MDPI
←
→
Page content transcription
If your browser does not render page correctly, please read the page content below
sensors
Article
Estimating Blood Pressure from the
Photoplethysmogram Signal and Demographic
Features Using Machine Learning Techniques
Moajjem Hossain Chowdhury 1 , Md Nazmul Islam Shuzan 1 , Muhammad E.H. Chowdhury 2, * ,
Zaid B. Mahbub 3 , M. Monir Uddin 3 , Amith Khandakar 2,3 and Mamun Bin Ibne Reaz 4
 1    Department of Electrical and Computer Engineering, North South University, Dhaka 1229, Bangladesh;
      moajjem.hossain@northsouth.edu (M.H.C.); nazmul.shuzan@northsouth.edu (M.N.I.S.)
 2    Department of Electrical Engineering, Qatar University, Doha 2713, Qatar; amitk@qu.edu.qa
 3    Department of Mathematics and Physics, North South University, Dhaka 1229, Bangladesh;
      zaid.mahbub@northsouth.edu (Z.B.M.); monir.uddin@northsouth.edu (M.M.U.)
 4    Department of Electrical, Electronic & Systems Engineering, Universiti Kebangsaan Malaysia,
      Bangi Selangor 43600, Malaysia; mamun@ukm.edu.my
 *    Correspondence: mchowdhury@qu.edu.qa; Tel.: +974-31010775

 Received: 15 March 2020; Accepted: 7 May 2020; Published: 1 June 2020

 Abstract: Hypertension is a potentially unsafe health ailment, which can be indicated directly from the
 blood pressure (BP). Hypertension always leads to other health complications. Continuous monitoring
 of BP is very important; however, cuff-based BP measurements are discrete and uncomfortable to
 the user. To address this need, a cuff-less, continuous, and noninvasive BP measurement system is
 proposed using the photoplethysmograph (PPG) signal and demographic features using machine
 learning (ML) algorithms. PPG signals were acquired from 219 subjects, which undergo preprocessing
 and feature extraction steps. Time, frequency, and time-frequency domain features were extracted
 from the PPG and their derivative signals. Feature selection techniques were used to reduce the
 computational complexity and to decrease the chance of over-fitting the ML algorithms. The features
 were then used to train and evaluate ML algorithms. The best regression models were selected
 for systolic BP (SBP) and diastolic BP (DBP) estimation individually. Gaussian process regression
 (GPR) along with the ReliefF feature selection algorithm outperforms other algorithms in estimating
 SBP and DBP with a root mean square error (RMSE) of 6.74 and 3.59, respectively. This ML model
 can be implemented in hardware systems to continuously monitor BP and avoid any critical health
 conditions due to sudden changes.

 Keywords: blood pressure; photoplethysmograph; feature selection algorithm; machine learning

1. Introduction
     Measuring blood pressure (BP) is an important aspect in monitoring the health of a person.
High blood pressure, generally, means that a person has a higher risk of health problems [1]. High blood
pressure puts a huge amount of strain on the arteries and the heart. This strain can make the arteries
less flexible over time. As they become more inflexible, the lumen becomes narrower. Therefore,
the probability of it being clogged up (clot) increases. A clot is very dangerous and may cause heart
attack, stroke, kidney diseases, and dementia. As a result, it is important for a person to monitor
their blood pressure regularly. In most cases, measuring blood pressure once or twice a day is more
than enough. However, sometimes the doctor needs to track the blood pressure continuously. This is
because blood pressure is known to decrease at night. Therefore, it is useful to measure the blood

Sensors 2020, 20, 3127; doi:10.3390/s20113127                                  www.mdpi.com/journal/sensors
Sensors 2020, 20, x FOR PEER REVIEW 2 of 26
Sensors 2020, 20, 3127 2 of 24
pressure overnight, as an abnormal dip in blood pressure may suggest a higher risk of cardiovascular
problems
pressure [2].
overnight, as an abnormal dip in blood pressure may suggest a higher risk of cardiovascular
problemsThe [2].
current standard methods include either a cuff-based BP measurement or an invasive
procedure for BPstandard
The current measurement.
methods Theinclude
cuff method
either measures
a cuff-based the BPblood pressure after
measurement or aanset interval
invasive
(e.g., of for
procedure 15 BPmin). This meansThe
measurement. that
cuffthe end-result
method measures is discrete
the bloodand uncomfortable
pressure to the (e.g.,
after a set interval user.
ofFurthermore,
15 min). This this process
means thatrequires the armistodiscrete
the end-result be kept and
steady while the inflation
uncomfortable to the and
user.deflation causes
Furthermore,
disturbance
this in the patient’s
process requires the arm sleep. Arterial
to be kept lines
steady management
while the inflationis an
andinvasive procedure
deflation that allows in
causes disturbance for
continuous
the blood Arterial
patient’s sleep. pressurelinesmonitoring.
management However, the invasive
is an invasive procedure procedure
that allows leaves the patient
for continuous
vulnerable
blood to infection.
pressure monitoring. Hence, therethe
However, is ainvasive
need forprocedure
a noninvasive,leavescuff-less, continuous
the patient vulnerable BPtomonitoring
infection.
system.
Hence, With
there is athe
needadvent of digital sensors,
for a noninvasive, cuff-less,signal-processing,
continuous BP monitoringmachine system.
learningWithalgorithms
the adventand
ofadvanced physiological
digital sensors, models help
signal-processing, gatherlearning
machine important humanand
algorithms vital signs using
advanced wearablemodels
physiological sensors
[3,4].gather
help Evenimportant
the indirect estimation
human of blood
vital signs usingpressure
wearable(BP) using
sensors photoplethysmography
[3,4]. (PPG) has
Even the indirect estimation of
become
blood more realistic
pressure (BP) using[5–8].
photoplethysmography (PPG) has become more realistic [5–8].
Photoplethysmography(PPG)
Photoplethysmography (PPG)was wasbeing
beingusedusedforfordecades
decadesfor formeasuring
measuringthe theamount
amountofoflightlight
absorbedororreflected
absorbed reflectedbybyblood
bloodvessels
vesselsininthe
theliving
livingtissue.
tissue.PPGPPGtechnology
technologyisisaaversatile
versatileand
andlow-cost
low-cost
technology[9],
technology [9],which
whichcancanbe beextended
extendedtotodifferent
differentaspects
aspectsofofcardiovascular
cardiovascularsurveillance
surveillanceincluding
including
identificationofof
identification blood
blood oxygen
oxygen saturation,
saturation, heartheart rate,
rate, BP BP estimation,
estimation, cardiac cardiac output, respiration,
output, respiration, arterial
arterialendothelial
ageing, ageing, endothelial control, micro-vascular
control, micro-vascular blood flow, blood
and flow, and autonomic
autonomic function
function [10]. Many[10]. Many
different
different
kinds kinds
of PPG of PPG
signals havesignals have been
been identified andidentified
have beenand haveassociated
shown been shown withassociated with age and
age and cardiovascular
cardiovascular
pathology [11,12].pathology
In clinical[11,12]. In clinical
practice, practice,
PPG signals PPG signals
are recorded from are recorded frombeds
micro-vascular micro-vascular
at exterior
beds locations,
body at exteriorsuch
bodyaslocations, such
the finger, as the finger,
earlobe, earlobe,
forehead, forehead,
and toe [13]. Theandcoverage
toe [13]. The
areacoverage
of the PPG area
of the PPG sensor includes veins, arteries, and numerous capillaries. PPG waveforms
sensor includes veins, arteries, and numerous capillaries. PPG waveforms generally have three distinct generally have
three distinct
features. As shownfeatures. As shown
in Figure 1, a PPGinwaveform
Figure 1,typically
a PPG waveform typically
contains systolic peak, contains
diastolicsystolic
peak, andpeak,
a
diastolic
notch peak, and a notch in between.
in between.
Figure1.1.AA
Figure typical
typical photoplethysmograph
photoplethysmograph (PPG)
(PPG) waveform
waveform withwith
notch,notch, systolic
systolic peak,
peak, and and diastolic
diastolic peak.
peak.
The raw PPG signal typically includes pulsatile and nonpulsatile blood volumes [14]. The pulsatile
portionTheof raw
the PPGPPGsignal
signalis typically
attributedincludes
to the variation
pulsatileinandblood pressure within
nonpulsatile blood the arteries[14].
volumes andTheis
synchronous to the pulse, while the nonpulsating part is a result of normal blood volume,
pulsatile portion of the PPG signal is attributed to the variation in blood pressure within the arteries respiration,
sympathetic nervous system,
and is synchronous and thermoregulation
to the pulse, [15]. Green,
while the nonpulsating partred,
is aand infrared
result light are
of normal often
blood used
volume,
torespiration,
extract PPG waveforms.nervous
sympathetic Red and infrared
system, andlight can reach approximately
thermoregulation [15]. Green, 2.5red,
mm, andwhereas
infraredgreen
light
light can penetrate less than 1 mm into the tissue [16]. Therefore, infrared light
are often used to extract PPG waveforms. Red and infrared light can reach approximately 2.5 mm, is typically used
for acquiring
whereas greenthelight
PPGcan signal for theless
penetrate measurement
than 1 mmofinto bloodthe pressure.
tissue [16].Although
Therefore, theinfrared
PPG tool is ais
light
low-cost
typicallyand
usedportable optical electronic
for acquiring the PPG device, its measurement
signal for the measurement has several
of blood challenges,
pressure.such as, noise
Although the
reduction
PPG tool [17–19] and multi-photodetector
is a low-cost and portable opticalcreation
electronic[20].
device, its measurement has several challenges,
suchSeveral
as, noisetechniques to estimate
reduction [17–19] BP from PPG creation
and multi-photodetector were proposed
[20]. in the recent works.
Some algorithms [21] incorporate waveform analysis and biometrics of PPG to estimate BP, which has
been tested in subjects with different age, height, and weight. When calibrated, PPG shows great
Sensors 2020, 20, x; doi: FOR PEER REVIEW www.mdpi.com/journal/sensors
Sensors 2020, 20, 3127                                                                                3 of 24

potential to track BP fluctuations, which can bring enormous health and economic benefit. An easy
and bio-inspired mathematical model was proposed at [22] to predict estimating systolic BP (SBP) and
diastolic BP (DBP) through careful mathematical analysis of the PPG signals. Systolic and diastolic
blood pressure levels were predicted using the pulse transit time (PTT) in [23,24] and a combination of
paroxysmal atrial tachycardia (PAT) and heart rate in [25], while the combination showed improvement
over PTT alone. The beat-to-beat optical BP measurement method was developed, tested, and reported
using only PPG from fingertips [26]. Key features such as amplitudes and cardiac part phases were
extracted through a fast Fourier transformation (FFT) and used to train an artificial neural network
(ANN), which was then used to estimate BP using PPG. In [27], the support vector machine (SVM)
algorithm showed better accuracy than the linear regression method and ANN.
       The recent growth in the field of deep learning has made it potential for this application. Su et al.,
2018 [28] discussed the problem of accuracy reduction in the current models for BP estimation from
PPG due to the requirement of frequent calibration. A deep recurrent neural network (RNN) with
long short-term memory (LSTM) was used to create a model for the time-series BP data. PPG and
electrocardiogram (ECG) were taken as inputs, and PTT with some other features were used as
predictors to estimate BP. This method showed improvements in BP prediction compared to other
existing methods. Gotlibovych et al. investigated the potential of using raw PPG data to detect
arrhythmia in 2018 [29] with reasonable success, which shows the possibility of using the raw PPG
signal as inputs to the deep learners. In [30], the authors have created a novel spectro-temporal deep
neural network that took the PPG signal and its first and second derivative as inputs. The neural
network model had residual connections and were able to get a mean absolute error (MAE) of 6.88 and
9.43 for DBP and SBP, respectively.
       Several research groups have analyzed and evaluated the quality of the open-source dataset,
which was used in this study [18,30–32]. A novel approach [33] for treating hypertension based on
the theory of arterial wave propagation and morphological theory of PPG was proposed to check
the physiological changes in different levels of blood pressure. ECG and PPG signals were obtained
simultaneously to detect hypertension. A model for PPG characteristic was analyzed and an inherent
relationship between the characteristics of systolic BP and PPG was established [34]. In [35], a PPG
signal analysis was used to characterize obesity, age group, and hypertension using the PPG pulse
based on the pulse decomposition analysis.
       The features typically used for noninvasively estimating BP are: (i) T-domain, (ii) f-domain,
(iii) (t,f)-domain, (iv) and statistical features. Several t-domain features, which were calculated from
the original signal and its derivatives, were used by different groups [9,36–38]. In a different study,
Zaid et al. [39] showed the use of frequency domain features for identifying a neurological disorder
in this study, the authors have taken inspiration from Zaid et al. to create features in estimating BP
accurately from the PPG signal.
       Several studies reported different features of the PPG signal for different applications [9,34,38,40].
Various groups have used these features for SBP and DBP measurement; however, there is still plenty
of scope for improvement. Numerous automated ML techniques were evaluated and recorded for
various PPG databases as mentioned earlier. Nonetheless, to the best of our knowledge, no recent
work has combined t-, f-, and (t,f) domain features to estimate BP with a high accuracy using the
machine learning approach. PPG signal processing is comparatively simpler and easier, so more
attention is being paid to novel methods that extract features from PPG signals. To reduce the error in
BP estimation based on the PPG signal, this analysis not only extracts features from the PPG signal but
also utilizes the demographic characteristics of subjects, such as height, weight, and age, etc. There are
several features that were extracted for BP estimation from the PPG signal in this study, which were
not used before by any other group.
       The manuscript is divided into four sections. Section 1 discusses the basics of the PPG signal,
related works, and inspirations of this research. The methodology and database are presented in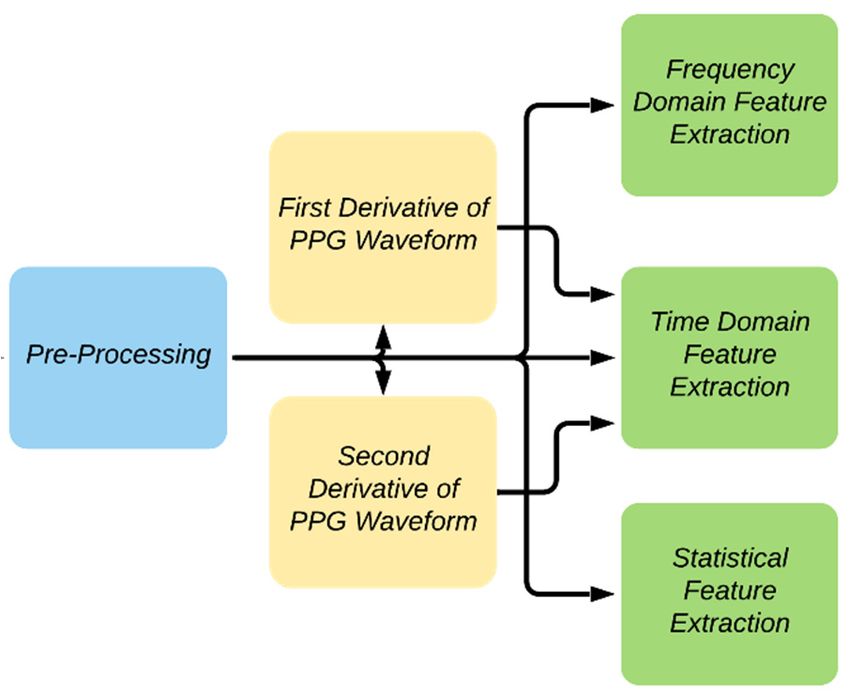
Sensors 2020, 20, 3127                                                                                             4 of 24
      Sensors 2020, 20, x FOR PEER REVIEW                                                                    4 of 26

          The manuscript
Section 2 along            is divided into
                 with preprocessing        four and
                                         steps  sections. Section
                                                     system       1 discusses Section
                                                               assessment.    the basics3 of the PPG signal,
                                                                                          summarizes     andrelated
                                                                                                              discusses
      works, and inspirations of this research. The methodology and database are presented in Section 2 along
the results while Section 4 concludes the work.
    with preprocessing steps and system assessment. Section 3 summarizes and discusses the results
    while Section
2. Materials      4 concludes the work.
             and Methods
      2. Materials
     This  section and   Methods
                    discusses    the dataset used in the study, the signal preprocessing techniques used, the
features extracted,    feature
           This section discusses selection  techniques
                                     the dataset  used in theused,  andthe
                                                                study,   thesignal
                                                                              machine     learningtechniques
                                                                                    preprocessing    algorithms  models
                                                                                                               used,
trained
      theand  tested
          features    to estimate
                   extracted,  featureSBP  and DBP.
                                        selection techniques used, and the machine learning algorithms models
     As   shown
      trained andintested
                     Figure   2, PPG signals
                          to estimate    SBP andwere
                                                  DBP.first assessed to check signal quality and then randomly
           As  shown  in Figure   2, PPG
divided into two sets. Eighty-five percentsignals  were  firstdata
                                                     of the   assessed
                                                                    wastoused
                                                                          checkforsignal quality
                                                                                     training andandvalidation
                                                                                                      then randomly
                                                                                                                and 15%
      divided  into two  sets. Eighty-five   percent  of the  data was  used  for  training and
of the data was used for testing the performance of the model. The PPG signals were preprocessed validation and 15%
beforeofthey
         the data
              werewas   used
                     sent forfor   testingextraction.
                                feature    the performance
                                                        Afterofextracting
                                                                  the model.meaningful
                                                                              The PPG signals    were preprocessed
                                                                                            features,   feature selection
      before they were sent for feature extraction. After extracting meaningful features, feature selection
techniques were used to reduce computational complexity and the chance of over-fitting the algorithm.
      techniques were used to reduce computational complexity and the chance of over-fitting the
The features were then used to train machine learning algorithms. The best regression model was
      algorithm. The features were then used to train machine learning algorithms. The best regression
selected  for was
      model   SBPselected
                   and DBP  forestimation
                                 SBP and DBP  individually.
                                                estimation individually.

                                          Figure
                                        Figure 2.2.Overall
                                                    Overallsystem
                                                           system block
                                                                  blockdiagram.
                                                                        diagram.

      2.1. Dataset
2.1. Dataset       Description
              Description
           The dataset
     The dataset        used
                     used  in inthis
                                  thisstudy
                                       study was
                                              was taken
                                                   takenfrom
                                                          fromLiang et al.et[31],
                                                                 Liang            whichwhich
                                                                              al. [31], is publicly available.available.
                                                                                               is publicly     The
      dataset  contained 657 PPG     signal samples  from 219 subjects [18].   The  PPG signal were
The dataset contained 657 PPG signal samples from 219 subjects [18]. The PPG signal were sampled     sampled   at a at
      rate of 1000 Hz and contained 2100 data points per signal with a signal duration of 2.1 s. Other than
a rate of 1000 Hz and contained 2100 data points per signal with a signal duration of 2.1 s. Other than
      the PPG signal, the patient’s demographic information such as age, gender, height, and weight along
the PPG signal, the patient’s demographic information such as age, gender, height, and weight along
      with systolic pressure, diastolic pressure, and heart rate were also recorded. A summary of the
with systolic
      dataset ispressure,
                 shown indiastolic
                          Table 1. pressure, and heart rate were also recorded. A summary of the dataset
is shown in Table 1.
                                                      Table 1. Data summary.
                                                  Table 1. Data summary.
                                             Physical Index           Numerical Data
                                  Physical Index Females                 Numerical
                                                                          115 (52%) Data
                                      FemalesAge (years)                   57
                                                                            115± 15
                                                                                  (52%)
                                               Height (cm)                 161 ± 8
                                    Age (years)                               57 ± 15
                                               Weight (kg)                 60 ± 11
                                    Height
                                       Body(cm)
                                              Mass Index (kg/m2)                ± 4± 8
                                                                            23161
                                   Systolic
                                    Weight Blood
                                             (kg) Pressure (mmHg)          12760± ±
                                                                                  2011
                                   Diastolic Blood
                            Body Mass Index (kg/m2 )Pressure (mmHg)        71  ± 11
                                                                               23 ± 4
                                        Heart Rate (beats/min)             73 ± 10
                         Systolic Blood Pressure (mmHg)                      127 ± 20

      Sensors 2020, 20, x;Diastolic  Blood
                           doi: FOR PEER   Pressure
                                         REVIEW       (mmHg)                   71 ± 11 www.mdpi.com/journal/sensors
                             Heart Rate (beats/min)                            73 ± 10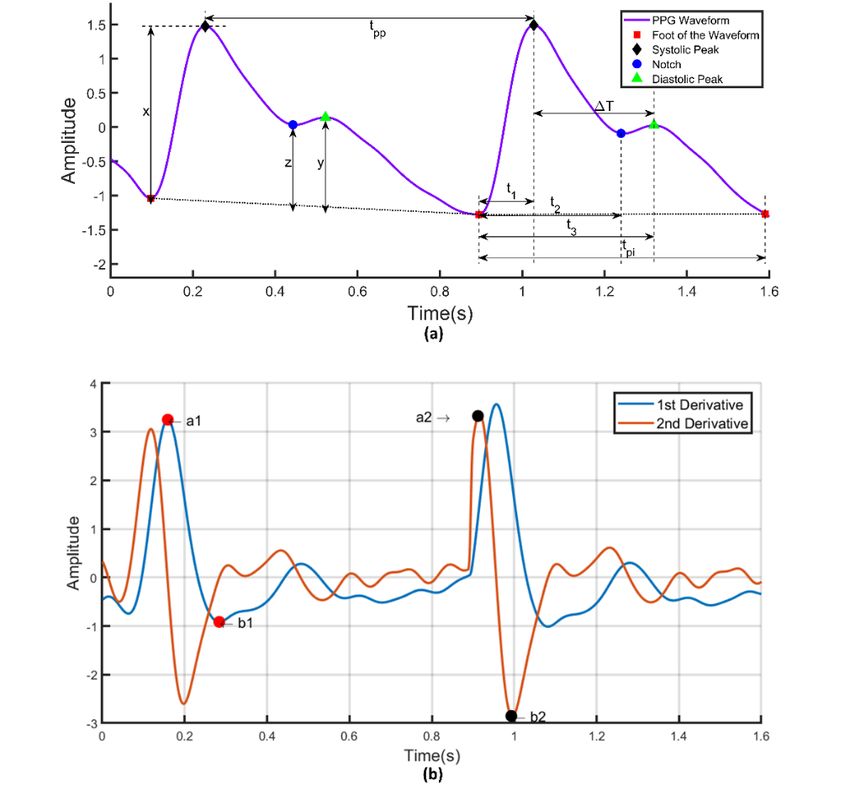
Sensors 2020,
Sensors 2020, 20,
              20, 3127
                  x FOR PEER REVIEW                                                                                     26
                                                                                                                   5 of 24

     Of the 657 signals, many signals were of poor quality and could not be used for feature
     Of  the 657
extraction.       signals,
              Liang   et al.many  signals
                             [18] used     were of poor quality
                                        a skewness-based           andquality
                                                               signal   could notindexbe used
                                                                                         (SQI)forto feature
                                                                                                     find the extraction.
                                                                                                                  suitable
Liang  et al. [18] used   a skewness-based     signal  quality  index  (SQI)   to find  the  suitable   signals.
signals. In the quality assurance process, 222 signals from 126 subjects were finally kept for this study.          In the
quality
Figure 3assurance
          shows the  process,
                       sample222PPGsignals
                                      signalfrom  126were
                                              which   subjects  wereas
                                                            divided   finally  kept
                                                                         fit and     for for
                                                                                  unfit   thisthe
                                                                                               study.  Figure
                                                                                                  study.   It is 3obvious
                                                                                                                   shows
the sample    PPG   signal  which   were  divided   as fit and  unfit for  the  study.  It is  obvious
that the unfit waveforms either do not have prominent features or the diastolic part of the waveform     that   the  unfit
waveforms     either do  not  have prominent    features   or the diastolic  part  of the  waveform
is not obvious in the recorded signal and the data length is very short. Hence, they were not used for  is not   obvious
in
thethe recorded signal and the data length is very short. Hence, they were not used for the study.
    study.

                                          (a)                                 (b)
       Figure 3. Comparison of waveforms that are fit and unfit for the study.
                                                                        study. (a)
                                                                               (a) Fit data;
                                                                                       data; (b)
                                                                                             (b) unfit
                                                                                                 unfit data.
                                                                                                       data.

2.2. Preprocessing Signals
2.2. Preprocessing Signals
     The
     The raw
          raw PPG
               PPG signals
                    signals were
                            were prepared
                                 prepared through
                                          through different
                                                  different preprocessing
                                                            preprocessing stages
                                                                          stages before
                                                                                 before feature
                                                                                        feature
extraction, which are summarized below.
extraction, which are summarized below.

2.2.1. Normalization
2.2.1. Normalization
      To extract meaningful information from the signals, it was necessary to normalize all the signals.
      To extract meaningful information from the signals, it was necessary to normalize all the signals.
The Z-score technique was used to normalize the signals in this study to get amplitude-limited data.
The Z-score technique was used to normalize the signals in this study to get amplitude-limited data.

                       Z-score   Normalized  Signal   Signal − Signal Mean
                   Z-score  Normalized  Signal = =                                            (1)
                                                                                               (1)
                                                 Standard Deviation of Signal
    It was also observed that after normalization, other preprocessing techniques were easier to
    It was also
implement.      observed
           Figure 4 showsthat  after normalization,
                           the sample               otherand
                                       PPG signal before  preprocessing  techniques were easier to
                                                              after normalization.
implement. Figure 4 shows the sample PPG signal before and after normalization.

Sensors 2020, 20, x; doi: FOR PEER REVIEW                                                 www.mdpi.com/journal/sensors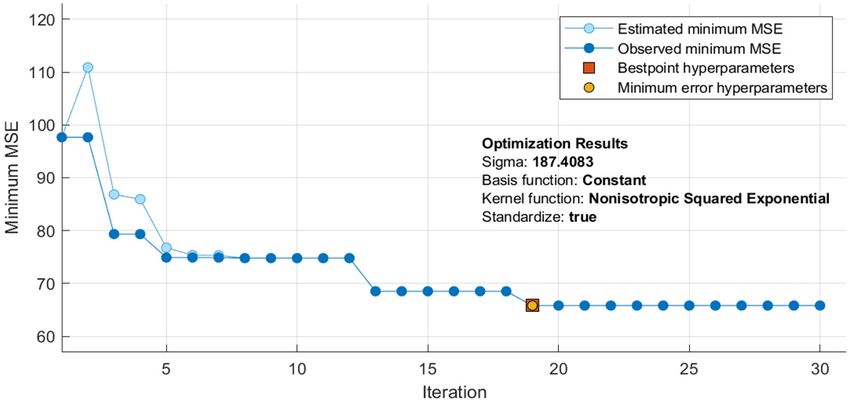
Sensors 2020, 20, x FOR PEER REVIEW 6 of 26
Sensors 2020,
Sensors 20, 3127
2020, 20, x FOR PEER REVIEW 6 of 266 of 24
(a) (b)
(a)PPG signal. (a) Before normalization; (b) after normalization.
Figure 4. (b)
Figure
Figure 4. 4.PPG
PPGsignal.
signal. (a)
(a) Before
Beforenormalization;
normalization;(b)(b)
after normalization.
after normalization.
2.2.2. Signal Filtration
2.2.2. Signal
2.2.2. SignalFiltration
Filtration
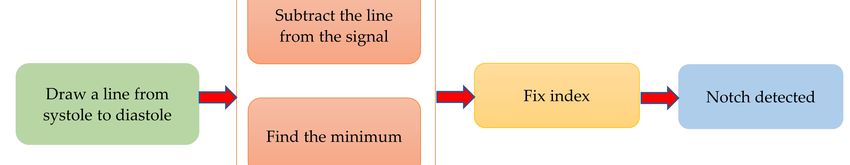
It was observed that, the signal from the database [31] has high-frequency noise components.
Thus,It wasthe observed
signals
It was observed that,
were thethesignal
filtered
that, from
through
signal theathe
from database
low-pass
database[31] hashas
filter
[31] high-frequency
that can remove
high-frequency noise components.
these
noise Thus,
high-frequency
components.
the Thus,
components. the
signals were signals
Several were
filtered filtered
through
filtration through
a low-pass
techniques a low-pass
filter
were filter
that to
tested can that can
removethe
denoise remove
these these high-frequency
high-frequency
signal, such as, moving components.
average,
lowcomponents.
Severalpass filtration Several
finite impulse filtration
techniques were
response techniques
tested
(FIR),to were
denoise
and tested
thetosignal,
Butterworth denoise theimpulse
such
infinite signal,
as, such
moving as, moving
average,
response average,
low
(IIR) pass finite
zero-phase
lowFigure
impulse
filter. pass finite
response
5 shows impulse
(FIR),
theandresponse
signal(FIR),
rawButterworth and Butterworth
infinite
overlaid withimpulse infinite impulse
response
the filtered output response
(IIR) zero-phase
using (IIR) zero-phase
different filter.
type ofFigure 5
filters.
filter. Figure 5 shows the raw signal overlaid with the filtered output using different type of filters.
shows
From Figurethe raw 5, signal
we canoverlaid
see thatwith the the filtered output
Butterworth using different
filter produced type of filters.
the filtration. Hence,From Figure
we used 5,
it to
From Figure 5, we can see that the Butterworth filter produced the filtration. Hence, we used it to
filter
we can theseePPGthatwaveforms,
the Butterworth whichfilter
was produced
also used the by filtration.
others to removeHence, we noiseusedfrom thefilter
it to PPGthesignals
PPG
filter the PPG waveforms, which was also used by others to remove noise from the PPG signals
[9,12,37,41]. which
waveforms, In this waswork,alsotheused
sixthbyorder
othersIIRtofilter
removewithnoise
a cut-off
fromfrequency of 25 Hz
the PPG signals was designed
[9,12,37,41]. in
In this
[9,12,37,41]. In this work, the sixth order IIR filter with a cut-off frequency of 25 Hz was designed in
MATLAB.
work, the
MATLAB. sixth order IIR filter with a cut-off frequency of 25 Hz was designed in MATLAB.
Figure 5. Filtered signals overlaid on the raw PPG signal.
Figure 5. Filtered signals overlaid on the raw PPG signal.
2.2.3. Baseline Correction
2.2.3. Baseline Correction
2.2.3. Baseline
The PPG Correction
waveform is commonly contaminated with a baseline wandering due to respiration at
The PPG
frequencies waveform
ranging is commonly
from contaminated with a baseline wandering
importantdue
thatto therespiration
signal is at
The PPG waveform is 0.15 to 0.5 Hz
commonly [11,21,42,43]. Therefore,
contaminated it is very
with a baseline wandering due to respiration at
frequencies
properly ranging
filtered tofrom 0.15the
remove to 0.5 Hz [11,21,42,43].
baseline wandering but Therefore, it is very
that important important
information that the signal
is preserved as is
frequencies ranging from 0.15 to 0.5 Hz [11,21,42,43]. Therefore, it is very important that the signal is
properly filtered to
far as possible. remove the baselinefitwandering but that important information is preservedtrendas far
properly filtered We used a polynomial
to remove the baseline to find the trend
wandering butinthat
the signal. Then,
important we subtracted
information is the
preserved as
as possible.
to get the We usedcorrected
baseline a polynomial
signal,fitastoshown
find the trend in
in Figure 6. the signal. Then, we subtracted the trend to
far as possible. We used a polynomial fit to find the trend in the signal. Then, we subtracted the trend
get the baseline corrected signal, as shown in Figure 6.
to get the baseline corrected signal, as shown in Figure 6.
Sensors 2020, 20, x; doi: FOR PEER REVIEW www.mdpi.com/journal/sensors
Sensors 2020, 20, x; doi: FOR PEER REVIEW www.mdpi.com/journal/sensors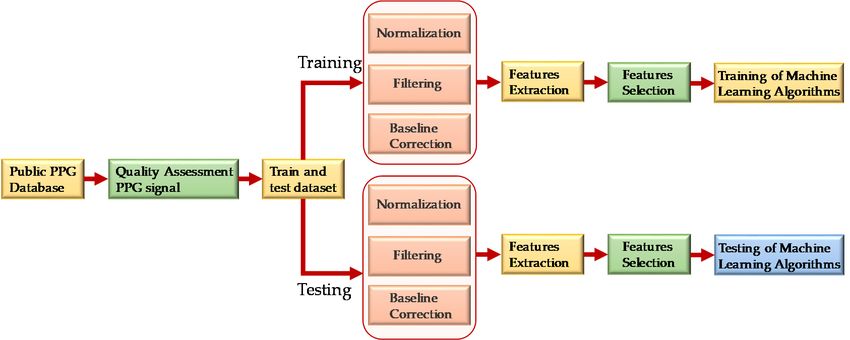
Sensors 2020, 20, x FOR PEER REVIEW 7 of 26
Sensors 2020, 20, x FOR PEER REVIEW 7 of 26
Sensors 2020, 20, 3127 7 of 24
(a)
(a)
(b)
Figure 6. Baseline correction of PPG waveform. (a) (b)PPG waveform with the baseline wandering and
fourth degree polynomial trend; (b) PPG waveform after detrending.
Figure6.6. Baseline
Figure Baseline correction
correction of
ofPPG
PPGwaveform.
waveform. (a)
(a) PPG
PPG waveform
waveform with
with the
thebaseline
baselinewandering
wanderingand
and
fourthdegree
fourth degreepolynomial
polynomialtrend;
trend;(b)
(b)PPG
PPGwaveform
waveformafterafterdetrending.
detrending.
2.3. Feature Extraction
2.3.
2.3. Feature
Feature Extraction
Extraction
The block diagram summarizing the feature extraction details adopted in the study is shown in
FigureThe
The7. block
A PPG
block waveform
diagram
diagram contains many
summarizing
summarizing the informative
the feature
feature information
extraction
extraction details such asin
detailsadopted
adopted systole,
in the diastole,
thestudy
study notch,
isisshown
shown in
in
pulse
Figure width,
7. A PPGpeak-to-peak
waveform interval,
contains etc.
manySome of the
informativedistinctive features
information of
such the
as
Figure 7. A PPG waveform contains many informative information such as systole, diastole, notch, PPG
systole, waveform
diastole, might
notch,
not
pulse
pulsebewidth,
dominant
width, in some patients,
peak-to-peak
peak-to-peak interval,such
interval, etc. as theof
etc. Some
Some notch
of the prevalencefeatures
the distinctive
distinctive changing
features of with
of the
thePPG agewaveform
PPG [44]. To find
waveform the
might
might
different
not be key
dominant points
in of
some the PPG
patients, signal,
such asthe
theauthors
notch have followed
prevalence the
changing methods
with
not be dominant in some patients, such as the notch prevalence changing with age [44]. To find the age described
[44]. To in
find the
the
previous
different
differentkey work [45].ofThe
keypoints
points the technique
PPG
of the was
signal,
PPG largely
the authors
signal, based on thefollowed
have followed
the authors have derivatives
the and
the methods thresholds
described
methods in thedefined
described previousin
in the
[46]
work and
[45].[47].
previous The technique
work [45]. The was largelywas
technique based on thebased
largely derivatives
on theand thresholds
derivatives and defined in [46]defined
thresholds and [47].
in
[46] and [47].
Figure 7. Overview
Figure 7. Overview of
of feature
feature extraction.
extraction.
The Figure 7. Overview of feature extraction.
The dicrotic notch is
dicrotic notch is an
an essential
essential feature
feature ofthe
of the PPGsignal.
PPG signal. Figure
Figure 8 describes
8 describes thethe algorithm
algorithm to
to detect
detect thethe dicrotic
dicrotic notch.
notch. To To
do do
so, so,
a a line
line waswas drawn
drawn fromfrom
the the systolic
systolic peak peak
to to diastolic
the the diastolic
peak.peak.
The
The dicrotic notch is an essential feature of the PPG signal. Figure 8 describes the algorithm to
The minimum of the subtraction of the straight line from the signal is the dicrotic notch. However,
detect the dicrotic notch. To do so, a line was drawn from the systolic peak to the diastolic peak. The
to make
Sensors it 20,
2020, more robust,
x; doi: theREVIEW
FOR PEER fix index was used, which calculates the local minima within a given
www.mdpi.com/journal/sensors
Sensors 2020, 20, x; doi: FOR PEER REVIEW www.mdpi.com/journal/sensors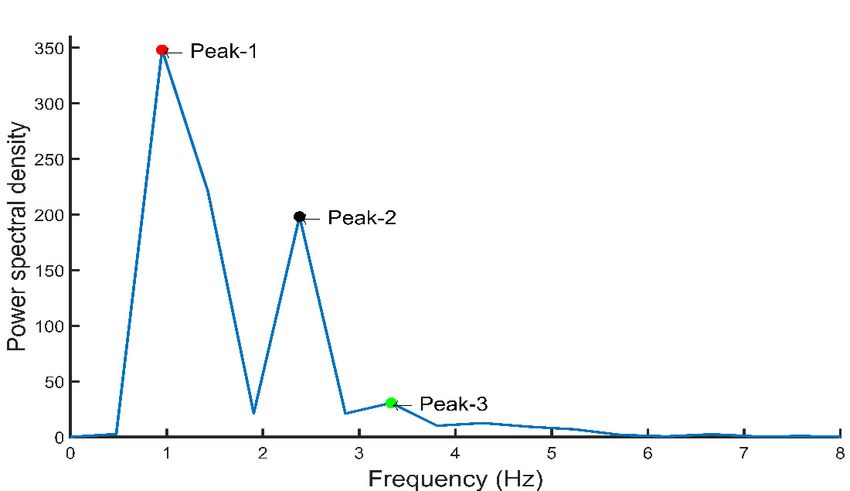
Sensors 2020, 20, x FOR PEER REVIEW 8 of 26
Sensors 2020, 20, x FOR PEER REVIEW 8 of 26
minimum of the subtraction of the straight line from the signal is the dicrotic notch. However, to
Sensors 2020, of
minimum 20, the
3127 subtraction of the straight line from the signal is the dicrotic notch. However, 8 ofto
24
make it more robust, the fix index was used, which calculates the local minima within a given
make
window it more
(in this robust,
case 50the fixaround
ms) index awas used,
given which
point. calculates
Reliable the of
detection local minima notch
the dicrotic withinin avarious
given
window
situations
window (in (in this
is this
showncase 50
casein50 ms)
Figurearound
9.
ms) around a given point. Reliable detection of the dicrotic notch in various
a given point. Reliable detection of the dicrotic notch in various
situations
situations is is shown
shown in in Figure
Figure 9.
9.
Figure 8. Algorithm of notch detection.
Figure 8. Algorithm of notch detection.
Figure 8. Algorithm of notch detection.
Figure 9. Demonstration of dicrotic notch detection for different age groups: Case 1 (26 years),
Figure 9. Demonstration of dicrotic notch detection for different age groups: Case 1 (26 years), 2 (45
2 (45 years),
Figure and 3 (80 years). (a) Filtereddetection
PPG signal where weage draw a lineCasefrom (26
systolic peak to
years), 9. Demonstration
and of dicrotic
3 (80 years). (a) Filtered notch
PPG signal where forwedifferent
draw a linegroups:
from systolic1 peak years), 2 (45
to diastolic
diastolic
years), andpeak; (b)years).
3 (80 subtract
(a)the line from
Filtered the signalwhere
and find its minimum point;systolic
(c) initial notch detected;
peak; (b) subtract the line from the PPG
signalsignal
and find its we draw
minimum a point;
line from peak
(c) initial notch to diastolic
detected; (d)
(d) adjust
peak; the notch using the fix index.
adjust(b)
thesubtract the line
notch using the from the signal and find its minimum point; (c) initial notch detected; (d)
fix index.
adjust the notch using the fix index.
Another key feature is the foot of the PPG signal. To find the foot of the PPG waveform, the second
Another key feature is the foot of the PPG signal. To find the foot of the PPG waveform, the
derivative
Another of the
keyPPG waveform,
feature alsoofcalled
is thewaveform,
foot acceleration
thealso
PPG plethysmogram
signal.acceleration
To (APG)
find theplethysmogram
foot of was waveform,
the PPG first calculated.
the
second derivative of the PPG called (APG) was first
From
second the APG, a
derivative zone of
of APG, interest
the PPG was
waveform, defined, where the moving average of APG is larger than an
calculated. From the a zone of interestalso
wascalled acceleration
defined, where theplethysmogram
moving average(APG) of APGwas first
is larger
adaptive threshold.
calculated. From the In the zone
APG, a zoneof interest, the highest point of the
theAPG corresponds of to APG
the foot of the
than an adaptive threshold. In theofzone
interest was defined,
of interest, where
the highest moving
point of the average
APG corresponds is larger
to the
signal.
than This
anthe method
adaptive is robust and allows detecting the foot of the signal very accurately. Figure 10
foot of signal.threshold.
This method In the zone ofand
is robust interest,
allowsthe highest the
detecting point ofof
foot the APG
the corresponds
signal to the
very accurately.
shows
foot thatsignal.
of the the algorithm
Thisthe can detect
method the prominent
is robust and allows foot and flatthe
detecting foot accurately
foot of the [45]. very accurately.
Figure 10 shows that algorithm can detect the prominent foot and flat footsignal
accurately [45].
Figure 10 shows that the algorithm can detect the prominent foot and flat foot accurately [45].
Sensors 2020, 20, x; doi: FOR PEER REVIEW www.mdpi.com/journal/sensors
Sensors 2020, 20, x; doi: FOR PEER REVIEW www.mdpi.com/journal/sensors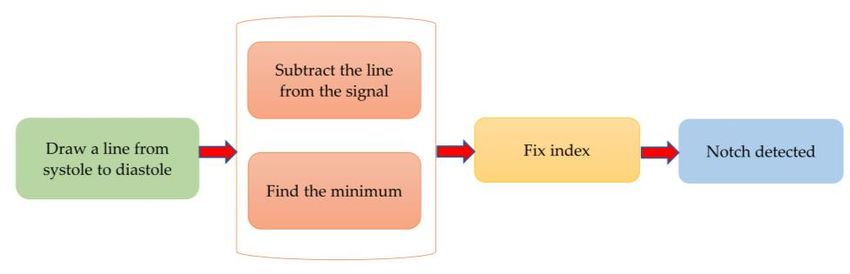
Sensors 2020, 20, 3127 9 of 24
Sensors 2020, 20, x FOR PEER REVIEW 9 of 26
Figure
Figure 10.
10. Detection thefoot
Detection of the footofofaaPPG
PPGwaveform.
waveform. (a)(a) Filtered
Filtered PPGPPG signal;
signal; (b) (b) second
second derivative
derivative of
of PPG
PPG
alongalong with derivation
with derivation of the
of the zone zone of
of interest interest
based based average
on moving on moving average of
of acceleration acceleration
plethysmogram
plethysmogram (APG)
(APG) and adaptive and adaptive
threshold; (c) footthreshold; (c) foot
of the signal of the signal detected.
detected.
PPG signal’s first
PPG firstand
andsecond
second derivatives
derivatives werewerecalculated and the
calculated andrelationship between
the relationship PPG signals
between PPG
and their
signals andfirst and
their second
first derivatives
and second is shown
derivatives in Figure
is shown in 11. The11.
Figure PPG Thesignal
PPG is analyzed
signal to extract
is analyzed to
the a1 and
extract b1 point
the a1 and b1from its from
point first derivative as well asasthe
its first derivative a2 as
well and b2a2
the point
andfrom the second
b2 point from the derivative.
second
Figure 12 shows
derivative. Figure the frequency
12 shows domain representation
the frequency of the PPG
domain representation of signal.
the PPGThe frequency
signal. domain
The frequency
representation
domain was analyzed
representation and features
was analyzed related related
and features to the first three
to the firstpeaks
threewere
peaksextracted. The length
were extracted. The
of the fast
length of theFourier transform
fast Fourier was 2100,
transform waswhich was equal
2100, which was to the number
equal to the numberof dataofpoints in the signal.
data points in the
Furthermore,
signal. demographic
Furthermore, demographicdata suchdataas height,
such weight,
as height, BMI, BMI,
weight, gender, age, and
gender, age, heart rate rate
and heart werewere
also
usedused
also as features. It wasIt reported
as features. by several
was reported groupsgroups
by several that demographic
that demographicfeaturesfeatures
are important features
are important
for BP estimation [48]. Elgendi [9] emphasized the need of height details
features for BP estimation [48]. Elgendi [9] emphasized the need of height details for accurate for accurate estimation of the
PPG waveform
estimation of thewhile
PPG Kavasaoglu
waveform while et al.Kavasaoglu
[36] found that demographic
et al. [36] found that features were useful
demographic and highly
features were
rankedand
useful features in their
highly machine
ranked learning
features algorithm
in their machineusinglearning
PPG signal’s characteristics
algorithm using PPG features. In a
signal’s
real-time scenario, age and BMI will be known to the user and the heart rate
characteristics features. In a real-time scenario, age and BMI will be known to the user and the heart can be easily calculated
fromcan
rate the be
PPG signal.
easily Definitions
calculated fromof the extracted
PPG signal. time-domain
Definitions andof demographic
the extractedfeatures were listed
time-domain and
in Tables 2–5. features
demographic Frequency-domain
were listed and in statistical
Tables 2–5. features can significantlyand
Frequency-domain contribute to BP
statistical estimation
features can
and were defined in Tables 6–8 respectively. Therefore, 107 features
significantly contribute to BP estimation and were defined in Tables 6–8 respectively. Therefore, 107encompassing seventy-five
t-domain,
features sixteen f-domain,
encompassing and ten statistical
seventy-five t-domain,featuressixteen were derived
f-domain, and forten
each PPG signal
statistical alongwere
features with
six demographic data. The t-domain, f-domain, and statistical features were
derived for each PPG signal along with six demographic data. The t-domain, f-domain, and statistical identified from different
previouswere
features worksidentified
[3,4,9,23,25–27,38,39].
from different It is reportedworks
previous in the [3,4,9,23,25–27,38,39].
literature that 1–24 andIt42–58 featuresinwere
is reported the
used in PPG
literature thatrelated
1–24 andworks [49].features
42–58 These featureswere usedare considered as literature
in PPG related worksfeatures
[49]. Thesein Section
features3. are
considered as literature features in Section 3.
Sensors 2020, 20, x; doi: FOR PEER REVIEW www.mdpi.com/journal/sensors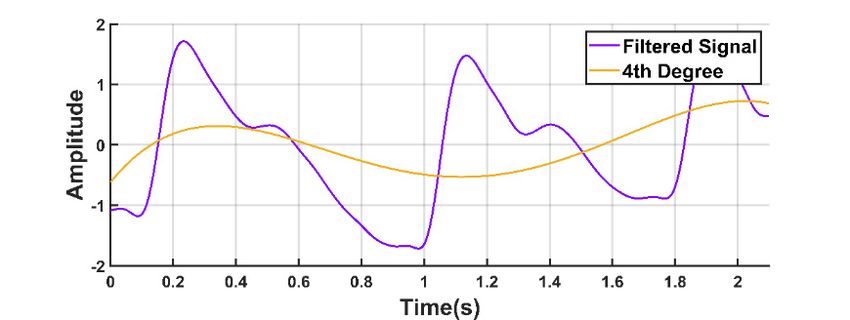
Sensors
Sensors 2020,
        2020, 20,
              20, x3127
                    FOR PEER REVIEW                                                                          10
                                                                                                             10 of
                                                                                                                of 26
                                                                                                                   24
Sensors 2020, 20, x FOR PEER REVIEW                                                                           10 of 26

     Figure 11. (a) Illustration of time-domain features in a PPG signal. (b) First and second derivatives of
     PPG signal.
     Figure
     Figure 11. (a) Illustration
            11.      Illustration of
                                  of time-domain
                                     time-domain features
                                                 features in
                                                           in aa PPG
                                                                 PPG signal.
                                                                     signal. (b)
                                                                             (b) First
                                                                                 First and
                                                                                       and second
                                                                                           second derivatives
                                                                                                  derivatives of
                                                                                                              of
     PPG signal.
     PPG  signal.

              Figure
              Figure 12.
                     12. Frequency-domain
                         Frequency-domain representation
                                           representation of
                                                          of PPG
                                                              PPG signal
                                                                  signal with
                                                                         with important
                                                                              important features.
                                                                                        features.
              Figure 12. Frequency-domain representation of PPG signal with important features.
                              Table 2. Twenty-four features from the PPG signal.
                                Table 2. Twenty-four features from the PPG signal.
          Feature                                               Definition
 1. SystolicFeature
              Peak                             The amplitude ofDefinition
                                                                  (‘x’) from PPG waveform
 2.
 1.Diastolic   Peak
    Systolic Peak                              The
                                                Theamplitude
                                                    amplitudeofof(‘y’)
                                                                   (‘x’) from
                                                                          from PPG
                                                                               PPG waveform
                                                                                    waveform
 3.
 2.Height
    Diastolicof Peak
                Notch                          The
                                                The amplitude
                                                    amplitude of
                                                               of (‘z’)
                                                                   (‘y’)from
                                                                          fromPPG
                                                                               PPGwaveform
                                                                                    waveform
 3. Height of Notch                The time interval from the foot
                                                The amplitude       of the
                                                               of (‘z’)      waveform
                                                                          from        to the systolic peak
                                                                               PPG waveform
 4. Systolic Peak Time
                                   The time interval from the foot (‘t   ’)
                                                                     of1the  waveform to the systolic peak
  4. Systolic Peak Time
                                                                        (‘t1’)

Sensors 2020, 20, x; doi: FOR PEER REVIEW                                             www.mdpi.com/journal/sensors
Sensors 2020, 20, x; doi: FOR PEER REVIEW                                              www.mdpi.com/journal/sensors
Sensors 2020, 20, 3127 11 of 24
Table 2. Twenty-four features from the PPG signal.
Feature Definition
1. Systolic Peak The amplitude of (‘x’) from PPG waveform
2. Diastolic Peak The amplitude of (‘y’) from PPG waveform
3. Height of Notch The amplitude of (‘z’) from PPG waveform
4. Systolic Peak Time The time interval from the foot of the waveform to the systolic peak (‘t1 ’ )
5. Diastolic Peak Time The time interval from the foot of the waveform to the height of notch (‘t2 ’ )
6. Height of Notch Time The time interval from the foot of the waveform to the diastolic peak (‘t3 ’ )
7. ∆T The time interval from systolic peak time to diastolic peak time
8. Pulse Interval The distance between the beginning and the end of the PPG waveform (‘tpi ’ )
9. Peak-to-Peak Interval The distance between two consecutive systolic peaks (tpp )
10. Pulse Width The half-height of the systolic peak
The waveform is first split into two parts at the notch point. The area of the first part is
11. Inflection Point Area A1 and the area of the second part is A2 . The ratio of A1 and A2 is the inflection point
area (‘A1 /A2 ’)
12. Augmentation Index The ratio of diastolic and systolic peak amplitude (‘y/x’)
The difference between systolic and diastolic peak amplitude divided by systolic peak
13. Alternative Augmentation Index
amplitude (‘(x-y)/x’)
14. Systolic Peak Output Curve The ratio of systolic peak time to systolic peak amplitude (‘t1/ x’)
The ratio of diastolic peak amplitude to the differences between pulse interval and
15. Diastolic Peak Downward Curve
height of notch time (‘y/ tpi -t3 ’)
16. t1 /tpp The ratio of systolic peak time to the peak-to-peak interval of the PPG waveform
17. t2 /tpp The ratio of notch time to the peak-to-peak interval of the PPG waveform
18. t3 /tpp The ratio of diastolic peak time to the peak-to-peak interval of the PPG waveform
19. ∆T/tpp The ratio of ∆T to the peak-to-peak interval of the PPG waveform
20. z/x The ratio of the height of notch to the systolic peak amplitude
21. t2 /z The ratio of the notch time to the height of notch
22. t3 /y The ratio of the diastolic peak time to the diastolic peak amplitude
The ratio of systolic peak amplitude to the difference between pulse interval and
23. x/(tpi -t1 )
systolic peak time
24. z/(tpi -t2 ) The ratio of the height of notch to the difference between pulse interval and notch time
Table 3. Seventeen width-related PPG features.
Feature Definition
25. Width (25%) The width of the waveform at 25% amplitude of systolic amplitude
26. Width (75%) The width of the waveform at 75% amplitude of systolic amplitude
27. Width (25%)/t1 The ratio of pulse width at 25% of systolic amplitude to systolic peak time
28. Width (25%)/t2 The ratio of pulse width at 25% of systolic amplitude to notch time
29. Width (25%)/t3 The ratio of pulse width at 25% of systolic amplitude to diastolic peak time
30. Width (25%)/∆T The ratio of pulse width at 25% of systolic amplitude to ∆T
31. Width (25%)/tpi The ratio of pulse width at 25% of systolic amplitude to pulse interval
32. Width (50%)/t1 The ratio of pulse width at 50% of systolic amplitude to systolic peak time
33. Width (50%)/t2 The ratio of pulse width at 50% of systolic amplitude to notch time
34. Width (50%)/t3 The ratio of pulse width at 50% of systolic amplitude to diastolic peak time
35. Width (50%)/∆T The ratio of pulse width at 50% of systolic amplitude to ∆T
36. Width (50%)/tpi The ratio of pulse width at 50% of systolic amplitude to pulse interval
37. Width (75%)/t1 The ratio of pulse width at 75% of systolic amplitude to systolic peak time
38. Width (75%)/t2 The ratio of pulse width at 75% of systolic amplitude to notch time
39. Width (75%)/t3 The ratio of pulse width at 75% of systolic amplitude to diastolic peak time
40. Width (75%)/∆T The ratio of pulse width at 75% of systolic amplitude to ∆T
41. Width (75%)/tpi The ratio of pulse width at 75% of systolic amplitude to pulse intervalSensors 2020, 20, 3127 12 of 24
Table 4. Sixteen features derived from the first and second derivative.
Feature Definition
42. a1 The first maximum peak from the first derivative of the PPG waveform
43. ta1 The time interval from the foot of the PPG waveform to the time at which a1 occurred
44. a2 The first maximum peak from the second derivative of the PPG waveform after a1
45. ta2 The time interval from the foot of the PPG waveform to the time at which a2 occurred
46. b1 The first minimum peak from the first derivative of the PPG waveform after a1
47. tb1 The time interval from the foot of the PPG waveform to the time at which b1 occurred
48. b2 The first minimum peak from the second derivative of the PPG waveform after a2
49. tb2 The time interval from the foot of the PPG waveform to the time at which b2 occurred
50. b2 /a2 The ratio of b2 to a2
The ratio of first minimum peak of the first derivative after a1 to first maximum peak of the
51. b1 /a1
first derivative
52. ta1 /tpp The ratio of ta1 to the peak-to-peak interval of the PPG waveform
53. tb1 /tpp The ratio of tb1 to the peak-to-peak interval of the PPG waveform
54. tb2 /tpp The ratio of tb2 to the peak-to-peak interval of the PPG waveform
55. ta2 /tpp The ratio of ta2 to the peak-to-peak interval of the PPG waveform
The ratio of the difference between ta1 and ta2 to the peak-to-peak interval of the
56. (ta1– ta2 )/tpp
PPG waveform
The ratio of the difference between tb1 and tb2 to the peak-to-peak interval of the
57. (tb1– tb2 )/tpp
PPG waveform
Table 5. Eighteen demographic time-domain features.
Feature Definition
58. Height/∆T It is known as stiffness index
59. Weight/∆T The ratio of weight to ∆T
60. BMI/∆T The ratio of BMI to ∆T
61. Height/t1 The ratio of height to the systolic peak time
62. Weight/t1 The ratio of weight to the systolic peak time
63. BMI/t1 The ratio of BMI to the systolic peak time
64. Height/t2 The ratio of height to the notch time
65. Weight/t2 The ratio of weight to the notch time
66. BMI/t2 The ratio of BMI to the notch time
67. Height/t3 The ratio of height to the diastolic peak time
68. Weight/t3 The ratio of weight to the diastolic peak time
69. BMI/t3 The ratio of BMI to the diastolic peak time
70. Height/tpi The ratio of height to the pulse interval
71. Weight/tpi The ratio of weight to the pulse interval
72. BMI/tpi The ratio of BMI to the pulse interval
73. Height/tpp The ratio of height to the peak-to-peak interval
74. Weight/tpp The ratio of weight to the peak-to-peak interval
75. BMI/tpp The ratio of BMI to the peak-to-peak intervalSensors 2020, 20, 3127 13 of 24
Table 6. Sixteen frequency-domain features.
Feature Definition
76. Peak-1 The amplitude of the first peak from the fast Fourier transform of the PPG signal
77. Peak-2 The amplitude of the second peak from the fast Fourier transform of the PPG signal
78. Peak-3 The amplitude of the third peak from the fast Fourier transform of the PPG signal
The frequency at which the first peak from the fast Fourier transform of the PPG
79. Freq-1
signal occurred
The frequency at which the second peak from the fast Fourier transform of the PPG
80. Freq-2
signal occurred
The frequency at which the third peak from the fast Fourier transform of the PPG
81. Freq-3
signal occurred
82. A0–2 Area under the curve from 0 to 2 Hz for the fast Fourier transform of the PPG signal
83. A2–5 Area under the curve from 2 to 5 Hz for the fast Fourier transform of the PPG signal
84. A0–2/A2–5 The ratio of the area under the curve from 0 to 2 Hz to the area under the curve from 2 to 5 Hz
85. Peak-1/peak-2 The ratio of the first peak to the second peak from the fast Fourier transform of the PPG signal
86. Peak-1/peak-3 The ratio of the first peak to the third peak from the fast Fourier transform of the PPG signal
The ratio of the frequency at first peak to the frequency at second peak from the fast Fourier
87. Freq-1/freq-2
transform of the PPG signal
The ratio of the frequency at first peak to the frequency at third peak from the fast Fourier
88. Freq-1/freq-3
transform of the PPG signal
The value of highest frequency in the signal spectrum
89. Maximum Frequency
fmax
Signal magnitude at highest frequency
90. Magnitude at Fmax
X( fmax )
Ratio of signal energy between ( fmax ± ∆ f ) and the whole spectrum
91. Ratio of signal energy
X( fmax ± ∆ f )/ N−1
P
i=0 Xi ( f )
Table 7. Ten statistical features.
Feature Definition Equation
P
x
92. Mean Sum of all data divided by the number of entries x= n
Odd numbers of entries: Median = middle
data entry.
Value that is in the middle of the ordered set
93. Median Even numbers of entries: Median = adding
of data
the two numbers in the middle and dividing
the result by two.
Measure variability and consistency of the
qP
x−x
94. Standard Deviation
sample. s= n−1
The data value at which the percent of the value 25
25th = ( 100 )n
95. Percentile
in the data set are less than or equal to this value. 75
75th = ( 100 )n
96. Mean Absolute Average distance between the mean and each Pn
| xi −x |
Deviation data value. MAD = i=1
n
IQR = Q3 –Q1
97. Inter Quartile
The measure of the middle 50% of data. Q3 : Third quartile, Q1 : First quartile, Quartile:
Range (IQR)
Dividing the data set into four equal portions.
(Y −Y)3 /N
PN
The measure of the lack of symmetry from the g1 = i=1 Si 3
98. Skewness Y: Mean, s: Standard deviation, N: Number of
mean of the dataset.
data.
(Y −Y)4 /N
PN
The pointedness of a peak in distribution curve, K = i=1 Si 4 −3
99. Kurtosis in other words it is the measure of sharpness of Y: Mean, s: Standard deviation, N: Number of
the peak of distribution curve. data.
Entropy measures the degree of randomness in a
100. Shannon’s set of data, higher entropy indicates a greater PN−1
H(x) = − i=0 pi log2 pi
Entropy randomness, and lower entropy indicates a lower
randomness.
PN−1
− pk log p
SEN = i=0
log N
2 k
The normalized Shannon’s entropy that is applied pk : Spectral power of the normalized
101. Spectral Entropy
to the power spectrum density of the signal. frequency, N: Number of frequencies in
binarySensors 2020, 20, 3127 14 of 24
Table 8. Six demographic features.
102. Height 103. Weight 104. Gender 105. Age 106. BMI 107. Heart rate
2.4. Feature Selection
Feature selection or reduction is important to reduce the risk of over-fitting the algorithms. In this
work, three feature selection methods: Correlation-based feature selection (CFS), ReliefF features
selection [50], and features for classification using the minimum redundancy maximum relevance
(fscmrmr) algorithm. ReliefF is a feature selection algorithm, which randomly selects instances and
adjusts the weights of the respective element depending on the nearest neighbor [51].
Correlation is a test used to evaluate whether or not a feature is highly correlated with the class or
not highly correlated with any of the other features [52,53]. On the other hand, the fscmrmr algorithm
finds an optimal set of features that are mutually and as dissimilar as possible, and can effectively
represent the response variable. The algorithm minimizes a feature set’s inconsistency and maximizes
the relevance of a feature set to the answer variable [54]. MATLAB built-in functions were used for
CFS, ReliefF, and fscmrmr feature selection algorithm [55].
In Table 9, the features selected by the feature reduction algorithm are listed. The features listed
are those that produced the best results.
Table 9. Features chosen by the feature selection algorithms.
Feature Selection Algorithms Used Systolic Blood Pressure Diastolic Blood Pressure
105. Age,
105. Age,
106. Heart Rate,
106. Heart Rate,
103. Weight,
103. Weight,
102. Height,
102. Height,
107. BMI,
107. BMI,
RELIEFF 83. A2–5,
69. BMI/t3 ,
63. BMI/t1 ,
71. Weight/tpi ,
71. Weight/tpi ,
6. t3 ,
74. Weight/tpp ,
72. BMI/tpi ,
62. Weight/t1 ,
82. A0–2,
75. BMI/tpp
105. Age,
103. Weight,
97. Inter Quartile Range,
22. t3 /y,
45. ta2 ,
106. Heart Rate,
64. Height/t2 ,
40. Width (75%)/∆T,
13. Alternative Augmentation
77. Peak-2,
Index,
100. Shannon’s Entropy,
98. Skewness,
FSCMRMR 96. Mean Absolute Deviation,
101. Spectral Entropy,
90. Magnitude at Fmax,
87. Freq-1/Freq-2,
38. Width (75%)/t2 ,
23. x/(tpi -t1 ),
58. Height/∆T,
32. Width (50%)/t1,
101. Spectral Entropy,
36. Width (50%)/tpi,
31. Width (25%)/tpi,
99. Kurtosis,
105. Age
30. Width (25%)/∆T
69. BMI/t3 , 69. BMI/t3 ,
71. Weight/tpi , 71. Weight/tpi ,
74. Weight/tpp , 74. Weight/tpp ,
49. tb2 , 49. tb2 ,
59. Weight/∆T, 59. Weight/∆T,
51. b1 /a1 , 51. b1 /a1 ,
46. b1 , 46. b1 ,
CFS 47. tb1 , 47. tb1 ,
62. Weight/t1 , 62. Weight/t1 ,
52. ta1 /tpp , 52. ta1 /tpp ,
66. BMI/t2 , 66. BMI/t2 ,
67. Height/t3 , 67. Height/t3 ,
100. Shannon’s Entropy, 100. Shannon’s Entropy,
48. b2 , 48. b2 ,
75. BMI/tpp 75. BMI/tppSensors 2020, 20, 3127 15 of 24
2.5. Machine Learning (ML) Algorithms
After the features were extracted, the feature matrix was trained with machine learning algorithms.
The Regression Learner App of MATLAB 2019b was used to estimate the BP. Five different algorithms
(linear regression, regression trees, support vector regression (SVR), Gaussian process regression (GPR),
and ensemble trees) with their variations to a total of 19 algorithms were trained using the 10-fold cross
validation. Out of all these algorithms, two best performing algorithms, Gaussian process regression
and ensemble trees were tested.
1. Gaussian Process Regression: GPR is a nonparametric Bayesian regression approach [56],
which has benefits of operating well on small datasets and being able to provide measures of uncertainty
on the predictions. Unlike many common supervised machine learning algorithms that learn the exact
values in a function for each parameter, the Bayesian approach infers a distribution of probability over
all possible values.
2. Ensemble Trees: An ensemble tree is a predictive model consisting of a weighted combination
of multiple regression trees [57]. The core idea behind the ensemble model is to pull together a set of
weak learners to create a strong learner.
2.6. Hyper-Parameters Optimization of the Best Performing Algorithm
The machine learning algorithms used were initially trained with default parameters.
The performance of these algorithms can, however, be improved by optimizing their hyper-parameters.
Hyper-parameters optimization was carried out on the algorithms using the MATLAB 2019b Regression
Learner App [58].
2.7. Evaluation Criteria
To evaluate the performance of the ML algorithms for estimating BP, four criteria were used. Here,
Xp is the predicted data while the ground truth data is X and n is the number of samples:
1. Mean Absolute Error (MAE): Absolute error is the amount of predicted error. The mean
absolute error is the mean of all absolute errors.
1X
MAE = Xp − X (2)
n n
2. Mean Squared Error (MSE): MSE calculates the squared sum of the errors. MSE is a risk
function, which corresponds to the expected value of the squared error loss. MSE contains both the
estimator’s variance and its bias.
P 2
Xp − X
MSE = (3)
n
3. Root Mean Squared Error (RMSE): RMSE is the standard deviation of the residuals (prediction
error). Residuals are a measure of how far away the data points are from the regression line; RMSE is a
measure of how these residuals are spread out.
s
P 2
Xp − X √
RMSE = = MSE (4)
n
4. Correlation Coefficient (R): It is a statistical technique, which measures how closely related
are two variables (predictors and the predictions). It also tells us how close the predictions are to
the trendline. q
MSE(Model)
R = 1 − MSE(Baseline)
(5)
|X−mean(X)|2
P
where MSE (Baseline) = nSensors 2020, 20, 3127 16 of 24
When using the Regression Learner App in MATLAB, the above criteria are automatically
calculated by MATLAB and these values were used to evaluate the performance of the algorithms.
Among these criteria, RMSE was chosen as the main criterion.
3. Results and Discussion
This section summarizes the performance of the machine learning algorithm used in the study.
As stated earlier, 19 different machine learning algorithms were trained and validated. It is observed
from Table 9 that the features of Table 5 have a significant contribution along with demographic
features in estimation. Out of the 19 algorithms, GPR and ensemble trees outperformed for all cases in
the estimation of both systolic blood pressure and diastolic blood pressure.
In Table 10, it can be noticed that the ReliefF feature selection algorithm produced the best result
when combined with GPR. The feature selected using a combination of ReliefF and GPR performed the
best in estimating SBP while CFS and GPR performed best for DBP. Moreover, R scored 0.74 and 0.68
for SBP and DBP, respectively, which means that there is a strong correlation with the predictors and
the ground truth. However, these results could be further improved by tuning the hyper-parameters.
The Bayesian optimization was used, which is efficient and effective and operates by constructing a
probabilistic model of the objective function, called the surrogate function, which is then optimally
scanned with the acquisition function before the candidate samples are selected for evaluation of
the real objective function. As shown in Figure 13, 30 iterations of the model were trained during
optimization. Each time it iterates, it tunes the hyper-parameters. If the result gives an MSE, lower
than the lowest MSE recorded, then that MSE is taken as the lowest. If there is no over-fitting, the
lowest MSE should be reported at the end of the iterations.
Table 10. Evaluation of the best performing algorithm for systolic blood pressure (SBP) and diastolic
blood pressure (DBP).
Systolic Blood Pressure Diastolic Blood Pressure
Performance
Selection Criteria Ensemble Ensemble
Criteria GPR GPR
Trees Trees
MAE 12.27 12.68 8.31 8.82
Features from the MSE 240.25 246.74 96.90 109.92
literature RMSE 15.50 15.70 9.84 10.45
R 0.71 0.71 0.62 0.54
All features MAE 12.06 12.95 7.70 8.31
(newly designed MSE 272.32 316.71 97.31 110.87
and from the RMSE 16.50 17.80 9.86 10.53
literature) R 0.70 0.59 0.63 0.57
MAE 10.08 12.57 7.87 8.93
MSE 219.08 258.16 96.70 119.32
ReliefF
RMSE 14.80 16.06 9.83 10.92
R 0.74 0.69 0.62 0.49
MAE 13.92 15.10 8.84 9.66
MSE 302.75 349.06 112.27 128.43
FSCMRMR
RMSE 17.39 18.68 10.59 11.33
R 0.62 0.55 0.53 0.42
MAE 11.91 13.06 7.64 8.27
MSE 257.77 325.29 83.95 103.70
CFS
RMSE 16.05 18.03 9.16 10.18
R 0.69 0.65 0.68 0.58You can also read