Analyzing the Web from Start to Finish - Knowledge Extraction from a Web Forum using KNIME
←
→
Page content transcription
If your browser does not render page correctly, please read the page content below
Analyzing the Web from Start to Finish
   Knowledge Extraction from a Web Forum using
                      KNIME

Bernd Wiswedel               Bernd.Wiswedel@knime.com
Tobias Kötter                Tobias.Koetter@uni-konstanz.de
Rosaria Silipo               Rosaria.Silipo@knime.com

Copyright © 2013 by KNIME.com AG all rights reserved          page 1
Table of Contents
Analyzing the Web from Start to Finish Knowledge Extraction from a Web Forum using
KNIME ..................................................................................................................................................... 1
Summary ................................................................................................................................................. 3
Web Analytics and the Desire for Extra-Knowledge ............................................................................... 3
The KNIME Forum ................................................................................................................................... 4
   The Data .............................................................................................................................................. 5
   The Analysis ......................................................................................................................................... 6
The “WebCrawler” Workflow.................................................................................................................. 7
   The HtmlParser Node from Palladian .................................................................................................. 7
   The XML Parser Node .......................................................................................................................... 8
Web Analytics and Simple Statistics ...................................................................................................... 12
   Forum Growth over the Years ........................................................................................................... 12
   Forum Efficiency and Scalability ........................................................................................................ 13
   Forum Ownership .............................................................................................................................. 14
Topic Classification ................................................................................................................................ 15
   Unzipping Files and the “drop” folder ............................................................................................... 15
   Text Pre-processing ........................................................................................................................... 16
   Model Training and Evaluation: the Decision Tree Ensemble........................................................... 18
   Topic Shift Detection ......................................................................................................................... 21
Identify Contents and Users .................................................................................................................. 22
   The Tag Cloud .................................................................................................................................... 23
   Build the User Network ..................................................................................................................... 25
   Build the Summary Report ................................................................................................................ 27
Moving into Production......................................................................................................................... 31
   Selective Data Reading ...................................................................................................................... 31
   Controlling the KNIME Workflows via Quickform Nodes .................................................................. 31
   Exploiting the KNIME Server to Share Common Metanodes ............................................................ 33
   Running the Workflows from the Web Portal................................................................................... 33
Conclusions............................................................................................................................................ 36
References ............................................................................................................................................. 36

Copyright © 2013 by KNIME.com AG all rights reserved                                                                                              page 2
Summary
In recent years, the web has become the source of all possible information. Web contents are used
more and more frequently to find out about customers’ and real-world people’s preferences. This
whitepaper implements all parts of the process of extracting information from the web using KNIME.

In order to produce a practical example and at the same time to learn more about the KNIME
community users, this analysis is focused on data from the KNIME Forum. The analysis is divided in 4
parts.

The first workflow is a web crawler. It is dedicated to web content extraction and data reorganization
which renders it suitable for the following analysis. It has often been said that one of the best
features of KNIME is the community behind it. Indeed, the download of the forum content is
outsourced to one of the community nodes. The following steps for data extraction and
reorganization, on the opposite, mainly rely on the KNIME XML node collection.

A few basic statistical measures are calculated to get insights about the forum performance as an
indirect measure of the KNIME community performance. Here users can be posters and commenters
at the same time. While the total number of users and of posts over time gives a measure of the
community growth, the average number of comments for each post can be considered a measure of
forum answer efficiency.

The topics discussed in the KNIME Forum represent another big source of information: they clearly
describe the evolution of the users’ interests and wishes over time. A full workflow has been
implemented to classify topics and detect topic shifts in time, using text mining techniques to
describe the post contents and predictive analytics to classify them. The results show that popular
topics have always been “data manipulation” and “data mining”, i.e. tasks where KNIME quality is
well known. They also show that the interest for the “flow control” category has been growing
strongly and steadily over time, re-enforcing the choice to keep improving these category nodes even
further.

Finally, a fourth workflow examines how the forum users interact with each other in different
discussion groups. Depending on the discussed topics, experts emerge quickly here from the user
network graph.

Those are four very popular areas in the analysis of web contents which are easily exportable to
other business contexts: web crawling, web analytics, topic detection, and description of user
interaction. All workflows are available on the KNIME public server and the KNIME software can be
downloaded from www.knime.com.

Web Analytics and the Desire for Extra-Knowledge
The analysis of web sites and especially of forums and social networks has become necessary for
many companies, in order to know what their customers wish, need, and use. However, the
extraction of knowledge from web sources is a complex task and involves many different steps in a
wider variety of disciplines. Often, employees as well as tools are specialized in only one of those
disciplines and therefore can carry out only one of the tasks required for the knowledge extraction
from the web, be this web crawling, database storage, th text analytics for topic detection, sentiment
analysis, user network representation, statistics, web analytics, or other such tasks.

The ambitious goal of this whitepaper is to implement and describe a full approach to the analysis of
web forums and social media from the beginning to the end, through:

Copyright © 2013 by KNIME.com AG all rights reserved                                           page 3
-   data collection via a web crawling algorithm and XML parsing functions
    -   simple statistics to see the evolution of the forum in time
    -   a topic detection application using text mining techniques
    -   a representation of the user network via network analytics
    -   the productization of all these steps on a KNIME Server

KNIME (www.knime.com) has been selected as the tool for the implementation of this project. The
choice fell on KNIME, not only because KNIME has a graphical interface, is easy to use, and is reliable,
but also because it contains all the necessary tools for all of the steps required by this project.

Indeed, many nodes are available in the KNIME Core for basic statistics. A full suite can be installed
from the KNIME extensions for text mining as well as for network analytics, containing all of the
nodes you need to perform sentiment analysis, topic detection, and network graph representations.
Finally, a web crawler node has been made available via a community extension provided by the
Palladian project (http://www.palladian.ws/).

All these features are powerful already by themselves, but combined with all the other data
processing, data mining, and reporting functionalities, they turn KNIME into a very powerful tool for
any analytics task, and in particular for extracting data and knowledge from the web communities.

For this whitepaper we focused on the KNIME Forum (http://tech.knime.org/forum) where
community users exchange questions and answers about technical KNIME topics. The goal was to
gain insights about the evolution in time of the KNIME software and about the user wishes and needs
for the future.

The KNIME open source platform can be downloaded from the KNIME site at www.knime.com. All
workflows reported in this whitepaper were developed using KNIME 2.7. However, an updated
version for KNIME 2.8, including the forum data and the metanode template, is available from the
KNIME public server at knime://publicserver/050_Applications/050007_ForumAnalysis.

The KNIME Forum
The goal of this whitepaper is to show how to extract data and therefore knowledge from web sites.
As a data mining company, we decided it would be best if we actually learned something from our
own data. So, we centered the project on the KNIME Forum data.

The KNIME Forum (http://tech.knime.org/forum) is the main community place for KNIME users. Here
KNIME users post questions to get help from other KNIME users to solve some particular problem.
Usually and quickly, at least one KNIME user knows the answer and is willing to help with the
problem at hand.

You need to officially register to take part into the KNIME Forum. After logging in, you can then place
your post or comment on other users’ posts. The Forum is divided in 5 topic-dependent parts, with
posts about:

    -   KNIME Core and Extensions
    -   KNIME Labs
    -   Development of new KNIME nodes
    -   KNIME Server
    -   Community Contributions

Each one of these sub-forums consists of many categories, like KNIME General, Text Processing, Third
Party nodes, and so on (see Fig. 1).

Copyright © 2013 by KNIME.com AG all rights reserved                                             page 4
Figure 1. The KNIME Forum

       The Data
In order to retrieve all posts and comments from the KNIME Forum we could have accessed the
underlying database storing the forum content. However, this would have been a very specialized
approach, which is not universally applicable to other systems and hence not of interest in the scope
of this article. To be able to extract data from any web site, with no access to the underlying
database, we need to crawl and read all (linked) pages.

There are a number of open source as well as commercial web crawling tools available. One option
could have been to start and run one of those web crawling tools via the “External Tool” node from
inside a KNIME workflow. However, as it often happens with KNIME, surfing a bit around the KNIME
community, we discovered that a web reader node had already been developed and made available
to KNIME users for free by Palladian (http://www.palladian.ws/). The node reads a given online
HTML web site and extracts all information in further processable XML format.

The KNIME Forum actually hosts five discussion groups: KNIME; KNIME Labs, Community
Contributions, Enterprise Tools, and KNIME Development.

The most visited place is of course KNIME, since this is where all general posts about KNIME usage
are.

The KNIME Labs forum page contains all questions about nodes in the KNIME Labs category. Just as a
reminder, KNIME Labs contains a number of new node extensions, which are not yet part of the
standard KNIME distribution but are still made available as a sneak preview for the KNIME users.

Community Contributions hosts all discussions about community developed nodes.

Recently a full discussion group has been opened for the KNIME Enterprise Tools. Indeed, while the
KNIME Enterprise Tools become more widely adopted, a category for discussions on this topic has
become necessary.

Copyright © 2013 by KNIME.com AG all rights reserved                                          page 5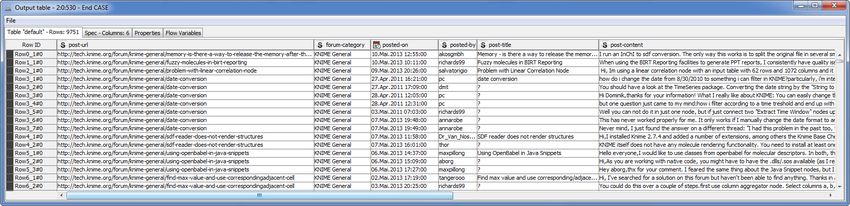
The last discussion group, KNIME Development, hosts all posts about standards and guidelines in
node development and the KNIME tools available to make the development of custom nodes easier.
Each discussion group separates its posts in a number of categories. The KNIME discussion group, for
example, contains 5 categories: KNIME Users, KNIME General, R Statistics nodes and Integration,
KNIME Reporting, and Third Party. In total, the KNIME Forum hosts around 20 categories.

An individual forum discussion thread consists of an initial post and a number of comments (Fig. 2); a
thread can span over several pages. The biggest challenge, after pulling down all the web pages, is to
resynchronize each post with all its comments.

                                  Figure 2. An example of a forum thread

       The Analysis
The analysis of the content of the KNIME Forum has been split in 4 parts. The corresponding
workflows can be downloaded from the KNIME public server named EXAMPLES and available in the
KNIME Explorer panel in the KNIME Workbench.

Copyright © 2013 by KNIME.com AG all rights reserved                                           page 6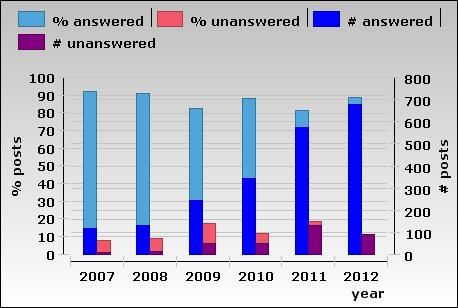
1. The web crawler workflow to collect all posts and comments from the forum.
    2. A workflow to calculate some simple statistics about the forum contents and the user
       behavior over the past 6 years.
    3. An attempt to classify the posts in terms of discussed topics and to observe the topic shift
       over time.
    4. The definition of a user network for a given category of the forum and for a given topic. That
       is basically a description of who is talking to whom about a certain topic.

In this whitepaper, we explore all of these workflows. We start from the workflow to crawl the web,
we continue with the workflow for some statistics on the forum data, then we implement a topic
classification application, and we end with a representation of the social structure in each forum
category.

The “WebCrawler” Workflow
We need now a web crawler application to download all posts and comments from the KNIME
Forum. Palladian (http://www.palladian.ws/) has developed an HTML parser node that connects and
downloads web pages. The “WebCrawler” workflow uses this node to download contents from a
website followed by a number of XML Parser nodes to extract meaningful pieces of text from the
downloaded contents.

       The HtmlParser Node from Palladian
The HtmlParser node is based on the Java HTML5 Parser, named Validator.nu
(http://about.validator.nu/). The parser is designed to work as a drop-in replacement for the XML
parser in applications that already support XHTML 1.x content and use SAX, DOM or XOM to
interface with the parser. The node execution is resource intensive, especially on the targeted web
site, and quite time consuming. So be careful when running it, not to stall the target web site!

The configuration window of the HtmlParser node is quite simple. The node just needs to know the
list of URLs of the target websites, in the form of a data column (Fig. 3). When enabled, all relative
URLs are converted to absolute ones. This simplifies/permits further processing steps with the URLs
obtained from the input data column.

                           Figure 3. Configuration Window of the HtmlParser node

The web address for the KNIME Forum (http://tech.knime.org/forum) is provided as the only content
of a Table Creator node. The HtmlParser node then, during execution, connects to the web site,
downloads the raw HTML content, and presents it at its output port in form of an XML column.

Copyright © 2013 by KNIME.com AG all rights reserved                                           page 7
Notice that the HtmlParser node belongs to the community contributions and therefore it is not part
of the core KNIME Desktop features. The node has to be installed separately as a KNIME Extension
from the Palladian package (http://tech.knime.org/community/palladian) in the Community
Contributions.

       The XML Parser Node
After execution, the HtmlParser node presents a huge XML cell at the output port, containing all
threads from the forum. In order to isolate the details of each forum thread, some XML parsing has
to be applied.

KNIME offers a full category, named XML, dedicated to XML operations: reading, writing, converting,
combining, and of course parsing. The node that is needed here is the XPath node.

This node performs an XPath query on a column of XML cells and can produce another XML cell (a
Node), a collection of XML cells (a Node-Set), or just a single value (number, string, Boolean, etc…)
depending on the result of XPath query. The node supports XPath 1.0.

For example, let’s consider the following XML document:

         Harry Potter and the Sorcerer's Stone
         J. K. Rowling

         Harry Potter and the Chamber of Secrets
         J. K. Rowling

Using “dns” as the prefix of root namespace:
   -   //book        returns a collection of XML cells (Node-Set) , which, after ungrouping, shows as:

                  Harry Potter and the Sorcerer's Stone
                  J. K. Rowling

                  Harry Potter and the Chamber of Secrets
                  J. K. Rowling

   -   //book[@year=1999]            returns again a collection of XML cells (Node-Set) similar to the
       previous one, but containing only the items with year = 1999.
   -   //book/title           returns a collection of XML cells (Node-Set) , which, after ungrouping,
       shows as:

                        Harry Potter and the Sorcerer's Stone

                        Harry Potter and the Chamber of Secrets

Copyright © 2013 by KNIME.com AG all rights reserved                                            page 8
-   //book/@year          Notice that collection outputs are only possible for the XML cells. The
        XPath node does not produce string, integer, double, or any other type of collections. So,
        using an XPath node, using //book/@year as XPath query, produces a collection of XML cells,
        which after ungrouping is visible as:

    -   To isolate the titles as strings, you need to extract the  items first as a collection of
        cells with //book XPath query, then ungroup the collection, and finally extract the
        items as strings with XPath query //title in an XPath node again (Fig. 4). The return
        type of the last XPath node is “String (String cell type)”.
                             Figure 4. Extract titles from xml cell as //book/title

    -   To isolate the years of publication, you need to extract the  items first as a collection
        of cells with //book XPath query, then ungroup the collection, and finally extract the
        @year attributes as integer with XPath query //@year in an XPath node again. The return
        type of the last XPath node is “Number (Integer cell type)”.
    -   You can find more complex examples of XML parsing at w3cschools.com.

Before continuing with parsing the html document collection produced by the HtmlParser node, let’s
have a look in more detail at the XPath node’s configuration window. For example, let’s use the
configuration window of the XPath node that extracts all book titles as strings (Fig. 5).

First of all, the node needs the name of the XML column to work on, “books” in this case, which we
can remove after the XML parsing has been executed. Then, it needs the name for the newly
produced column: we used “titles”.

The most important part is, of course, the XPath query, in this case //title. A relative spacious
textbox is reserved to host the XPath query.

Finally, the definition of the type of results coming out of the XML parsing is needed. A few options
are possible:

    -   Node-Set (collection of XML cells)
    -   Node (XMl cell)
    -   Number (Double or Integer)
    -   Boolean
    -   String

An error in selecting the wrong output type can be recovered using missing cells, by enabling the
option “return missing cell on empty string or no match”. If the return type is an XML type (collection

Copyright © 2013 by KNIME.com AG all rights reserved                                            page 9
or cell), enabling the option “return missing cells on no match” allows error recovery via the
 item.

If your XML document contains namespaces, you can define them in the XPath node’s configuration
window.

The root namespace can be incorporated by default in every XPath query, by enabling the
corresponding option at the bottom of the configuration window. The default prefix for the root
namespace can be choosen arbitrarily and needs to be used within the query. In the example we
used “dns”.

An example workflow for XML parsing can be found on the KNIME public server under
013_XMLProcessing/013004_XMLProcessing_HarryPotter.

                                Figure 5. XPath node configuration window

To extract information from the html document generated by crawling the KNIME Forum, we start
from the  item, as root, by splitting it in two sub-items:  and . After ungrouping these two item collections, the  items are extracted to get the
full list of threads on each page as string documents. This sub-workflow has been encapsulated in the
meta-node named “TOC of Forum”.

The upcoming sequence of XPath nodes, contained in the “Category Page Count” meta-node rescues
all pieces of the same threads spread across different forum pages.

Copyright © 2013 by KNIME.com AG all rights reserved                                         page 10
The final XPath query used in our workflow to extract the top category entries from the forum raw
data is the following:
//dns:td[@class='forum-details']/dns:div[@class='forum-name']/dns:a
as shown in the configuration window shown in figure 6.
Figure 6. The WebCrawler Workflow
For each category, then, all links to subpages are explored and the html content is downloaded using
a combination of the HtmlParser node and of XPath nodes as before. The complete “WebCrawler”
workflow is shown in figure 7. This workflow has been later incorporated in a metanode and used as
the first node in the upcoming workflows. To see its structure, please refer to the the first metanode
in the next workflows.
Figure 7. The WebCrawler Workflow
The final result is a data table with a row for each post (either question or comment) including its
URL in the forum, the category where it was posted, the date when it was posted, its author, its title,
and its content (Fig. 8).
Copyright © 2013 by KNIME.com AG all rights reserved page 11Figure 8. Post data after crawling the KNIME Forum.
The “WebCrawler” workflow has been eventually wrapped into a meta-node named “Knime Forum
Data” to be used in all other workflows to fetch the forum data.
Web Analytics and Simple Statistics
Many questions can be answered digging in the forum data: about the users, about the KNIME
platform, about the efficiency and the scalability of the forum itself, and finally about the discussed
topics. Especially discussed topics can help with the development of new features and issue
identification.
Here we list a few common questions that have risen when we started analyzing the forum data.
How many users does the KNIME Forum have? How active are they? Has the forum grown over the
past years? How long is the response time to be expected for a new post? Is then the forum a useful
channel to get information? What are the discussed topics? Have they changed in time? Who’s
talking to whom? Who seems to play the role of the accredited expert on a particular topic?
In this section, we concentrate on the forum users and on the role that the forum has been playing in
answering their questions. In particular, we would like to measure the growth of the KNIME Forum in
terms of number of users and posts. We would also like to measure the efficiency of the KNIME
Forum in answering questions about the KNIME platform and to check whether such efficiency
decreases with a higher volume of posts and users. Finally, we would like to quantify how much of
the forum is KNIME driven and how much is community driven. That is: Is the forum too strictly
controlled by KNIMers or is it the natural expression of the KNIME community? A simple statistics
should suffice for such tasks (workflow “KNIME Forum simple statistics”).
Forum Growth over the Years
Figure 9. Number of active users per year from 2007 to
2012 Figure 10. Number of posts per year from 2007 to 2012
After extracting the year from the posting date in the parsed data, the number of active users was
counted for each year. This was obtained by means of a GroupBy node aggregating by year and
applying the unique count to the post author field. After connecting the workflow to a simple report,
Copyright © 2013 by KNIME.com AG all rights reserved page 12the bar chart in figure 9 was derived, showing how the absolute number of active users has grown in
the time interval 2007-2012. The same plot could be drawn at a higher time resolution considering
the time month+year, instead of just year. However, the plot would not change much, besides some
more noise in the peak variations.
Similarly, the number of posts for each year could be displayed. According to how the data have been
parsed, a post-url with title represents the source post, that is the post with the question; but a post-
url without title represents an answer to the original post. To count the missing values in the title
field by post-url means to count how many answers each post has got. Aggregating again by year and
counting the number of unique post-url defines the number of posts for each year in the KNIME
Forum (Fig. 10).
Both the number of active users and the number of posts have been growing steadily over the last 6
years. A big increase in number of posts is clearly visible between 2010 and 2011, when KNIME
became more widely used and many more users joined the forum.
Forum Efficiency and Scalability
So, the forum base has been growing. But has the KNIME Forum managed to grow with its base? Has
the forum efficiency suffered from the bigger load of posts, questions, and answers? In short, has the
KNIME Forum proven to be capable of scaling? The second part of the “KNIME Forum simple
statistics” workflow measures the forum efficiency and scalability in terms of response time and
number of comments.
Figure 11. Scakability of the Answer Process per year from Figure 12. Response Time in Number of Comments for all
2007 to 2012 posts posted between 2007 and 2012
As seen in the previous section, the number of rows with missing title was counted for each post-url.
Such rows represent comments to the original posted question. The total number of answered and
unanswered post, as well as their percentage, was calculated by year and reported in the
corresponding report in the bar chart in figure 11. There you can clearly see the total number of
posts growing, both answered and unanswered (blue and purple bars), while the percentages of
answered vs. unanswered posts remain stable, between 80%-90% of answered posts vs. less than
20% of unanswered posts each year. This alone shows that the KNIME forum has been quite reliable
over the years in its capability to deliver answers to posted questions, even if the number of posts
has been growing fast.
So, it has been able to deliver answers, but how fast? Posting a question about KNIME today and
getting an answer in two weeks is of not much help. In the next part of the workflow the response
time was measured, as the number of days or as the number of comments needed to get the answer.
Let’s talk about number of comments. With a GroupBy node, we count the number of comments
(rows with missing titles) for each post-url. Then we count the number of post-url with a specified
number of comments across all available years. The result is the bar chart in figure 12, where the
Copyright © 2013 by KNIME.com AG all rights reserved page 13number of comments is reported on the x-axis and the number of posts receiving that number of
comments is reported on the y-axis.
Of course, we need to keep in mind that not all comments are useful. KNIME Forum users are very
polite and many of the comments are just thank you notes. But still the number of comments for
each post gives us an idea of how fast it was to answer the posted question.
We also need to keep in mind, that a few posts are actually announcements or, worse, spam,
especially in the early time of the KNIME Forum life. Most of these posts lie in the first bar of posts
with 0 comments of the bar chart in figure 12. In the same chart, we see that most posts are
answered by only one or at maximum two comments, where probably the second comment is a
thank you note. Only a few posts receive more than 2 comments in their lifetime. This is good hope
for new KNIME forum subscribers: somebody out there already knows the answer to their question
and will quickly share it on the forum.
Figure 13. Average Number of Days till first Comment per Figure 14. Standard Deviation of the Number of Days till
year from 2007 to 2012 first Comment per year 2007 and 2012
Let’s move now to the number of days needed to get an answer on the forum. Sorting the comments
by date and calculating the difference between the post date and the first comment date in number
of days offers a first measure of the response time (in number of days) and therefore of the forum
efficiency.
The average and the standard deviation of the response time (difference between first comment
date and original post date) has been calculated for all posts in each year and reported in figures 13
and 14. In most years, you needed to wait one or maximum 1.5 days till you got a first (and probably
final, based on figure 12) answer. In 2010 things looked a bit more complex. But this is due to spam
messages that never got answered and are still part of the KNIME forum data. Indeed, this
phenomenon can also be observed in figure 14, where in 2010 the standard deviation of the number
of days to pass till first answer is much higher than in the other years, taking into account those spam
posts with no answer that drive the average measure up.
Forum Ownership
And finally, who is answering all these questions? Is the KNIME Forum a spontaneous place or is it
fully controlled by the KNIME employees?
Here, we checked the post-author field of the data. Since the KNIME employees, who are active in
the KNIME Forum, are not that many and easily identifiable, we could isolate the KNIME-originating
answers. All other answers must have come from the KNIME community. We then counted the
number of comments per each year from KNIME employees and from the KNIME community and
transformed the results from absolute numbers to percentages. In figure 15, the percentage of
KNIME answers (blue bars) decreases over the years with the increasing number of posts, while the
community contribution takes over, covering 80% of the post answers in 2011 and 2012.
Copyright © 2013 by KNIME.com AG all rights reserved page 14Figure 15. Users Answers: KNIME vs. Community
Topic Classification
So, the number of users in the KNIME Forum has been growing and they have been discussing more
and more over the years. The question now is: What have they been discussing about? Are there
recurrent themes? Are there important themes, like show stopper bugs? In this section, we would
like to discover the discussion topics and track the topic changes over the years. This section’s
workflow is “KNIME Forum Classify Posts”.
In the forum data we can find discussion texts, but a set of pre-defined topic categories to classify
such texts is missing. Usually when the target classes are missing we resolve to some clustering
technique. The idea then would be to extract the keywords from each post thread and cluster all post
threads on the basis of the used keywords. However, this procedure might be sub-optimal in this
case: on one side, because each topic category can be described by many similar keywords; on the
other side, because at the end we still need to associate a topic to each cluster.
Alternatively, we can try to borrow a new topic ontology from some documentation site available
within KNIME. Indeed, a node description can be found for each selected node in the right panel in
the KNIME workbench. The node description text comes from an XML file available within KNIME.
The node name could be used as the topic class and the description text could be used as the source
text describing that topic class. All those description XML files have been collected, zipped, and used
to build the topic ontology for the forum topic detection.
Unzipping Files and the “drop” folder
As usual, the first part of the workflow is dedicated to clean up and organize the data for the
upcoming classification: on one branch, the zipped file containing the XML files with the node
descriptions; on the other branch the results of the web crawling workflow. The first text-processing
part in the branch in the workflow, processing the XML description texts, is shown in figure 16.
The “Unzip Files” node unzips the file into a temporary location, defined by the previous “Create
Temp Dir” node. Both paths - the path of the zip file and the path of temporary location - are passed
to the “Unzip Files” node as flow variables. The temporary location path is provided by the “Create
Temp Dir” node. The input zip file path is provided via the “drop” folder utility.
Copyright © 2013 by KNIME.com AG all rights reserved page 15Figure 16. Extracting text documents from a zipped file
The “drop” folder utility is available to all reader nodes. In the system folder of the reader node you
can insert a subfolder, named “drop”, and some files in the “drop” folder. With such a folder
configuration, the reader node creates as many flow variables as many files in the “drop” folder. Each
flow variable is named “knime.node (drop) ” and contains the current path to the referred
file.
If the resetted workflow is exported including data, the final zip file contains the workflow and the
folder structure of the input files for the reader node. Also, referencing the input file by means of its
“drop” path allows moving the workflow to another machine without having to reconfigure the
reader node. The “drop” folder utility is thus very useful to move workflows around, keeping the
reader nodes validly configured.
Text Pre-processing
The node description files are in XML format. The “xml files” meta-node reads all the description files
with an XML Reader node inside a loop, then uses a Java Snippet node to extract their parent
category from their URI, and finally with a few XPath nodes extracts the node name and description
from the XML file content.
The „string manipulations” meta-node only contains a number of String Manipulation nodes to
remove copyright and other content unrelated sentences from the text descriptions.
Figure 17. The sub-workflow in the"xml files" meta-node
At last, the “data preparation” meta-node prepares the text data for classification, by converting all
description text strings into Document type, extracting the bag of words, getting rid of all non-
content related words, reducing words to their stems, deleting conflicting tags, and finally extracting
the keywords for each document (Fig. 18). The Integer Input Quickform node defines the number of
folds for the cross-validation node hosting the classification algorithm down the workflow.
Copyright © 2013 by KNIME.com AG all rights reserved page 16Figure 18. Sub-workflow in the "data preparation" meta-node
Note that the document type input is required by most text processing nodes to operate. A
document data includes some additional information in the shape of tags besides the text, like the
author name, the title, the document source, the document category, the publication date, and the
document type.
The BoW Creator node creates a bag of words (BoW); that is it extracts each word from each
document. For example, the sentence “this is KNIME text processing tool”, after the conversion to
document type and the BoW creation, produces the data table displayed in figure 19, where the
words are isolated and still associated to the original document.
Figure 19. BoW for "This is KNIME text processing tool".
Now, words need to be reduced to their stem. Indeed, if we classify “process” and “processing” as
separate words, the result might be suboptimal. We need to use both words as the same input value;
that is, we need to use their original stem. The Porter Stemmer node produces the stem for each
term in the input data table, according to the Porter stemmer algorithm [1]. In our previous example,
an input data table with the list of terms “process”, “processing” would produce the following list of
stemmed terms: “process[]”, “process[]” with the associated document on the same row.
Copyright © 2013 by KNIME.com AG all rights reserved page 17The Term Grouper node is used here just to delete conflicting tags in instances of the same word. For
example, if we have words tagged for “good” and “bad” and a word happens to have tag sometimes
“good” and sometimes “bad”, all tags for that word will be deleted. We use this node to get rid of tag
inconsistencies.
The Keygraph keyword extractor is the main node of this text processing meta-node. This node
analyses documents and extracts relevant keywords using a graph-based approach [2]. In a very
rough summary, the Keygraph keyword extractor node sorts terms by frequency measures and by
edges in a graph. The most frequent and the most connected terms obtain the highest scores and
therefore are the most appropriate candidates as keywords for the document. The node takes a list
of terms, with the document they belong to, and produces a significance score for each term. Only
the top 15 most significant keywords are kept for each document.
This part of the workflow has been applied to the XML node description documents, to prepare the
training set. On the other branch, the post texts coming from the KNIME Forum have been processed
similarly, including the removal of duplicates, the cleaning of html tags, the bag of word creation, the
stemming, and the keyword extraction. We only used the posts from the KNIME Users and from the
KNIME General discussions for the test set, since they are the most populated and most general
discussions anyway.
Since the two sets, the training and the test set, come from two related but different sources, it
might happen that the two word sets do not completely overlap. The meta-node “fix domain” fixes a
possible domain discrepancy among word sets, by including the words present in one of the two sets
and missing in the other.
Model Training and Evaluation: the Decision Tree Ensemble
Each node description document has now a set of terms with significance measure and it has been
tagged with the node category. The goal is to use such category and such list of terms to train a
classifier and to apply the classifier later to the forum posts, in order to associate a discussion topic
to each post.
As a classification model a decision tree ensemble was adopted. KNIME implements the decision tree
ensemble via the Tree Ensemble Learner node and the Tree Ensemble Predictor node. The Tree
Ensemble Learner node builds an ensemble of decision trees, like a random forest variant. Each of
the decision tree models is trained on a different set of rows and/or on a different set of columns,
randomly selected at each iteration. The output model is an ensemble of decision tree models. The
Tree Ensemble Predictor node applies all decision trees to each data row and uses the simple
majority vote for prediction.
The Tree Ensemble Learner node is quite complex, because of the many settings to be provided for
the decision tree ensemble training. Indeed, it has three setting tabs in the configuration window:
one to select the attributes (that is the data columns), one to select the decision trees training
parameters (like the entropy measure), and one to select the ensemble settings (like the number of
trees to be trained).
As we said at the beginning of this section, for now we have only one column with a list of terms and
one column with a significance measure. This does not give enough details even for the most
powerful classification algorithm. Thus, usually, text mining techniques change the data perspective
from a long list of terms to the matrix of keywords found in each document. The matrix
representation gives more information about which keywords have been found in the document and
which ones have not. Using the example in figure 19, we want to move from that list-based to the
vector-based representation shown in figure 20. Here the document “This is KNIME text processing
tool” has been represented as having the word “KNIME” but not the word “data”.
Copyright © 2013 by KNIME.com AG all rights reserved page 18Figure 20. The terms matrix representation of a document
The Document Vector node creates a document vector for each document in the terms space. The
row matrix dimension is the number of distinct terms in the input column. The feature vectors can
take Boolean values (1= the term is in the document; 0= the term is not in the document) or the
values of another column, for example a significance measure column. Options “Bitvector” and
“Vector value” are mutually exclusive and define the type of cell content. Since the training set we
used is not a native data set of the forum, but just an approximation, we decided not to rely on the
significance measures produced by the “Keygraph keywords extractor” node and we enabled the
“Bitvector” option (Fig. 21).
We have now an appropriate set of input features to feed the Tree Ensemble Learner. We still need a
column to work as target for the decision tree. That is, we need to define the class for each one of
the node description documents. Previously, we assumed that the node category would have been
the class of each document and therefore we embedded the node category into the document
category. Now it is the moment to convert the document category into a class for each document,
i.e. each matrix row. The Category To Class node extracts the category from a document cell and
appends it into a new column, named “Document class”.
Figure 22. "Attribute Selection" tab in the configuration
window of the "Tree ensemble learner".
Figure 21. The "Document vector" configuration
window
The Tree Ensemble Learner is then fed with the term binary features and with the document
class as the target for the decision trees (Fig. 22). The Gini index is adopted as entropy
measure and the size of nodes and leaves is not limited (Fig. 23). And finally, for the
ensemble configuration (Fig. 24) all rows are sampled (fraction=1) using the random
Copyright © 2013 by KNIME.com AG all rights reserved page 19sampling with replacement strategy (bootstrapping) and only some columns are randomly
selected, i.e. the square root of the number of columns, to train each tree.
In theory, we could use the whole data set coming from the node description files as training
set, since the real test set is coming from a different source. However, just for evaluation
purposes, we create a test set from the same node description data set to evaluate the
performance of the ensemble tree. It is clear that if the ensemble tree fails the classification
task on a test set with the same characteristics as the training set, it will have no hope of
performing better on a loselier related data set.
On the last part of the upper branch of the “KNIME Forum Classify Posts” workflow (Fig.
25), the node description based data set is split in two parts (80%-20%). 80% of the data is
used to train the Tree Ensemble Learner node, with the same configuration settings as
described above, and the remaining 20% is used to apply the ensemble model using the Tree
Ensemble Predictor node. Evaluation is carried out by a Scorer node and shows a 0.754
accuracy on the test set.
Figure 23. "Tree Options" tab in the configuration window Figure 24. "Ensemble Configuration" tab in the
of the "Tree ensemble learner". configuration window of the "Tree ensemble learner".
Figure 25. Tree Ensemble evaluation part of the workflow
The real ensemble model to be used is trained on all node description data, to give more chances to
the model to perform well on foreign data.
The same term vectorization described at the beginning of this section is applied again to all
documents coming from the forum posts. A Tree Ensemble Predictor node uses the ensemble model
trained on the node description data to produce a topic class for the forum posts. For example, a
Copyright © 2013 by KNIME.com AG all rights reserved page 20post containing, among others, the terms plot[], domain[], scatter[], size[], color[], and dimension[] is
classified as belonging in a first instance to class-category “data views” and in a second instance to
class-category “flow control”.
Topic Shift Detection
Indeed, most posts are not just simple questions on how to run a specific node in a specific category.
More often they ask how to combine nodes from different categories. It is hard then to associate one
post to one category only. The most frequent situation has one post associated to two or even more
categories.
For example, the post “How can I loop on a list of files and concatenate the contents?” includes the
“io” category, the loops in the “flowcontrol” category, and the concatenation in the “data
manipulation” category. So, if the option “Append individual class confidences” is enabled in the Tree
Ensemble Predictor node, the results show all possible output categories with their corresponding
probabilities for each post. For the post mentioned before, the ensemble tree would produce “io”
with highest probability, followed by “flowcontrol”, and then “data manipulation” categories.
Looping on all class categories and isolating the three class categories with highest probability assigns
the top three output classes, i.e. with highest likelihood, to each forum post: topic 1, topic 2, and
topic 3. Finally, the number of posts is counted for each year and for each category in topic 1, topic 2,
and topic 3, and a final report shows the number of posts by class category per year and in each one
of the three topics.
Figure 26 shows the dominance of posts having data mining or data manipulation as main topic. The
chart for the secondary and tertiary topic also shows a dominance in the number of posts about data
mining nodes and data manipulation nodes in most years, but especially in 2011 and 2012.
Figure 26. Number of posts in the forum about a certain topic over the years
We know from the previous sections that the number of posts has grown dramatically in 2011 and
2012. From this topic detection analysis, we know that the biggest increase has been in data mining
Copyright © 2013 by KNIME.com AG all rights reserved page 21and data manipulation related posts, which is also the feeling a user gets when browsing the KNIME
Forum.
Notice the little numbers for “r” and “timeseries” related questions. Indeed, while the part of data
mining and data manipulation is quite mature and abundantly used, time series and R nodes are still
in their prime infancy as of KNIME 2.7. With KNIME 2.8 both categories have been majorly improved
by introducing the “Lag Column” node for time series lagging and the “R (Interactive)” category for
interactive R coding. It would be interesting to know if the number of posts on these two topics
would increase in 2013 and beyond.
Another interesting topic is “database”. The number of posts concerning databases reached its
height in 2009 when most database nodes have been introduced, to slow down till 2011 and pick up
again in 2012. In 2009 and in 2012 there have been requests via the KNIME Forum for additional
database nodes and features.
“flowcontrol” related posts also increased after 2009, being the “flowcontrol” category virtually
empty before 2009.
In conclusion, the strength of KNIME lied almost exclusively in the data mining and data manipulation
nodes till 2012. However, flow control and io posts are also rapidly growing, while time series and r
are probably waiting for the big improvements of KNIME 2.8 in 2013. Database issues and requests
have been resolved or answered in 2009, till a new wave of requests for non-structured databases
arrived in 2012.
Identify Contents and Users
At this point we know that many people have come to the KNIME Forum and we know what they
have been talking about over the years. We would like now to know who the main actors in the
different discussion groups are and how they interact with each other.
The goal here is to generate a report with one page for each discussion group to contain:
- A word cloud of the discussed topics
- A user interaction graph
- Some general statistic about the most active posters and the most active commenters
It would also be useful to have a first page in the report with the list of the analyzed discussion
groups, each linked to its report page.
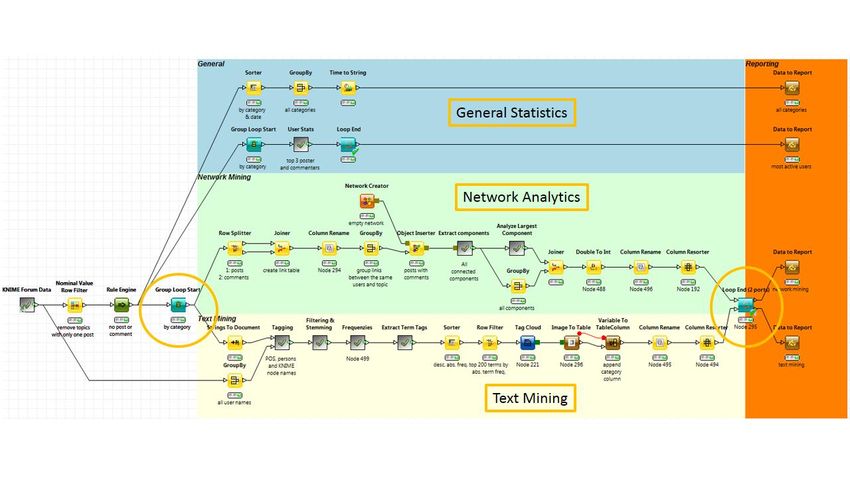
Starting again from the forum data in figure 8, in the workflow named “KNIME Forum Text and
Network Analysis” (Fig. 27), discussion groups (forum-category field in the forum data table) with
only one topic have been removed, leaving circa 20 forum categories. A GroupBy node then extracts
the list of all those categories and a Group loop finds out the three most active posters and the three
most active commenters for each forum category. Both data tables are exported to the report.
At this point, the big loop starts with the Group Loop Start node and loops over all forum categories,
producing the word cloud and the user graph for each one of them. In the loop we have two
branches. The lower branch calculates and visualizes the word cloud of the forum category as an
image; the upper branch calculates and visualizes the graph representing the user interactions as an
image. Both images are included as image cells in the output data tables.
Copyright © 2013 by KNIME.com AG all rights reserved page 22Figure 27. Workflow "KNIME Forum Text and Network Analysis"
The Tag Cloud
In order to produce the word cloud for each forum category, we need to use the KNIME text
processing libraries again.
All words in a document are tagged with the part of speech, being that a verb, a noun, an adverb,
etc., using the POS Tagger node. User names in the document are also recognized and tagged as well
as KNIME node and category names with two separate Dictionary Tagger nodes. Finally, the Bag of
Words is created with the BoW Creator node. All those nodes are stored in the “Tagging” metanode.
The “Filtering & Stemming” metanode filters out pause words, numbers, adverbs, conjunctions, and
short words in general as non relevant. The Kuhlen Stemmer [3] is applied to reduce words to their
stem, the Term Grouper node groups all similar terms together, and the RegEx Filter node filters all
terms matching the “0x.+” regular expression, that is all terms starting with “0x”, which are system
log reports.
Metanode “Frequencies” calculates the frequencies to use as term size in the word cloud.
- IDF (Inverse Document Frequency) of a term is the logarithmic measure of the total number
of documents divided by the number of documents containing that term. This is a measure of
how important this word is for this particular group of documents.
- TF absolute is the number of times that a word appears in a document.
- TF relative is the number of times that a word appears in a document divided by the number
of words in the same document.
- (TF relative *IDF) gives the measure of how representative a word is for that document and
for its category.
Metanode “Extract Term Tags” extracts all previously encapsulated tags (Part Of Speech, Poster
names, and KNIME node and category names) for filtering and coloring of the word cloud. The
average frequency measures, the most frequent POS, poster and node name are calculated for each
Copyright © 2013 by KNIME.com AG all rights reserved page 23term across all documents. Finally, a color is assigned to nouns (NN), verbs (VB), poster names
(PERSON), node names (DATE), and category names (TIME) in a Color Manager node.
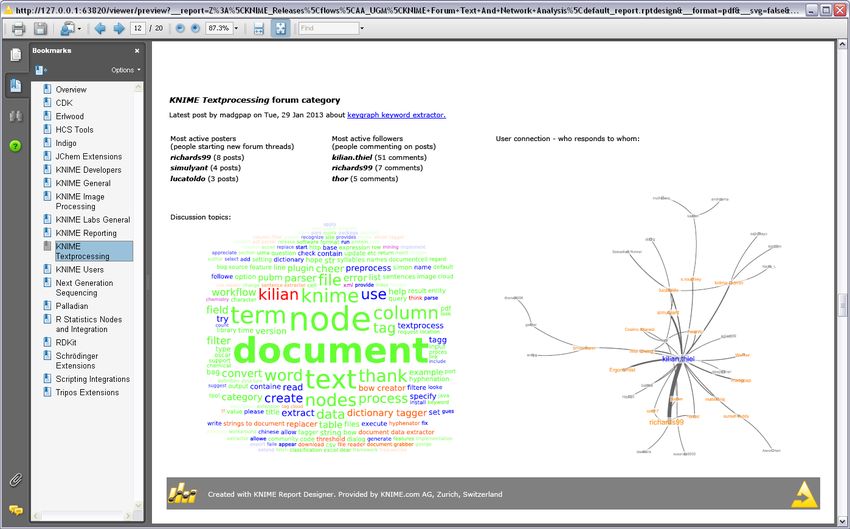
Figure 28. Tag cloud using (IDF*TF relative) for KNIME Figure 29. Tag cloud using (TF absolute) for KNIME
Textprocessing forum category Textprocessing forum category
The most frequent 200 terms, based on absolute frequency, for each forum category are isolated and
fed into the Tag Cloud node. This produces a colored image of the word cloud of the 200 most
frequent words across all documents in the selected discussion group. The term size in the word
cloud can be proportional to (IDF*TF relative), IDF, TF relative, or TF absolute. The tag clouds for the
KNIME Textprocessing discussion group using (IDF*TF relative) and (TF absolute) respectively are
shown in figures 28 and 29.
The Image To Table node converts the image output of the Tag Cloud node into a data cell of type
Image in a KNIME data table. This is then collected by the second output port of the Loop End (2
Ports) node and exported into the associated report as the “text mining” data set (Fig. 30).
Figure 30. Output Data Table of the text mining loop branch.
Copyright © 2013 by KNIME.com AG all rights reserved page 24Build the User Network
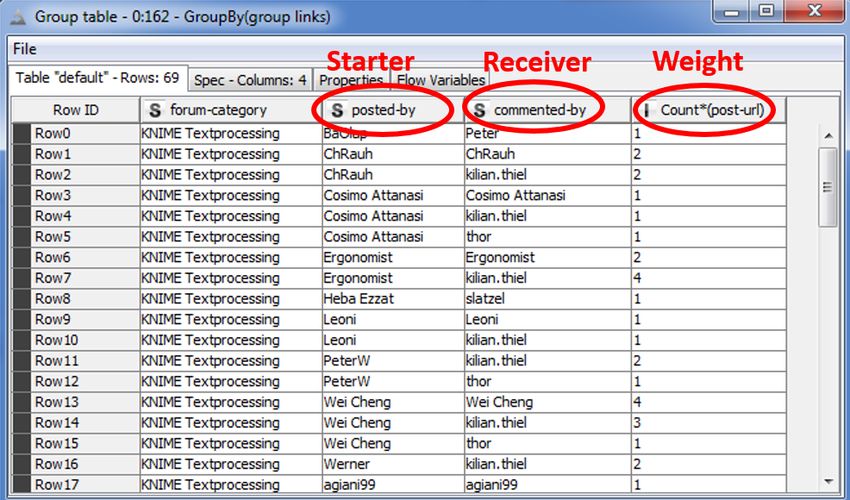
The upper branch of the Group loop is dedicated to Network analysis, to answer the question of who
is talking to whom. First of all, by means of a Row Splitter, a Joiner, and a GroupBy node we build a
data table as depicted in figure 31, with a source (the poster name), a target (the commenter name),
and a weight (the number of comments) for every edge.
Figure 31. Data table to build the network graph with a source, a target, and a weight for every edge.
An empty Network object is allocated with the Network Creator node and shaped with the data table
of figure 31 by means of an Object Inserter node. The result is a Network object representing the
user graph for this forum category.
The metanode “Extract Components” calculates the number of edges, the number of nodes, and the
number of objects (= number of edges + number of nodes) for each connected component of this
graph.
The “Analyze Largest Component” metanode includes a sub-metanode, named “Create Network
View”. This metanode uses the Network Analyzer node to calculate the node degree, the in/out
degree, the closeness centrality, the Hubs and Authority score, the number of nodes, and the
number of edges of the largest connected components.
- The node degree counts the number of incident edges. The percent degree is the percentage
of edges in comparison to the total number of edges.
- The in/out degree counts the number of incoming/outgoing edges. The percent
incoming/outgoing degree is the percentage of edges in comparison to the total amount of
edges.
- The closeness centrality index divides the number of nodes by the sum of the distances from
the analyzed node to all other nodes. The node with the highest value is the most central
node of the graph [4].
- The Hubs & Authority scores measure each node’s authority and hub feature [5][6]. The
essential idea is that a node is a hub to the extent that it links to authoritative nodes, and is
an authority to the extent that it is linked from 'hub' nodes. To calculate these scores the
implementation of JUNG the Java Universal Network/Graph Framework [7] is used.
Now the network graph visualization. The maximum score between the hub and authority score is
kept, renamed as “Max Score”, and used in a Size Manager node to resize the nodes later in the
network view. After that, nodes are classified as Hub if their Hub score is above 0.1, as authority if
Copyright © 2013 by KNIME.com AG all rights reserved page 25their authority score is above 0.1 and as neutral otherwise via a “Rule Engine” node. A “Color
Manager” node colors in gray all neutral nodes, in orange all authoritative nodes, and in blue all hub
nodes of the network graph.
Figure 32. Configuration Window of the "Network Analyzer" node inside the "Create Network View" metanode.
Figure 33. User Network for the KNIME Textprocessing forum category.
Copyright © 2013 by KNIME.com AG all rights reserved page 26You can also read


