Intercomparison review of IPWV retrieved from INSAT-3DR sounder, GNSS and CAMS reanalysis data
←
→
Page content transcription
If your browser does not render page correctly, please read the page content below
Atmos. Meas. Tech., 14, 4857–4877, 2021
https://doi.org/10.5194/amt-14-4857-2021
© Author(s) 2021. This work is distributed under
the Creative Commons Attribution 4.0 License.

Intercomparison review of IPWV retrieved from INSAT-3DR
sounder, GNSS and CAMS reanalysis data
Ramashray Yadav, Ram Kumar Giri, and Virendra Singh
Satellite Meteorology Division, India Meteorological Department, Ministry of Earth Sciences, New Delhi 110003, India

Correspondence: Ramashray Yadav (ramashray.5329@gmail.com)

Received: 7 January 2021 – Discussion started: 20 January 2021
Revised: 22 April 2021 – Accepted: 31 May 2021 – Published: 9 July 2021

Abstract. The spatiotemporal variations of integrated pre-      1   Introduction
cipitable water vapor (IPWV) are very important in under-
standing the regional variability of water vapor. Traditional   Integrated precipitable water vapor (IPWV) is a meteorolog-
in situ measurements of IPWV in the Indian region are lim-      ical factor that shows the amount of water vapor contained
ited, and therefore the performance of satellite and Coperni-   in the column of air per unit area of the atmosphere in terms
cus Atmosphere Meteorological Service (CAMS) retrievals         of the depth of liquid (Viswanadham, 1981). This parame-
with the Indian Global Navigation Satellite System (GNSS)       ter is of great importance in all studies related to the atmo-
as reference were analyzed. In this study the CAMS reanal-      sphere and its properties throughout the year and in all sea-
ysis data of 1 year (2018) and the Indian GNSS and INSAT-       sons. The assessment of IPWV is done in many ways, such
3DR sounder retrieval data for 1.5 years (January 2017 to       as in situ, model based or through remote sensing measure-
June 2018) were utilized, and statistics were computed. It is   ments. The in situ stations have limited coverage, are expen-
noticed that seasonal correlation coefficient (CC) values be-   sive and require maintenance all the time. Remote sensing
tween INSAT-3DR and Indian GNSS data mainly lie within          instruments, especially absorption in the infrared and mi-
the range of 0.50 to 0.98 for all the selected 19 stations      crowave region of the solar spectrum, have wide coverage,
except Thiruvananthapuram (0.1), Kanyakumari (0.31) and         are cheaper, and are almost maintenance-free but need to val-
Karaikal (0.15) during the monsoon season and Panjim (0.2)      idate their retrieval performance and intercomparison before
during the post-monsoon season. The seasonal CC values          being applied in the operational meteorological service do-
between CAMS and GNSS IPWV range from 0.73 to .99               main. Similarly, model-based data have limitations in cap-
except for Jaipur (0.16) and Bhubaneswar (0.29) during the      turing the localized features of convection due to sparseness
pre-monsoon season, Panjim (0.38) during the monsoon sea-       of or very few quality-controlled observational data sets over
son, Nagpur (0.50) during the post-monsoon season, and Di-      that region. Water vapor content present in the atmosphere,
brugarh (0.49) Jaipur (0.58) and Bhubaneswar (0.16) during      one of the most influential constituents of the atmosphere, is
the winter season. The root mean square error (RMSE) val-       responsible for determining the amount of precipitation that
ues are higher under the wet conditions (pre-monsoon and        a region can receive (Trenberth et al., 2003). The absorption
monsoon season) than under dry conditions (post-monsoon         of surface radiation depends on wavelength and water vapor
and winter season), and we found differences in magnitude       content. Each absorbing water vapor molecule emits radia-
and sign of bias for INSAT-3DR and CAMS with respect to         tion according to Planck’s law, mainly depending on its tem-
GNSS IPWV from station to station and season to season.         perature, and the extent of absorption differs depending on
   This study will help to improve understanding and utiliza-   the wavelength – the satellite sees different levels of atmo-
tion of CAMS and INSAT-3DR data more effectively along          sphere.
with GNSS data over land, coastal and desert locations in          The Global Ozone Monitoring Experiment (GOME) and
terms of the seasonal flow of IPWV, which is an essential       Scanning Imaging Absorption Spectrometer for Atmospheric
integrated variable in forecasting applications.                Chartography (SCIAMACHY) both used the principle of dif-
                                                                ferential optical absorption spectroscopy in the red spectral

Published by Copernicus Publications on behalf of the European Geosciences Union.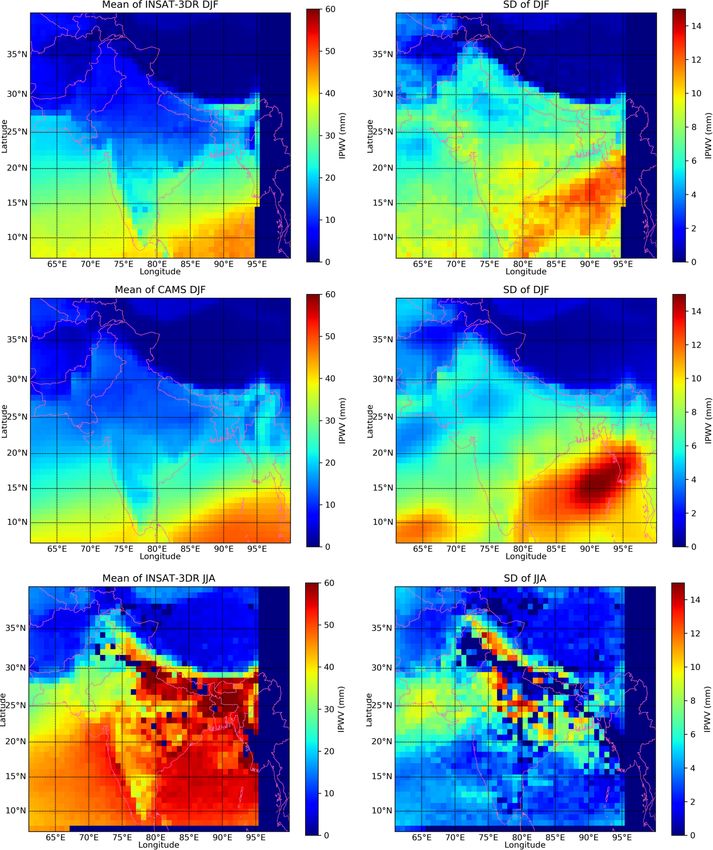
4858                          R. Yadav et al.: Intercomparison review of IPWV retrieved from INSAT-3DR sounder data

range of the IPWV retrieval (Beirle et al, 2018). The Atmo-        getting the precipitable water vapor. This will also support
spheric Infrared Sounder is a hyperspectral instrument which       the generation of an improved climatological mean espe-
collects radiances in 2378 IR channels with wavelength rang-       cially over the remote regions.
ing from 3.7 to 15.4 µm. Cloud-cleared radiances of AIRS              Geostationary satellites have higher temporal resolution
were utilized in the retrieval of column-integrated water va-      and continuous coverage and are important for monitor-
por, which is contributed by a number of channels having           ing the extreme weather events. Polar satellites have an
different sensitivity towards water vapor content present in       advantage due to higher spatial resolution and can oper-
the atmosphere (Aumann et al., 2003). The Moderate Resolu-         ate in both cloudy and non-cloudy conditions more effec-
tion Imaging Spectroradiometer (MODIS) infrared algorithm          tively as compared to geostationary satellites. Courcoux and
used employs ratios of water vapor absorbing channels at           Schroder (2013) worked out the accuracies of the Satellite
0.905, 0.936 and 0.940 µm with atmospheric window chan-            Application Facility on Climate Monitoring (CMSAF) satel-
nels at 0.865 and 1.24 µm estimating the precipitable water        lite Advanced Television and Infrared Observation Satellite
vapor (Kaufman and Gao, 1992).                                     Operational Vertical Sounder (ATOVS) precipitable water
   The uncertainties in the retrieval of precipitable water va-    vapor of about 2–4 mm with respect to radiosonde and At-
por from satellites (like errors of calibration of channels,       mospheric Infrared Sounder (AIRS) data both over land and
viewing geometry, radiative transfer in the forward models)        ocean with a resolution of 0.5◦ × 0.5◦ .
have already been addressed by previous studies (Ichoku et            Geostationary Earth orbit (GEO) satellites can pro-
al., 2005 for MODIS; Noël et al., 2008 for GOME-2 and              duce data more timely and frequently. The retrieved
SCIAMACHY; Susskind et al., 2003, 2006 for AIRS). Wag-             high-temporal-resolution integrated precipitable water va-
ner et al. (2006) studied GOME data for the period of 1996–        por (IPWV) from GEO satellite sensor data can be utilized
2002 and reported a globally and yearly averaged 2.8 ± 0.8 %       to monitor pre-convective environments and predict heavy
increase in total column precipitable water (excluding the         rainfall, convective storms and clouds that may cause seri-
ENSO period).                                                      ous damage to human life and infrastructure (Martinez et
   The retrievals from Modern-Era Retrospective Analysis           al., 2007; Liu et al., 2019; Lee et al., 2015). At present
for Research and Applications 2 (MERRA-2) reanalysis data          two advanced Indian geostationary meteorological satellites
sets (Gelaro et al., 2017) and the Climate Forecast Sys-           INSAT-3D (launched on 26 July 2013) and INSAT-3DR
tem Reanalysis (CFSR) (Saha, 2010) data archive at https:          (launched on 6 September 2016) with similar sensor char-
//rda.ucar.edu/pub/cfsr.html (last access: 15 May 2020) uti-       acteristics are orbiting over the Indian Ocean region and
lized 3D-Var data assimilation techniques and captured the         are placed at 82 and 74◦ E respectively. The INSAT-3D
interannual variations of precipitable water vapor well in the     and INSAT-3DR satellites are both equipped with the in-
south of central Asia (Jiang et al., 2019). The study carried      frared sounders with 19 channels, which are used to pro-
out by Berrisford et al. (2011) found that the ERA-Interim         vide meteorological parameters like the profiles of temper-
data set is superior in quality to that of ERA-40 during the       ature, humidity and ozone, atmospheric stability indices, at-
period 1989–2008.                                                  mospheric water vapor, etc. at 1 h (sector A) and 1.5 h (sec-
   Yadav et al. (2020) carried out the validation of Indian        tor B) intervals (Kishtawal, 2019). The temperature and hu-
GNSS IPWV with GPS sonde data for the period of June               midity (T -q profile) is used to retrieve thermodynamic in-
2017 to May 2018 over the Indian region and found rea-             dices, which are useful in analyzing the strength and severity
sonably good agreement with in situ observations. In situ          of severe weather events. Therefore, IPWV is one of the crit-
radiosonde observations generally suffer from spatiotempo-         ical variables used by forecasters when severe weather con-
ral inhomogeneity errors and differences in relative humidity      ditions are expected (Lee et al., 2016). The latest Copernicus
measured by different sensors. In this study this resulted in a    Atmosphere Monitoring Service (CAMS) global reanalysis
positive bias less than 4.0 mm for seven stations, a correlation   (EAC4) data set of atmospheric composition was built at ap-
coefficient greater than 0.85 and a RMSE less than 5.0 mm          proximately 80 km resolution with improved biases and con-
for all nine collocated GPS sonde stations. In this direction      sistent with time (Inness et al., 2019). The concept of GNSS
the work carried out by Turner et al. (2003) – a 5 % dry bias      meteorology was first introduced by Bevis et al. (1992, 1994)
with a microwave radiometer and Vaisala RS80-H – will be           and Businger et al. (1992), and IPWV data were estimated
very useful while dealing with such radiosonde observations.       from Global Navigation Satellite System (GNSS) observa-
Miloshevich et al. (2009) found a similar limitation of rela-      tions. In this study we have taken 19 Indian GNSS stations
tive humidity measurement with a Vaisala RS92 radiosonde           (10 inland, 8 coastal and 1 desert) or sites for study. Earlier
and derived an empirical correction to remove the mean bias        studies (Jade et al., 2005; Jade and Vijayan, 2008; Puviarasan
error, yielding bias uncertainty independent of height.            et al., 2014) of water vapor over the Indian subcontinent and
   The study carried out by Falaiye et al. (2018) is very im-      surrounding ocean have shown strong seasonal variations.
portant for considering the conventional data from long-term          The behavior of coastal regions are generally different
observing stations of the Indian domain along with the avail-      from inland and desert stations as coastal regions greatly in-
able model to establish the similar empirical relationship of      fluenced moisture advection from breezing of the seas, which

Atmos. Meas. Tech., 14, 4857–4877, 2021                                             https://doi.org/10.5194/amt-14-4857-2021
R. Yadav et al.: Intercomparison review of IPWV retrieved from INSAT-3DR sounder data                                       4859

is the cause of the continuous increment of IPWV even after       2.1   IMD IPWV observation network
the air temperature decreased (Ortiz de Galisteo et al., 2011).
   Perez-Ramirez et al. (2014) compared Aerosol Robotic           The ground-based GNSS IPWV estimated using high-
Network (AERONET) precipitable water vapor retrievals             temporal-sampling (15 min) data (January 2017–June 2018)
from Sun photometers with radiosondes, ground-based mi-           of the Indian GNSS network is processed at the satellite di-
crowave radiometry, and GPS and found a consistent dry bias       vision of the India Meteorological Department, Lodi Road,
approximately 5 %–6 % with total uncertainties of 12 %–           New Delhi. The data are processed daily by using the Trim-
15 % in the retrievals of precipitable water vapor from           ble Pivot Platform (TPP) software.
AERONET. The study of Perez-Ramirez et al. (2019) clearly            The data are used operationally and are archived on a daily,
highlighted the importance of the Maritime Aerosol Net-           weekly, monthly and seasonal basis for future utilization and
work (MAN) in retrieving the precipitable water vapor over        dissemination to the users and researchers as per the official
remote oceanic areas. The reanalysis model estimates have         norms. If we reduce the cutoff angle from 5◦ , a multipath
very good agreement with MAN, with mean differences of            effect will occur and introduce inaccuracy in the IPWV es-
∼ 5 % and standard deviation of ∼ 15 % under clear-sky con-       timation. An elevation angle of more than 5◦ is set for all
ditions. The work done in the past by Smirnov et al. (2004,       stations to avoid the satellite geometry change and multipath
2011) in retrieving the precipitable water vapor from aerosol     effects. This is an optimal setting as a higher cutoff angle
network data especially for marine areas is very helpful in       (> 5◦ ) may introduce dry bias in the IPWV estimation and a
carrying out further studies in the future with INSAT-3DR         notable 0.8 mm error in IPWV (Emardson et al., 1998). The
satellite observations over oceanic areas.                        other possible sources of error associated with GNSS data are
   The present study has two objectives: (1) intercompari-        the mean temperature of the atmosphere, dynamical pressure
son of CAMS and INSAT-3DR integrated precipitable wa-             and isotropic errors. These errors will vary with location and
ter retrievals with Indian GNSS stations by using GNSS as         time of observations.
reference and (2) performance in the retrievals CAMS and
INSAT-3DR sounder for both land and ocean regions. This           2.2   Integrated precipitable water vapor retrievals from
analysis will be very useful and increase knowledge of the              INSAT-3DR sounder data
satellite and reanalysis uncertainties and their improvements
from place to place and season to season. It will also fur-       The sounder payload of the INSAT-3DR satellite has the ca-
ther improve and help the forecasters use models as well as       pability to provide vertical profiles of temperature (40 lev-
INSAT-3DR data sets with confidence as these are available        els from surface to ∼ 70 km) and humidity (21 levels from
over wide spatial coverage as compared to the low density of      surface to ∼ 15 km) from the surface to the top of the atmo-
GNSS network data over Indian domains.                            sphere. The sounder has 18 narrow spectral channels in the
                                                                  shortwave infrared, middle infrared, and longwave infrared
                                                                  regions and one channel in the visible region. The ground
2   Methodology and data collection                               resolution at nadir is 10 × 10 km for all 19 channels. Spec-
                                                                  ifications of sounder channels are given in Table 1. Vertical
The measured integrated precipitable water vapor (IPWV)
                                                                  profiles of temperature and moisture can be derived from ra-
measurements from the India Meteorological Department
                                                                  diances in these 18 IR channels, using the first guess from nu-
(IMD) GNSS network with 15 min temporal resolution data
                                                                  merical weather prediction (NWP) model data. INSAT-3DR
are used for the comparison of INSAT-3DR geostationary
                                                                  sounder channel brightness temperature values are averaged
satellite IPWV products and CAMS reanalysis IPWV data.
                                                                  over a number of fields of view (FOVs) prior to the appli-
The INSAT-3DR data scans are each of 1 h intervals from
                                                                  cation of retrieval algorithm. Based on this, average vertical
January 2017 to June 2018. These measured and derived
                                                                  profiles are retrieved at 30 × 30 km (3 × 3 pixels) for each
IPWV products are arranged as a collocation of both tem-
                                                                  cloud-free pixel.
poral and spatial resolution. The spatial views of the ob-
                                                                     As INSAT-3DR IPWV is sensitive to the presence of
servational locations of GNSS and along with INSAT-3DR
                                                                  clouds in the field of view (limitation of infrared sounder sen-
IPWV annual mean values are shown in Fig. 2. The number
                                                                  sors), the IPWV values collected under clear-sky conditions
of observational points (N) of each GNSS, INSAT-3DR and
                                                                  were used in this study. The atmospheric profile retrieval al-
CAMS reanalysis of each station with its latitude and longi-
                                                                  gorithm for the INSAT-3DR sounder is a two-step approach.
tude are shown in Table 2. Here, winter season is considered
                                                                  The first step includes generation of accurate hybrid first-
to be in December, January and February; pre-monsoon sea-
                                                                  guess profiles using a combination of statistical-regression-
son is considered to be in March, April and May; monsoon
                                                                  retrieved profiles and model forecast profiles. The second
season season is considered to be in June, July and August;
                                                                  step is nonlinear physical retrieval to improve the resulting
and finally the post-monsoon season is considered to be in
                                                                  first-guess profile using the Newtonian iterative method. The
September, October and November.
                                                                  retrievals are performed using clear-sky radiances measured
                                                                  by the sounder within a 3 × 3 field of view (approximately

https://doi.org/10.5194/amt-14-4857-2021                                            Atmos. Meas. Tech., 14, 4857–4877, 2021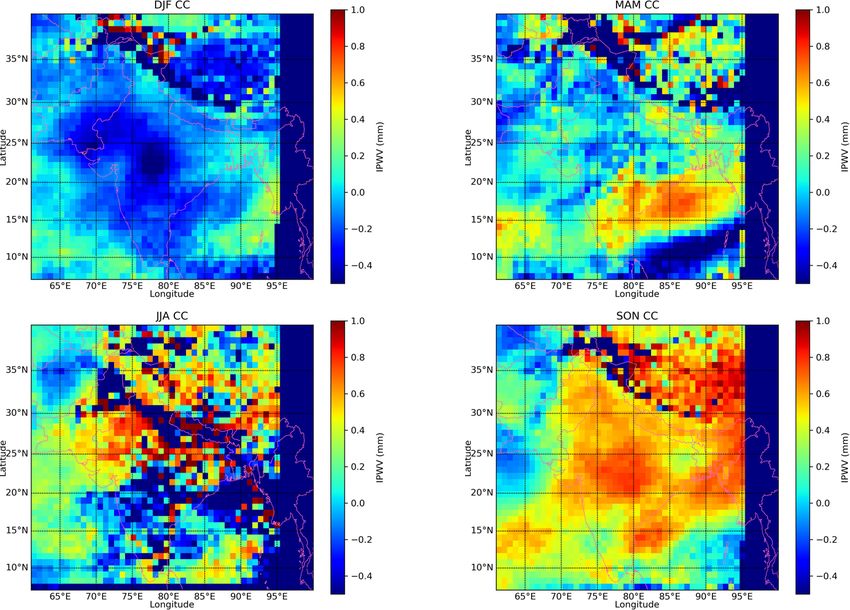
4860                            R. Yadav et al.: Intercomparison review of IPWV retrieved from INSAT-3DR sounder data

Table 1. INSAT-3DR sounder channel specifications.

                           INSAT-3DR sounder channel characteristics
                           Detector      Channel       Central     Principal       Purpose
                                             no.    wavelength     absorbing
                                                          (µm)     gas
                           Longwave             1         14.67    CO2             Stratosphere temperature
                                                2         14.32    CO2             Tropopause temperature
                                                3         14.04    CO2             Upper-level temperature
                                                4         13.64    CO2             Mid-level temperature
                                                5         13.32    CO2             Low-level temperature
                                                6         12.62    Water vapor     Total precipitable water
                                                7         11.99    Water vapor     Surface temperature, moisture
                           Midwave             8          11.04    Window          Surface temperature
                                               9           9.72    Ozone           Total ozone
                                              10           7.44    Water vapor     Low-level moisture
                                              11           7.03    Water vapor     Mid-level moisture
                                              12           6.53    Water vapor     Upper-level moisture
                           Shortwave          13           4.58    N2 O            Low-level temperature
                                              14           4.53    N2 O            Mid-level temperature
                                              15           4.46    CO2             Upper-level temperature
                                              16           4.13    CO2             Boundary-level temperature
                                              17           3.98    Window          Surface temperature
                                              18           3.76    Window          Surface temperature, moisture
                           Visible            19          0.695    Visible         Cloud

Table 2. List of GNSS stations (latitude, longitude, height) and location environment.

                     S. no.    Station                 Station    Longitude      Latitude     Ellipsoid   Environment
                                                       code                                  height (m)
                     1         Aurangabad              ARGD            75.39       19.87       528.13     Inland
                     2         Bhopal                  BHPL            77.42       23.24       476.22     Inland
                     3         Dibrugarh               DBGH            95.02       27.48        55.76     Inland
                     4         Delhi                   DELH            77.22       28.59       165.06     Inland
                     5         Jabalpur                JBPR            79.98       23.09       355.09     Inland
                     6         Jaipur                  JIPR            75.81       26.82       335.37     Inland
                     7         Jalpaiguri              JPGI            88.71       26.54        37.41     Inland
                     8         Pune                    PUNE            73.88       18.53       487.72     Inland
                     9         Raipur                  RIPR            81.66       21.21       245.56     Inland
                     10        Nagpur                  NGPR            79.06       21.09       253.57     Inland
                     11        Dwarka                  DWRK            68.95       22.24       −40.12     Coastal
                     12        Gopalpur                GOPR            84.87        19.3       −15.94     Coastal
                     13        Karaikal                KRKL            79.84       10.91       −79.07     Coastal
                     14        Kanyakumari             KYKM            77.54        8.08       −49.23     Coastal
                     15        Machilipatnam           MPTM            81.15       16.18       −61.07     Coastal
                     16        Panjim                  PNJM            73.82       15.49       −23.04     Coastal
                     17        Thiruvananthapuram      TRVM            76.95         8.5       −18.44     Coastal
                     18        Bhubaneswar             BWNR            85.82       20.25       −16.72     Coastal
                     19        Sri Ganganagar          SGGN            73.89       29.92       132.17     Desert

Atmos. Meas. Tech., 14, 4857–4877, 2021                                                      https://doi.org/10.5194/amt-14-4857-2021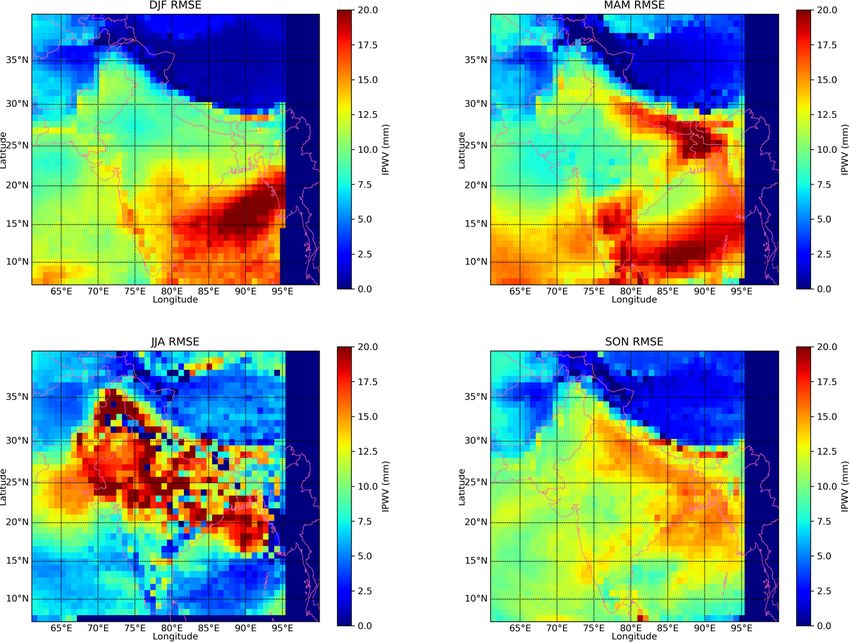
R. Yadav et al.: Intercomparison review of IPWV retrieved from INSAT-3DR sounder data 4861
30 × 30 km resolution) over land for both day and night (sim-
ilar to INSAT-3D ATBD, 2015). Four sets of regression coef-
ficients are generated – two sets for land and ocean daytime
conditions and the other two sets for land and ocean night-
time conditions – using a training data set comprising histor-
ical radiosonde observations representing atmospheric con-
ditions over the INSAT-3DR observation region. Integrated
precipitable water vapor in millimeters (mm) can be given as
Zp2
q
PWV = dp, (1)
gρw
p1
where g is the acceleration of gravity, p1 is the surface pres-
sure and p2 is the top-of-atmosphere pressure (i.e., about
100 hPa, beyond which water vapor amount is assumed to be
negligible). The unit of precipitable water is millimeter (mm)
depth of an equal amount of liquid water above a surface of
1 m2 . IMD computes IPWV from a 19-channel sounder of
INSAT-3DR in three layers, i.e., 1000–900, 900–700, and
700–300 hPa, and total precipitable water vapor (PWV) in
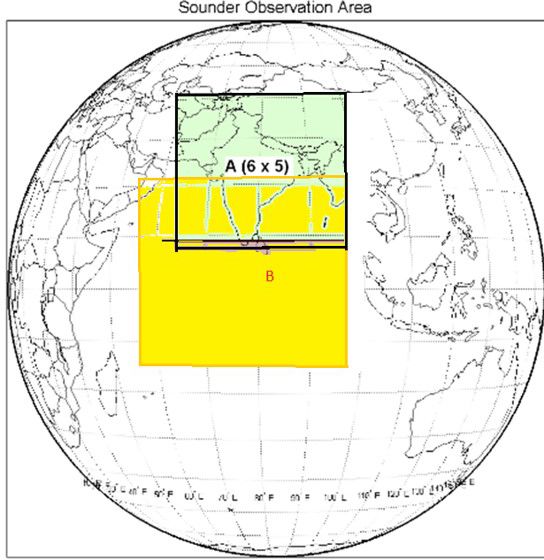
the vertical column of atmosphere stretching from the surface Figure 1. Scan strategy and area of coverage of INSAT-3DR
to about 100 hPa during cloud-free conditions. Monsoon, se- sounder payload.
vere weather and cloudy conditions limit the sounder profile
(Venkat Ratnam et al., 2016). The GNSS- and INSAT-3DR-
retrieved IPWV values are matched every hour.
2.3 Scan strategy of INSAT-3DR sounder
The sounder measures radiance in 18 infrared (IR) channels
and 1 visible channel simultaneously over an area of area
of 10 km × 10 km at nadir every 100 ms. Using a two-axis
gimballed scan mirror, this footprint can be positioned any-
where in the field of regard (FOR): 24◦ (E–W) × 19◦ (N–
S). To sound the entire globe area of 6400 km × 6400 km in
size, it takes almost 3 h. A scan program mode allows se-
quential sounding of a selected area with periodic space and
calibration looks. In this mode, a “frame” consisting of mul-
tiple “blocks” of the size 640 km × 640 km can be sounded.
The selected frame can be placed anywhere within 24◦ (E–
W) × 19◦ (N–S) (similar to INSAT-3D ATBD, 2015). An op-
timized scan strategy of sounder payload was worked out de-
pending on the operational requirements of users and stake-
Figure 2. The annual mean of IPWV over India retrieved from
holders for both land (sector A) and oceanic (sector B) re-
INSAT-3DR during the year of 2018. The geographical distribution
gions with hourly and 1.5-hourly data coverage respectively of 19 GNSS stations (filled red color circles).
(Fig. 1). The full-aperture internal black-body calibration is
performed every 30 min or on command whenever required.
The sounder payload has a provision to be carried out dur-
ing onboard IR calibration, in which the scan mirror pointed for each scan. This enables the derivation of vertical profiles
towards space to measure the radiances and then pointed to of temperature and humidity more accurately. These vertical
the internal black body present on the payload to measure profiles can then be used to derive various atmospheric sta-
its radiances. There is also a provision to measure the tem- bility indices and other parameters such as atmospheric water
perature of the internal black body. All these data sets are vapor content and total column ozone amount. The products
transmitted along with video data of the payload. During the derived over sector-A data are used for weather forecasting
processing on the ground, the data collected during onboard on an operational basis, and products derived over sector B
calibration are used to generate the calibration lookup table are used for assimilation in the NWP model.
https://doi.org/10.5194/amt-14-4857-2021 Atmos. Meas. Tech., 14, 4857–4877, 2021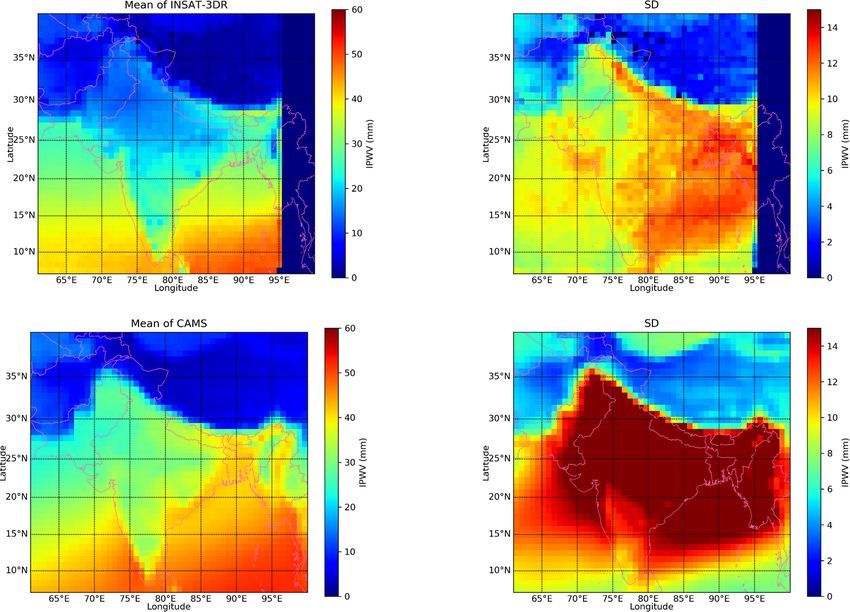
4862 R. Yadav et al.: Intercomparison review of IPWV retrieved from INSAT-3DR sounder data
2.4 Copernicus Atmosphere Monitoring Service The mean bias (MB) is computed as follows:
(CAMS) reanalysis data
N
1X
The CAMS reanalysis was produced using 4D-Var data as- MB = (Oi − Mi ) . (2)
n i=1
similation in the European Centre for Medium-Range
Weather Forecasts (ECMWF) Integrated Forecasting System The root mean square error (RMSE) is computed as follows:
(IFS), with 60 hybrid sigma/pressure (model) levels in
v
the vertical and with the top level at 0.1 hPa (https://ads. u
u1 X N
atmosphere.copernicus.eu/cdsapp#!/search?type=dataset, RMSE = t (Oi − Mi )2 . (3)
last access: 28 May 2020). Atmospheric data are avail- N i=1
able on these levels, and they are also interpolated to
25 pressure levels, 10 potential temperature levels and 1 The correlation coefficient (CC) is computed as follows:
potential vorticity level (Inness et al., 2019). This new
N
N N
reanalysis data set has a horizontal resolution of about 80 km P P P
N Mi Oi − Mi Oi
(0.75◦ × 0.75◦ ) and smaller biases for reactive gases and i=1 i=1 i=1
CC = v" .
aerosols, which are improved and more consistent with time u
N
N 2 # " N N 2 #
u
as compared to earlier versions. The INSAT-3DR data set Mi2 − Oi2 −
t N P P P P
Mi N Oi
has a horizontal resolution of 30 × 30 km (3 × 3 pixels) i=1 i=1 i=1 i=1
for each cloud-free pixel. The collocation matchup was (4)
created at 0.75◦ × 0.75◦ (about 80 km) spatial resolution for
comparison and performance analysis of INSAT-3DR data The standard deviation (SD) is computed as follows:
with CAMS reanalysis data using the bilinear interpolation v
technique. Temporal domains are selected at 00:00, 03:00, u N
N
u P 2 P 2
u N i=1 Mi − M N Oi − O
06:00, 09:00, 12:00, 15:00, 18:00 and 21:00 UTC time u
i=1
intervals for the Indian GNSS along with INSAT-3DR at SD = uu . (5)
N
03:00, 09:00, 15:00 and 21:00 UTC for the performance t
analysis. The CAMS reanalysis IPWV retrievals are in-
terpolated to different geographical locations of 19 GNSS
observations. We have used nearest-neighbor interpolation 2.6 INSAT-3DR and GNSS retrievals matchup criteria
techniques to interpolate CAMS reanalysis with GNSS data.
The assessment of accuracy of INSAT-3DR satellite-
In this method we evaluate each station to determine the
retrieved IPWV with 19 GNSS stations in different geo-
number of neighboring grid cells in a 0.75◦ × 0.75◦ box
graphical locations which are located in coastal, inland and
that surrounds the GNSS station and contains at least one
desert regions over the Indian subcontinent and are shown
valid CAMS reanalysis data set. CAMS data are capable of
in Table 2. The GNSS IPWV data sampled every 15 min
capturing large-scale features of moisture flow which help
to maintain consistency with INSAT-3DR retrievals that are
the forecasters in predicting large-scale weather systems
available every 1 h interval of time over the Indian region
such as western disturbances, cyclonic storms, monitoring
for the period 1 January 2017 to 30 June 2018 were utilized.
of monsoon and other associated weather events affecting
Matchup data sets were prepared for INSAT-3DR and GNSS
the Indian domain throughout the year.
IPWV as per the following criteria.
2.5 Analysis of statistical skill scores 1. To reduce the local horizontal gradient arising in IPWV,
the absolute distance between the position of the GNSS
The collocated comparison statistics with the matchup data
station locations is set within the 0.25◦ latitude and lon-
set are used to evaluate the statistical performance of re-
gitude of the INSAT-3DR retrievals in the region sur-
trievals of INSAT-3DR and CAMS with respect to GNSS
rounding the stations.
IPWV over the Indian region.
The statistical metrics used for quantitative evaluation are 2. The temporal resolution selected of INSAT-3DR and 19
the linear correlation coefficient (CC), standard deviation GNSS observations is within a 30 min time interval de-
(SD), bias and root mean square error (RMSE). The com- pending on retrievals and the location of the GNSS sta-
putations of the abovementioned statistical metrics are given tions.
below.
Let Oi represents the ith observed value of INSAT-3DR or 3. The INSAT-3DR IPWV retrievals are interpolated to
CAMS reanalysis data and Mi represent the ith GNSS IPWV different geographical locations of 19 GNSS observa-
value for a total of n observations. tions.
Atmos. Meas. Tech., 14, 4857–4877, 2021 https://doi.org/10.5194/amt-14-4857-2021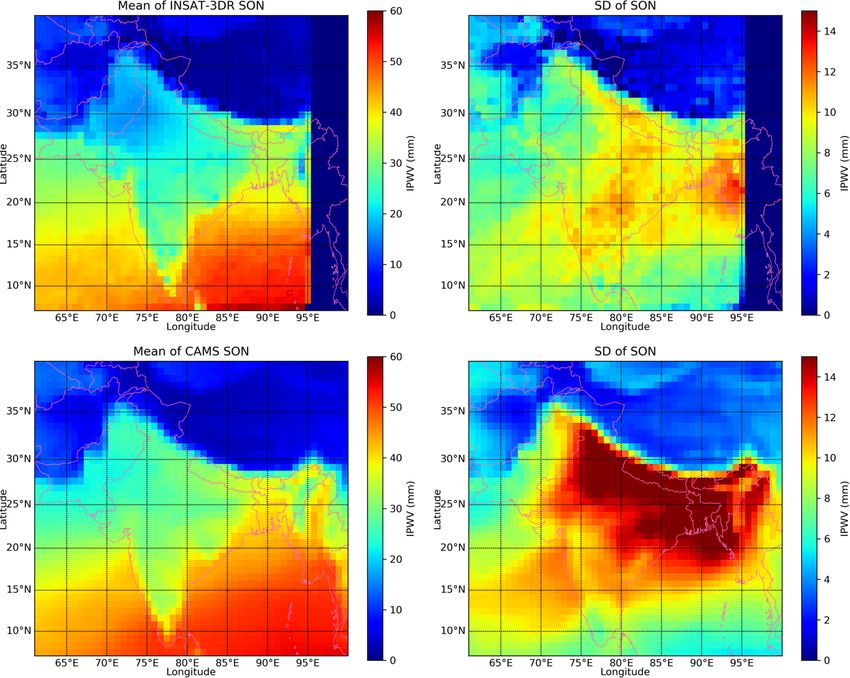
R. Yadav et al.: Intercomparison review of IPWV retrieved from INSAT-3DR sounder data                                        4863

                                                                    Table 3. Statistical analysis of IPWV retrievals from INSAT-3DR
                                                                    and GNSS data (January 2017 and June 2018).

                                                                            S.    Station      N     MB      RMSE        R
                                                                            no.                     (mm)      (mm)
                                                                            1     ARGD      2318    −0.99      4.83   0.85
                                                                            2     BHPL       791     3.48      5.88   0.93
                                                                            3     DBGH       688    −3.02     12.38   0.72
                                                                            4     DELH      1880    −1.58      4.53   0.89
                                                                            5     NGPR      2032    −0.10      4.32   0.89
                                                                            6     JBPR       952     1.96      4.39   0.93
                                                                            7     JIPR      1576     0.46      4.26   0.88
                                                                            8     JPGI      1551     2.25      8.10   0.75
                                                                            9     PUNE       567     0.69      6.18   0.83
                                                                            10    RIPR      1849     0.71      4.01   0.84
                                                                            11    BWNR      1443     1.51      5.61   0.88
                                                                            12    DWRK      2628     2.93      7.10   0.85
                                                                            13    GOPR      1850     0.76      7.59   0.82
                                                                            14    KRKL      1128     0.52      6.59   0.88
                                                                            15    KYKM      1574     1.91      7.21   0.80
Figure 3. Taylor diagram of INSAT-3DR vs. Indian GNSS re-                   16    MPTM      1747     3.12      7.29   0.81
trievals.                                                                   17    TRVM       905     0.01      7.56   0.76
                                                                            18    PNJM      1396    −2.93      9.28   0.67
                                                                            19    SGGN      1040    −1.41      4.42   0.88
3     Results and discussion

3.1    Intercomparison of INSAT-3DR and Indian GNSS
       IPWV                                                         IPWV retrieved from the INSAT-3DR satellite with respect
                                                                    to GNSS IPWV have negative biases with the range from
From Fig. 3, the Taylor diagram is used to evaluate the skill       −6.7 to −0.39 mm, which indicates an underestimation of
characteristics of the annual distribution of IPWV retrieved        IPWV at the stations ARGD, DBGH, DELH, NGPR, JIPR,
from the INSAT-3DR satellite with 19 GNSS IPWV stations             JPGI, RIPR, GOPR, PNJM, TRVM and SGGN. The stations
at different geographical locations (Fig. 2) over the Indian        JBPR, PUNE, KRKL, KYKM, MPTM, DWRK and BWNR
subcontinent during the period of 1 January 2017 to 30 June         have the positive bias range from 0.03 to 2.54 mm, which
2018. Further, the tailor diagram displays three statistical        indicates an overestimation of IPWV by INSAT-3DR dur-
skill metrics: distribution of the correlation coefficient, root    ing the pre-monsoon season. RMSE ranges between 3.5 and
mean square error (RMSE) and standard deviation (SD). If an         10 mm (Table 4).
IPWV performs nearly perfectly, its position in the diagram            The correlation coefficient of IPWV varies from 0.60 to
is expected to be very close to the observed point (Fig. 3). An     0.90 for all the stations during the monsoon season except
attempt was made to evaluate the IPWV retrieved from the            TRVM (0.1), KYKM (0.31) and KRKL (0.15). The stations
INSAT-3DR satellite, with GNSS observations showing that            ARGD, DBGH, DELH, JBPR, JIPR, JPGI, PUNE, KRKL,
the root mean square error (RMSE) of 8 inland stations out of       KYKM, GOPR, BWNR, PNJM, TRVM and SGGN have the
10 stations lies between 4 and 6 mm, but it lies between 8 and      negative bias range from −0.39 to −12.39 mm, which indi-
12 mm for Jalpaiguri (JPGI) and Dibrugarh (DBGH) stations.          cates the underestimation of IPWV by INSAT-3DR as com-
The observation points in the case of Dibrugarh (DBGH) are          pared to MPTM, NGPR and BHPL, which have the positive
more symmetrical than Jalpaiguri (JPGI) even RMSE val-              bias range from 0.39 to 2.47 mm during the monsoon season.
ues are higher (Fig. 4). The values of the correlation coeffi-      RMSE range from 4.23 to 14.71 mm (Table 4).
cient (CC) and bias for inland stations lie in the range from          The correlation coefficient of IPWV varies from 0.60
0.72 to 0.93 and from −3.0 to +3.0 mm respectively. Simi-           to 0.98 for all the stations during the post-monsoon sea-
larly, for all the coastal stations the values of CC and bias lie   son except TRVM (0.42), PNJM (0.2), MPTM (0.48),
in the range from 0.67 to 0.88 and from −3.0 to +3.0 mm             KYKM (0.50) and DBGH (−0.28). The stations DELH,
respectively. RMSE values for seven coastal stations out of         KRKL, MPTM, PNJM, TRVM and SGGN have the nega-
eight stations lie between 5 and 7 mm, but it is 9 mm of Pan-       tive bias range from −0.32 to −6.10 mm, except for DBGH
jim. The values of CC, bias and RMSE for the desert station         (−22.52 mm), which indicates the underestimation of IPWV
(SGGN) are 0.88, −1.4 and 4.42 mm respectively (Table 3).           by INSAT-3DR as compared to ARGD, BHPL, NGPR,
   The correlation coefficient of IPWV varies from 0.60             JBPR, JIPR, JPGI, PUNE, RIPR, KYKM, GOPR, DWRK
to 0.89 for all the stations for the pre-monsoon season.            and BWNR, which have the positive bias range from 0.88

https://doi.org/10.5194/amt-14-4857-2021                                             Atmos. Meas. Tech., 14, 4857–4877, 2021
4864                           R. Yadav et al.: Intercomparison review of IPWV retrieved from INSAT-3DR sounder data

Figure 4. Scatter plot of hourly INSAT-3DR IPWV vs. GNSS IPWV using hexagonal binning.

to 9.43 mm during the post-monsoon season. RMSE ranges              pographically diverse terrains around these stations. Similar
from 3.94 to 13.49 mm except for PNJM (18.73 mm) and                behavior is also seen in annual analysis of IPWV in coastal
DBGH (27.74 mm) (Table 4).                                          stations with the abovementioned reasons.
   The correlation coefficient of IPWV varies from 0.64 to             It is seen that discrepancies arise because the wet mapping
0.95 for all the stations during the winter season except           functions that are used to map the wet delay at any angle to
DBGH (0.48) and JPGI (0.50). The stations BHPL, DBGH                the zenith do not represent the localized atmospheric con-
NGPR, JBPR, JIPR, JPGI, PUNE, RIPR, KRKL, KYKM,                     dition particularly for narrow towering thunder clouds and
MPTM, GOPR, DWRK, PNJM, TRVM, BWNR and SGGN                         because of the non-availability of GPS satellites in the zenith
have the positive bias range from 0.61 to 5.90 mm, which in-        direction (Puviarasan et al., 2020).
dicates the overestimation of IPWV by INSAT-3DR as com-                Large or small bias between IPWV retrieved from INSAT-
pared to ARGD (−0.84 mm) and DELH (−1.51 mm) during                 3DR and GNSS exists due to limitations of the INSAT-
the winter season. RMSE ranges from 2.99 to 8.53 mm (Ta-            3DR retrievals and calibration uncertainties in the radi-
ble 4).                                                             ance measured by INSAT-3DR. Another possibility of op-
   Scatter plot of hourly INSAT-3DR IPWV and GNSS                   eration differences in IPWV measurements was adopted
IPWV plotted in Fig. 4 using hexagonal binning. The num-            in GNSS/INSAT-3DR with respect to mapping func-
ber of occurrences in each bin is color coded (not on a linear      tion/weighting function contributions.
scale). It is now possible to see where most of the data lie, and      The results indicate that the RMSE values increase signif-
a better indication of the relationship between GNSS IPWV           icantly under the wet conditions (pre-monsoon and monsoon
and INSAT-3DR IPWV is revealed.                                     season) compared to under dry conditions (post-monsoon
   Stations TRVM, KYKM, KRKL, PNJM, MPTM, JPGI                      and winter season) (Table 4). The study showed differences
and DBGH are poorly correlated (INSAT-3DR vs. GNSS),                in the magnitude and sign of bias of INSAT-3DR with re-
and averaging of INSAT-3DR pixels in gridded data con-              spect to GNSS IPWV from station to station and season to
tains both sea and mountainous land together along with to-         season. The data quality of INSAT-3DR IPWV may be im-

Atmos. Meas. Tech., 14, 4857–4877, 2021                                              https://doi.org/10.5194/amt-14-4857-2021
R. Yadav et al.: Intercomparison review of IPWV retrieved from INSAT-3DR sounder data                                         4865

Table 4. Statistical seasonal analysis of retrievals of IPWV from   Table 4. Continued.
INSAT-3DR and GNSS data. NaN indicates no availability of ob-
servational data.                                                     Station   Season                 N     MB     RMSE      R
                                                                                                            (mm)     (mm)
 Station   Season                 N       MB    RMSE        R         GOPR      Pre-monsoon (MAM)     837   −1.22    7.11   0.70
                                         (mm)    (mm)                           Monsoon (JJA)          29   −2.25    4.23   0.88
 ARGD      Pre-monsoon (MAM)    1129    −2.10     4.14    0.86                  Post-monsoon (SON)    253    1.55   11.41   0.69
           Monsoon (JJA)          73    −0.53     5.50    0.49                  Winter (DJF)          731    2.87    6.48   0.72
           Post-monsoon (SON)    271     3.02     6.23    0.90        DWRK      Pre-monsoon (MAM)    1119    1.42    7.12   0.62
           Winter (DJF)          845    −0.84     5.10    0.67                  Monsoon (JJA)         377   −0.93    5.47   0.78
 BHPL      Pre-monsoon (MAM)      69    −0.49     3.81    0.77                  Post-monsoon (SON)    362    6.09    8.37   0.87
           Monsoon (JJA)          78     2.10     7.73    0.64                  Winter (DJF)          770    5.54    7.12   0.82
           Post-monsoon (SON)    339     5.23     6.96    0.93        PNJM      Pre-monsoon (MAM)     878   −4.75   10.27   0.60
           Winter (DJF)          305     2.78     4.16    0.95
                                                                                Monsoon (JJA)          46   −0.39    5.76   0.60
 DBGH      Pre-monsoon (MAM)     214    −1.96     6.69    0.72                  Post-monsoon (SON)     39   −6.10   18.73   0.20
           Monsoon (JJA)          83   −12.39    14.71    0.64                  Winter (DJF)          433    0.79    5.35   0.64
           Post-monsoon (SON)     79   −22.52    27.74   −0.28
                                                                      TRVM      Pre-monsoon (MAM)     360   −1.85    6.98   0.75
           Winter (DJF)          312     3.68     7.39    0.48
                                                                                Monsoon (JJA)          53   −7.05   11.36   0.10
 DELH      Pre-monsoon (MAM)     793    −1.44     3.98    0.85                  Post-monsoon (SON)    113   −0.32   10.56   0.42
           Monsoon (JJA)          84    −5.79     7.90    0.92                  Winter (DJF)          379    2.87    6.25   0.82
           Post-monsoon (SON)    230    −0.76     5.13    0.92
                                                                      BWNR      Pre-monsoon (MAM)     441    0.39    5.71   0.80
           Winter (DJF)          773    −1.51     4.36    0.79
                                                                                Monsoon (JJA)          12   −5.22    7.37   0.89
 NGPR      Pre-monsoon (MAM)     772    −1.42     4.06    0.85                  Post-monsoon (SON)     92    3.56    8.36   0.79
           Monsoon (JJA)          25     0.39     5.41    0.57                  Winter (DJF)          898    1.94    5.16   0.82
           Post-monsoon (SON)    254     1.08     5.86    0.90
                                                                      SGGN      Pre-monsoon (MAM)     179   −1.23    3.81   0.79
           Winter (DJF)          981     0.61     4.00    0.83
                                                                                Monsoon (JJA)          33   −3.96    5.49   0.91
 JBPR      Pre-monsoon (MAM)     438     1.51     4.79    0.84                  Post-monsoon (SON)    432   −3.24    5.52   0.87
           Monsoon (JJA)          11    −4.05     4.43    0.92                  Winter (DJF)          396    0.72    2.99   0.91
           Post-monsoon (SON)     50     1.89     3.94    0.98
           Winter (DJF)          453     2.54     4.02    0.94
 JIPR      Pre-monsoon (MAM)     505    −0.44     3.86    0.83
           Monsoon (JJA)          70    −3.84     5.89    0.92
                                                                    proved due to proper bias correction coefficient application
           Post-monsoon (SON)    383     1.34     4.48    0.89
           Winter (DJF)          618     1.13     4.21    0.71      before physical retrievals of IPWV during clear-sky pixels.
 JPGI      Pre-monsoon (MAM)     527    −1.59     6.88    0.79
           Monsoon (JJA)          67    −6.69     9.25    0.75      3.2   Intercomparison of CAMS reanalysis and Indian
           Post-monsoon (SON)    161     9.43    10.91    0.65            GNSS IPWV
           Winter (DJF)          796     4.09     8.07    0.50
 PUNE      Pre-monsoon (MAM)     333     0.03     6.65    0.72
                                                                    From Fig. 5, the Taylor diagram evaluates the skill character-
           Monsoon (JJA)          63    −3.10     5.09    0.67
           Post-monsoon (SON)    170     3.35     5.54    0.79      istics in terms of RMSE, correlation coefficient and standard
           Winter (DJF)            1     5.90     5.90    NaN       deviation of the annual distribution of IPWV retrieved from
 RIPR      Pre-monsoon (MAM)     864    −0.39     3.94    0.84      CAMS with 19 GNSS IPWV stations at different geographi-
           Monsoon (JJA)           0     NaN      NaN     NaN       cal locations (Fig. 5) over the Indian subcontinent during the
           Post-monsoon (SON)     68     4.83     6.09    0.75      period of 1 January 2018 to 31 December 2018. The root
           Winter (DJF)          917     1.45     3.88    0.77
                                                                    mean square error (RMSE) between CAMS reanalysis and
 KRKL      Pre-monsoon (MAM)     739     0.03     5.29    0.89      GNSS data retrievals of 9 inland stations out of 10 stations
           Monsoon (JJA)         105    −0.58     8.54    0.15      lies between 3 and 7 mm, except for Nagpur (NGPR) station
           Post-monsoon (SON)     31    −1.88     8.54    0.59
           Winter (DJF)          253     2.68     8.53    0.63      where it is 9 mm. The values of the correlation coefficient
                                                                    (CC) and bias for inland stations lie in the range from 0.88
 KYKM      Pre-monsoon (MAM)     686     0.31     5.84    0.79
           Monsoon (JJA)         110    −1.73     9.53    0.31      to 0.99 and from −3.0 to +3.0 mm, except Pune, which is
           Post-monsoon (SON)    155     0.88    11.21    0.50      −6.69 mm (Table 5).
           Winter (DJF)          623     4.56     6.83    0.88         The root mean square error (RMSE) for seven coastal sta-
 MPTM      Pre-monsoon (MAM)     767     2.17     5.54    0.81      tions out of eight stations lies between 3 and 7 mm, except
           Monsoon (JJA)          40     2.47     5.22    0.77      for Bhubaneswar (BWNR) where it is 14.0 mm. The values
           Post-monsoon (SON)    172    −0.43    13.49    0.48      of CC and bias lie in the range from 0.78 to 0.98, except for
           Winter (DJF)          768     4.89     6.94    0.73
                                                                    BWNR, which is 0.48, and from −2.0 to +2.0 mm, except
                                                                    for BWNR, which is +7.5 mm. The values of CC and bias
                                                                    for the desert station (SGGN) are 0.88 and −1.4 mm respec-

https://doi.org/10.5194/amt-14-4857-2021                                                 Atmos. Meas. Tech., 14, 4857–4877, 2021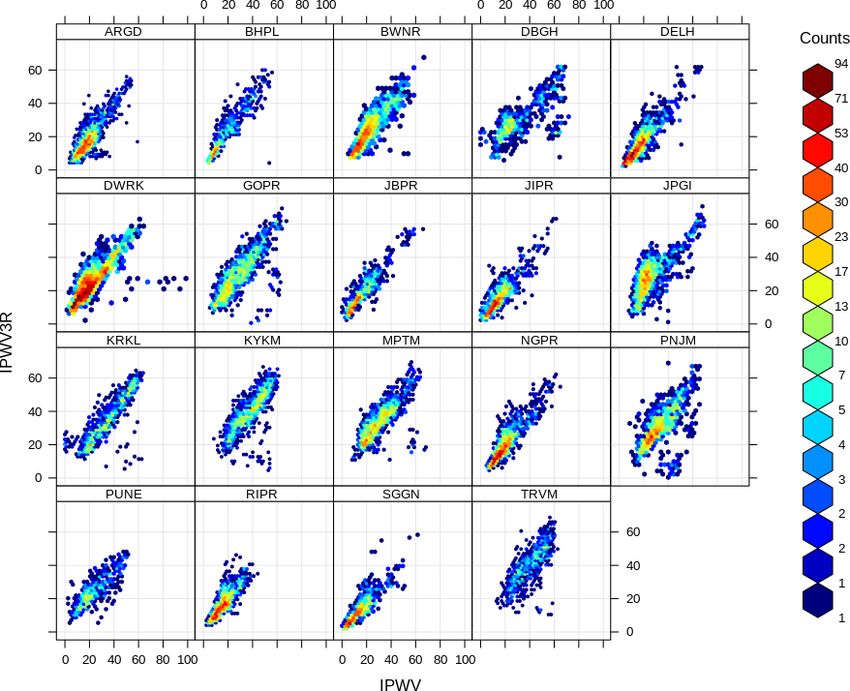
4866                           R. Yadav et al.: Intercomparison review of IPWV retrieved from INSAT-3DR sounder data

                                                                 PUNE, RIPR, KRKL, MPTM, DWRK, GOPR, TRVM and
                                                                 SGGN. The stations DBGH, JBPR, JIPR, JPGI, KYKM,
                                                                 PNJM and BWNR have the positive bias range from 0.61
                                                                 to 13.88 mm, which indicates an overestimation of IPWV by
                                                                 CAMS during the pre-monsoon season. RMSE ranges be-
                                                                 tween 2.27 and 8.28 mm except for BWNR (16.50 mm) (Ta-
                                                                 ble 6).
                                                                    The correlation coefficient of IPWV varies from 0.73 to
                                                                 0.96 for all the stations during the monsoon season ex-
                                                                 cept PNJM (0.38). The stations ARJD, JPGI, PUNE, RIPR,
                                                                 TRVM and SGGN have the negative bias range from −0.51
                                                                 to −7.28 mm, which indicates the underestimation of IPWV
                                                                 by CAMS reanalysis as compared to DBGH, DELH, NGPR,
                                                                 JBPR, JIPR, KRKL, KYKM, MPTM, DWRK, GOPR and
                                                                 PNJM, which have the positive bias range from 0.03 to
                                                                 6.60 mm during the monsoon season. RMSE ranges from
                                                                 2.30 to 11.41 mm. Data are not available at the stations of
                                                                 BHPL and BWNR (Table 6).
                                                                    The correlation coefficient of IPWV varies from 0.86 to
Figure 5. Taylor diagram of CAMS vs. Indian GNSS retrievals.     0.99 for all the stations during the post-monsoon season
                                                                 except NGPR (0.50). The stations ARJD, DELH, JBPR,
Table 5. Statistical analysis of IPWV retrievals from CAMS and   JIPR, JPGI, PUNE, RIPR, KRKL, MPTM, DWRK, TRVM
GNSS data (January to December 2018). NaN indicates no avail-    and SGGN have the negative bias range from −0.47 to
ability of observational data.                                   −6.32 mm, which indicates the underestimation of IPWV by
                                                                 CAMS reanalysis as compared to DBGH, NGPR, KYKM,
       S.     Station      N      MB     RMSE        R           GOPR and PNJM, which have the positive bias range from
       no.                       (mm)     (mm)                   0.01 to 7.23 mm during the post-monsoon season. RMSE
       1      ARGD      1624    −2.72      3.69   0.97           ranges from 3.35 to 8.05 mm except for NGPR (16.06 mm)
       2      BHPL         0     NaN       NaN    NaN            (Table 6). During this transition time most parts of the In-
       3      DBGH      1002     2.91       6.7   0.95           dian region remain gradually dry and decrease in water con-
       4      DELH      2345    −1.27      3.09   0.99           tent as compared to the northeast and southern parts of In-
       5      NGPR      1325     1.99      9.17   0.88           dia. It was observed in this analysis during the post-monsoon
       6      RIPR      1727    −1.94      3.48   0.98           season that for stations located in dry/wet regions of India
       7      JBPR      1483    −1.11      3.25   0.99           the CAMS data under-/overestimate IPWV with respect to
       8      PUNE      1165    −6.69      7.62   0.96
                                                                 GNSS.
       9      JIPR      1483     0.75      7.19   0.92
                                                                    The correlation coefficient of IPWV varies from 0.87 to
       10     JPGI      2168    −0.68      3.83   0.98
       11     BWNR      1240      7.5     13.59   0.48           0.97 for all the stations during the winter season except
       12     KRKL      1949     −0.9      3.74   0.96           DBGH (0.49), JIPR (0.58) and BWNR (0.16). The stations
       13     KYKM      2145     0.47      3.33   0.96           ARJD, DBGH, DELH, NGPR, JBPR, JIPR, JPGI, PUNE,
       14     MPTM      1929     −1.3      3.69   0.97           RIPR, KRKL, KYKM, MPTM, DWRK, GOPR, TRVM
       15     PNJM       750     2.27      7.25   0.78           and SGGN have the negative bias range from −0.03 to
       16     GOPR      1625    −0.41      3.76   0.98           −4.10 mm, which indicates the underestimation of IPWV by
       17     DWRK      2094    −0.87      3.12   0.98           CAMS reanalysis as compared to BWNR, which has a posi-
       18     TRVM      2073    −1.91      4.33   0.93           tive bias of 0.60 mm during the winter season. RMSE ranges
       19     SGGN      2274    −1.74      3.37   0.98           from 1.74 to 9.48 mm (Table 6).
                                                                    During the winter season over the Indian region, local ef-
                                                                 fects which play an important role moisture development are
tively. The desert station RMSE, CC and bias are 3.37 mm,        suppressed from their importance due to sparse observation
0.98 and −1.74 mm respectively (Table 5).                        network data and optimization of random and systematic er-
   The correlation coefficient of IPWV varies from 0.74 to       rors, which are further utilized for effective improvement in
0.97 for all the stations except JIPR (0.16) and BWNR (0.29)     model predictions (Inness et al., 2019).
for the pre-monsoon season. IPWV retrieved from CAMS re-            CAMS data used in this study have consistent and homo-
analysis with respect to GNSS IPWV has the negative bias         geneous spatial resolution with reduced bias, with better per-
range from −7.28 to −0.28 mm, which indicates an underes-        formance of model physics and dynamics due to assimila-
timation of IPWV at the stations of ARGD, DELH, NGPR,            tion of new data sets (Inness et al., 2019). However, over In-

Atmos. Meas. Tech., 14, 4857–4877, 2021                                           https://doi.org/10.5194/amt-14-4857-2021
R. Yadav et al.: Intercomparison review of IPWV retrieved from INSAT-3DR sounder data 4867
Table 6. Statistical seasonal analysis of retrievals of IPWV from Table 6. Continued.
CAMS and GNSS data. NaN indicates no availability of observa-
tional data. Station Season N MB RMSE R
(mm) (mm)
Station Season N MB RMSE R
MPTM Pre-monsoon (MAM) 632 −0.28 3.26 0.94
(mm) (mm)
Monsoon (JJA) 223 0.96 3.31 0.8
ARGD Pre-monsoon (MAM) 673 −2.09 3.25 0.93 Post-monsoon (SON) 655 −2.26 4.27 0.96
Monsoon (JJA) 97 −3.02 5.32 0.75 Winter (DJF) 419 −2.55 3.52 0.96
Post-monsoon (SON) 248 −3.42 4.24 0.97
DWRK Pre-monsoon (MAM) 597 −1.02 2.53 0.91
Winter (DJF) 606 −3.09 3.6 0.96
Monsoon (JJA) 218 1.42 3.4 0.96
BHPL Pre-monsoon (MAM) 0 NaN NaN NaN Post-monsoon (SON) 614 −0.92 3.8 0.95
Monsoon (JJA) 0 NaN NaN NaN Winter (DJF) 665 −1.43 2.77 0.91
Post-monsoon (SON) 0 NaN NaN NaN
GOPR Pre-monsoon (MAM) 656 −1.4 4.46 0.89
Winter (DJF) 0 NaN NaN NaN
Monsoon (JJA) 231 2.1 3.65 0.8
DBGH Pre-monsoon (MAM) 261 5.98 7.48 0.92 Post-monsoon (SON) 318 1.42 3.35 0.96
Monsoon (JJA) 169 6.6 7.43 0.84 Winter (DJF) 420 −1.64 2.78 0.92
Post-monsoon (SON) 396 1.39 6.37 0.95
PNJM Pre-monsoon (MAM) 398 3.6 7.88 0.74
Winter (DJF) 176 −1.76 5.31 0.49
Monsoon (JJA) 75 3.57 11.41 0.38
DELH Pre-monsoon (MAM) 719 −0.86 2.83 0.95 Post-monsoon (SON) 277 0.01 4.23 0.86
Monsoon (JJA) 223 0.2 4.9 0.92 Winter (DJF) 0 NaN NaN NaN
Post-monsoon (SON) 721 −2.22 3.57 0.99
TRVM Pre-monsoon (MAM) 631 −2.26 4.7 0.9
Winter (DJF) 682 −1.19 1.74 0.97
Monsoon (JJA) 199 −0.51 2.3 0.92
NGPR Pre-monsoon (MAM) 192 −0.53 2.27 0.94 Post-monsoon (SON) 617 −1.17 3.85 0.89
Monsoon (JJA) 211 1.57 3.53 0.89 Winter (DJF) 626 −2.74 4.84 0.89
Post-monsoon (SON) 410 7.23 16.06 0.5
BWNR Pre-monsoon (MAM) 644 13.88 16.5 0.29
Winter (DJF) 512 −1.09 2 0.97
Monsoon (JJA) 0 NaN NaN NaN
JBPR Pre-monsoon (MAM) 276 1.49 3.48 0.86 Post-monsoon (SON) 0 NaN NaN NaN
Monsoon (JJA) 160 0.97 2.8 0.9 Winter (DJF) 596 0.6 9.48 0.16
Post-monsoon (SON) 507 −2.52 3.89 0.98
SGGN Pre-monsoon (MAM) 680 −0.85 2.76 0.93
Winter (DJF) 540 −1.72 2.5 0.96
Monsoon (JJA) 192 −0.84 4.57 0.94
JIPR Pre-monsoon (MAM) 276 3.67 8.28 0.16 Post-monsoon (SON) 712 −2.51 4.04 0.97
Monsoon (JJA) 160 2.28 7.53 0.73 Winter (DJF) 690 −2.05 2.67 0.95
Post-monsoon (SON) 507 −0.47 8.05 0.88
Winter (DJF) 540 −0.05 5.4 0.58
JPGI Pre-monsoon (MAM) 662 0.69 4.15 0.93 dian domains during the pre-monsoon season, land stations
Monsoon (JJA) 188 −2.79 4.41 0.8 are mainly affected by local convective developments of a
Post-monsoon (SON) 644 −1.58 4.32 0.97 shorter timescale of a few hours, which is not captured by
Winter (DJF) 674 −0.57 2.63 0.87
the CAMS data, and a dry bias prevails in most of the sta-
PUNE Pre-monsoon (MAM) 456 −7.28 8.21 0.92 tions mentioned above.
Monsoon (JJA) 212 −7.06 8.02 0.81 Few GNSS data are assimilated for the Indian region in
Post-monsoon (SON) 424 −6.32 7.14 0.94
the latest CAMS data sets. During the monsoon season six
Winter (DJF) 73 −4.1 4.65 0.94
stations mentioned above underestimate IPWV with CAMS
RIPR Pre-monsoon (MAM) 573 −0.98 3.59 0.94 data due to complex and rugged topographic terrains which
Monsoon (JJA) 135 −1.94 3.53 0.74 are not well captured in CAMS data due to very few obser-
Post-monsoon (SON) 488 −2.79 3.96 0.98
vations being available in these locations. In almost all other
Winter (DJF) 531 −2.21 2.81 0.97
stations IPWV values are overestimated as the global features
KRKL Pre-monsoon (MAM) 711 −1.28 3.37 0.97 of monsoon flow are well captured by the CAMS data. The
Monsoon (JJA) 225 0.52 2.94 0.8
similar findings (overestimate or underestimate) are also ob-
Post-monsoon (SON) 690 −0.8 4.37 0.89
Winter (DJF) 323 −1.26 3.58 0.95 served with GNSS data for the abovementioned stations ex-
cept for PNJM and BWNR, where the meteorological sensor
KYKM Pre-monsoon (MAM) 647 0.61 3.44 0.94 gets replaced 2 to 3 times during the year of 2018. The stan-
Monsoon (JJA) 212 0.03 3.01 0.87
Post-monsoon (SON) 589 1.07 3.57 0.92
dard deviation (SD) between CAMS reanalysis and Indian
Winter (DJF) 697 −0.03 3.11 0.95 GNSS retrievals is more dispersed from their mean values
(Fig. 5).
https://doi.org/10.5194/amt-14-4857-2021 Atmos. Meas. Tech., 14, 4857–4877, 20214868 R. Yadav et al.: Intercomparison review of IPWV retrieved from INSAT-3DR sounder data
Figure 6. Seasonal correlation coefficient of CAMS and INSAT-3DR data.
3.3 Intercomparison of CAMS reanalysis and the Arabian Sea except for a few patches in the Arabian Sea.
INSAT-3DR IPWV Over land the values are slightly positive (0.0 to 0.2) in many
areas and slightly negative (0.0 to −0.3) for pockets of the
northwest and central India region (Fig. 6).
The correlation coefficient (CC) is computed between
During the monsoon month the value of CC over the land
INSAT-3DR and CAMS reanalysis, and IPWV retrievals are
area is mostly positively correlated (0.0 to 0.7) except for
negatively correlated in almost entire the land area, except for
the belt of the monsoon trough and south India, which have
pockets of the Indo-Gangetic Plain (IGP) of the Indian region
shown an appreciably low value of CC (−0.3 to −0.5). This
for winter months. The computed value of CC lies within the
might be due to the presence of clouds on both sides of the
range from 0.2 to −0.5 in the land area. Over ocean retrievals
monsoon trough and the southern belt of India during the
the values of CC are slightly positive (0.0 to 0.5) in the en-
monsoon season (Fig. 6).
tire area of the Bay of Bengal and the Arabian Sea except
In post-monsoon season months the value of CC between
for the offshore area on both the east and west side in winter
INSAT-3DR and CAMS reanalysis retrievals is positive (0.0
months (Fig. 6). This poor resemblance between the results
to 0.7) for both land and oceanic areas almost entirely ex-
(INSAT-3DR and CAMS) may be due to the interpolated val-
cept for some areas of north of the Bay of Bengal and the
ues of coarser-resolution CAMS data. INSAT-3DR satellite-
southeast Arabian Sea (Fig. 6).
based data have diverse, covariant information content, dif-
The differences in the magnitude and sign of CC of
ferent temporal coverage and lower ability with respect to
INSAT-3DR with respect to CAMS reanalysis IPWV may
representative observations in CAMS.
be due to a lack of assimilation of quality-controlled data
In the pre-monsoon season the value of CC between
over the Indian domain. This may be due to limitations of
INSAT-3DR and CAMS reanalysis retrievals is positive (0.0
the design of the instrument/sensor on board INSAT-3DR or
to 0.6) over the entire oceanic areas of the Bay of Bengal and
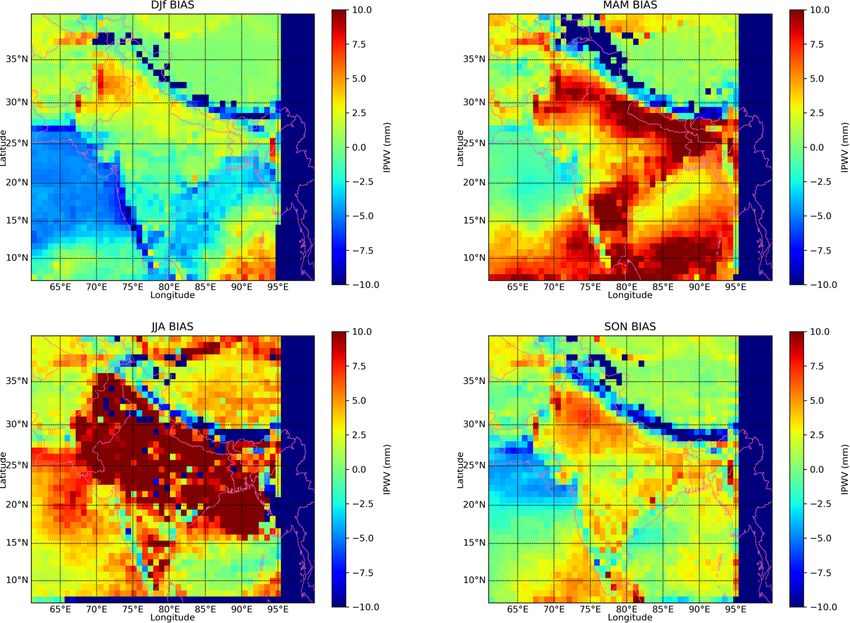
Atmos. Meas. Tech., 14, 4857–4877, 2021 https://doi.org/10.5194/amt-14-4857-2021R. Yadav et al.: Intercomparison review of IPWV retrieved from INSAT-3DR sounder data 4869 Figure 7. Seasonal bias of IPWV between CAMS and INSAT-3DR. the retrieval algorithm of IPWV. Therefore, it will affect the 3DR IPWV, which indicates an overestimation of CAMS overall collocations in matchup data sets. IPWV over the land and oceanic region, except for the Hi- During the winter season, positive biases ranges from malayan region that ranges from −2.5 to −5.0 mm, which 0.0 to 5.0 mm as observed between the CAMS reanalysis indicates an underestimation of CAMS IPWV (Fig. 7). and INSAT-3DR IPWV, which indicate an overestimation of During the post-monsoon season, positive biases range CAMS IPWV over the land and oceanic region, except for from 0.0 to 6.0 mm, observed between CAMS reanalysis the east and west coast of India including the Arabian Sea and INSAT-3DR IPWV, which indicates an overestimation (12 to 28◦ N), some pockets of the southeast Bay of Ben- of CAMS IPWV over the land and oceanic region, except for gal (BoB) and the Himalayan region that range from −2.5 the Arabian Sea (19 to 29◦ N) and Himalayan regions that to −5.0 mm, which indicates an underestimation of CAMS range from −2.5 to −6.0 mm, which indicates an underesti- IPWV (Fig. 7). mation of CAMS IPWV (Fig. 7). During the pre-monsoon season, positive biases range The IPWV retrieved from CAMS reanalysis overestimated from 0.0 to 10.0 mm, observed between CAMS reanalysis with respect to INSAT-3DR IPWV over the land and oceanic and INSAT-3DR IPWV, which indicates an overestimation regions for all the seasons except the Himalayan region and of CAMS IPWV over the land and oceanic region, except some parts of Arabian Sea and BoB. This occurred be- for some parts of the northwest of the Arabian Sea and the cause the infrared and microwave radiometer observations Himalayan region that range from −0.0 to −3.0 mm, which of land and oceans had been assimilated into the model, indicates an underestimation of CAMS IPWV (Fig. 7). which has the higher systematic humidity when compared During the monsoon season, positive biases range from 2.5 with radiosonde data (Andersson et al., 2007). Underesti- to 10.0 mm, observed between CAMS reanalysis and INSAT- mation of CAMS IPWV compared with INSAT-3DR over https://doi.org/10.5194/amt-14-4857-2021 Atmos. Meas. Tech., 14, 4857–4877, 2021
4870                        R. Yadav et al.: Intercomparison review of IPWV retrieved from INSAT-3DR sounder data

Figure 8. Seasonal RMSE between CAMS and INSAT-3DR.

the Himalayan region may be due to presence of rugged ter-        RMSE values during the post-monsoon season were less
rain/orographic features in the retrieval of IPWV.             than 7.5 mm as observed over the land region including
   RMSE values during the winter season range from 7.5 to      both the Arabian Sea and BoB region, except for the Indo-
13.0 mm over the land region (20 to 35◦ N) and the entire      Gangetic Plain (IGP) and northeast of the BoB range, which
Arabian Sea. Above 35◦ N latitude including Himalayan re-      range from 13 to 17 mm (Fig. 8).
gion, RMSE values are less than 7.5 mm. RMSE values ob-           Seasonal RMSE values between CAMS reanalysis
served over the southern peninsula of India and BoB region     and INSAT-3DR (CAMS-INSAT) retrievals are higher
range from 13 to 20 mm (Fig. 8).                               (> 15 mm) over the Bay of Bengal and pockets of the Indo-
   RMSE values during the pre-monsoon season range from        Gangetic Plain (IGP), northeast (NE) India, southern parts of
2.5 to 13.0 mm over the land region (18 to 40◦ N), the Ara-    India, the North Indian Ocean and the Arabian Sea during
bian Sea and the Himalayan region observed. RMSE values        the pre-monsoon, monsoon, and post-monsoon season and
range from 13 to 20 mm over the southern peninsula of India,   (< 15 mm) during the winter season. Higher values of RMSE
the Indo-Gangetic Plain (IGP) and the BoB region (Fig. 8).     prevail over the regions of higher moisture availability or wa-
   RMSE values during the monsoon season range from 14.0       ter content in the atmosphere (Fig. 8).
to 20.0 mm over the land region (20 to 35◦ N) including the
northwest of the Arabian Sea and northeast of BoB. Above       3.4   Distribution and variability of IPWV retrieved
35◦ N latitude, southwest and southeast of the Arabian Sea           from INSAT-3DR and CAMS reanalysis
including the southeast of BoB and the Himalayan region,
RMSE values are less than 8.0 mm (Fig. 8).                     The annual mean value and standard deviation of both the re-
                                                               trievals INSAT-3DR sounder and CAMS reanalysis data sets

Atmos. Meas. Tech., 14, 4857–4877, 2021                                         https://doi.org/10.5194/amt-14-4857-2021
R. Yadav et al.: Intercomparison review of IPWV retrieved from INSAT-3DR sounder data 4871
Figure 9. Means and SD of INSAT-3DR and CAMS IPWV for the year 2018.
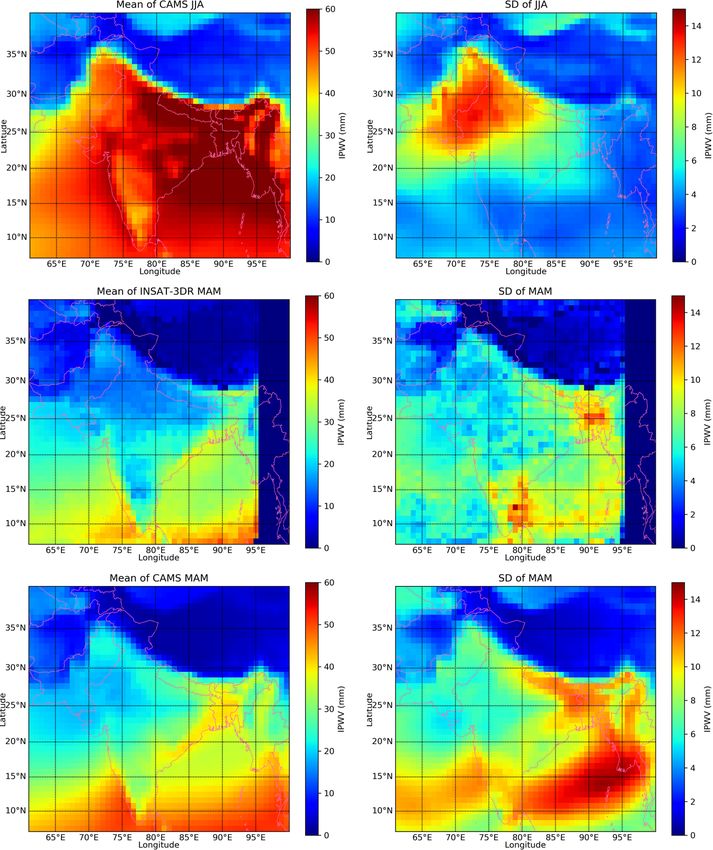
are presented in Fig. 9. The standard deviations of CAMS re- Over the oceanic region, the seasonal mean IPWV of
analysis retrieval data set are appreciably high (0.0 to 14 mm) INSAT-3DR and CAMS ranges from 25 to 40 mm (with stan-
in both land and ocean areas as compared to INSAT-3DR re- dard deviation 6–15 mm) and from 20 to 45 mm (SD 6–
trievals. This variation of higher spread from mean values 16 mm), and it is less than 25 mm with a SD of less than
may be due to the drier bias present in the CAMS reanaly- 6 mm for both INSAT-3DR and CAMS IPWV over the land
sis data sets (Inness et al., 2019) with coarser resolution as region during the winter season (Fig. 10).
compared to INSAT-3DR retrievals. Over the oceanic region, the seasonal mean IPWV of
The mean IPWV values vary in the range of 0–50 mm de- INSAT-3DR and CAMS ranges from 30 to 45 mm (with stan-
pending upon the region and prevailing weather system af- dard deviation 7–12 mm) and from 35 to 55 mm (SD 10–
fected throughout the year. Larger mean IPWVs occur in the 16 mm). Over the land region, the seasonal mean IPWV of
coastal regions of Indian Ocean regions compared to inland INSAT-3DR and CAMS data ranges from 15 to 38 mm with
and desert regions due to warm air conditions as compared to a SD of 2–10 and from 20 to 40 mm with SD of 5–12 mm
inland and ocean. The south foothill of the Himalayas has the respectively during the pre-monsoon season (Fig. 10).
largest IPWV variation with a SD ∼ 16 mm (Fig. 9). This is Seasonal mean IPWV of INSAT-3DR ranges from 30 to
attributed to the monsoon season that results in large changes more than 60 mm with a SD of 2–14 mm and from 50 to more
in precipitation at different seasons in these regions. The sea- than 60 mm with a SD of 4–16 mm for CAMS IPWV ob-
sonal distribution of mean IPWV and standard deviation of served for both land and ocean regions during the monsoon
CAMS and INSAT-3DR for monsoon and post-monsoon in- season (Fig. 10).
creased in CAMS data as compared to INSAT-3DR retrievals Over the oceanic region, the seasonal mean IPWV of
due to wet bias present in the CAMS data sets (Fig. 10). INSAT-3DR and CAMS ranges from 35 to 55 mm (with SD
of 6–10 mm) and from 38 to 55 mm (SD of 6–14 mm), and
https://doi.org/10.5194/amt-14-4857-2021 Atmos. Meas. Tech., 14, 4857–4877, 20214872 R. Yadav et al.: Intercomparison review of IPWV retrieved from INSAT-3DR sounder data Figure 10. Atmos. Meas. Tech., 14, 4857–4877, 2021 https://doi.org/10.5194/amt-14-4857-2021
You can also read