High-resolution meteorological forcing data for hydrological modelling and climate change impact analysis in the Mackenzie River Basin
←
→
Page content transcription
If your browser does not render page correctly, please read the page content below
Earth Syst. Sci. Data, 12, 629–645, 2020
https://doi.org/10.5194/essd-12-629-2020
© Author(s) 2020. This work is distributed under
the Creative Commons Attribution 4.0 License.

                High-resolution meteorological forcing data for
                  hydrological modelling and climate change
                 impact analysis in the Mackenzie River Basin
             Zilefac Elvis Asong1 , Mohamed Ezzat Elshamy1 , Daniel Princz1 , Howard Simon Wheater1 ,
                          John Willard Pomeroy1,2 , Alain Pietroniro1,2,3 , and Alex Cannon4
                   1 GlobalInstitute for Water Security, University of Saskatchewan, 11 Innovation Blvd,
                                             Saskatoon, SK, S7N 3H5, Canada
        2 Centre for Hydrology, University of Saskatchewan, 121 Research Drive, Saskatoon, SK, S7N 1K2, Canada
             3 Environment and Climate Change Canada, 11 Innovation Blvd, Saskatoon, SK, S7N 3H5, Canada
          4 Climate Research Division, Environment and Climate Change Canada, BC V8W 2Y2, Victoria, Canada

                              Correspondence: Zilefac Elvis Asong (elvis.asong@usask.ca)

                                    Received: 14 June 2019 – Discussion started: 31 July 2019
                        Revised: 20 January 2020 – Accepted: 3 February 2020 – Published: 19 March 2020

      Abstract. Cold region hydrology is very sensitive to the impacts of climate warming. Impacts of warming over
      recent decades in western Canada include glacier retreat, permafrost thaw, and changing patterns of precipitation,
      with an increased proportion of winter precipitation falling as rainfall and shorter durations of snow cover, as
      well as consequent changes in flow regimes. Future warming is expected to continue along these lines. Physically
      realistic and sophisticated hydrological models driven by reliable climate forcing can provide the capability
      to assess hydrological responses to climate change. However, the provision of reliable forcing data remains
      problematic, particularly in data-sparse regions. Hydrological processes in cold regions involve complex phase
      changes and so are very sensitive to small biases in the driving meteorology, particularly in temperature and
      precipitation, including precipitation phase. Cold regions often have sparse surface observations, particularly at
      high elevations that generate a large amount of runoff. This paper aims to provide an improved set of forcing
      data for large-scale hydrological models for climate change impact assessment. The best available gridded data
      in Canada are from the high-resolution forecasts of the Global Environmental Multiscale (GEM) atmospheric
      model and outputs of the Canadian Precipitation Analysis (CaPA), but these datasets have a short historical
      record. The EU WATCH ERA-Interim reanalysis (WFDEI) has a longer historical record but has often been
      found to be biased relative to observations over Canada. The aim of this study, therefore, is to blend the strengths
      of both datasets (GEM-CaPA and WFDEI) to produce a less-biased long-record product (WFDEI-GEM-CaPA)
      for hydrological modelling and climate change impact assessment over the Mackenzie River Basin. First, a
      multivariate generalization of the quantile mapping technique was implemented to bias-correct WFDEI against
      GEM-CaPA at 3 h × 0.125◦ resolution during the 2005–2016 overlap period, followed by a hindcast of WFDEI-
      GEM-CaPA from 1979. The derived WFDEI-GEM-CaPA data are validated against station observations as a
      preliminary step to assess their added value. This product is then used to bias-correct climate projections from the
      Canadian Centre for Climate Modelling and Analysis Canadian Regional Climate Model (CanRCM4) between
      1950 and 2100 under RCP8.5, and an analysis of the datasets shows that the biases in the original WFDEI
      product have been removed and the climate change signals in CanRCM4 are preserved. The resulting bias-
      corrected datasets are a consistent set of historical and climate projection data suitable for large-scale modelling
      and future climate scenario analysis. The final historical product (WFDEI-GEM-CaPA, 1979–2016) is freely
      available at the Federated Research Data Repository at https://doi.org/10.20383/101.0111 (Asong et al., 2018),
      while the original and corrected CanRCM4 data are available at https://doi.org/10.20383/101.0162 (Asong et al.,
      2019).

Published by Copernicus Publications.
630                                                                Z. E. Asong et al.: High-resolution meteorological forcing data

1   Introduction                                                       increasing variability and uncertainty in hydro-climatic con-
                                                                       ditions in a changing climate. Nonetheless, hydrological pro-
                                                                       cesses in cold regions involve complex phase changes and so
Accurate and reliable weather and climate information at               are very sensitive to small biases in the driving meteorology,
the basin scale is in increasingly high demand by policy-              particularly in temperature and precipitation.
makers, scientists, and other stakeholders for many purposes              As described earlier, cold regions often have sparse sur-
including water resources management (Barnett et al., 2005),           face observations, particularly at the high-elevation and high-
infrastructure planning (Brody et al., 2007), and ecosys-              latitude regions that could potentially generate a major
tem modelling (IPCC, 2013). Specifically, the potential im-            amount of runoff. The effects of mountain topography and
pacts of a warming climate on water availability in snow-              high latitudes are currently not well reflected in the observa-
dominated high-latitude regions continue to be a serious con-          tional record. Ground-based measurements (e.g. gauges) are
cern given that over the past several decades these regions            limited especially over the Canadian Rocky Mountains and
have experienced some of the most rapid warming on Earth               suffer from inaccuracies associated with cold climate pro-
(Demaria et al., 2016; Diffenbaugh et al., 2012; Islam et al.,         cesses (Asong et al., 2017; Wang and Lin, 2015; Wong et
2017; Martin and Etchevers, 2005; Stocker et al., 2013). The           al., 2017). The advent and use of weather radar systems have
ongoing science suggests that these warming trends are re-             addressed some of the shortcomings of gauge coverage, at
sulting in the intensification of the hydrologic cycle, leading        least where radar systems exists. Unfortunately, in Canada,
to significant recent observed changes in the hydro-climatic           for example, the spatial coverage of weather radar systems is
regimes of major river basins in Canada and globally (Coop-            limited to the southern (south of 55◦ N) part of the country
ersmith et al., 2014; DeBeer et al., 2016; Dumanski et al.,            (Fortin et al., 2015b). Recently, improved satellite products
2015). Changes in the timing and magnitude of river dis-               have emerged, such as the Global Precipitation Measurement
charge (Dibike et al., 2016); shifts in extreme temperature            (GPM) mission that provides meteorological information at
and precipitation regimes (Asong et al., 2016b; Vincent et             fine spatio-temporal resolutions and regular intervals. How-
al., 2015); and changes in snow, ice, and permafrost regimes           ever, the GPM is still at an early stage of development and
are anticipated (IPCC, 2013). Substantial evidence also indi-          only covers the region south of 60◦ N (Asong et al., 2017;
cates that the long-held notion of stationarity of hydrologi-          Hou et al., 2014).
cal processes is becoming invalid in a changing climate. As               The capability of the current generation of Earth system
pointed out by Milly et al. (2008), this loss of stationarity          models (ESMs) to represent meteorological forcing variables
means that there will be an increase in the likelihood and             is therefore of major interest for hydrological climate change
frequency of extreme weather and climate events, including             impact studies in cold region watersheds. Despite commend-
floods and droughts. What is particularly troubling is that            able progress being made, raw outputs from regional and
these impacted regions typically have extremely low density            global ESMs still have large differences between models
of weather and climate observations, making any attribution            and from the limited observational reference meteorology,
and climate impact analysis on water resources difficult.              due partly to spatial-scale mismatches and systematic biases
   It is well understood that water resources in most water-           (Taylor et al., 2012). Therefore, ESM outputs are often down-
sheds north of 30◦ N are heavily dependent on natural water            scaled and biases are adjusted statistically before being used
storage provided by snowpacks and glaciers, with water ac-             in hydrological simulations (Asong et al., 2016b; Chen et al.,
cumulated in the solid phase during the cold season and re-            2013, 2018; Gudmundsson et al., 2012). Recent research has
leased in the liquid phase during warm events and the warm             demonstrated that bias correction, including adjustment of
season. Particularly, the Canadian Rocky Mountains, the hy-            the dependence between driving variables, can lead to more
drological apex of North America with headwater streams                realistic hydrological simulations in cold region watersheds
flowing to the Arctic, Atlantic, and Pacific oceans, consti-           where the response of the system is sensitive to accumulation
tute an integral part of the global hydrological cycle (Fang et        and melt of snow and ice (Meyer et al., 2019).
al., 2013). Flows in these high-elevation headwaters depend               Apart from the uncertainty due to the many empirical
heavily on meltwater from snowpacks and glaciers. How-                 statistical techniques which have been developed to post-
ever, given that it is characterized by a highly varying cold          process ESM outputs (Maraun, 2016), the quality and length
region hydro-climate, studies indicate that it is in these high-       of the reference observational dataset for bias correction re-
elevation regions where climate variability and change are             mains a major issue (Reiter et al., 2016; Schoetter et al.,
expected to be most pronounced in terms of their impacts on            2012; Sippel et al., 2016). In Canada and other regions of
water supply (Beniston, 2003; Kane et al., 1991; Prowse and            North America, regional gridded datasets such as the com-
Beltaos, 2002; Woo and Pomeroy, 2011). More physically                 bined Global Environmental Multiscale (GEM) atmospheric
realistic and sophisticated hydrological models driven by re-          model forecasts (Yeh et al., 2002) and the Canadian Pre-
liable climate forcing information can enhance our ability to          cipitation Analysis (CaPA; Mahfouf et al., 2007) have been
assess short- and long-term regional hydrologic responses to

Earth Syst. Sci. Data, 12, 629–645, 2020                                                www.earth-syst-sci-data.net/12/629/2020/
Z. E. Asong et al.: High-resolution meteorological forcing data                                                             631

found to perform comparably to ground observations, both           3 h × 0.125◦ resolution during the 2005–2016 period, fol-
statistically and hydrologically (Alavi et al., 2016; Boluwade     lowed by a hindcast of WFDEI-GEM-CaPA from 1979. Sub-
et al., 2018; Eum et al., 2014; Fortin et al., 2015a; Gbam-        sequently, a 15-member initial condition ensemble of the
bie et al., 2017; Wong et al., 2017). However, the duration        CanESM2 ESM (historical followed by RCP8.5 scenario),
of GEM-CaPA is too short to be used to directly correct            which has been dynamically downscaled at 0.44◦ (50 km)
ESM climate due to unsynchronized internal variability – the       resolution using the fourth-generation Canadian Regional
recommended minimum record length for bias correction is           Climate Model (CanRCM4), is sourced from the Canadian
30 years (Maraun, 2016; Maraun et al., 2017). Other grid-          Centre for Climate Modelling and Analysis. A multivariate
ded products such as the EU WATCH ERA-Interim reanaly-             bias correction algorithm is applied to the CanRCM4 out-
sis (WFDEI; Weedon et al., 2014) and Princeton (Sheffield et       puts (1950–2100) to adjust the data against WFDEI-GEM-
al., 2006) have a longer historical record but have been found     CaPA. The bias-corrected products are important for devel-
to be biased relative to observations over Canada (Wong et         oping distributed hydrological models as well as for assess-
al., 2017) and the United States (Behnke et al., 2016; Sapi-       ing climate change impacts over the Mackenzie River Basin
ano and Arkin, 2009). However, the WFDEI reanalysis has            (MRB), which constitutes a test bed for the Changing Cold
been found to outperform other long-record gridded products        regions Network (CCRN) project’s large-scale hydrological
(Chadburn et al., 2015; Park et al., 2016; Wong et al., 2017).     modelling strategy and is the case study for the current anal-
   Because of the sparse observational network, few gridded        ysis.
climate datasets exist that contain the necessary meteorologi-
cal variables to drive physically based land surface models at     2     Methodology
sub-daily temporal resolution north of 55◦ N in North Amer-
ica. Because the combination of the GEM and CaPA datasets          2.1     Study area
has been shown to perform relatively well in these regions,
the intent here is to use these datasets to bias-correct the       The study area is the Mackenzie River Basin, which is the
WFDEI dataset, which contains a sufficient length of record        largest river basin in Canada and the largest river draining
for bias-correcting climate projection datasets. Aside from its    from North America to the Arctic Ocean (Fig. 1). It drains
short record length, a limitation of the GEM-CaPA dataset          an area of about 1.8 million km2 and discharges more than
for wider use for hydrological models is that the wind, tem-       300 km3 of freshwater to the Beaufort Sea in the Arctic each
perature, and humidity variables are available only at the         year. The basin drains parts of British Columbia, Alberta,
0.995 sigma(σ ) level (approximately 40 m, varying in time         Saskatchewan, the Northwest Territories, and the Yukon ter-
and space; herein referred to as the 40 m level) across the        ritory in northwestern Canada. The western tributaries are
full length of record. The WFDEI dataset contains these vari-      relatively steep as they originate from the Canadian Rocky
ables at the surface level, which is more typically used by hy-    Mountains, while the eastern tributaries have milder topog-
drological models. Therefore, the bias correction effectively      raphy with several large lakes, thousands of interconnected
modifies the source surface level data to reproduce the cli-       small lakes, fens, and bogs. The general vegetation ranges
mate found at the 40 m level of the reference dataset (GEM-        widely between alpine, boreal, and tundra landscapes. Cli-
CaPA). Many regional and large-scale land surface hydro-           matic conditions are also quite variable and can be generally
logical models are capable of using climate data at this at-       classified as cold-temperate, mountain, subarctic, and arctic
mospheric level. Thus, no effort is made to interpolate the        zones, with about 75 % of the basin underlain by continuous
product back to surface level (although this could be done if      and discontinuous permafrost.
needed). In addition, the bias-corrected dataset at an effective
40 m level can then be used to bias-correct these same fields      2.2     Data sources
from the CanRCM4 dataset, which are at the same 0.995σ
                                                                   2.2.1    Gridded GEM-CaPA product
level as in the reference dataset (GEM-CaPA). The analy-
sis results in a bias-corrected set of historical and projected    Hourly archived forecast data from the GEM model were
climate data that is consistent in time and considers the re-      acquired from Environment and Climate Change Canada
gional topography and climate effects of GEM and CaPA and          (http://collaboration.cmc.ec.gc.ca/cmc/cmoi/product_guide/
is suitable to drive large-scale simulations of distributed hy-    submenus/rdps_e.html, last access: 28 September 2018).
drological models for assessing climate change impacts in          The fields include downward incoming solar radiation;
data-sparse regions.                                               downward incoming longwave radiation and pressure at
   The aim of this study, therefore, is to combine the strengths   the surface; and specific humidity, air temperature, and
of both datasets (GEM-CaPA and WFDEI) to produce a                 wind speed at approximately 40 m above ground surface.
less-biased long-record product (WFDEI-GEM-CaPA) us-               The 40 m level was used because surface level variables at
ing a multistage bias correction framework. First, a multi-        1.0σ (approximately at 2 m for temperature and humidity,
variate generalization of the quantile mapping technique was       and 10 m for wind speed) are only available in the archive
implemented to bias-correct WFDEI against GEM-CaPA at              from 2010 onward. The GEM data are at approximately

www.earth-syst-sci-data.net/12/629/2020/                                                Earth Syst. Sci. Data, 12, 629–645, 2020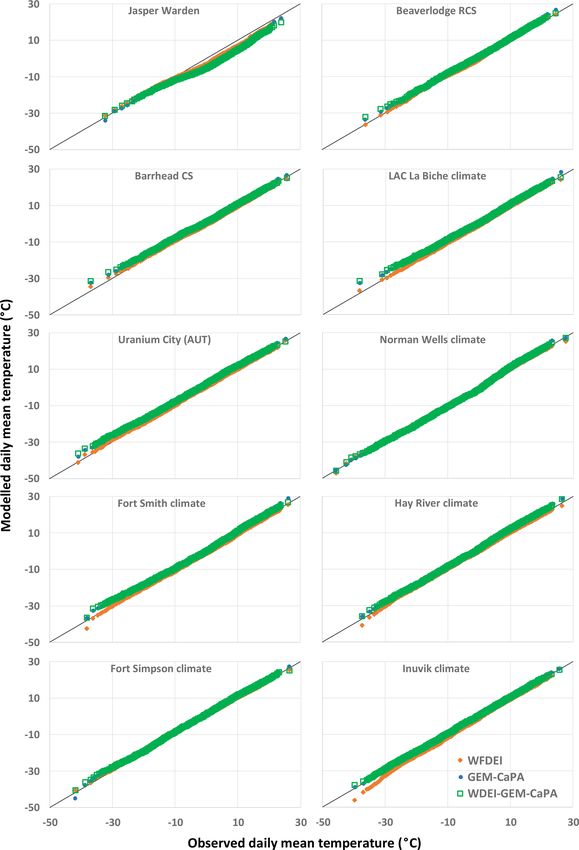
632                                                                   Z. E. Asong et al.: High-resolution meteorological forcing data

                                                                          availability, last access: 25 July 2018). Weedon et al. (2014)
                                                                          used the ERA-Interim surface meteorology data as base-
                                                                          line information to derive the WFDEI product. Firstly, ERA-
                                                                          Interim data were interpolated at 0.5◦ spatial resolution to
                                                                          match the land–sea mask defined by the Climatic Research
                                                                          Unit (CRU) of the University of East Anglia, Norwich, Eng-
                                                                          land. Subsequently, corrections for elevation and monthly
                                                                          bias of climate trends in the ERA-Interim fields were applied
                                                                          to the interpolated data. The WFDEI data have two sets of
                                                                          precipitation data: the Global Precipitation Climatology Cen-
                                                                          tre product (GPCC) and CRU Time Series version 3.1 (CRU
                                                                          TS3.1). Thus, two variants of the WFDEI product are avail-
                                                                          able – WFDEI-GPCC and WFDEI-CRU. The WFDEI-CRU
                                                                          dataset was used here because it goes up to 2016, whilst the
Figure 1. Location of the Mackenzie River Basin in North Amer-            WFDEI-GPCC had only been updated until 2013 at the time
ica. Digital elevation data come from GTOPO30 – 30 arcsec digi-           of our analysis.
tal elevation data for the globe (https://www.arcgis.com/home/item.
html?id=5771199a57cc4c29ad9791022acd7f74; last access: Febru-
ary 2018).
                                                                          2.2.3   Station observations

                                                                          To evaluate the added value of bias-correcting WFDEI
                                                                          against GEM-CaPA, in situ hourly precipitation, tempera-
24 km spatial resolution from October 2001, approximately                 ture, surface pressure, relative humidity, and wind speed at
15 km from June 2004, and approximately 10 km resolution                  773 stations located across the MRB were initially consid-
from November 2012, and they are provided on a rotated                    ered (Fig. 2). This station network is maintained by Environ-
latitude–longitude grid in Environment and Climate Change                 ment and Climate Change Canada (ECCC) (http://climate.
Canada (ECCC) standard file format. The archived data are                 weather.gc.ca/historical_data/search_historic_data_e.html,
of former operational forecasts and contain model outputs                 last access: 17 December 2019) and includes some duplicate
from versions of GEM prior to 2.0.0 through 5.0.0.                        stations (stations at the same location but having different
   Six-hourly total precipitation data from the complemen-                IDs). Total daily precipitation and average daily temperature
tary CaPA product (http://collaboration.cmc.ec.gc.ca/cmc/                 are found in daily data files, while surface pressure, relative
cmoi/product_guide/submenus/capa_e.html, last access: 28                  humidity, and wind speed are only found in hourly files.
September 2018) were also acquired. The analysis incor-                   Unfortunately, radiation data are not available at any of
porates observed precipitation from meteorological weather                those stations. The data were extracted for the period from
stations, and more recently from radar, into the precipitation            1 January 2005 to 31 December 2016, and hourly data were
field from GEM. The CaPA data are approximately 10 km                     averaged to the daily time step. This reduced the number
resolution from January 2002, also on a rotated latitude–                 of stations to 364. Out of these 364 stations, only 10 were
longitude grid in ECCC standard file format. The data con-                found to have less than 10 % missing data (calculated at the
tain reanalysis outputs from CaPA 2.4b8 from 2002 to 2012                 daily timescale after aggregating/averaging the data) for all
and of former operational analyses from versions of CaPA                  studied variables concurrently over the 2005–2016 period
2.3.0 through 4.0.0 from November 2012 onward.                            and were retained for further consideration. Precipitation
   The variables from GEM and CaPA were spatially inter-                  and surface pressure are the only two surface variables
polated and reprojected to a regular latitude–longitude grid              in all datasets (gridded and stations). Due to differences
at 0.125◦ resolution. For data from GEM, the interpolation                in heights between gridded variables of GEM-CaPA and
was done using a bilinear algorithm, while data from CaPA                 WFDEI-GEM-CaPA datasets for air temperature, humidity,
were interpolated using nearest neighbour (Schulzweida et                 and wind speed (see Sects. 2.2.1 and 3.1) and the ECCC
al., 2004). Where necessary, the GEM fields were converted                station data, we expect deviations. Nevertheless, the compar-
to SI units, and CaPA was converted to a precipitation rate               isons are still informative. Relative humidity observations
in SI units for better compatibility with some hydrological               were converted to specific humidity to be comparable to
models.                                                                   gridded datasets using concurrent station temperature and
                                                                          surface pressure data at those stations, which reduced the
2.2.2   Gridded WFDEI product                                             record completeness further but was still within 90 % for the
                                                                          10 selected stations. Table 1 provides additional information
The gridded WFDEI meteorological forcing data have a                      for the 10 stations retained for further analysis, which are
global 0.5◦ spatial resolution and 3 h time step cover-                   highlighted in Fig. 2. This dataset is hereafter referred to
ing the period 1979–2016 (http://www.eu-watch.org/data_                   as ECCC-S (S for stations). Table S1 in the Supplement

Earth Syst. Sci. Data, 12, 629–645, 2020                                                   www.earth-syst-sci-data.net/12/629/2020/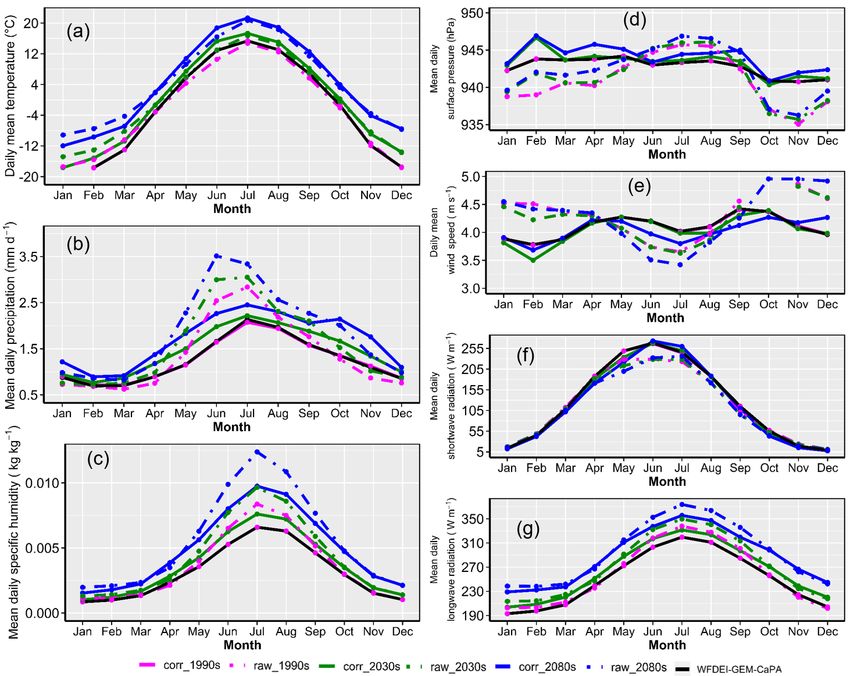
Z. E. Asong et al.: High-resolution meteorological forcing data                                                                     633

Figure 2. Spatial distribution of the initial 773 ground-based
precipitation gauges (all dots) over the study area. Only 364
of these have records during the period 2005–2016 (brown and
yellow dots). Data screening for missing values (10 % thresh-
old concurrently applied for all variables) during the 2005–2016
period resulted in 10 of these stations (yellow dots) being re-
tained for validation of gridded datasets. Blue lines indicate        Figure 3. A schematic representation of inputs and the bias correc-
river network sourced from: https://open.canada.ca/data/en/dataset/   tion procedure used to produce the WFDEI-GEM-CaPA meteoro-
16e8a362-d8be-53b7-acb8-e3f9c5cd54ef (last access: December           logical forcing dataset.
2019).

provides a similar listing to Table 1 but for all 364 stations        values at each time step represent the mean of the previ-
with records during the 2005–2016 period.                             ous 3 h period, to make it consistent with WFDEI) and in-
                                                                      terpolating both WFDEI and GEM-CaPA to 0.125◦ reso-
2.2.4    Climate model outputs
                                                                      lution. For bias correction, a multistage approach was im-
                                                                      plemented as follows. A multivariate generalization of the
The historical and future climate simulations utilized in this        quantile mapping technique (MBCn, Cannon, 2018) which
study are part of the CanRCM4 large ensemble, which con-              combines quantile delta mapping (Cannon et al., 2015) and
sists of 50 members and is downscaled at horizontal spa-              random orthogonal rotations to match the multivariate dis-
tial resolutions of 0.44◦ (∼ 50 km). These CanRCM4 sim-               tributions of two datasets was implemented to bias-correct
ulations had been produced initially by the Canadian Sea Ice          WFDEI against GEM-CaPA at 3 h × 0.125◦ resolution dur-
and Snow Evolution Network (CanSISE) Climate Change                   ing the 2005–2016 period. The rationale for selecting the
and Atmospheric Research (CCAR) Network project (https:               above bias correction method is based on fitness for pur-
//www.cansise.ca/, last access: 24 April 2019). The input data        pose; i.e. the method accounts for dependence between vari-
for the historical period, i.e. 1950–2005, as well as the fu-         ables and corrects multiple measures of joint dependence –
ture (2006–2100) RCP simulations of CanRCM4 were pro-                 attributes that can be important for hydrological simulations
vided by the parent ESM (CanESM2) as specified in the                 (Meyer et al., 2019) – to preserve the physical realism of the
Coupled Model Intercomparison Project Phase 5 (CMIP5)                 corrected climate as much as possible. Models were fitted
guidelines. The data are sourced from the Canadian Cen-               to data for each calendar month while accounting for the
tre for Climate Modelling and Analysis (CCCma) at: http:              inter-variable dependence structure. Using the fitted mod-
//www.cccma.ec.gc.ca/data/canrcm/CanRCM4 (last access:                els (2005–2016), a hindcast was made of WFDEI between
6 March 2019). This study utilized 15 members of the 0.44◦            1979 and 2004. Finally, the corrected WFDEI data derived
resolution product at 1 h time step and values were aggre-            from the fitted (2005–2016) and hindcast (1979–2004) peri-
gated to 3 h resolution prior to bias correction. The seven           ods were concatenated to obtain the bias-corrected WFDEI-
forcing variables needed for driving the CCRN MESH model              GEM-CaPA product (1979–2016).
(https://wiki.usask.ca/display/MESH/About+MESH, last ac-                 For bias-correcting the 15-member CanRCM4 initial con-
cess: 10 May 2019) and which were bias-corrected in the               dition ensemble against the WFDEI-GEM-CaPA product,
current study are included in Table 2.                                CanRCM4 was also spatially interpolated to match the
                                                                      WFDEI-GEM-CaPA specifications using nearest-neighbour
2.3     Data processing and bias correction workflow
                                                                      interpolation. The multivariate bias correction technique (de-
                                                                      scribed above) transfers all aspects of the WFDEI-GEM-
The workflow for the multistage bias correction of WFDEI              CaPA continuous multivariate distribution to the correspond-
against GEM-CaPA is shown in Fig. 3. Bias correction was              ing multivariate distribution of variables from CanRCM4
done after aggregating 1 h GEM-CaPA estimates to 3 h (the             during the 1979–2008 calibration period (also used here as

www.earth-syst-sci-data.net/12/629/2020/                                                 Earth Syst. Sci. Data, 12, 629–645, 2020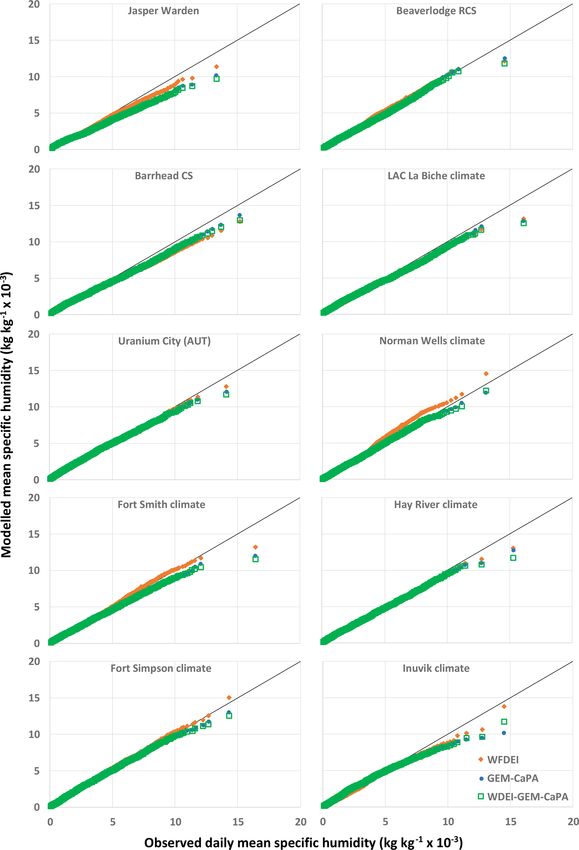
634 Z. E. Asong et al.: High-resolution meteorological forcing data
Table 1. List of observation stations used for validating the various gridded historical products.
Station Coordinates Record Percent complete
Name Prov. ID Lat Long Elev. Start End T P RH ps wind
Jasper Warden AB 10223 52.93 −118.03 1020.0 1994 2019 99.0 98.0 96.0 96.9 97.1
Beaverlodge RCS AB 30669 55.20 −119.40 745.0 2001 2019 99.0 93.9 93.8 93.9 93.8
Barrhead CS AB 30641 54.09 −114.45 648.0 2000 2019 98.2 98.1 97.8 97.8 97.0
Lac La Biche climate AB 30726 54.77 −112.02 567.0 2001 2019 99.0 98.8 97.8 97.9 97.9
Uranium City (AUT) SK 9831 59.57 −108.48 318.2 1992 2019 95.8 93.0 94.2 94.4 94.8
Norman Wells climate NT 43004 65.29 −126.75 93.6 2003 2019 98.5 96.6 96.0 95.4 96.2
Fort Smith climate NT 41884 60.03 −111.93 203.0 2003 2019 97.6 96.8 95.8 96.7 97.3
Hay River climate NT 41885 60.84 −115.78 164.0 2003 2019 99.6 99.3 98.4 98.4 98.0
Fort Simpson climate NT 41944 61.76 −121.24 168.0 2003 2019 97.5 99.5 96.1 96.2 98.2
Inuvik climate NT 41883 68.32 −133.52 103.0 2003 2019 99.6 95.1 98.3 98.4 97.0
Table 2. List of variables processed in this study with heights and units in each dataset.
Variable Unit Height
WFDEI GEM-CaPA WFDEI-GEM-CaPA
Precipitation kg m−2 s−1 Surface Surface Surface
Air temperature K 2m 40 m 40 m
Specific humidity kg kg−1 2m 40 m 40 m
Wind speed m s−1 10 m 40 m 40 m
Surface pressure Pa Surface Surface Surface
Downwelling shortwave radiation W m−2 Surface Surface Surface
Downwelling longwave radiation W m−2 Surface Surface Surface
the historical period). Subsequently, when applied to future variables (see Table 2). Therefore, the corrected WFDEI-
projections, changes in quantiles of each variable between GEM-CaPA data for those three variables reflect 40 m eleva-
the historical and future period are also preserved. Models tions above the surface. The spatial coverage of the WFDEI-
were fitted to data for each calendar month and for each GEM-CaPA data is the same as the areal extent of the MRB
grid point while preserving the dependence structure among (Figs. 1 and 2). The suitability of the bias correction algo-
variables. The historical datasets used in the fitting pro- rithm to reproduce the observed seasonal cycle and inter-
cedure include WFDEI-GEM-CaPA (1979–2008) and Can- annual variability of the variables was assessed for the fit-
RCM4 (1979–2008). Using the fitted models, quantiles of ting (2005–2016) and hindcast (1979–2004) periods. Data
CanRCM4 output from 1950 to 2100 were changed. To eval- extracted over the entire Mackenzie River Basin are used
uate the need to bias-correct CanRCM4, performance of the to demonstrate the quality of the bias correction exercise
bias correction scheme, as well the impact of bias correction and uniqueness of the resulting output. Figure 4 shows the
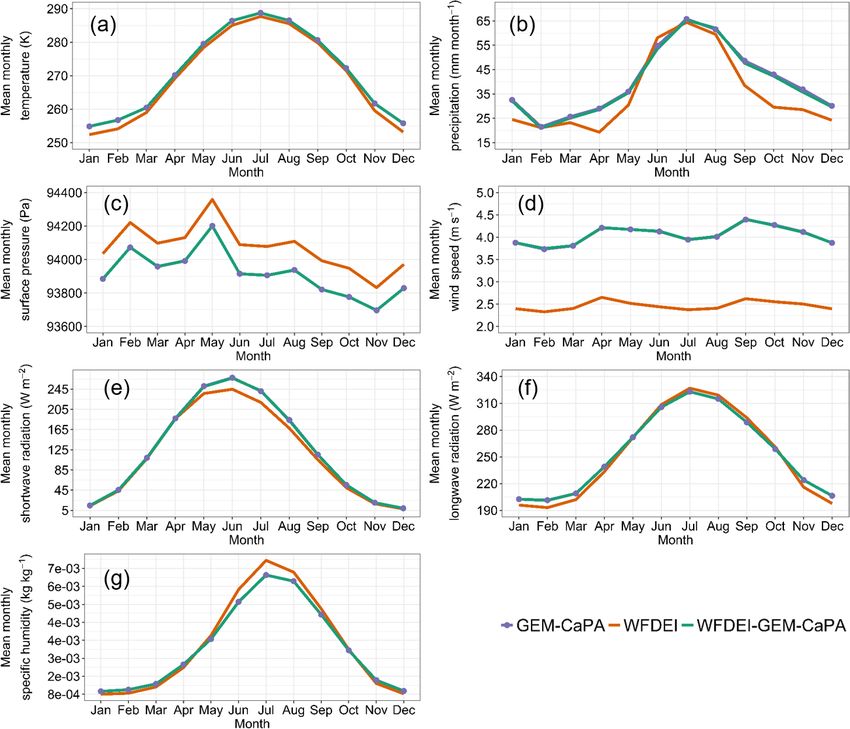
on the climate change signal, and the seasonal cycle of all seasonal cycle for GEM-CaPA, WFDEI, and WFDEI-GEM-
seven variables is assessed over three 30-year periods: 1979– CaPA during the fitting period. Overall, the monthly distri-
2008 (referred to hereafter as 1990s), 2021–2050 (referred to butions show that the bias was removed for all variables re-
hereafter as 2030s), and 2071–2100 (referred to hereafter as sulting in the very close distributions between GEM-CaPA
2080s). and WFDEI-GEM-CaPA. The bias was particularly large
for wind speed, an important variable for both alpine and
prairie blowing snow redistribution calculations (Pomeroy
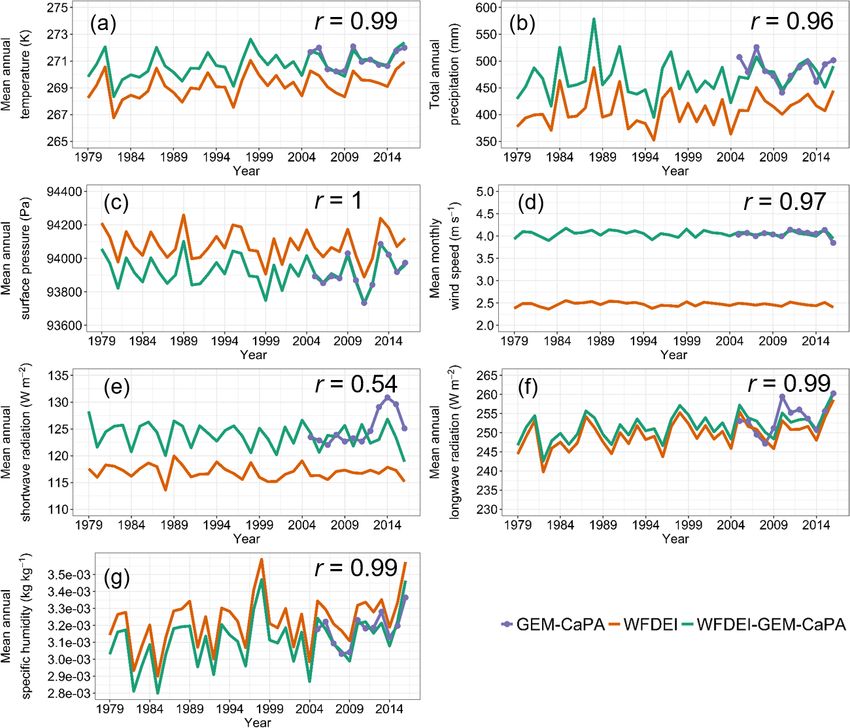
3 Results and discussion and Li, 2000), but was successfully removed. Figure 5 shows
the mean annual time series of the seven variables over the
3.1 Bias correction of WFDEI 1979–2016 period. It is noticeable that the bias is corrected
while the inter-annual variability is well preserved between
Table 2 presents an overview of the seven variables processed
WFDEI and WFDEI-GEM-CAPA, except for shortwave ra-
in this study. Note that three of the GEM variables (tempera-
diation where the inter-annual variability is not fully pre-
ture, specific humidity, and wind speed) are at 40 m and are
served as shown by the correlation between the WFDEI and
used directly to correct the corresponding WFDEI surface
Earth Syst. Sci. Data, 12, 629–645, 2020 www.earth-syst-sci-data.net/12/629/2020/
Z. E. Asong et al.: High-resolution meteorological forcing data                                                                             635

Figure 4. Seasonal cycle of GEM-CaPA (dark slate blue), WFDEI (orange), and WFDEI-GEM-CaPA bias-corrected data (green) for air tem-
perature (a), precipitation (b), surface pressure (c), wind speed (d), shortwave radiation (e), longwave radiation (f), and specific humidity (g)
during the fitting period (2005–2016).

WFDEI-GEM-CaPA annual series. However, this should not                     which station data could be found. Thus, shortwave and long-
be a major issue when impact models are driven using these                 wave radiation are not validated as we could not find station
data. The foregoing analyses have shown that the bias in the               data for those in ECCC-S data. The height differences for
WFDEI data was removed for both the fitting and hindcast                   temperature, humidity, and wind speed between GEM-CAPA
periods. However, some potential limitations remain – for ex-              and WFDEI-GEM-CaPA (40 m) on one side and ECCC-S
ample, WFDEI was interpolated directly from 0.5 to 0.125◦                  data (surface) on the other introduce some inconsistencies
and bias-corrected against GEM-CaPA at 0.125◦ . The inter-                 that are discussed below. Indirect validation is recommended
polation does not add any event-scale spatial variability for a            for other variables through other means such as hydrolog-
variable like precipitation which is very variable across dif-             ical modelling. Validation is performed for the 2005–2016
ferent scales. These issues have been reviewed extensively                 period using daily totals for precipitation and daily averages
by Cannon (2018), Maraun (2013), Maraun et al. (2010), and                 for other variables. To compare stations against gridded prod-
Storch (1999).                                                             ucts, the corresponding time series of gridded products for
                                                                           each gauge were obtained from the cell that contained the
3.2   Validation of gridded products against station                       gauge (i.e. nearest neighbour) and were aggregated to the
      observations                                                         daily timescale.
                                                                              Figure 6 depicts quantile–quantile (Q–Q) plots of daily
In this section, the WFDEI-GEM-CaPA product is validated                   precipitation from WFDEI-GEM-CaPA, WFDEI, and GEM-
against station observations (ECCC-S) to indicate the bene-                CaPA compared against ECCC-S. As expected, although
fit of bias-correcting WFDEI against GEM-CaPA. As men-                     with noticeable differences across the MRB, CaPA agrees
tioned in Sect. 2.2.3, the validation focusses on variables for

www.earth-syst-sci-data.net/12/629/2020/                                                       Earth Syst. Sci. Data, 12, 629–645, 2020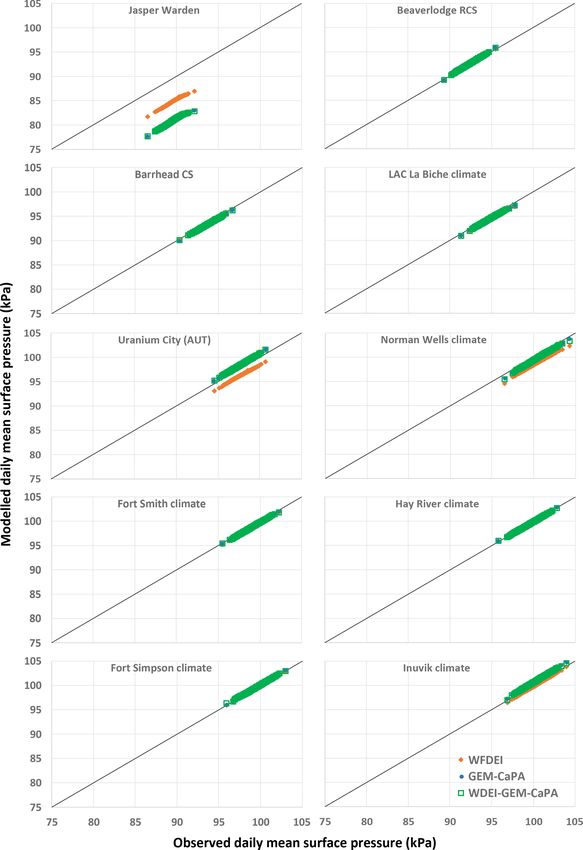
636                                                                   Z. E. Asong et al.: High-resolution meteorological forcing data

Figure 5. Time series of GEM-CaPA (dark slate blue), WFDEI (orange), and WFDEI-GEM-CaPA bias-corrected data (green) for air tem-
perature (a), precipitation (b), surface pressure (c), wind speed (d), shortwave radiation (e), longwave radiation (f), and specific humidity (g)
during the periods 2005–2016 (GEM-CaPA) and 1979–2016 (WFDEI and WFDEI-GEM-CaPA). The correlation (r) between the WFDEI
and WFDEI-GEM-CaPA annual series is indicated for each variable.

better with ECCC-S than WFDEI since some or all of these                   WFDEI were small, WFDEI-GEM-CaPA is almost identical
meteorological stations are assimilated by the CaPA system.                to GEM; i.e. all biases are removed.
Large daily amounts are generally underestimated by CaPA,                     Comparisons between gridded datasets and stations for
but CaPA sometimes overestimates these as well (e.g. Ura-                  daily mean surface pressure, wind speed, and humidity are
nium City (AUT) station). WFDEI tends to underestimate                     shown in Figs. 8, 9, and 10 respectively. WFDEI generally
the observed precipitation amounts at most stations except                 performs well for surface pressure (Fig. 8) such that bias cor-
at Jasper Warden, where it slightly overestimates small and                rection seems unnecessary at most locations. Both datasets
moderate amounts. Bias correction brings WFDEI closer to                   (WFDEI and GEM) underestimate surface pressure at Jasper
CaPA for most stations, but some biases remain, especially                 Warden station, which is at a relatively high elevation. GEM
at the high ends of the distributions.                                     is worse than WFDEI for this station, and thus bias correction
   Figure 7 shows quantile–quantile plots of mean daily                    against GEM-CaPA deteriorates the results. WFDEI slightly
temperature for the three gridded datasets versus ECCC-S.                  underestimates surface pressure at Uranium City (AUT) and
WFDEI is performing generally well for temperature except                  Norman Wells climate stations, but because GEM is close
for low temperatures at Inuvik (the most northerly station).               to observations, bias correction makes WFDEI-GEM-CaPA
Despite the height difference (see Sect. 2.2.3), GEM is also               close to observations at those two stations.
close to observations for most stations with some overes-                     Mean daily wind speed (Fig. 9) is underestimated by
timation of low temperatures. The temperature differences                  WFDEI for most stations, especially at high speeds. GEM
between the surface and the 40 m level are generally small                 winds are generally higher (except for Fort Simpson) because
(1–2 ◦ C) at the daily scale. Given that temperature biases in             of the higher elevation (40 m) of the dataset, and thus the

Earth Syst. Sci. Data, 12, 629–645, 2020                                                      www.earth-syst-sci-data.net/12/629/2020/
Z. E. Asong et al.: High-resolution meteorological forcing data                                                             637

Figure 6. Quantile–quantile plots of modelled (GEM-CaPA, WFDEI, and WFDEI-GEM-CaPA) and observed (ECCC-S) daily total precip-
itation.

comparison to ECCC-S data is not favourable for this vari-         with few exceptions. For example, humidity at the Jasper
able. It is generally expected that wind speed increases with      Warden, Barrhead CS, and Inuvik climate stations is underes-
height. Bias correction of WFDEI against GEM-CaPA re-              timated by both WFDEI and GEM, especially at high values.
moves differences between the two datasets, and the resultant      Bias correction brings WFDEI closer to GEM and thus re-
wind speed, thus, reflects the higher speeds to be expected at     sults in improvements only if GEM is closer to observations
40 m.                                                              than WFDEI. Thus, results at Fort Smith climate and Inuvik
  Both WFDEI and GEM are close in terms of specific hu-            climate stations are worse with bias correction. However, the
midity at most stations (Fig. 10) despite the height difference,

www.earth-syst-sci-data.net/12/629/2020/                                            Earth Syst. Sci. Data, 12, 629–645, 2020
638                                                            Z. E. Asong et al.: High-resolution meteorological forcing data

Figure 7. Quantile–quantile plots of modelled (GEM-CaPA, WFDEI, and WFDEI-GEM-CaPA) and observed (ECCC-S) daily mean tem-
perature.

bias correction does not change the quantiles by much for          difficult to correct. Note that extracting data from grid points
most stations.                                                     does not only have the effect of smoothing the areal averages
   Overall, GEM-CaPA performs similar to or better than            but comparing grid point estimates to station values may not
WFDEI for most variables at the studied stations, especially       provide a clear picture of the quality of a gridded product.
precipitation. Therefore, correcting WFDEI against GEM-            However, this diagnostic analysis provides preliminary in-
CaPA adds value to the WFDEI dataset and leads to a closer         sights into the potential performance of a dataset.
agreement between WFDEI-GEM-CaPA and ECCC-S. Pre-
cipitation is one of the most important variables and most

Earth Syst. Sci. Data, 12, 629–645, 2020                                            www.earth-syst-sci-data.net/12/629/2020/
Z. E. Asong et al.: High-resolution meteorological forcing data                                                            639

Figure 8. Quantile–quantile plots of modelled (GEM-CaPA, WFDEI, and WFDEI-GEM-CaPA) and observed daily mean surface pressure.

3.3   Bias correction of future climate projections               midity during the historical period. This is also true in the
                                                                  case of daily mean wind speed in the cold months (October
In this section, the need to bias-correct the CanRCM4 outputs     to April). However, it underestimates the wind speed in the
is shown and whether the simulated climate change signal          warm season (May to September). Surface pressure is un-
was preserved after applying MBCn to the CanRCM4 out-             derestimated during September to May and overestimated in
puts is determined. Figure 11 shows the climatological sea-       the summer (June to August). For the other variables (e.g.
sonal cycle of all seven variables which are required to drive    air temperature and radiation), CanRCM4 can simulate the
the MESH model for the MRB. First, between April and Oc-          observed seasonal cycle closely, although biases still exist.
tober, CanRCM4 overestimates the observed (i.e. WFDEI-            These biases necessitated the application of the MBCn algo-
GEM-CaPA) daily precipitation amounts and specific hu-

www.earth-syst-sci-data.net/12/629/2020/                                           Earth Syst. Sci. Data, 12, 629–645, 2020
640 Z. E. Asong et al.: High-resolution meteorological forcing data Figure 9. Quantile–quantile plots of modelled (GEM-CaPA, WFDEI, and WFDEI-GEM-CaPA) and observed daily mean wind speed. rithm on the raw CanRCM4 outputs. The MBCn algorithm larger changes expected in the warm season (April–October), removed the bias in the CanRCM4 simulations during the while air temperature is projected to increase, particularly in fitting period (1990s) as can be judged from the close fit the cold months (October–March). These climate change sig- between WFDEI-GEM-CaPA and the unbiased CanRCM4 nals are very well preserved after applying MBCn to the Can- output (corr_1990s). On the projected climate change signal, RCM4 simulations. there is a projected change in the amplitude of all variables but not a shift in the phase of the cycle over the MRB with global warming. Precipitation, specific humidity, and long- wave radiation are projected to increase in the future, with Earth Syst. Sci. Data, 12, 629–645, 2020 www.earth-syst-sci-data.net/12/629/2020/
Z. E. Asong et al.: High-resolution meteorological forcing data                                                            641

Figure 10. Quantile–quantile plots of modelled (GEM-CaPA, WFDEI, and WFDEI-GEM-CaPA) and observed daily specific humidity.

4   Data availability                                             5   Conclusions

The final product (WFDEI-GEM-CaPA, 1979–2016) is
freely available at the Federated Research Data Repository        Cold region hydrology is very sensitive to the impacts of cli-
at https://doi.org/10.20383/101.0111 (Asong et al., 2018),        mate warming. More physically realistic hydrological mod-
while the original (raw) and corrected CanRCM4 data are           els need to be driven by reliable climate forcing and can pro-
also freely available at https://doi.org/10.20383/101.0162        vide the capability to assess hydrological responses to cli-
(Asong et al., 2019).                                             mate variability and change. However, cold regions such as
                                                                  the Mackenzie River Basin often have sparse surface obser-
                                                                  vations, particularly at high elevations and latitudes where a

www.earth-syst-sci-data.net/12/629/2020/                                           Earth Syst. Sci. Data, 12, 629–645, 2020
642 Z. E. Asong et al.: High-resolution meteorological forcing data
Figure 11. Seasonal cycle of WFDEI-GEM-CaPA, raw, and bias-corrected CanRCM4 data for air temperature (a), precipitation (b), specific
humidity (c), surface pressure (d), wind speed (e), shortwave radiation (f), and longwave radiation (g) during the periods 1979–2008, 2021–
2050, and 2071–2100.
large amount of runoff is generated or important cryosphere drive large-scale hydrological models for climate change im-
processes are impacting the hydrology. A novel approach pact analysis in the MRB. Nevertheless, the WFDEI-GEM-
to developing a long-term dataset using the WFDEI-GEM- CaPA dataset, used here as the reference, has uncertainties
CaPA approach outlined above was necessary to better un- (although it is superior to WFDEI as shown in Figs. 6–11)
derstand and represent the seasonal/inter-annual variability and should be used with caution especially from the perspec-
of hydrological fluxes and the timing of runoff, as well as tive of over-interpreting impact model outputs.
their long-term trends. This dataset is also valuable for bias
correction of climate model projections to assess potential
impacts of future climate change on the hydrology and water Supplement. The supplement related to this article is available
resources of the basin. online at: https://doi.org/10.5194/essd-12-629-2020-supplement.
The raw CanRCM4 outputs were found to have system-
atic biases, which required bias correction towards WFDEI-
GEM-CaPA. There are clear discrepancies between the sea- Author contributions. ZEA, HSW, JWP, AP, and MEE con-
sonal cycle of WFDEI-GEM-CaPA, raw, and bias-corrected ceived and designed the experiment. DP preprocessed the GEM-
CaPA data, AC developed the bias correction model code and
CanRCM4 data. For example, the CanRCM4-simulated cli-
guided the computing procedures, and ZEA performed the compu-
matological daily mean precipitation in June over the MRB
tations. MEE extracted the sample data used in generating Figs. 4
between 1979 and 2008 is ∼ 2.5 mm d−1 while the observed and 5. MEE and ZEA performed the validation against station ob-
value is ∼ 1.5 mm d−1 . This results in a 1.0 mm d−1 wet bias servations. ZEA and MEE prepared the paper with contributions
which can have various implications for quantifying water from all co-authors.
resource availability, management, and adaptation in a fu-
ture changed climate. Therefore, it was crucial to produce the
bias-corrected CanRCM4 outputs prior to using the data to
Earth Syst. Sci. Data, 12, 629–645, 2020 www.earth-syst-sci-data.net/12/629/2020/Z. E. Asong et al.: High-resolution meteorological forcing data 643
Competing interests. The authors declare that they have no con- Beniston, M.: Climatic change in mountain regions: a review of pos-
flict of interest. sible impacts, in: Climate variability and change in high elevation
regions: Past, present & future, Springer, 2003.
Boluwade, A., Zhao, K. Y., Stadnyk, T. A., and Rasmussen, P.: To-
Acknowledgements. Financial support from the Canada Excel- wards validation of the Canadian precipitation analysis (CaPA)
lence Research Chair in Water Security, the NSERC Changing for hydrologic modeling applications in the Canadian Prairies, J.
Cold Regions Network, and the Global Water Futures programme is Hydrol., 556, 1244–1255, 2018.
gratefully acknowledged. Thanks are due to the Meteorological Ser- Brody, S. D., Zahran, S., Maghelal, P., Grover, H., and Highfield, W.
vice of Canada for providing access to the GEM-CaPA data used in E.: The Rising Costs of Floods: Examining the Impact of Plan-
this study. We also thank Graham Weedon for making available the ning and Development Decisions on Property Damage in Florida,
WFDEI dataset. We also appreciate the efforts of Amber Peterson, J. Am. Plann. Assoc., 73, 330–345, 2007.
Data Manager, Global Institute for Water Security, toward archiving Cannon, A. J.: Multivariate quantile mapping bias correction: an N-
the data at the Federated Research Data Repository. dimensional probability density function transform for climate
model simulations of multiple variables, Clim. Dynam., 50, 31–
49, 2018.
Financial support. This research has been supported by the Cannon, A. J., Sobie, S. R., and Murdock, T. Q.: Bias Correction of
Canada First Research Excellence Fund (Global Water Futures pro- GCM Precipitation by Quantile Mapping: How Well Do Methods
gramme), the Natural Sciences and Engineering Research Council Preserve Changes in Quantiles and Extremes?, J. Climate, 28,
of Canada (Changing Cold Regions Network), and the Canada Ex- 6938–6959, 2015.
cellence Research Chairs (Water Security). Chadburn, S. E., Burke, E. J., Essery, R. L. H., Boike, J., Langer,
M., Heikenfeld, M., Cox, P. M., and Friedlingstein, P.: Impact
of model developments on present and future simulations of
permafrost in a global land-surface model, The Cryosphere, 9,
Review statement. This paper was edited by Prasad Gogineni
1505–1521, https://doi.org/10.5194/tc-9-1505-2015, 2015.
and reviewed by two anonymous referees.
Chen, J., Brissette, F. P., Chaumont, D., and Braun, M.: Finding
appropriate bias correction methods in downscaling precipitation
for hydrologic impact studies over North America, Water Resour.
Res., 49, 4187–4205, 2013.
References Chen, J., Li, C., Brissette, F. P., Chen, H., Wang, M., and Essou,
G. R. C.: Impacts of correcting the inter-variable correlation of
Alavi, N., Bélair, S., Fortin, V., Zhang, S., Husain, S. Z., Carrera, climate model outputs on hydrological modeling, J. Hydrol., 560,
M. L., and Abrahamowicz, M.: Warm Season Evaluation of Soil 326–341, 2018.
Moisture Prediction in the Soil, Vegetation, and Snow (SVS) Coopersmith, E. J., Minsker, B. S., and Sivapalan, M.: Patterns of
Scheme, J. Hydrometeorol., 17, 2315–2332, 2016. regional hydroclimatic shifts: An analysis of changing hydro-
Asong, Z. E., Khaliq, M. N., and Wheater, H. S.: Projected logic regimes, Water Resour. Res., 50, 1960–1983, 2014.
changes in precipitation and temperature over the Canadian DeBeer, C. M., Wheater, H. S., Carey, S. K., and Chun, K. P.: Recent
Prairie Provinces using the Generalized Linear Model statistical climatic, cryospheric, and hydrological changes over the interior
downscaling approach, J. Hydrol., 539, 429-446, 2016b. of western Canada: a review and synthesis, Hydrol. Earth Syst.
Asong, Z. E., Razavi, S., Wheater, H. S., and Wong, J. S.: Evalua- Sci., 20, 1573–1598, https://doi.org/10.5194/hess-20-1573-2016,
tion of Integrated Multi-satellitE Retrievals for GPM (IMERG) 2016.
over Southern Canada against Ground Precipitation Observa- Demaria, E. M. C., Roundy, J. K., Wi, S., and Palmer, R. N.: The
tions: A Preliminary Assessment, J. Hydrometeor., 18, 1033– Effects of Climate Change on Seasonal Snowpack and the Hy-
1050, https://doi.org/10.1175/JHM-D-16-0187.1, 2017. drology of the Northeastern and Upper Midwest United States, J.
Asong, Z. E., Wheater, H., Pomeroy, J., Pietroniro, A., and Elshamy, Climate, 29, 6527–6541, 2016.
M.: A Bias-Corrected 3-hourly 0.125 Gridded Meteorological Dibike, Y., Prowse, T., Bonsal, B., and O’Neil, H.: Implica-
Forcing Data Set (1979–2016) for Land Surface Modeling in tions of future climate on water availability in the west-
North America, https://doi.org/10.20383/101.0111, 2018. ern Canadian river basins, Int. J. Climatol., 37, 3247–3263,
Asong, Z. E., Wheater, H., Pomeroy, J., Pietroniro, A., Elshamy, https://doi.org/10.1002/joc.4912, 2016.
M., Princz, D., and Cannon, A.: High-Resolution Meteoro- Diffenbaugh, N. S., Scherer, M., and Ashfaq, M.: Re-
logical Forcing Data for Hydrological Modelling and Cli- sponse of snow-dependent hydrologic extremes to con-
mate Change Impact Analysis in Mackenzie River Basin, tinued global warming, Nat. Clim. Change, 3, 379–384,
https://doi.org/10.20383/101.0162, 2019. https://doi.org/10.1038/nclimate1732, 2012.
Barnett, T. P., Adam, J. C., and Lettenmaier, D. P.: Po- Dumanski, S., Pomeroy, J. W., and Westbrook, C. J.: Hydrological
tential impacts of a warming climate on water avail- regime changes in a Canadian Prairie basin, Hydrol. Process., 29,
ability in snow-dominated regions, Nature, 438, 303–309, 3893–3904, 2015.
https://doi.org/10.1038/nature04141, 2005. Eum, H.-I., Dibike, Y., Prowse, T., and Bonsal, B.: Inter-comparison
Behnke, R., Vavrus, S., Allstadt, A., Albright, T., Thogmartin, W. of high-resolution gridded climate data sets and their implication
E., and Radeloff, V. C.: Evaluation of downscaled, gridded cli- on hydrological model simulation over the Athabasca Watershed,
mate data for the conterminous United States, Ecol. Appl., 26, Canada, Hydrol. Process., 28, 4250–4271, 2014.
1338–1351, 2016.
www.earth-syst-sci-data.net/12/629/2020/ Earth Syst. Sci. Data, 12, 629–645, 2020644 Z. E. Asong et al.: High-resolution meteorological forcing data Fang, X., Pomeroy, J. W., Ellis, C. R., MacDonald, M. K., De- Change and Mountain Regions: An Overview of Current Knowl- Beer, C. M., and Brown, T.: Multi-variable evaluation of hy- edge, edited by: Huber, U. M., Bugmann, H. K. M., and Rea- drological model predictions for a headwater basin in the Cana- soner, M. A., Springer Netherlands, Dordrecht, 2005. dian Rocky Mountains, Hydrol. Earth Syst. Sci., 17, 1635–1659, Meyer, J., Kohn, I., Stahl, K., Hakala, K., Seibert, J., and Cannon, https://doi.org/10.5194/hess-17-1635-2013, 2013. A. J.: Effects of univariate and multivariate bias correction on Fortin, V., Jean, M., Brown, R., and Payette, S.: Predicting snow hydrological impact projections in alpine catchments, Hydrol. depth in a forest–tundra landscape using a conceptual model al- Earth Syst. Sci., 23, 1339–1354, https://doi.org/10.5194/hess-23- lowing for snow redistribution and constrained by observations 1339-2019, 2019. from a digital camera, Atmos.-Ocean, 53, 200–211, 2015a. Milly, P. C. D., Betancourt, J., Falkenmark, M., Hirsch, R. M., Fortin, V., Roy, G., Donaldson, N., and Mahidjiba, A.: Assimila- Kundzewicz, Z. W., Lettenmaier, D. P., and Stouffer, R. J.: Sta- tion of radar quantitative precipitation estimations in the Cana- tionarity Is Dead: Whither Water Management, Science, 319, dian Precipitation Analysis (CaPA), J. Hydrol., 531, 296–307, 573–574, 2008. 2015b. Park, H., Yoshikawa, Y., Oshima, K., Kim, Y., Ngo-Duc, T., Kim- Gbambie, A. S. B., Poulin, A., Boucher, M.-A., and Arsenault, R.: ball, J. S., and Yang, D.: Quantification of Warming Climate- Added Value of Alternative Information in Interpolated Precipi- Induced Changes in Terrestrial Arctic River Ice Thickness and tation Datasets for Hydrology, J. Hydrometeorol., 18, 247–264, Phenology, J. Climate, 29, 1733–1754, 2016. 2017. Pomeroy, J. W. and Li, L.: Prairie and arctic areal snow cover mass Gudmundsson, L., Bremnes, J. B., Haugen, J. E., and Engen- balance using a blowing snow model, J. Geophys. Res.-Atmos., Skaugen, T.: Technical Note: Downscaling RCM precipitation 105, 26619–26634, 2000. to the station scale using statistical transformations – a com- Prowse, T. D. and Beltaos, S.: Climatic control of river-ice hydrol- parison of methods, Hydrol. Earth Syst. Sci., 16, 3383–3390, ogy: a review, Hydrol. Process., 16, 805–822, 2002. https://doi.org/10.5194/hess-16-3383-2012, 2012. Reiter, P., Gutjahr, O., Schefczyk, L., Heinemann, G., and Casper, Hou, A. Y., Kakar, R. A., Neeck, S., Azarbarzin, A. A., Kummerow, M.: Bias correction of ENSEMBLES precipitation data with fo- C. D., Kojima, M., Oki, R., Nakamura, K., and Iguchi, T.: The cus on the effect of the length of the calibration period, Meteorol. Global Precipitation Measurement Mission, B. Ame. Meteorol. Z., 25, 85–96, 2016. Soc., 95, 701–722, 2014. Sapiano, M. R. P. and Arkin, P. A.: An Intercomparison and Vali- IPCC: Climate Change 2013: The Physical Science Basis. Contri- dation of High-Resolution Satellite Precipitation Estimates with bution of Working Group I to the Fifth Assessment Report of the 3-Hourly Gauge Data, J. Hydrometeorol., 10, 149–166, 2009. Intergovernmental Panel on Climate Change, Cambridge Uni- Schoetter, R., Hoffmann, P., Rechid, D., and Schlünzen, K. H.: Eval- versity Press, Cambridge, United Kingdom and New York, NY, uation and Bias Correction of Regional Climate Model Results USA, 2013. Using Model Evaluation Measures, J. Appl. Meteorol. Clim., 51, Islam, S. U., Déry, S. J., and Werner, A. T.: Future Climate Change 1670–1684, 2012. Impacts on Snow and Water Resources of the Fraser River Basin, Schulzweida, U., Kornblueh, L., and Quast, R.: Climate data opera- British Columbia, J. Hydrometeorol., 18, 473–496, 2017. tors, Max-Planck-Institute for Meteorology, Hamburg, available Kane, D. L., Hinzman, L. D., Woo, M.-K., and Everett, K. R.: Arctic at: http://www.mpimet.mpg.de/~cdo (last access: 29 May 2019), hydrology and climate change, in: Arctic ecosystems in a chang- 2004. ing climate, Elsevier, 1991. Sheffield, J., Goteti, G., and Wood, E. F.: Development of a 50-Year Mahfouf, J. F., Brasnett, B., and Gagnon, S.: A Canadian precipi- High-Resolution Global Dataset of Meteorological Forcings for tation analysis (CaPA) project: Description and preliminary re- Land Surface Modeling, J. Climate, 19, 3088–3111, 2006. sults, Atmos.-Ocean, 45, 1–17, 2007. Sippel, S., Otto, F. E. L., Forkel, M., Allen, M. R., Guillod, B. Maraun, D.: Bias Correcting Climate Change Simulations – a Criti- P., Heimann, M., Reichstein, M., Seneviratne, S. I., Thonicke, cal Review, Current Climate Change Reports, 2, 211–220, 2016. K., and Mahecha, M. D.: A novel bias correction methodology Maraun, D.: Bias Correction, Quantile Mapping, and Downscaling: for climate impact simulations, Earth Syst. Dynam., 7, 71–88, Revisiting the Inflation Issue, J. Climate, 26, 2137–2143, 2013. https://doi.org/10.5194/esd-7-71-2016, 2016. Maraun, D., Shepherd, T. G., Widmann, M., Zappa, G., Walton, Stocker, T. F., Qin, D., Plattner, G.-K., Alexander, L. V., Allen, S. D., Gutiérrez, J. M., Hagemann, S., Richter, I., Soares, P. M. K., Bindoff, N. L., Breìon, F.-M., Church, J. A., Cubasch, U., M., Hall, A., and Mearns, L. O.: Towards process-informed bias Emori, S., Forster, P., Friedlingstein, P., Gillett, N., Gregory, J. correction of climate change simulations, Nat. Clim. Change, 7, M., Hartmann, D. L., Jansen, E., Kirtman, B., Knutti, R., Kr- 764–773, https://doi.org/10.1038/nclimate3418, 2017. ishna Kumar, K., Lemke, P., Marotzke, J., Masson-Delmotte, V., Maraun, D., Wetterhall, F., Ireson, A. M., Chandler, R. E., Kendon, Meehl, G. A., Mokhov, I. I., Piao, S., Ramaswamy, V., Randall, E. J., Widmann, M., Brienen, S., Rust, H. W., Sauter, T., The- D., Rhein, M., Rojas, M., Sabine, C., Shindell, D., Talley, L. meßl, M., Venema, V. K. C., Chun, K. P., Goodess, C. M., D., Vaughan, D. G., and Xie, S.-P.: Technical Summary, in: Cli- Jones, R. G., Onof, C., Vrac, M., and Thiele-Eich, I.: Precipita- mate Change 2013: The Physical Science Basis. Contribution of tion downscaling under climate change: Recent developments to Working Group I to the Fifth Assessment Report of the Intergov- bridge the gap between dynamical models and the end user, Rev. ernmental Panel on Climate Change, edited by: Stocker, T. F., Geophys., 48, RG3003, https://doi.org/10.1029/2009RG000314, Qin, D., Plattner, G.-K., Tignor, M., Allen, S. K., Boschung, J., 2010. Nauels, A., Xia, Y., Bex, V., and Midgley, P. M., Cambridge Uni- Martin, E. and Etchevers, P.: Impact of Climatic Changes on Snow versity Press, Cambridge, United Kingdom and New York, NY, Cover and Snow Hydrology in the French Alps, in: Global USA, 2013. Earth Syst. Sci. Data, 12, 629–645, 2020 www.earth-syst-sci-data.net/12/629/2020/
You can also read