Catalyzing Policing Reform with Data - Policing Typology for Los Angeles Neighborhoods
←
→
Page content transcription
If your browser does not render page correctly, please read the page content below
CRIME AND JUSTICE

RE S E AR CH RE P O R T

Catalyzing Policing Reform with Data
Policing Typology for Los Angeles Neighborhoods

Ashlin Oglesby-Neal       Alena Stern            Kathryn L. S. Pettit
May 2020
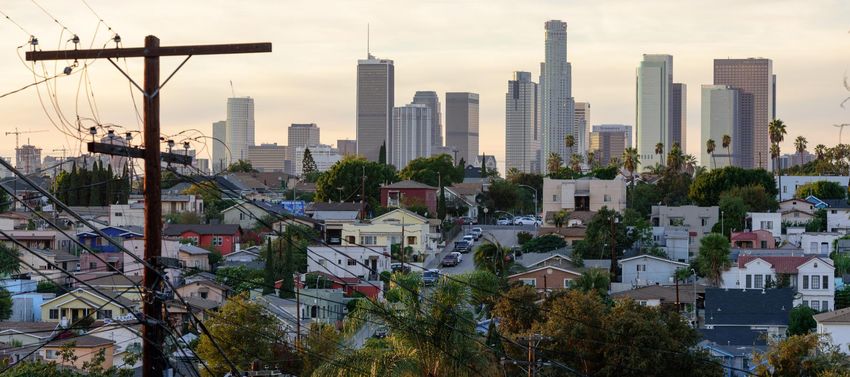
AB O U T T HE U R BA N I NS T I T U TE
The nonprofit Urban Institute is a leading research organization dedicated to developing evidence-based insights
that improve people’s lives and strengthen communities. For 50 years, Urban has been the trusted source for
rigorous analysis of complex social and economic issues; strategic advice to policymakers, philanthropists, and
practitioners; and new, promising ideas that expand opportunities for all. Our work inspires effective decisions that
advance fairness and enhance the well-being of people and places.

Copyright © May 2020. Urban Institute. Permission is granted for reproduction of this file, with attribution to the
Urban Institute. Cover image by Hayk_Shalunts/Shutterstock.

Contents
Acknowledgments                        iv

Catalyzing Policing Reform with Data   1
  Background                            2
  Methodology                           4
  Results                               8
  Community-Police Conversations       18

Appendix. Additional Metrics           22

Notes                                  24

References                             26

About the Authors                      28

Statement of Independence              29
Acknowledgments
This report was sponsored by Microsoft. Kevin Miller and Elizabeth Grossman were invaluable thought
partners throughout this project. We are grateful to them and to all our funders, who make it possible
for Urban to advance its mission. The Microsoft Data Science and Analytics team—Rahul Dodhia and
Allen Kim—helped in data exploration, provided advice on the methodology, and helped produce the
Power BI data visualization that allows us to share the data in a user-friendly way.

    The views expressed are those of the authors and should not be attributed to the Urban Institute,
its trustees, or its funders. Funders do not determine research findings or the insights and
recommendations of Urban experts. Further information on the Urban Institute’s funding principles is
available at urban.org/fundingprinciples.

    Dean Obermark, formerly of the Urban Institute, participated in the early part of the National
Neighborhood Indicators Partnership project and identifying Los Angeles as our partner site. Tracey
Lloyd, also formerly of Urban, formed the research questions focused on exploring resident-initiated
versus police-initiated activity. At the University of Southern California (USC) Sol Price Center for
Social Innovation, Caroline Bhalla and Elly Schoen collaborated in data preparation and indicator
construction, helped us understand the geography of Los Angeles, and gave us ideas on how the analysis
might interest residents. We also greatly appreciate the insights of our external reviewers, Lieutenant
Christopher Chase of the Los Angeles Police Department, Gary Painter of the USC Sol Price Center for
Social Innovation, and Erroll Southers and Jessie Redd of the USC Safe Communities Institute.
Internally, this report was improved by the review of Claire Bowen, Leah Hendey, Nancy La Vigne, and
Daniel Lawrence of the Urban Institute.

     IV                                                                          ACKNOWLEDGMENTS
Catalyzing Policing Reform with
Data
Public scrutiny of police in the US—especially regarding racial disparities—has increased
in recent years, with many communities experiencing strained relations with their local
police. Police departments have also increased transparency by making some data
about their activity (primarily arrests and reported crimes) public. However, access to
high-quality, disaggregated police data is insufficient—these data must also be analyzed
to inform and empower people in communities most affected by crime and the justice
system as well as to benefit law enforcement agencies and policymakers. When
meaningfully analyzed and shared, these data can support conversations between
communities and police and catalyze local reforms.
Local organizations in the National Neighborhood Indicators Partnership (NNIP)—a learning
network coordinated by the Urban Institute that connects independent partner organizations in 30
cities—regularly provide data and analysis to support discussions about key issues in their communities.
The NNIP’s mission is to ensure all communities can access data and have the skills to use information
to advance equity and well-being across neighborhoods. In 2018, NNIP and Microsoft partnered to use
the network to spur data-driven and community-led criminal justice reforms with the goal of building
police-community trust and improving public safety.1
As one of the project’s activities, we selected one city—Los Angeles—to explore how we could
create a comprehensive measure of community-police engagement using publicly available police data.
Our motivating research questions are the following:
◼ Are there different patterns of community-initiated and police-initiated engagement?
◼ How many distinct patterns are there, and what makes them distinct?
◼ How do the patterns of community-police engagement vary across neighborhoods?
In collaboration with the Microsoft Criminal Justice Reform team, the Microsoft Data Science team,
and the University of Southern California’s Sol Price Center for Social Innovation (Los Angeles’s local
NNIP partner), we synthesized data sources (including information on calls for service, stops, arrests,
and crime) to develop a typology that elucidates the relationship between resident-initiated and police-
initiated activity, as well as how that relationship varies across Los Angeles neighborhoods. Ourtypology of community-police interactions reveals patterns in how calls to police and police activity
(which varies by the severity of crime and levels of economic hardship) differ across neighborhoods.
We also discuss how this neighborhood-policing typology can inform conversations about police
reform and support local movements for a more equitable criminal justice system. We hope this report
informs conversations in Los Angeles and demonstrates how open data can be a powerful tool for local
data organizations and criminal justice advocates nationwide.
Background
Our typology of policing in Los Angeles neighborhoods builds on the body of research on community-
police relations and policing approaches. We expect resident-initiated contact to vary across
neighborhoods because of differences in reported crime, police-initiated activity, and community trust
in and sentiments toward police. Similarly, we anticipate police-initiated activity to vary by reported
crime and departmental priorities.
Community Trust in Police
Strong community-police relationships are essential to public safety, and these relationships influence
how communities engage with the police. Public sentiment toward and trust in police varies by
demographics, rates of reported crime, and types of police activity. Surveys and interviews have found
disparities between Black and white residents’ attitudes toward police, though not between their
willingness to report crime (Bobo and Thompson 2005). White residents are the most likely to report
satisfaction with city and neighborhood police, followed by Hispanic and Black residents (Weitzer and
Tuch 2005). Spanish-speaking Hispanic residents are the least likely to call the police, even if they
perceive big neighborhood problems (Skogan 2005). Moreover, studies exploring the influence of
neighborhood characteristics show that people living in high-crime areas are less satisfied with the
police.2 Furthermore, neighborhoods with concentrated economic disadvantage are more dissatisfied
with the police (Sampson and Bartusch 1998). Fear of crime and victimization is also associated with
lower satisfaction (Carter 1985).
The types of police activity and the nature of community-police contact can also influence
neighborhoods’ sentiment toward police. Skogan (2005) found that residents are more satisfied with
resident-initiated (voluntary) encounters than police-initiated (involuntary) encounters. Moreover,
when police use procedural justice principles (e.g., fairness, transparency) during interactions, residents
2 CATALYZING POLICING REFORM WITH DATAoften feel more satisfied and consider the police more legitimate (Mazerolle et al. 2013). Vicarious police interactions—interactions that people hear others have had with police—also significantly influence people’s satisfaction with police (Rosenbaum et al. 2005; Weitzer and Tuch 2005). Community sentiment is difficult to measure and researchers often use calls for service as an easily accessible (although imperfect) metric for gauging residents’ views of police legitimacy. However, high- profile police misconduct can make residents less willing to call the police and report crime (Desmond, Papachristos, and Kirk 2016). In our analysis, we treat calls for service as a proxy for community trust in the police and anticipate that levels and types of calls will vary depending on neighborhoods’ demographics, crime levels, and experiences with policing. Policing Strategies Just as community engagement with and sentiment toward police vary across cities, so do the police’s strategies and activities. Primary policing activities (which fit into various policing strategies) include patrol, incident response, emergency response, and criminal investigation. Reactively responding to calls for service is one long-standing strategy. Others are more proactive, such as problem-oriented policing, where police identify and respond to specific problems contributing to crime and disorder (Eck and Spelman 1987; Goldstein 1979). Other common approaches include hot spot policing— concentrated, place-based policing in small geographic areas with high levels of crime (Sherman and Weisburd 1995)—and disorder policing—focusing on physical and social disorder to prevent neighborhood decline and more serious crime.3 Another popular strategy is community policing, where the police partner with community members to identify problems and develop and implement solutions (Trojanowicz and Bucqueroux 1990). Policing in Los Angeles Although this report does not examine the Los Angeles Police Department’s (LAPD’s) specific policing approaches, we anticipate that the varying levels and types of police activity across neighborhoods will signal differences in how LAPD deploys various strategies, differences that community stakeholders can explore. Understanding local context is critical when analyzing people’s experiences with policing and when considering how to leverage findings to improve community-police relations. The LAPD had 9,988 sworn officers in 2017, and it currently serves more than 4 million people (Kaplan 2019). The department has a multifaceted history that includes being a national leader in major policing innovations while also experiencing high-profile occurrences of police violence and misconduct. Like CATALYZING POLICING REFORM WITH DATA 3
the criminal justice system nationally, the department has long faced concerns about racially disparate
practices. Black residents constitute 9 percent of the city’s population but experience 31 percent of
LAPD arrests (Bryan et al. 2019). During traffic stops, Black and Hispanic residents are more likely to be
searched than white residents, but searches of white residents yield illegal items at a slightly higher
rate.4 The LAPD has aided examinations of these disparities by publicly sharing data dating back to
2010 on calls for service, stops, arrests, and crimes. In our examination of patterns of resident-initiated
and police-initiated activity, we anticipate varied levels of community trust (as measured by
community-initiated calls for service), different policing patterns across the city, and demographic
disparities among residents’ and neighborhoods’ engagement with the police.

Methodology
In this analysis, we explore how a typology of policing activity—one reflecting indicators of resident-
initiated and police-initiated activity—elucidates how Los Angeles residents in different neighborhoods
experience policing differently. Moreover, we document the characteristics of crime and of residents
across the typology’s different groups. To do this, we use several publicly available data sources and
cluster analysis (a type of machine learning) to create and test the typology. A detailed explanation of
our data sources and analytic methodology are available in a companion technical appendix. 5 In
addition, with the assistance of the Microsoft Data Science and Analytics team, we have created an
interactive Power BI data tool that allows users to visualize and explore the typology and individual
indicators from the analysis.6

Data and Key Indicators
Our data come from three sources: (1) policing data from the City of Los Angeles Police Department, (2)
data on resident characteristics from the American Community Survey, and (3) quantities of addresses
from the US Postal Service. We do not use data from other law enforcement agencies that have
jurisdiction in Los Angeles.7

POLICING DATA
The policing-related data are publicly available on the City of Los Angeles’s open data portal and include
all LAPD arrests, calls for service, stops, and crimes since 2010. 8 The data are published at the incident
(i.e., call for service, stop, arrest, or crime) level. For each unique event, the portal provides information
on the incident type and the person’s demographic characteristics if applicable and available. 9 Each

      4                                                    CATALYZING POLICING REFORM WITH DATA
observation in the LAPD data is coded with the reporting district (a geographic unit used for police
operations) where it occurred. At the time of our analysis, LAPD had 1,135 reporting districts with an
average district size of 0.42 square miles. We aggregate 2018 events to the reporting-district level such
that our unit of analysis is a reporting district in 2018. We include all reporting districts regardless of
their population size because policing activity can occur in nonresidential areas.
We only use data from 2018, the most recent full year for which data were available at the time of
our analysis. Using multiple years would produce multiple observations for each reporting district, and
the same reporting district could be assigned to multiple clusters. We tested models that include
variables on changes over time and found they did not meaningfully change the results. We decided that
the value of incorporating multiple years did not merit complicating the analysis with cluster
assignments over time.
With the LAPD data, we created measures for analysis in three primary categories: resident-
initiated activity, police-initiated activity, and reported crime. We define the proxy measure of resident-
initiated activity as calls for service made by people in Los Angeles. Calls for service are incidents where
people call 911 to request police services for emergencies and nonemergencies. People can make calls
to report things including crimes, traffic crashes, road hazards, suspicious activity, injured persons, and
missing persons. With input from LAPD, we narrowed the data on calls for service to resident-initiated
calls only by excluding calls generated by the dispatch system or police. This is how we define “calls” and
“calls for service” throughout this report. Within the category of resident-initiated calls for service, we
distinguish calls for serious emergencies, defined as murder, kidnapping, robbery, battery, assault with a
deadly weapon, or child abuse. We created rates of calls for service for each reporting district based on
the city’s population rather than each reporting district’s population because calls for service in
particular districts may not have originated from people living in them.
Our analysis also contributes an aggregate measure of police-initiated activity, including stops and
arrests. Police can stop (i.e., temporarily detain for investigative purposes) both vehicles and
pedestrians. Traffic (vehicle) stops can occur for many reasons, including moving violations, equipment
violations, and reasonable suspicion of criminal activity. Police also use reasonable suspicion of criminal
activity to justify pedestrian stops, such as when a person matches a reliable lookout, displays
characteristics of being armed, or engages in activity perceived as suspicious and unusual. Officers must
base reasonable suspicion on specific and articulable facts, and it often involves multiple factors that in
totality lead a reasonable officer to suspect a person’s engagement in criminal activity. Pedestrian and
vehicle stops can both lead to protective pat downs (frisks), searches, and/or arrest. An arrest occurs
CATALYZING POLICING REFORM WITH DATA 5when police have probable cause to believe a person committed a specific crime and take them into
custody. We also created variables that distinguish juvenile from adult arrests.
We created rates of overall stops, traffic stops, pedestrian stops, and arrests for each LAPD
reporting district. As with calls for service, police-initiated activity may involve people who reside
outside the reporting district. Thus, we use the relevant Los Angeles population (e.g., total population,
juvenile population) as the denominator. We calculated rates of stops and arrests by race by dividing
the number of people of a given race stopped or arrested in a reporting district by the total population
of that race in Los Angeles.10
We measure reported crime as crime reported to and recorded by LAPD. Although a crime may be
associated with an arrest, many crimes do not result in arrest. Crimes are commonly categorized by
severity. Following the Uniform Crime Report classification system for LAPD,11 we categorize crimes
into Part 1 Violent (homicide, rape, robbery, and aggravated assault), Part 1 Property (burglary, motor
vehicle theft, and theft), and Part 2 (all other crime categories). For each reporting district, we created
rates for overall crime and the subcategories by dividing a given reporting district’s crime count by the
total Los Angeles population.
RESIDENT CHARACTERISTIC DATA
We used the 2013–17 American Community Survey12 (the most recent data available at the time of our
analysis) for data on resident demographics and other characteristics, such as racial composition,
immigration status, poverty, educational attainment, and share of renter households. 13 The University
of Southern California (USC) Sol Price Center for Social Innovation team assisted with the processing of
the American Community Survey data. Because our focus is creating a typology that demonstrates how
policing varies across Los Angeles, we only use resident characteristics to describe the groups resulting
from the cluster analysis and to analyze who is most affected by greater police contact, not to
determine the cluster assignments.
ADDRESS DATA
We hypothesize that the number of stops in a reporting district as well as the breakdown of vehicle
versus pedestrian stops is influenced by the reporting district’s built environment. We suspect that
denser neighborhoods will experience more stops and that the proportion of pedestrian stops is likely
to be higher in denser, more walkable areas. We use the US Department of Housing and Urban
Development aggregated census tract–level US Postal Service data on address vacancy to determine
neighborhood address density as a proxy for the built environment of neighborhoods. 14 For each
6 CATALYZING POLICING REFORM WITH DATAreporting district, we calculated the density of business, residential, and overall addresses per square
mile.
Analysis Method
To create a typology of community-police activity, we conduct a machine learning cluster analysis of
reporting districts based on their resident-initiated activity, police-initiated activity, and crimes in 2018.
Researchers have used cluster analysis widely to develop neighborhood typologies that illuminate
various patterns, including commuting behavior (Manaugh, Miranda-Moreno, and El-Geneidy 2009),
immigrant neighborhood types (Vicino, Hanlon, and Short 2011), social capital (Sampson and Graif
2009), social problems (Chow 1998), and socioeconomic and demographic characteristics (Li and
Chuang 2009). In the criminal justice literature, researchers have used cluster analysis to develop
typologies of officers by occupational attitudes and burnout types (Loo 2004; Paoline 2004). Cluster
analysis is valuable for generating typologies because it enables researchers to distill numerous input
variables into a discrete number of types. Broadly, the goal of any cluster analysis is to create groupings
of observations that maximize the similarity of observations in the same group and the differences
between groups (Bahr, Bielby, and House 2011). Cluster analysis allows us to group reporting districts
together based on their similarities regarding the 17 input variables on calls for service, crime, stops,
and arrests.15 This enables us to draw novel connections between similar reporting districts that would
not be apparent by simply looking at geographic relationships or analyzing our input variables in
isolation.
We tested three clustering algorithms that take different approaches to grouping observations into
clusters: k-means clustering, agglomerative hierarchical clustering, and gaussian mixture models
clustering. Each algorithm assigns reporting districts to clusters to simultaneously optimize for
maximizing the similarity of the members of the same cluster and the difference between clusters. Each
approach has unique strengths and weaknesses based on several factors, including computational
intensity, alignment with the underlying distribution of the data, and parameters that researchers must
define or let the machine learn. Ultimately, we found that the gaussian mixture model algorithm with
five clusters produced was the best fit for the underlying data and had a more even distribution of
reporting districts across groups. Using the clusters, we then conducted several descriptive analyses to
explore how the clusters vary in terms of policing activity types, racial disparities, and neighborhood
characteristics.
CATALYZING POLICING REFORM WITH DATA 7Limitations
Our typology has several data and methodological limitations. First, our measures of stops and arrests
are based on officially reported police data, which may contain errors or biases. Second, we only include
reported crime, which often vastly underestimates actual crime (Biderman and Reiss 1967; Skogan
1977). Ideally, we would include more metrics that capture resident views and policing activity, such as
public sentiment, complaints, use-of-force incidents, or assaults on officers. It also would have been
helpful to include all law enforcement agencies operating in Los Angeles County, which would allow us
to create a comprehensive measure of policing activity in the City of Los Angeles and the surrounding
areas. Finally, our cluster analysis only focuses on one year of data (2018). Repeating the analysis for
multiple years could clarify how crime, resident-initiated activity, and police-initiated activity change
over time.
Results
Our cluster analysis of policing-related variables results in five unique groupings, each with a distinct 16
combination of resident-initiated activity, police-initiative activity, and reported crime. We refer to the
five unique clusters as groups. Table 1 shows the average value of our policing indicators by group and
includes total population for reference (see appendix table A.1 for additional information). The groups
range from very low rates of resident- and police-initiated activity in group one to high rates in group
five. The five groups are sets of reporting districts with similar levels of crime, calls for service, stops,
and arrests. In this section, we present key takeaways based on overall patterns and differences in
policing variables and resident characteristics between the groups.
TABLE 1
Average Value of Key Metrics in Reporting District by Group
Group 1 Group 2 Group 3 Group 4 Group 5
(n=231) (n=271) (n=284) (n=201) (n=148)
Variable
Calls for service 196 488 762 1,121 1,753
Part 1 violent crimes 10 31 56 88 172
Pedestrian stops 21 78 134 222 580
Traffic stops 94 244 389 625 1,373
Arrests 15 44 67 111 306
Population 1,612 3,051 4,031 4,631 4,563
The groups vary across LAPD reporting districts (figure 1). Some areas have concentrated patterns,
including group 1 (blue) in Westside (which includes the Brentwood, Westwood, and Pacific Palisades
8 CATALYZING POLICING REFORM WITH DATAneighborhoods) and group five (pink) in south Los Angeles (which includes the Florence and Watts
neighborhoods). However, most of the city has a mix of adjacent groups. This confirms that one cannot
make broad assumptions about policing experiences based on geography, and it raises useful questions
about local drivers of differences. Appendix figure A.1 provides a map of the reporting districts with a
neighborhood overlay.
FIGURE 1
Reporting District Group Assignment Map
URBAN INSTITUTE
Levels of the measures of interest vary across the groups but generally increase from group one to
group five. Group one has the lowest rates of calls for service, crime, arrests, and stops, whereas group
CATALYZING POLICING REFORM WITH DATA 9five has the highest (figure 2). The increase in each activity type is steady from group one to group four,
but a much larger increase exists from group four to group five. We refer to this pattern of all the
activity types (i.e., calls for service, crime, stops, and arrests) increasing together as “increasing activity.”
The rest of this report’s results section examines patterns in this increasing activity.
FIGURE 2
All Activity Rates Increase from Group One to Group Five
Calls for service, stops, arrests, and crimes per 1,000 group residents
URBAN INSTITUTE
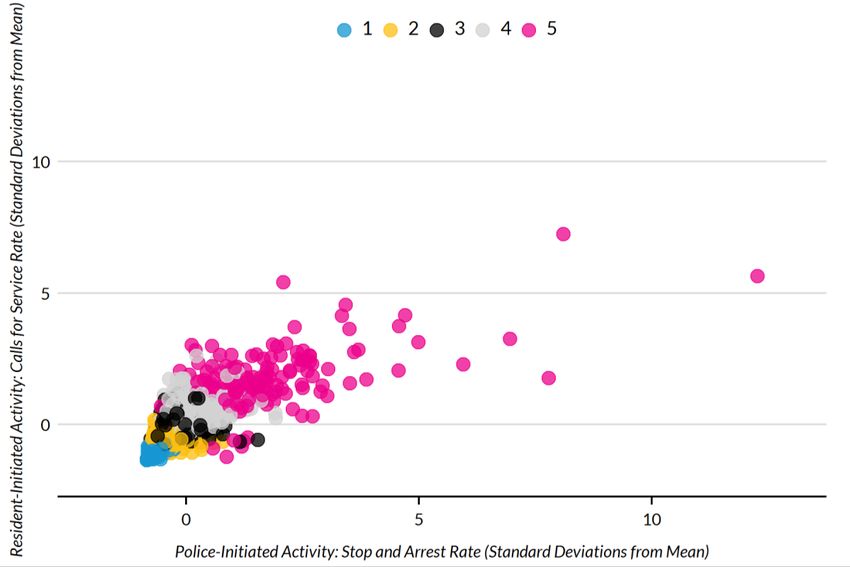
Resident- and Police-Initiated Activity Increase Together
Resident- and police-initiated activity generally increase across groups (figure 3). The group-one
reporting districts have resident- and police-initiated activity lower than the city average. Groups two
and three have activity close to the city average, and activity in groups four and five is generally higher
than the city average. This finding is intuitive because police may dedicate more resources in areas with
more calls for service, leading to more stops and arrests.
10 CATALYZING POLICING REFORM WITH DATAFIGURE 3
Resident Calls and Police Activity Increase across Groups
Resident-initiated activity by police-initiated activity for each reporting district by group assignment
URBAN INSTITUTE
Interestingly, resident-initiated and police-initiated activity do not increase at the same rate across
the groups (table 2). That is, moving from group one to group five, the increase in police-initiated
activity outpaces the increase in resident-initiated activity. Notably, group five is the only group that
experiences more police-initiated contact than resident-initiated contact on average. This suggests that
the police use different strategies in higher-activity groups and/or that residents in these groups are
less willing to call the police.
CATALYZING POLICING REFORM WITH DATA 11TABLE 2
Highest-Activity Group Has Significantly Lower-than-Expected Resident Calls Given Police Activity
Ratio of resident-initiated contact to police-initiated contact by group
Group 1 Group 2 Group 3 Group 4 Group 5
Ratio of resident-initiated to 1.51 1.33 1.29 1.17 0.78
police-initiated contact
As Activity Increases, So Does Severity
The high-activity districts in groups four and five experience more calls for service, crime, and police
activity. As activity increases across groups, the composition of each activity also changes. The higher-
activity groups have a greater share of calls for service that are serious and crimes that are violent
(figure 4). For example, 11 percent of group one’s calls are serious, compared with 22 percent of group
five’s. The high-activity groups also have a higher percentage of stops that are of pedestrians rather
than vehicles. The high-activity groups have different built environments (i.e., greater address density),
which may influence the higher pedestrian-stop rate. For people stopped on foot rather than in a
vehicle, stops can feel more intrusive and strongly influence views of police legitimacy. The increased
activity and severity indicate that the neighborhoods have greater public safety concerns and that
resident perceptions of safety and experiences with the police likely differ from those in neighborhoods
with low activity.
12 CATALYZING POLICING REFORM WITH DATAFIGURE 4
Group Five Has Greatest Percentage of Severe Activity across Types
Percent of severe activity by group
URBAN INSTITUTE
Crime, calls for service, stops, and arrests are generally concentrated in groups four and five. This
may owe to police increasing activity in crime “hot spots” or spending more time in those areas because
of frequent calls for service. Despite having the greatest share of serious calls for service and violent
crime, group five had less resident-initiated contact than we would expect given its level of police-
initiated contact. Moreover, group five had the greatest share of serious calls for service and violent
crime. The lower ratio of calls for service, combined with the increased severity of the calls and crime,
may indicate that residents have a higher severity threshold for when they call the police or that they
are less willing to request police services.
As Activity Increases, So Do Racial Disparities
As activity increases from groups one to five, racial and ethnic disparities in stops and arrests generally
widen. Figure 5 shows the per capita stop rate for each racial and ethnic group increasing from group
one to group five. The stop rates in figure 5 are calculated by summing the number of stops of people of
CATALYZING POLICING REFORM WITH DATA 13a given race across all reporting districts in the group and dividing by the total population of that race
across all reporting districts in the group. Although the people stopped in a particular group may not live
in one of that group’s reporting districts, calculating the rates in this way is important to account for the
different racial composition by group (table 3). For example, the Black population rate in group five is six
times that in group one.
FIGURE 5
Though Stop Rates Increase for All Races across Groups, the Stop Rate Is Highest among Black People
Stop rate per capita by race and by group
URBAN INSTITUTE
Across all groups, the per capita stop rate is lowest for Asian people, followed by white, Hispanic,
and Black people (figure 5). When examining stop rates per capita for each race separately, the rate of
increase between groups varies. For example, Black people in group five are three times more likely to
be stopped than in group one, and white people in group five are nine times more likely to be stopped
than in group one. However, across all groups and their varied activity levels, Black people are stopped
at the highest rate. Reporting districts in groups four and five have a greater share of Black and Hispanic
residents and still have higher per capita stop rates of Black and Hispanic people. We also find the same
14 CATALYZING POLICING REFORM WITH DATApatterns of racial disparity for arrest rates. Although people of all races experience increased police
contact in the high-contact groups, this experience is especially frequent for Black and Hispanic people.
TABLE 3
Racial/Ethnic Composition of Reporting Districts by Group
Group 1 Group 2 Group 3 Group 4 Group 5
(n=231) (n=271) (n=284) (n=201) (n=148)
Population Percentage
Asian 13.4 14.3 12.0 10.5 7.4
Black 3.4 4.2 6.9 8.3 20.1
Hispanic 22.9 39.8 51.5 58.0 56.2
White 56.5 38.3 26.8 20.9 14.1
Residents Experiencing Economic Hardship Are More Likely to Live in Areas with
Higher Activity
We also explore how different groups of people in Los Angeles are affected by policing, particularly in
the high-activity groups, because people’s circumstances and neighborhood resources influence their
engagement with police, crime patterns and opportunity, and policing activity. People facing economic
hardship—as measured by the share of people with incomes less than 200 percent of the poverty
line17—are more likely to live in areas with high activity (figure 6). Greater economic hardship may
impact the types of community resources available. Similarly, the share of people with limited English
proficiency increases across groups, meaning more people in high-activity groups may have difficulty
communicating with local police. The share of noncitizen immigrants is also higher in the higher-contact
groups, and noncitizens may be less likely to engage with the police or make calls for service. Regarding
housing factors, the share of people who rent is also higher as activity rises, which could affect
community connections because renters move more often than people who own their homes.
CATALYZING POLICING REFORM WITH DATA 15FIGURE 6
High-Activity Groups Have Greater Share of People in Poverty and Renting
Average percentage of residents with characteristic by group
URBAN INSTITUTE
Though this project’s limited scope prevented in-depth exploration of land use and built
environments, we do consider how these can affect crime and social interaction (figure 7). The high-
activity groups have slightly more businesses; commercial areas often have different patterns of social
activity, crime, and policing. For example, commercial areas may have more daytime activity, greater
opportunity for property crime, and regular policing patrol. The high-activity groups also have greater
population and address density, meaning they may be denser areas with increased social interaction.
16 CATALYZING POLICING REFORM WITH DATAFIGURE 7
High-Activity Groups Have Greater Population and Address Density
Density per square mile by group
URBAN INSTITUTE
Although the groups show general demographic and land-use patterns, the neighborhoods in each
group assignment vary. Not all neighborhoods in the high-activity groups have the same levels of
economic hardship or types of built environment. Moreover, two adjacent neighborhoods that may be
quite similar in terms of these characteristics may be in different groups because of their varied levels
of crime, police-initiated activity, and resident-initiated activity.
Despite These Trends, Notable Outliers Exist
The previous sections show aggregate patterns of resident-initiated contact compared with police-
initiated contact. However, we recognize the complexity of neighborhoods and that some reporting
districts may diverge from the general patterns. Most reporting districts follow the trend of either low
resident-initiated contact and low police-initiated contact, or high resident-initiated contact and high
police-initiated contact. However, a few reporting districts have a combination of high and low activity.
Thirty-four reporting districts (3.0 percent) have greater-than-expected resident-initiated contact
given their levels of police-initiated contact, and 32 reporting districts (2.8 percent) have greater-than-
expected police-initiated contact given their levels of resident-initiated contact.18 Compared with the
rest of the reporting districts, the high resident-initiated contact outliers have a significantly greater
CATALYZING POLICING REFORM WITH DATA 17share of white and Asian people, adults with college degrees, renters, and property crime. The outliers
with high police-initiated contact have significantly more businesses and violent crime. They also have a
significantly smaller immigrant population (both citizen and noncitizen) and a smaller population of
people with incomes less than 200 percent of the poverty line, suggesting these are more affluent
commercial areas. For example, a few of the outliers are the areas around the Los Angeles International
Airport, Hollywood Walk of Fame, and Venice Beach Boardwalk. The high police-initiated contact
outliers also include major university areas (like the University of Southern California and the
University of California, Los Angeles) and Skid Row in downtown Los Angeles, an area with a large
concentration of unsheltered people experiencing homelessness. Most of these areas are not
traditional residential neighborhoods, and many have separate police departments and security
agencies that also patrol the areas.
Further examination of the outlier reporting districts that had high and low combinations of
resident-initiated and police-initiated contact (rather than all high and all low) would be important in
any community engagement plan. These districts have unique demographic and economic
characteristics and may be neighborhoods that are experiencing more rapid change or are largely
nonresidential. Moreover, their levels of police-initiated activity are not proportionate to the levels of
resident calls for service, indicating that the police may be implementing different strategies there. The
patterns and outliers in the policing typology highlight several areas for further exploration.
Community-Police Conversations
Neighborhood-level analyses of policing activity can support conversations between community
members and police. From NNIP's experience, having a common set of facts focuses conversations
more on solutions. Our analysis confirms the importance of analyzing small areas (rather than just
citywide data) to understand the range of experiences across neighborhoods. For the NNIP network,
democratizing data also means including marginalized people and communities so they can better
advocate for themselves. In this section, we provide examples and resources for community-based
organizations, government agencies, and law enforcement agencies in Los Angeles. We also discuss how
local data organizations and criminal justice advocates could implement this approach in their
communities.
18 CATALYZING POLICING REFORM WITH DATAResources for Los Angeles
In Los Angeles, we hope that community-based organizations, government representatives, and the
LAPD will use our analysis to start or inform conversations about policing reform and strengthening
communities' trust in police. For example, the Reporting District Explorer in our Power BI website
offers a map where people can zoom in and see the types of groups represented in their neighborhood
(which are larger than reporting districts).19 Users can also select key statistics for each reporting
district (e.g., calls for service, stops, arrests, and crime) and compare their values with reporting districts
across Los Angeles. With this information, residents and other stakeholders will understand the
patterns of resident-initiated and police-initiated activity in their neighborhood and whether those
levels of activity are higher or lower than in other neighborhoods. In conversations, residents can share
their lived experiences with the factors influencing whether and when neighbors call the police, and
police can clarify how they determine strategies in particular neighborhoods. If reporting districts in
residents’ neighborhoods have been assigned to multiple groups, they can initiate a conversation to
explore the drivers of differences between those districts.
One local initiative using this data is the Criminal Justice Data Initiative within the Neighborhood
Data for Social Change project at USC.20 Through this initiative, the Sol Price Center for Social
Innovation and Safe Communities Institute at USC are collecting and sharing many neighborhood-level
criminal justice indicators and hosting community trainings on using the data. They convene
representatives from community-based organizations, law enforcement agencies, and local government
to start conversations about the data, opportunities for future data collection, and ideas to promote
public safety. Publicly accessible criminal justice data and regular communication between
communities, police, and government ensure residents’ experiences supplement quantitative analysis
with their insights and provide a foundation for improving neighborhood trust and safety.
Representatives in city and county government may also have applications for a neighborhood
typology of policing activity. They may be interested in examining calls for service, policing activity, or
crime in the neighborhoods they represent to inform their outreach to LAPD or provide context about
public safety. They may also want to further democratize data by requesting that all law enforcement
agencies in Los Angeles and adjacent jurisdictions publicly release their data.
The LAPD could use the typology to examine more detailed information about neighborhoods in
terms of their levels of crime and calls for service, or how their policing activity varies throughout the
city. Although police officers may believe they know the areas with more crime and resident calls, the
typology may counter their assumptions and provide insights about where calls are significantly more
CATALYZING POLICING REFORM WITH DATA 19serious or where the number of calls does not match the level of crime. With these neighborhoods
identified, police could focus on community engagement to increase trust (which may in turn make
people more willing to call) or adopt a more inclusive, problem-oriented policing strategy. The LAPD
could also use this analysis during community meetings to, for example, describe neighborhood
variation in calls for service or stops or conduct similar analyses regularly to see how resident-initiated
activity and policing strategy evolve over time.
With the baseline understanding of how resident-initiated activity varies throughout the city that
this analysis provides, community organizations and the LAPD may be interested in digging deeper to
understand how public trust and sentiment toward police varies across neighborhoods. As an example
of what could be done with additional data collection and collaboration, the Urban Institute partnered
with the Austin Justice Coalition in Austin, Texas, on the Community Voices Project to survey residents
in areas with high police presence about their views on the law and role of the police as well as their
perceptions of police fairness, procedural justice, and legitimacy.21 Survey findings were presented back
to the community in a data walk that resulted in recommendations for the Austin Police Department.
Further exploration of community views in Los Angeles could lead to more robust conversations and
solutions-development between communities and police.
Analyses of open police data and surveys of community perceptions not only support community-
police conversations; they can also help support trust-building efforts between communities and police.
The National Network for Safe Communities at John Jay College has helpful resources on how to
implement reconciliation processes between police and communities at the neighborhood level. 22
Recently, six cities implemented reconciliation discussions between communities and police, along with
officer trainings and departmental policy changes, through the National Initiative for Building
Community Trust and Justice and found some improvements in police-community relations.23
Community organizations, local government, and police in Los Angeles may be able to draw from
models implemented in other cities to build trust between police and communities.
Resources for Other Cities
Outside of Los Angeles, we hope this analysis inspires local data organizations and criminal justice
advocates in other communities to conduct similar analyses. We recommend that any analysis like ours
be done collaboratively with analysts and advocates to be relevant to local audiences and community
questions. The first step is to acquire the data. The NNIP’s 2019 brief highlights the wide range of
commonly available local criminal justice data, which is not restricted to data sources on policing.24
20 CATALYZING POLICING REFORM WITH DATALocal groups can check the US City Open Data Census or the Police Data Initiative to find their city’s or
county’s open data portal.25 For unpublished data sets, NNIP’s “Lessons on Local Data Sharing” provides
tips for people advocating for their police to release new data. 26
The next step is to analyze the data. Our GitHub site shares the detailed methodology and
programming used to process the files.27 Community data organizations like NNIP partners, other
applied research centers at universities, or data-for-good volunteer groups like the Code for America
brigades or DataKind chapters are promising sources of analytic expertise about adapting the machine
learning techniques we used. Our Power BI site gives examples of how to visualize the findings. 28
The final and most important step is to work with community groups to interpret and share the
findings. Our local partner at USC was already cultivating relationships with community groups and
residents, and it provided us invaluable insights about the city’s geography and local advocates’
potential interests. People living in the neighborhoods should be involved to provide critical context to
validate or critique the indicators and categories, as well as surface ideas about other forums for the
findings.
As one example of a local data organization working with residents, Data You Can Use is working
with residents of the Amani neighborhood in Milwaukee, Wisconsin, to build their capacity around
neighborhood conditions, safety, and policing. They paired an analysis of crime trends and hot spots
with a resident-conducted survey about public safety and police legitimacy. The survey found that
residents felt secure with police presence in their neighborhood, were willing to call police to report
crime, and were more concerned about traffic safety than violent crime. The residents shared the
survey results with their neighbors in “data chats” and took action to improve traffic safety in their
neighborhood.
Although this report focuses on a policing typology, NNIP’s 2019 brief highlights examples of
action-oriented analysis from across the US on a host of criminal justice issues.29 Data are a powerful
though still underused tool for advancing community conversations about criminal justice reform.
Learning from one another can benefit this challenging journey and we welcome examples of other
places using data for justice reform at nnip@urban.org.
CATALYZING POLICING REFORM WITH DATA 21Appendix. Additional Metrics
TABLE A.1
Mean Count of Key Metrics for Each Group
Group 1 Group 2 Group 3 Group 4 Group 5
Variable
Number of reporting districts (n) 231 271 284 201 148
Calls for service 196 488 762 1,121 1,753
Part 1 violent crimes 10 31 56 88 172
Part 1 property crimes 29 65 88 120 183
Part 2 crimes 15 35 50 67 96
Pedestrian stops 21 78 134 222 580
Traffic stops 94 244 389 625 1,373
Arrests 15 44 67 111 306
Total population of all reporting districts in
372,418 826,689 1,144,751 930,867 675,305
group
Average population in reporting district 1,612 3,051 4,031 4,631 4,563
Asian population % 13.4 14.3 12.0 10.5 7.4
Black population % 3.4 4.2 6.9 8.3 20.1
Hispanic population % 22.9 39.8 51.5 58.0 56.2
White population % 56.5 38.3 26.8 20.9 14.1
Average population % under age 18 17.0 19.1 20.7 22.9 20.9
Average address density (address/mile2) 3,562 6,393 8,209 9,076 13,613
Average business address density (business
341 611 970 868 3,036
address/mile2)
22 APPENDIXFIGURE A.1 Reporting District Group Assignment Map with Neighborhood Overlay APPENDIX 23
Notes
1    For more information, see the NNIP cross-site project page at
     http://www.neighborhoodindicators/justicereform.
2    Jesilow, Meyer, and Namazzi (1995), Langan and coauthors (2001), LaVigne, Fontaine, and Dwivedi (2017),
     Murty, Roebuck, and Smith (1990), Reisig and Parks (2000), and Sampson and Bartusch (1998).
3    George L. Kelling and James Q. Wilson, “Broken Windows: The Police and Neighborhood Safety,” Atlantic
     Monthly, March 1982, https://www.theatlantic.com/magazine/archive/1982/03/broken-windows/304465/.
4    Ben Poston and Cindy Chang, “LAPD Searches Blacks and Latinos More. But They’re Less Likely to Have
     Contraband than Whites,” Los Angeles Times, October 8, 2019, https://www.latimes.com/local/lanow/la-me-
     lapd-searches-20190605-story.html.
5    Catalyzing Policing Reform with Data: Technical Appendix is available at
     https://www.urban.org/research/publication/catalyzing-policing-reform-data-technical-appendix.
6    Visit the interactive data tool at http://neighborhoodindicators.org/CJinteractive.
7    The LAPD has the most sworn personnel out of the law enforcement agencies in the County of Los Angeles, and
     only has jurisdiction within the City of Los Angeles. However, the Los Angeles Sheriff’s Department is nearly as
     large as LAPD and has jurisdiction throughout the rest of the County of Los Angeles. In the city, there are many
     smaller agencies based out of localities (e.g., Santa Monica, Pasadena) or universities (e.g., UCLA, USC). There are
     also state and federal agencies that operate in Los Angeles (e.g., California Highway Patrol, FBI). Our analysis
     only looks at LAPD activity within LAPD reporting districts. However, other agencies may conduct activities in
     those reporting districts that we are unable to measure.
8    The LAPD’s open data are available at https://data.lacity.org/browse?Data-Owner_Department=LAPD.
9    Age, sex, and race/ethnicity information is available for arrests and sex and race/ethnicity information is
     available for stops. Age, sex, and race/ethnicity information is also available for victims of crime, but we do not
     use this information in our analyses. No demographic information is available for calls for service.
10   In this analysis, we use four primary race/ethnicity categories, non-Hispanic Asian, non-Hispanic Black, Hispanic,
     non-Hispanic white, and other following the terminology used by LAPD. The other group includes American
     Indian/Alaskan Native, other, and unknown. LAPD uses 19 unique descent codes, which we group into these five
     categories.
11   Information on how LAPD classifies crimes according to the UCR categories is available at
     https://data.lacity.org/api/views/63jg-8b9z/files/fff2caac-94b0-4ae5-9ca5-
     d235b19e3c44?download=true&filename=UCR-COMPSTAT062618.pdf.
12   For all subsequent plots, 22 reporting districts are excluded from analysis because the 2010 census blocks that
     fall within the reporting district all have populations of zero. Therefore, we could not crosswalk the reporting
     districts to census tracts using our population-weighted crosswalk methodology and assign demographic data
     from the American Community Survey to these 22 reporting districts. Of the 22 reporting districts, 18 are in
     group one and four are in group two.
13   Because our unit of analysis is a reporting district and American Community Survey data are reported at the
     census-tract level, we create a crosswalk that weights the American Community Survey information according
     to the reporting district size.
14   The US Department of Housing and Urban Development aggregated US Postal Service data on address vacancy
     reports quarterly data on total, vacant, and no-stat residential and business address counts at the tract level. We

        24                                                                                                     NOTES
use the average counts of total, residential, and business addresses across the four quarters of 2018 for our
analysis.
15 The 17 variables included in the cluster analysis include: rates for serious and nonserious calls for service;
vehicle and pedestrian stops; total stops by race (Asian, Black, Hispanic, white); adult and juvenile arrests; total
arrests by race (Asian, Black, Hispanic, white); Part 1 violent and property crime; and Part 2 crime. A full
discussion of the variables is available in the technical documentation.
16 To assess whether our clusters are meaningfully distinct, we perform two-sided t-tests of our cluster means
against the population means (the average across all reporting districts in Los Angeles) for each of the variables
used in the cluster analysis, as well as the following other variables of interest: non-Hispanic Asian, non-Hispanic
Black, Hispanic, and non-Hispanic white population percentage, total stops, total arrests, and total calls for
service. For nearly all variables, our cluster averages are significantly different from the population average at
the 0.05 significance level. The notable exception is cluster 3, for which the cluster means for 8 of the 17
variables used for clustering as well as non-Hispanic Asian and non-Hispanic Black population percentage are
not significantly different from the population average. This suggests that our ”middle” cluster 3 is most
reflective of the overall population.
17 In 2017, 200 percent the poverty threshold set by the US Census Bureau was $24,976 for a single person, or
$49,716 for a household with two adults and two children. The threshold changes based on the number of adults
and children in the household. For more information on poverty thresholds, see
https://www.census.gov/data/tables/time-series/demo/income-poverty/historical-poverty-thresholds.html.
18 We define the outliers as those reporting districts that are one standard deviation above the mean in the
difference in scaled resident-initiated contact and scaled police-initiated contact.
19 See http://neighborhoodindicators.org/CJinteractive.
20 For more information, visit the USC website at https://socialinnovation.usc.edu/announcing-the-ndsc-criminal-
justice-data-initiative/.
21
Findings from the survey and recommendations from the data walk are available at
https://www.austinjustice.org/reports.
22 Resources for implementing reconciliation conversations are available at
https://www.nnscommunities.org/innovations/racial-reconciliation/
23 Information about the National Initiative can be found at https://www.urban.org/policy-centers/justice-policy-
center/projects/national-initiative-building-community-trust-and-justice.
24 See “The Potential for Catalyzing Community Criminal Justice Reform with Data” at
https://www.urban.org/research/publication/potential-catalyzing-community-criminal-justice-reform-data.
25 See http://us-cities.survey.okfn.org/ or https://www.policedatainitiative.org/participating-agencies/.
26 The data sharing guide is available at https://www.neighborhoodindicators.org/library/guides/nnip-lessons-
local-data-sharing.
27 See https://github.com/UrbanInstitute/la-policing-typology.
28 See http://neighborhoodindicators.org/CJinteractive.
29 See “The Potential for Catalyzing Community Criminal Justice Reform with Data” at
https://www.urban.org/research/publication/potential-catalyzing-community-criminal-justice-reform-data.
NOTES 25References
Bahr, Peter R., Rob Bielby, and Emily House. 2011. “The Use of Cluster Analysis in Typological Research on
Community College Students.” New Directions for Institutional Research (S1): 67–81.
https://doi.org/10.1002/ir.417.
Biderman, Albert D., and Albert J. Reiss. 1967. “On Exploring the ’Dark Figure’ of Crime.” Annals of the American
Academy of Political and Social Science 374: 1–15. https://doi.org/10.1177%2F000271626737400102.
Bobo, Lawrence D., and Victor Thompson. 2006. “Unfair by Design: The War on Drugs, Race, and the Legitimacy of
the Criminal Justice System.” Social Research 73 (2): 445–72.
Bryan, Isaac, Ricardo Patlan, Danielle Dupuy, and Kelly Lytle Hernandez. 2019. The Los Angeles Police Department
Metro Division. Los Angeles: The Million Dollar Hoods Project.
Carter, David L. 1985. “Hispanic Perception of Police Performance: An Empirical Assessment.” Journal of Criminal
Justice 13 (6): 487–500. https://doi.org/10.1016/0047-2352(85)90078-9.
Chow, Julian. 1998. “Differentiating Urban Neighborhoods: A Multivariate Structural Model Analysis.” Social Work
Research 22 (3): 131–42. https://doi.org/10.1093/swr/22.3.131.
Desmond, Matthew, Andrew V. Papachristos, and David S. Kirk. 2016. “Police Violence and Citizen Crime
Reporting in the Black Community.” American Sociological Review 81 (5): 857–76.
https://doi.org/10.1177%2F0003122416663494.
Eck, John E., and William Spelman. 1987. Problem-Solving: Problem-Oriented Policing in Newport News. Washington,
DC: Department of Justice, Office of Justice Programs, National Institute of Justice.
Goldstein, Herman. 1979. “Improving Policing: A Problem-Oriented Approach.” Crime and Delinquency 25 (2): 236–
58. https://doi.org/10.1177%2F001112877902500207.
Kaplan, Jacob. 2019. “Jacob Kaplan’s Concatenated Files: Uniform Crime Reporting Program Data: Law
Enforcement Officers Killed and Assaulted (LEOKA) 1960-2017.” Ann Arbor, MI: Inter-university Consortium
for Political and Social Research. https://doi.org/10.3886/E102180V6.
Langan, Patrick A., Lawrence A. Greenfeld, Steven K. Smith, Matthew R. Durose, and David J. Levin. 2001.
“Contacts between Police and the Public: Findings from the 1999 National Survey.” Washington, DC: US
Department of Justice, Bureau of Justice Statistics.
La Vigne, Nancy G., Jocelyn Fontaine, and Anamika Dwivedi. 2017. “How Do People in High-Crime, Low-Income
Communities View the Police?” Washington, DC: Urban Institute.
Li, Yu-Sheng, and Ying-Chih Chuang. 2009. “Neighborhood Effects on an Individual’s Health Using Neighborhood
Measurements Developed by Factor Analysis and Cluster Analysis.” Journal of Urban Health 86 (1): 5–18.
https://dx.doi.org/10.1007%2Fs11524-008-9306-7.
Loo, Robert. 2004. “A Typology of Burnout Types among Police Managers.” Policing: An International Journal of Police
Strategies and Management 27 (2): 156–65.
Manaugh, Kevin, Luis F. Miranda-Moreno, and Ahmed M. El-Geneidy. 2010. “The Effect of Neighbourhood
Characteristics, Accessibility, Home-Work Location, and Demographics on Commuting Distances.”
Transportation 37 (4): 627–46.
Mazerolle, Lorraine, Sarah Bennett, Jacqueline Davis, Elise Sargeant, and Matthew Manning. 2013. “Legitimacy in
Policing: A Systematic Review.” Campbell Systematic Reviews 9 (1): i–147. https://doi.org/10.4073/csr.2013.1.
Paoline, Eugene A. 2004. “Shedding Light on Police Culture: An Examination of Officers’ Occupational Attitudes.”
Police Quarterly 7 (2): 205–36.
26 REFERENCESYou can also read