The Need for Faster Underfrequency Load Shedding
←
→
Page content transcription
If your browser does not render page correctly, please read the page content below
The Need for Faster Underfrequency Load Shedding

                   Kevin W. Jones and Katriana Webber
                              Xcel Energy

                        Krithika Bhuvaneshwaran
                 Schweitzer Engineering Laboratories, Inc.

                             Presented at the
           74th Annual Conference for Protective Relay Engineers
                             Virtual Format
                           March 22–25, 2021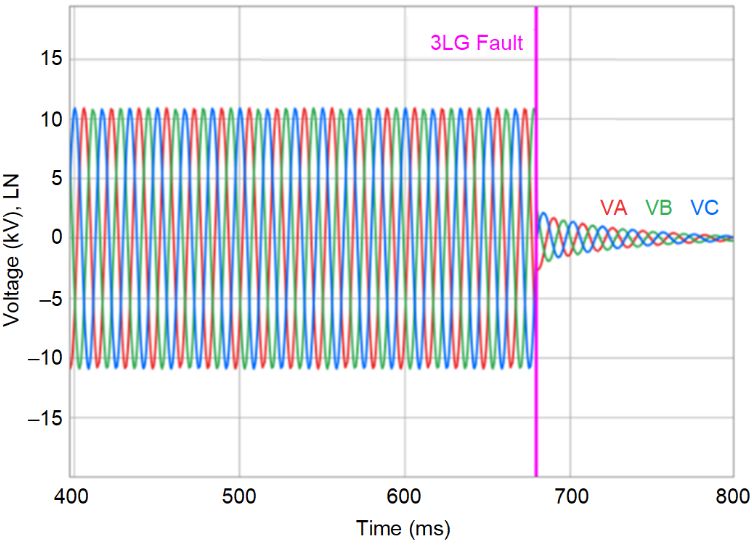
1

 The Need for Faster Underfrequency Load Shedding
                                    Kevin W. Jones and Katriana Webber, Xcel Energy
                           Krithika Bhuvaneshwaran, Schweitzer Engineering Laboratories, Inc.

   Abstract—Underfrequency load shedding (UFLS) has been              perform periodic assessments of the plan to ensure it meets
used for decades to maintain the balance of load and generation       designed performance requirements.
after a loss of generation. Some underfrequency relays are set with
                                                                          While these NERC reliability standards have made
long time delays to prevent them from incorrectly tripping for
source transmission line operations where UFLS feeders have           cascading outages and blackouts less likely, they will,
significant induction motor load. Today, the lower system inertia     nevertheless, continue to occur, hopefully with less frequency
caused by renewable generation is increasing the potential depth      and severity. It is impossible to anticipate all contingencies that
of frequency excursions. This paper proposes a new rate-of-           will lead to the next cascading blackout.
change-of-frequency scheme that allows for fast UFLS to minimize          The last major UFLS event that occurred in the United States
frequency excursions. The paper also presents simulations
                                                                      was the Arizona-Southern California blackout on
showing that the scheme is secure from misoperations for source
transmission line operations.                                         September 8, 2011. The sequence of events that precipitated
                                                                      this blackout are unfathomable. After the last transmission line
                      I.   INTRODUCTION                               tripped to form a San Diego Gas & Electric (SDG&E), Arizona
                                                                      Public Service (APS), and Comisión Federal de Electricidad
   The time of writing this paper preceded the manual load
                                                                      (CFE) island, frequency in the island dropped at an initial rate
shedding events that occurred in Texas and other parts of the
                                                                      of about 2.5 Hz/s, followed by a rate of about 3 Hz/s. The rapid
Midwest the week of February 14, 2021. Winter storm Uri
                                                                      frequency decay was caused by a severe unbalance of load over
settled over the Midwestern and deep southern states with ice,
                                                                      generation. All levels of UFLS tripped for this event, but not in
snow, and below freezing temperatures for several days,
                                                                      time to arrest the frequency to a level above 57 Hz, at which
causing energy supply issues and low frequency in the Electric
                                                                      point, all generation in the island tripped, causing the blackout.
Reliability Council of Texas (ERCOT) region.
                                                                      Overall, the Arizona-Southern California blackout resulted in
   Automatic underfrequency load shedding (UFLS) has been
                                                                      the loss of 7,835 MW of load, affecting 2.7 million people [4].
used in North America as a last ditch, first line of defense to
                                                                          Another significant recent UFLS event occurred on
minimize the possibility of system-wide blackouts since the late
                                                                      September 28, 2016, when the entire South Australian system
1960s.      Following      the    1965      northeast  blackout,
                                                                      blacked out. South Australia is connected to the rest of
recommendations to prevent a similar occurrence included the
                                                                      Australia via two 275 kV ac lines in Victoria. Prior to the
use of automatic UFLS [1]. This blackout was the worst in
                                                                      blackout, the generation mix in South Australia was 18 percent
history at the time, resulting in the loss of 20,000 MW of load,
                                                                      synchronous generation (330 MW), 48 percent wind generation
affecting 30 million people. The northeast blackout was also the
                                                                      (883 MW), and 34 percent import over the Victoria tie lines
catalyst for the formation of the National Electric Reliability
                                                                      (613 MW). The event was initiated by severe supercell
Council (now the North American Electric Reliability
                                                                      thunderstorms with tornadoes, large hail, and destructive
Corporation [NERC]) on June 1, 1968. A year later, per the
                                                                      winds.
urging of the chief of the Bureau of Power for the Federal
                                                                          Five transmission system faults occurred within an
Power Commission (FPC), NERC was presented with a list of
                                                                      87-second timeframe. Six voltage dips within a 2-minute
15 study areas that the FPC believed NERC should address to
                                                                      timeframe caused 456 MW of wind generation to cease
ensure a reliable bulk power system. One of these study areas
                                                                      producing power due to excessive low-voltage ride-through
was load-shedding practices [2].
                                                                      counts. This caused the imports across the Victoria tie lines to
   On August 14, 2003, another northeast blackout occurred,
                                                                      increase to almost 900 MW, which was greater than the
resulting in the loss of 62,000 MW of load, affecting 50 million
                                                                      650 MW import limit. This excess import resulted in an
people. Following this blackout, the U.S. Federal Energy
                                                                      unstable power swing, which initiated an out-of-step tripping
Regulatory Commission (FERC) certified NERC as the Electric
                                                                      scheme that tripped the two Victoria tie lines due to loss of
Reliability Organization (ERO) in the United States. NERC
                                                                      synchronism with the rest of Australia. After the tie lines
then filed 102 reliability standards with FERC. FERC approved
                                                                      tripped, the system frequency decayed at a rate of 6 Hz/s, which
these standards in March 2007 [3]. One of the standards,
                                                                      was above the 3 Hz/s UFLS program design rate. All levels of
PRC-006 – Automatic Underfrequency Load Shedding, has
                                                                      UFLS tripped, but not in time to avoid a blackout. The high
15 mandatory requirements            applicable    to   planning
                                                                      rate-of-change of frequency (ROCOF) was caused by the lack
coordinators, transmission owners, and distribution providers.
                                                                      of sufficient synchronous generation inertia compared to the
Overall, this standard requires planning coordinators to develop
                                                                      load being served [5].
a UFLS plan that transmission owners and distribution
                                                                          The fact that it has been over nine years since the last UFLS
providers must follow. The planning coordinators must also
                                                                      event in the United States is good. However, the makeup of the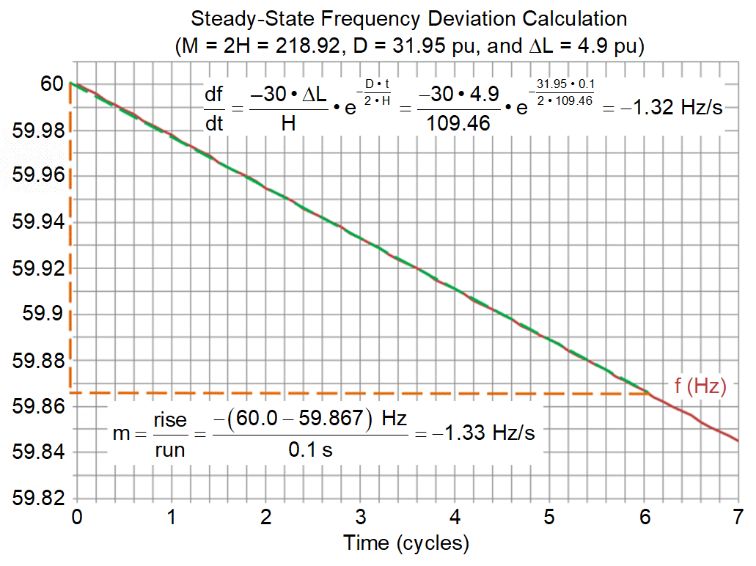
2

United States electric grid has changed immensely in nine years
with the addition of significant amounts of nonsynchronous
renewable generation (i.e., wind and solar), as shown in Fig. 1.

                                                                       Fig. 2. Ramp-up of coal and nuclear generation during the 1970s and 1980s

                                                                          These new coal and nuclear generators averaged 500 MVA
Fig. 1. Ramp-up of wind and solar generation during the 21st century   and 1,000 MVA in nameplate size, respectively. Fig. 3 shows a
                                                                       comparison of the percentage of generation of a given size prior
    Also, the passing of almost a decade without a significant         to 1966 and from 1966 to 1985 [6]. The rapid increase in
load-shed event has lulled the electric industry into a                number of large coal and nuclear generators made the
complacent false sense of security regarding existing UFLS             likelihood of a more extreme underfrequency event possible if
program adequacy. Thus, it is time for the electric utility            one of these generators suddenly tripped offline.
industry to reevaluate UFLS programs to ensure that they
prevent blackouts and protect generators. One way of
accomplishing this task is to make sure that underfrequency
relays can operate as fast as possible while maintaining a good
balance between dependability and security. As the United
States electric grid becomes inundated with nonsynchronous
renewable resources, lower system inertia and higher ROCOF
will result. Ensuring UFLS relays can operate as fast as possible
to arrest declining frequency during these conditions will better
guarantee that this last ditch, first line of defense will prevent a
blackout. This paper provides such a solution that is easy to
implement in existing microprocessor-based relays with just a
few settings changes.

     II.    UNDERFREQUENCY LOAD-SHEDDING HISTORY
   Prior to the 1965 northeast blackout, UFLS was not widely
                                                                       Fig. 3. Comparison of generator sizes prior to 1966 and from 1966 to 1985
used in the United States for blackout prevention. Power
systems were more isolated with smaller pockets of load and               From the 1970s through the 1990s, several major
generation. Loss of a single generator was minimally impactful         disturbances occurred in the United States that resulted in
to the overall system because individual generators were               automatic UFLS. In 1987, NERC updated its operations criteria
smaller in size than they are today. Frequency recovery was            and guides and renamed them as operating policies [7]. One of
achievable due to inertia and governor response of the                 these policies, Policy 6C, required control areas to establish
remaining generation units.                                            plans for automatic UFLS. It was not until after the 2003
   In 1965, 80 percent of all generators with a nameplate rating       northeast blackout that NERC established mandatory reliability
of at least 10 MVA were in the range of 10 to 100 MVA in size.         standard PRC-006, requiring adherence to a UFLS plan or risk
During the 1970s and 1980s, new generator additions in the             fines for noncompliance.
United States were predominantly large coal and nuclear units,
as shown in Fig. 2.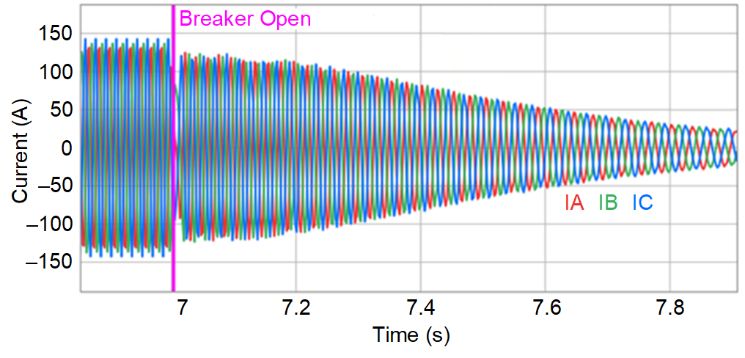
3

B. Need for UFLS at Xcel Energy New Mexico/Texas
     (NM/TX)
   The best way to understand the need for an automatic UFLS
program is by use of a specific example. One such example is
given in this paper based on the UFLS history of Southwestern
Public Service Company (now Xcel Energy NM/TX). Xcel
Energy NM/TX began like all other utilities—as an electric
franchise. Over time, electric franchises throughout eastern
New Mexico and the Texas Panhandle began interconnecting,
forming a more contiguous system. By the early 1960s, the
interconnected system covered an area of around 52,000 square
miles and included four states, as shown in Fig. 4.

                                                                          Fig. 5. 1964 Texas North blackout (red lines indicate 69 kV, and blue lines
                                                                          indicate 115 kV)

                                                                             Following this blackout, several protective relaying changes
                                                                          were implemented across the entire Xcel Energy NM/TX
                                                                          system. First, power-swing blocking relaying was added to
                                                                          every looped transmission line terminal, and select tie lines
                                                                          were set to trip for out-of-step conditions. Second, automatic
                                                                          UFLS was added across the system at three frequency set
                                                                          points: 59.3 Hz, 59.0 Hz, and 58.7 Hz. The UFLS scheme was
                                                                          applied equally in each of the three load/generation islands and
                                                                          each underfrequency level would shed about 10 percent of the
                                                                          total system load. This combination of strategic islanding and
                                                                          underfrequency load shedding would prove to be a valuable
Fig. 4. Xcel Energy NM/TX in early 1960s (red lines indicate 69 kV, and   system stability enhancement to prevent system-wide blackouts
blue lines indicate 115 kV)
                                                                          (Fig. 6).
   In 1964, a major outage occurred in the Xcel Energy NM/TX
system that would forever change how the transmission system
was protected. A major 115 kV tie line from the southern to the
northern Texas Panhandle was out of service for maintenance.
A large generator in the Texas North region was also offline for
maintenance. This generator alone made up 40 percent of the
total generation in the Texas North region. Due to the outage of
this generator, power imports from south to north were greater
than normal on the remaining two 115 kV tie lines.
   While in this weakened configuration, the sister unit to the
offline Texas North unit tripped on loss of excitation, resulting
in a significant increase in south-to-north power flows. These
power flows were more than the maximum power transfer
capability of the remaining transmission lines, resulting in an
unstable power swing and tripping of the transmission line
phase distance relays. When the tie lines tripped, only
20 percent of the normal Texas North generation remained
energized, which was inadequate to serve the load. This severe
unbalance of load over generation resulted in an unrecoverable
decline in the Texas North system frequency, resulting in a
Texas North blackout (Fig. 5).                                            Fig. 6. Xcel Energy NM/TX natural load/generation islands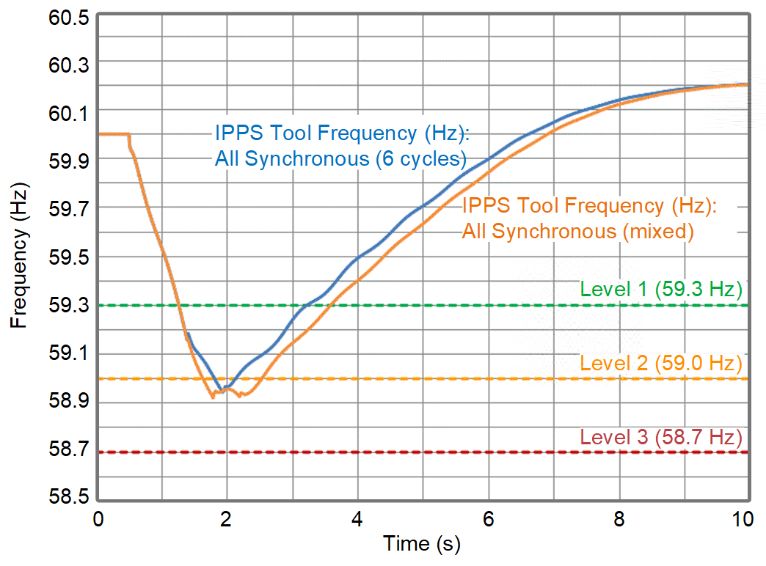
4

    Over the course of the next several decades, this UFLS              Adequate automatic UFLS is critical to the health of steam
program would be put to the test. In 1972, Xcel Energy NM/TX         turbines. As shown in Table I, frequency levels below 59 Hz
added its first tie line to the Eastern Interconnect. This 230 kV    begin to cause cumulative damage to steam turbine blades.
line stretched from Amarillo, TX, to Elk City, OK. In the late                                      TABLE I
1970s and early 1980s, two coal plants were added to the                             STEAM TURBINE FREQUENCY-TIME DAMAGE
generation fleet. One plant near Muleshoe, TX, consisted of two
                                                                                  Frequency at                            Minimum Time
540 MW units. The other plant in Amarillo, TX, consisted of                      Full Load (Hz)                          to Damage (min.)
three 350 MW units. Between 1983–1985, it was not
                                                                                      59.4                                            NA
uncommon for one of the large coal units to trip. When one did,
it was common for power imports across the 230 kV tie line to                         58.8                                            90
exceed the maximum power transfer of the line, resulting in an                        58.2                                            10
unstable power swing and an out-of-step trip. This resulted in
                                                                                      57.6                                            1
an unbalance of load over generation, and underfrequency relay
tripping ensued. Over the span of these 2 years, this happened          The time in Table I is cumulative over the life of the
11 times.                                                            machine, so if a turbine is subject to 57.6 Hz for 30 seconds, it
    In the late 1980s, additional tie lines were added to the Xcel   can only withstand 30 additional seconds at 57.6 Hz before
Energy NM/TX system, strengthening the connection to the             damage occurs [8].
Eastern Interconnect. No separation events occurred after this          Additionally, underfrequency relaying is applied to steam
strengthening of the system until 1996. The 1996 separation          turbines to protect them from accumulated damage. Prior to the
event was caused by the tripping of two 540 MW generators            northeast blackout in 2003, generator owners applied
and several 230 kV Texas South to Texas North tie lines. The         underfrequency relaying independently to ensure protection of
power transfer from the Eastern Interconnect resulted in the         their generation assets. After the 2003 blackout, NERC
tripping of all tie lines and the remaining tie lines tying Texas    Standard PRC-024 became the North American guide for
South to Texas North. All levels of underfrequency relaying          applying underfrequency tripping of generators and steam
tripped for this event, but not enough load was shed to prevent      turbines [9]. The PRC-024-2-allowable low-frequency tripping
Texas South and New Mexico from blacking out. Only Texas             levels of the major interconnections in the United States are
North remained energized.                                            shown in Table II.
    In 2008, Xcel Energy NM/TX experienced its most recent
                                                                                                   TABLE II
separation event. Half of the Eastern Interconnect tie lines were                 PRC-024-2-ALLOWABLE LOW-FREQUENCY TRIPPING
out of service due to storm damage. A lightning strike near the
largest coal plant caused a ground potential rise at the plant,                           PRC-024-2-Allowable Low-Frequency
                                                                                               Tripping Time Delay (s)
which resulted in the two 540 MW units running back about
400 MW each. The import of power across the Eastern                      Freq.        Eastern                Western                      ERCOT
Interconnect tie lines resulted in out-of-step tripping and              (Hz)    Interconnection*        Interconnection              Interconnection
underfrequency tripping at 59.3 Hz.                                      >59.5       Continuous              Continuous                    Continuous

C. Purpose of UFLS                                                       ≤59.5          1,792                Continuous                    Continuous
                                                                         >59.4          1,201                Continuous                    Continuous
    Besides the benefit of minimizing the possibility of a
system-wide blackout, automatic UFLS has a greater                       ≤59.4          1,201                     180                         540
purpose—protecting the generation fleet. Generators are                  ≤59.0           242                      180                         540
designed to operate continuously at their nominal frequency              ≤58.4            22                       30                         30
(i.e., 60 Hz in North America). Extended operation at too low            ≤58.0           4.44                      30                          2
of a frequency can cause damage to generators and especially             ≤57.8            0                       7.5                          2
steam turbines. Hydroelectric plants are more capable of
                                                                         ≤57.5            0                       7.5                          0
handling a drop in frequency than steam turbine plants.
                                                                         ≤57.3            0                      0.75                          0
Hydroelectric plants are minimally impacted by drops of
frequency up to 10 percent (a 6 Hz drop), whereas steam turbine          ≤57.0            0                        0                           0
plants are sensitive to frequency drops of up to 5 percent (a 3 Hz   *
                                                                      EI tripping times follow formula 10                     for frequency values
                                                                                                             (1.7373 • f – 100.116)

drop).                                                               >57.8 Hz and ≤59.5 Hz. This formula was applied to fill in EI values in Table II
                                                                     at the frequency shown.
    When an underfrequency event occurs, it is necessary to
begin shedding load quickly to avoid reaching frequency levels           Since underfrequency tripping of generators and steam
that can affect online generators. As the frequency decays,          turbines is applied to protect the North American generation
motor-driven auxiliary generator processes (e.g., feedwater          fleet, it is critical that UFLS be applied to avoid underfrequency
pumps, coal pulverizers, coal feed belts, draft fans, etc.) begin    tripping of generation. Loss of additional generation during an
to slow down, reducing the mechanical power input to the             underfrequency event will only make the excursion worse,
generator. This, in turn, results in less electrical generator       possibly leading to an area blackout.
output and worsening frequency decay.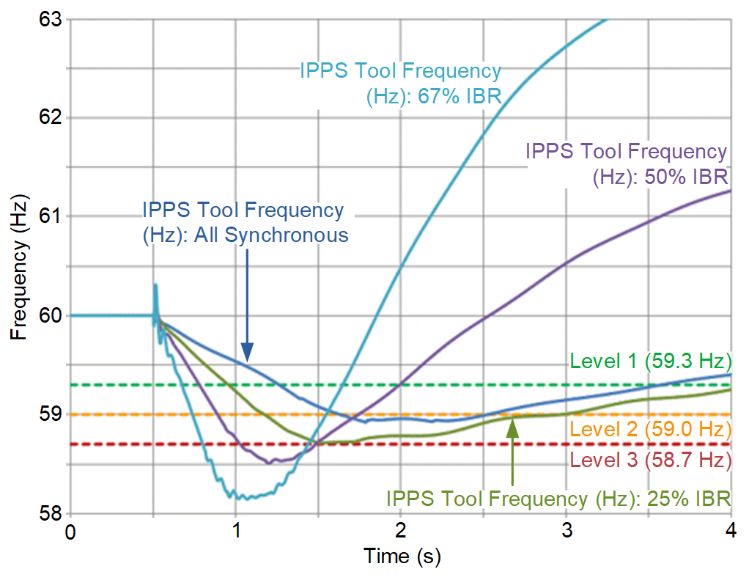
5

D. UFLS Technical Basics                                           implementing a load-shedding program that load/generation in
   Prior to implementation of a UFLS program, it is necessary      anticipated islands be as balanced as possible after loss of
to study and understand the system to which the program will       significant generation or after a separation event. The load that
be applied. Historical events tend to play a role in load-         is shed must offset the generation and/or imported power lost
shedding program development, as was the case for Xcel             to restore a balance of load to generation.
Energy NM/TX. Historical events typically reveal where                 To illustrate, consider the small, fictitious system shown in
natural load/generation islands form. It is critical when          Fig. 7.

Fig. 7. UFLS test system

   The UFLS test system was created using an integrated                                      TABLE III
protection planning simulation (IPPS) tool. The IPPS tool links          UFLS TEST SYSTEM LOAD, GENERATION, AND IMPORT DATA
a database of detailed relay models in a short-circuit program
                                                                                                                        System
with commercially available load flow/power system dynamic                                           Case Study       Peak/Limit
stability software. The link between these two programs allows                                      Actual (MW)         (MW)
for testing of detailed relay models when running dynamic
                                                                    Internal System Load                 1,803           2,000
system simulations.
   The test system was designed to mimic the Xcel Energy            Internal System Generation           1,111           1,150
NM/TX system. Names of generators and substations were              External System Load                  300             NA
scrubbed and made generic. Internal system generators in the
test system are actual units from the Xcel Energy NM/TX             External System Generation           1,019           2,000
system. The load flow/stability models in the IPPS tool are the     Internal System Import                698            1,200
same as actual models used by the Xcel Energy NM/TX
                                                                    Fir-Elm Import Limit                  NA              900
Transmission Planning department.
   Table III shows pertinent load and generation facts about the    Maple-Spruce Import Limit             NA              425
UFLS test system used for the studies in Sections III and IV of
this paper. The system is loaded within 200 MW of the peak            Table IV shows details about the system generation. The
load with heavy imports across the two tie lines. Import limits    nameplate capacity of all the internal generation is 1,150 MW.
are determined for each tie line independently and collectively.   The external generation represents the equivalent source of the
Limits are based on voltage (0.95 pu) or stability constraints     outside world and consists of two 1,000 MVA generators.
(nonconvergent load flow).                                         These generators are represented in the IPPS tool by a generator
                                                                   model. The internal generation is represented by a generator,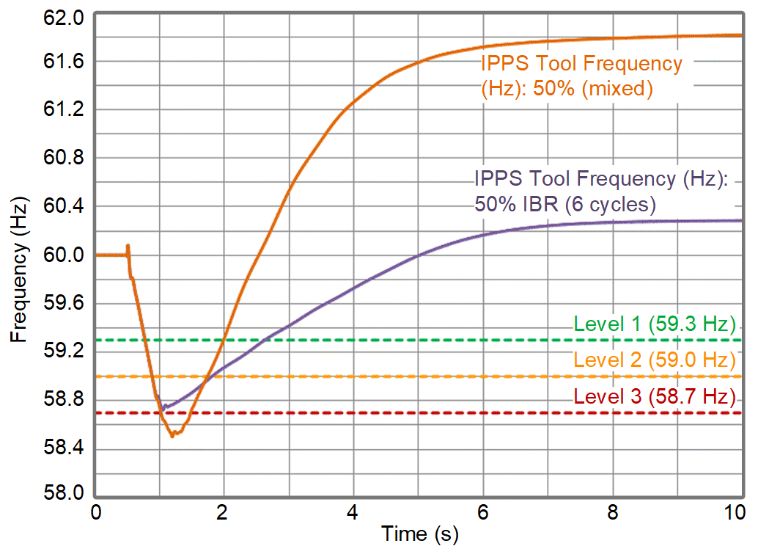
6
exciter, and governor model. The inertia constant of each change in system frequency will result in a 1.5 percent change
generator is converted to the system base of 100 MVA and is in load. The equation for D is shown in (3).
summed to represent the equivalent inertia of the system. These Load sys •1.5
inertia values will be used in the calculations that follow. D= (3)
100
TABLE IV
UFLS TEST SYSTEM GENERATION NAMEPLATE AND INERTIA DATA where:
Generator Generator
Loadsys is the remaining system load after load shedding
Generator Nameplate Inertia Inertia at or system separation.
Name MVA Constant (H) 100 MVA Base 1.5 is the percent change in load for a 1 percent change in
Birch U1 150 6.22 9.33
system frequency.
100 is the system base in MVA.
Oak U1 100 5.48 5.48
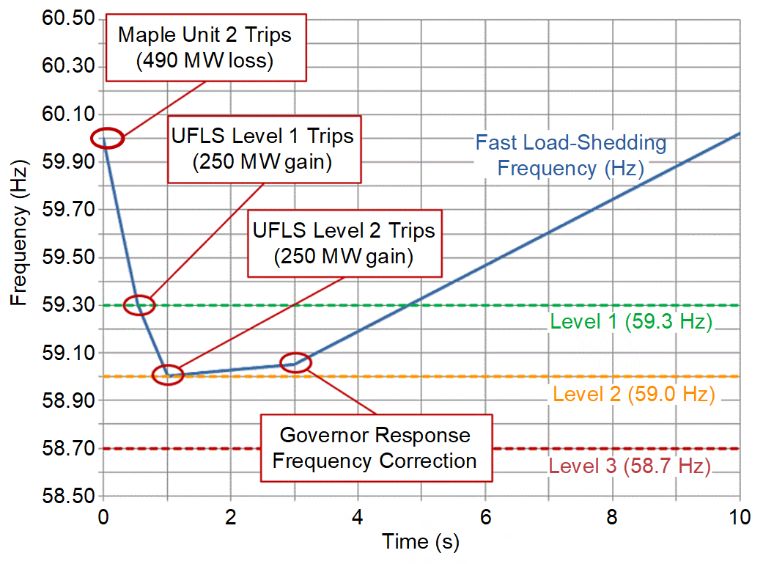
Fig. 8 shows an example of the loss of the Maple Unit 2
Pine U1 300 3.33 9.99 generator (ΔL = 4.9 pu). The graph shows the decay and
Maple U1 100 5.48 5.48 eventual bottoming-out of the frequency if it declines without a
Maple U2 500 3.236 16.18
governor response.
Elm 1,000 3.959 39.59
Spruce 1,000 3.959 39.59
Total 125.64
While more accurate, complex electromagnetic transient or
positive-sequence root-mean-square load flow and stability
software is not necessary to calculate how the system frequency
will change in response to a change in load or generation. The
fundamental formulae for frequency decay (loss of generation)
and frequency rise (loss of load) is shown in (1) [10].
t
−
f f sys − ∆L • (1 − e
= T
) • K • 60 (1)
M 1
T= K=
D D
where:
Fig. 8. Frequency decay without governor response when Maple
fsys is the base system frequency (60 Hz). Unit 2 tripped
ΔL is the change in load in per unit.
Taking the first derivative of (2) yields (4) to calculate the
t is time in seconds. ROCOF at any point in time.
M is the inertia constant of the system, which equals 2H. D•t
D is the load-damping constant. df −30 • ∆L − 2 • H
= •e (4)
60 is the constant to put the values in Hz. dt H
Rewriting the equation and substituting values for T and K Solving the first derivative at t = 0 yields (5) and results in
yields (2). the fastest ROCOF.
−
D•t
1 df −30 • ∆L
f f sys − ∆L • (1 − e
= 2•H
)• • 60 (2) = (5)
D dt H
The load-damping constant, D, represents the increase or After examining Fig. 8 more granularly at the beginning
decrease in system power consumption based on the changing of the frequency decay, the ROCOF can be calculated using (4)
frequency as seen by the frequency-dependent motor load. and the straight line slope equation, as shown in Fig. 9.
Motor loads that are frequency-dependent will operate at Calculating the ROCOF for a given system study is a quick way
nominal power when the system frequency is 60 Hz. If the to determine the severity of an underfrequency event. As was
system frequency increases, the motor will speed up, yielding a done for the South Australia system prior to the 2016 blackout,
higher electrical power level. If the system frequency decreases, studies determined the worst-case ROCOF for system recovery
the motor will slow down, yielding a lower electrical power was 3 Hz/s. This same type of analysis is recommended for
level. The load-damping constant, D, is expressed as a percent UFLS program development, especially with changing
change in load for a 1 percent change in system frequency. resource mixes and varying levels of system inertia.
Typical ranges of D are 1 to 2 percent [11]. An in-between value
of 1.5 was chosen for use in this analysis, thus a 1 percent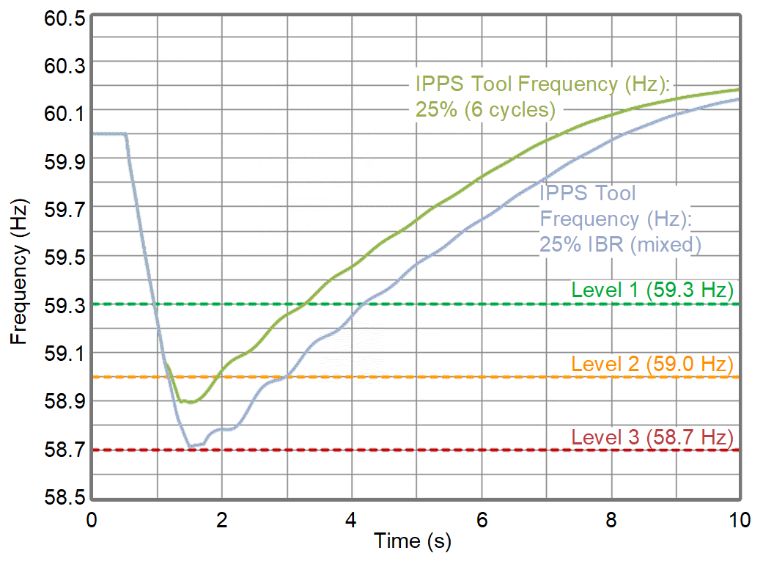
7
best-case UFLS simulations, all load can be shed at the time the
frequency set point is reached, as depicted in Fig. 10.
Fig. 9. ROCOF calculation when Maple Unit 2 tripped
Other useful calculations can be performed by solving (2) for
t, as shown in (6). Fig. 10. Fast load-shedding spreadsheet simulation response when Maple
Unit 2 tripped
2•H D • ( f − f sys )
t=
− • ln 1 + (6) E. UFLS Relaying in Use at Xcel Energy NM/TX
D 60 • ∆L Most underfrequency relays in use today at Xcel Energy
NM/TX are either solid-state electronics or microprocessor-
Equation (7) offers an example of how (6) can be used to
based technology. Solid-state relays use a crystal oscillator in
calculate the time it takes to get to 59.3 Hz, as shown in Fig. 8.
megahertz range to generate a nominal frequency reference that
−2 •109.46 31.95 • ( 59.3 − 60 ) is compared to the sensed system frequency. The comparison
=t • ln 1 +
31.95 60 • 4.9 (7) begins at the sensed voltage zero crossing. Usually, just a
single-phase voltage is used. If the sensed frequency differs by
−6.852 • ln ( 0.924 ) =
= 0.542 s the desired underfrequency set point, the relay issues a trip
Using (2) and (6) repetitively, it is possible to simulate UFLS output after a settable timer expires, if the voltage is healthy.
scenarios. The time to each underfrequency level can be Microprocessor-based relays use internal proprietary
calculated, and then the time and frequency at which the algorithms to track the measured system frequency. Either a
breakers open to shed UFLS Level 1 can be calculated. At this single voltage or all three voltages can be used to track the
point, new ΔL and D values are calculated to account for load frequency. Once the frequency set point is reached, the relay
shed, and then the process continues for each remaining UFLS will issue a trip after a settable timer expires, if the voltage is
level. The process ends if enough load has been shed before healthy.
t = 3 s to result in a negative ΔL when frequency will begin to Both technologies use voltage inhibit logic that prevents
increase, or the frequency is less than 57.0 Hz, at which point tripping on underfrequency if the sensed voltage drops below
system collapse can be assumed. Ending the process at t = 3 s the settings threshold. Typically, the undervoltage set point is
is chosen because that is the point at which generator governor in the range of 50 to 80 percent of nominal voltage. This
response can be assumed to assist in increasing generator output supervision is desirable to prevent underfrequency element
to correct the frequency. mis-trips during fault conditions or when the transmission
Xcel Energy NM/TX created a spreadsheet to perform hourly source is de-energized.
calculations for a month’s worth of energy management system F. Xcel Energy NM/TX Regional UFLS Practices
(EMS) data. Hourly EMS generation, load, UFLS, and system
The 2003 northeast blackout ushered in dozens of NERC
inertia are summed and tabulated. Then, system separation
reliability standards that are effective today. NERC PRC-006 is
what-if scenarios are calculated, per the process mentioned
the reliability standard specifying how automatic UFLS
previously, for each hour with ΔL representing lost import
programs are to be studied, designed, administered, and
power (generation) or export power (load). Performing these
documented by regional planning coordinators. The regional
calculations can help assess the potential effectiveness of a
standard that Xcel Energy NM/TX must comply with is the
UFLS program and can pinpoint areas for improvement.
Southwest Power Pool (SPP) PC UFLS Plan [12]. This plan
An additional tool developed allows for detailed spreadsheet
specifies the specific load-shedding frequency, amounts of load
simulations (with behind-the-scenes programming) for any
shed, time delays for UFLS elements, and the allowable
hour in a monthly spreadsheet. The detailed simulation takes
undervoltage inhibit settings.
underfrequency relay intentional time delay and breaker
Table V shows the details for each of the three UFLS levels
operating time into consideration during the calculation. For
required by SPP for entities with greater than 100 MW forecast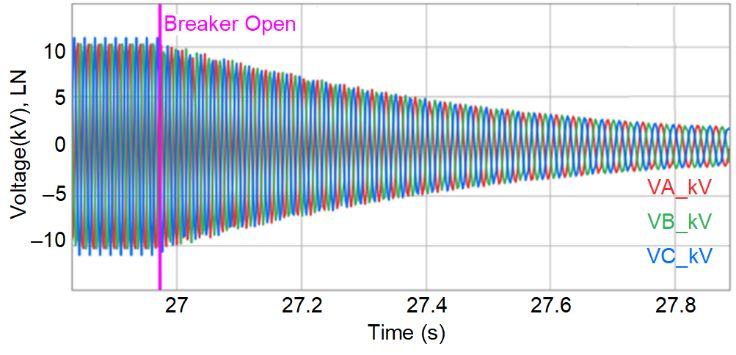
8

peak load. Additionally, the intentional time delay of the           distribution bus. Although the loads will be de-energized for
underfrequency relay must be 30 cycles or less, with no              either relay operation, the load restoration procedure is different
requirement for total clearing time, and the undervoltage inhibit    for a UFLS relay operation and for transmission line relay
setting must be ≤85 percent of nominal voltage.                      operation. At Xcel Energy NM/TX, UFLS relays are designed
                          TABLE V                                    to trip a lockout relay to disconnect the loads. These lockout
  SPP AUTOMATIC UFLS LEVELS AND PERCENTAGE OF LOAD SHEDDING          relays can be reset only by transmission operators and not by
                                                                     the distribution operators. After a UFLS relay trip, the
                         Minimum                 Maximum
                    Accumulated Load        Accumulated Load         distribution operators must discuss load restoration with the
                    Relief as Percentage    Relief as Percentage     transmission operations group. Once the transmission
 UFLS      Freq.    of Forecasted Peak      of Forecasted Peak       operations group has deemed that the system is stable, UFLS
 Level     (Hz)          Load (%)                Load (%)            lockouts are reset and distribution operations can systematically
    1       59.3             10                      25              restore load with guidance from transmission operations.
                                                                        However, after a normal transmission line operation to clear
    2       59.0             20                      35
                                                                     a fault, de-energized loads would remain connected to the bus
    3       58.7             30                      45              and automatically restart once the transmission source is
                                                                     restored. It is important to ensure that UFLS relaying is secure
G. Xcel Energy NM/TX UFLS Practices
                                                                     from misoperation during transmission fault conditions and line
    Xcel Energy NM/TX’s adaptation to the SPP UFLS plan              de-energization to avoid prolonged, unnecessary outages to
was an easy transition since the number of frequency levels and      affected loads.
tripping points matched existing company practices. Xcel
Energy NM/TX sets all underfrequency relays to trip with an          A. Higher ROCOF
intentional time delay of 6 cycles. The exception to this rule is        As the 2016 South Australia blackout proved, UFLS is not
to use a time delay of 30 cycles (maximum allowed) if a              effective if the ROCOF is too high. According to Fig. 1,
load-shedding feeder serves significant motor load. The reason       low-inertia wind and solar generation resources have tripled to
for this exception is discussed in greater detail in the following   nearly 150 GW since the last major UFLS event in the United
sections. Undervoltage inhibit settings are typically set to         States (2011 Arizona-Southern California blackout). Given the
66.67 percent of the nominal voltage. This value allows for          electric industry’s push to a more carbon-free generation fleet,
dependable tripping of underfrequency relays for an                  it is likely that the next UFLS event in the United States will be
underfrequency event when voltage may be collapsing, but also        more severe due to higher ROCOF.
provides adequate security from misoperation during source               Analysis of Xcel Energy NM/TX EMS data has shown that
transmission line fault conditions.                                  there is an inverse correlation between higher penetrations of
                                                                     wind generation to the amount of system inertia. In other words,
  III.   MODERN DAY POWER SYSTEM UFLS CHALLENGES                     as wind penetration increases, system inertia decreases.
   Implementation of a UFLS program is not a trivial task, even      Minimum hourly inertia values continued to trend down,
with guiding NERC standards and long-living individual utility       reaching values of around 25 percent of the maximum available
practices. This is especially true today with increasing             inertia. Analysis of theoretical ROCOF values for simulated
penetration of renewable generation replacing and displacing         Eastern Interconnect separation events show that the declining
synchronous generation. Less synchronous generation equates          system inertia can result in ROCOF values approaching 3 Hz/s.
to less system inertia. Less system inertia equates to higher            Recently, on December 2, 2020, a new hourly and daily
ROCOF for a sudden loss of generation or load. Higher                wind penetration record was set for the Xcel Energy NM/TX
ROCOF equates to deeper frequency excursions, resulting in           balancing area. The instantaneous hourly peak was 88 percent
excessive load shedding and the possibility of total system          (hourly peak wind output divided by the same hourly peak load)
collapse.                                                            and the 24-hour peak was 77 percent (24-hour MWh wind
   Frequency tripping points, intentional time delays, and           generation divided by 24-hour MWh load)! These data show
undervoltage inhibit settings are established per the planning       that for the Xcel Energy NM/TX system, higher ROCOF is
coordinator’s NERC PRC-006 standard. Ranges of settings are          more likely for the next UFLS event.
allowed for an intentional time delay and undervoltage inhibit.          Using the UFLS test system depicted in Fig. 7, it is possible
Most utilities establish standard set points for these two           to illustrate the effect of lower system inertia on a UFLS
settings; however, certain circumstances occasionally require        program. The IPPS tool underfrequency relay models are used
deviation from the standard.                                         at various substations in the test system and are set to shed
   Transmission line faults must be cleared by the transmission      12.5 percent of the system load in three frequency levels.
line relays. If a distribution substation is tapped off a faulted    Undervoltage inhibit settings are set at 67 percent of nominal
transmission line, it will be de-energized when breakers open at     voltage. Intentional underfrequency time delays are set at
the transmission sources. If the distribution substation has         6 cycles for 60 percent of the loads and 30 cycles for 40 percent
feeders equipped with underfrequency relays, it is possible that     of the loads (Table VI). This split represents the actual Xcel
the underfrequency relay could misoperate upon line de-              Energy NM/TX UFLS program due to large amounts of
energization due to the rapid decrease in frequency at the           industrial motor load.
9

                            TABLE VI
    UFLS TEST SYSTEM LEVELS AND PERCENTAGE OF LOAD SHEDDING

                                 Load            Load
                      Peak    Shedding         Shedding
                      Load       With            With         Total
                      Shed     6-Cycle         30-Cycle       Load
 UFLS      Freq.      -ding     Delay           Delay       Shedding
 Level     (Hz)        (%)      (MW)            (MW)         (MW)
    1       59.3       12.5     150              100           250
    2       59.0       12.5     150              100           250
    3       58.7       12.5     150              100           250

   Four cases were run to show the effect of varying system
inertia (Table VII). Inertia was reduced for each case by
replacing synchronous generation with Type IV wind farms
throughout the system. For each case, the 500 MVA generator             Fig. 11. Case 1 simulation response when Maple Unit 2 tripped
Maple Unit 2 was tripped to cause an underfrequency event
                                                                                                     TABLE VIII
(490 MW of lost generation). Each simulation ran for                                       CASE 1 UFLS TEST SYSTEM RESULTS
10 seconds.
                                                                                           Load                                Time     Freq.
                             TABLE VII                                   UFLS Level       (MW)       Shunt     Substation       (s)     (Hz)
                   UFLS TEST SYSTEM CASE STUDIES
                                                                          59.3_6_CYC        150       10-1         Pine        1.388    59.159
                                  Total Wind                Wind
         Total Synchronous        Generation              Penetration    59.3_30_CYC        75        5-1          Oak         1.788    58.921
 Case    Generation (MVA)           (MVA)                    (%)         59.3_30_CYC        25        1-2         Birch        1.788    58.921
   1               3,150                 0                     0          59.0_6_CYC        75        12-1         Fir         1.808    58.940
   2               2,350                 800                  25          59.0_6_CYC        75        12-2         Fir         1.808    58.940
   3               1,550              1,600                   50         59.0_30_CYC        50        5-3          Oak         2.192    58.927
   4               1,050              2,100                   67         59.0_30_CYC        50        2-3         Maple        2.200    58.934

     1) Case 1: 100 Percent Synchronous Generation                           Total          500
    Fig. 11 shows the frequency plot of the sudden loss of Maple
Unit 2. Table VIII shows the time and frequency that each                    2) Case 2: 25 Percent Wind Generation
UFLS level is tripped. The ROCOF for this case just prior to                Fig. 12 shows the frequency plot of the sudden loss of Maple
load shedding is –0.95 Hz/s. For this event, UFLS Levels 1 and          Unit 2 for the 25 percent wind generation case. Table IX shows
2 trip with all the 59.3 Hz load being shed first, followed by the      the time and frequency that each UFLS level is tripped. The
59.0 Hz load. A total of 500 MW of system load is shed. The             ROCOF for this case just prior to load shedding is –1.53 Hz/s.
frequency nadir occurs at t = 1.788 s at a value of 58.921 Hz.          For this event, UFLS Levels 1 and 2 trip with all the 59.3 Hz
The frequency continues to improve and settles out at a value           and 59.0 Hz 6-cycle-delayed load being shed first, followed by
of about 60.2 Hz at t = 10 s. Note that the hand calculations           the 30-cycle-delayed load. A total of 500 MW of system load
match the dynamic simulation fairly closely. These hand                 is shed, like in Case 1. The frequency nadir occurs at t = 1.5 s
calculations will be shown in all four case studies for                 at a value of 58.713 Hz. The frequency continues to improve
comparison. Hand calculations in general will be more                   and settles out at a value just over 60.1 Hz at t = 10 s. Again,
conservative than the actual results, because system voltages,          the hand calculations match fairly closely but indicate that the
generator controls, and system impedances between the                   6-cycle-delayed 58.7 Hz load is shed as well.
generators are not considered. Also, the governor response is
assumed to be three seconds after event initiation. The actual
governor response will vary.
10
Fig. 12. Case 2 simulation response when Maple Unit 2 tripped Fig. 13. Case 3 simulation response when Maple Unit 2 tripped
TABLE IX TABLE X
CASE 2 UFLS TEST SYSTEM RESULTS CASE 3 UFLS TEST SYSTEM RESULTS
Load Time Freq. Load Time Freq.
UFLS Level (MW) Shunt Substation (s) (Hz) UFLS Level (MW) Shunt Substation (s) (Hz)
59.3_6_CYC 150 10-1 Pine 1.100 59.082 59.3_6_CYC 150 10-1 Pine 0.929 58.892
59.0_6_CYC 75 12-1 Fir 1.304 58.844 59.0_6_CYC 75 12-1 Fir 1.038 58.678
59.0_6_CYC 75 12-2 Fir 1.304 58.844 59.0_6_CYC 75 12-2 Fir 1.038 58.678
59.3_30_CYC 75 5-1 Oak 1.500 58.713 58.7_6_CYC 75 2-1 Maple 1.179 58.532
59.3_30_CYC 25 1-2 Birch 1.500 58.713 58.7_6_CYC 75 2-2 Maple 1.179 58.532
59.0_30_CYC 50 2-3 Maple 1.708 58.723 59.3_30_CYC 75 5-1 Oak 1.329 58.543
59.0_30_CYC 50 5-3 Oak 1.717 58.724 59.3_30_CYC 25 1-2 Birch 1.329 58.543
Total 500 59.0_30_CYC 50 5-3 Oak 1.442 58.636
3) Case 3: 50 Percent Wind Generation 59.0_30_CYC 50 2-3 Maple 1.442 58.636
Fig. 13 shows the frequency plot of the sudden loss of Maple Total 650
Unit 2 for the 50 percent wind generation case. Table X shows
the time and frequency that each UFLS level is tripped. The 4) Case 4: 67 Percent Wind Generation
ROCOF for this case just prior to load shedding is –2.58 Hz/s. Fig. 14 shows the frequency plot of the sudden loss of Maple
For this event, all three 6-cycle-delayed UFLS levels trip, Unit 2 for the 67 percent wind generation case. Table XI shows
followed by the 30-cycle-delayed Levels 1 and 2. A total of the time and frequency that each UFLS level is tripped. The
650 MW of system load is shed. The frequency nadir occurs at ROCOF for this case just prior to load shedding is –4.34 Hz/s.
t = 1.2 s at a value of 58.503 Hz. The frequency continues to For this event, all three 6-cycle-delayed UFLS levels trip,
improve and settles out at a value of 61.8 Hz at t = 10 s. Hand followed by all three 30-cycle-delayed levels. A total of
calculations match fairly closely for this case but indicate that 750 MW of system load is shed. The frequency nadir occurs at
the 30-cycle-delayed 58.7 Hz load is shed as well. Of special t = 1.071 s at a value of 58.143 Hz. The frequency continues to
interest (and concern) is the frequency reaching a value of rise to a value of about 65.5 Hz at t = 10 s. Hand calculations
61.8 Hz at the end of the event. This frequency is at the match fairly closely for this case as well. The high final
allowable instantaneous overfrequency tripping value for the frequency is of concern and indicates that generation tripping
Eastern Interconnect, according to NERC PRC-024 [9]. on overfrequency is possible.11
Fig. 14. Case 4 simulation response when Maple Unit 2 tripped
Fig. 15. Cases 1–4 simulation response when Maple Unit 2 tripped
TABLE XI
CASE 4 UFLS TEST SYSTEM RESULTS B. Fixed UFLS Time Delays
Load Time Freq. UFLS relays are set to trip a predefined percentage of load
UFLS Level (MW) Shunt Substation (s) (Hz) when the measured frequency decreases below the
underfrequency set point. These relays are commonly installed
59.3_6_CYC 150 10-1 Pine 0.813 58.641
at substations where they monitor the voltage and frequency of
59.0_6_CYC 75 12-1 Fir 0.875 58.393 the load bus. The frequency measured at the load bus will
59.0_6_CYC 75 12-2 Fir 0.875 58.393 decrease for a system-wide underfrequency event. However, it
58.7_6_CYC 75 2-1 Maple 0.946 58.215
may also decrease during the following cases, which are not
related to a true UFLS condition [13]:
58.7_6_CYC 75 2-2 Maple 0.946 58.215
1. Fault on the transmission line or step-down
59.3_30_CYC 75 5-1 Oak 1.213 58.205 transformer
59.3_30_CYC 25 1-2 Birch 1.213 58.205 2. Fault on the PT circuit
3. Motor spin down after the source breaker opens
59.0_30_CYC 50 2-3 Maple 1.279 58.285
The UFLS relay should not operate for the cases listed
59.0_30_CYC 50 5-3 Oak 1.279 58.285 above. Fig. 16 shows an electromagnetic transient software
58.7_30_CYC 75 5-2 Oak 1.350 58.429 (EMTS) model of four 3 MVA induction motors connected to
a power system through a step-down transformer. In addition to
58.7_30_CYC 25 1-3 Birch 1.354 58.445
the motors, resistor, inductor, and capacitor (RLC) loads are
Total 750 connected to the bus. The model parameters are given in the
appendix. During the simulation, the motor bus voltage and
Graphing the four cases together, Fig. 15 shows how
frequency are recorded, as well as the current flowing from the
increased penetrations of wind generation results in faster
transformer secondary windings into the motor bus. The load
frequency decay and lower frequency nadirs, due to lower
on the bus was varied to simulate different conditions that could
system inertia. The UFLS program established for the UFLS
cause the UFLS relay to misoperate.
test system is adequate for wind penetration levels up to
50 percent. Augmentations need to be made to the program in
order to perform adequately for wind penetrations greater than
50 percent.
Fig. 16. EMTS model12
A detailed analysis of the two power system conditions that The logic diagram of a fixed time frequency element with
could result in UFLS misoperation is provided in the following voltage supervision is shown in Fig. 19. The frequency element
subsections. is blocked if the voltage measured by the relay decreases below
the supervision threshold (27B81). Additionally, a time delay
1) Case 1: Three-Phase Fault on the Transmission Line
(81D1D) is provided so that the underfrequency element can
In this simulation case, all four motors are connected to the
ride through transient conditions. It also provides time for relay
bus and the RLC load is offline. A three-phase fault (3LG) is
processing.
simulated at the end of the transmission line, on the high-side
bus of the transformer. Fig. 17 shows the frequency measured
at the motor bus during the fault. The frequency decayed from
60 Hz to 53 Hz within 115 ms (7 cycles) of the fault occurring.
Fig. 19. UFLS relay logic with voltage supervision
2) Case 2: Motor Spin Down After the Source Breaker
Opens
In this simulation case, the load on the bus remains the same:
all four motors are connected to the bus, and the RLC load is
offline. The circuit breaker (CB1) at the source of the
transmission line is opened. This represents a normal breaker
operation to de-energize the transmission line. There is no fault
on the system. Fig. 20 shows that when the source to a motor
load is disconnected, the voltage on the motor terminals does
not go to zero immediately upon the opening of the source
breaker. Rather, the motor voltage exhibits a decay in
magnitude and in frequency [15].
Fig. 17. Frequency decay during a fault (EMTS)
If the UFLS relay on the motor bus makes a trip decision
based on the frequency, without any additional supervision, it
would misoperate during this fault. Fig. 18 shows the voltage
profile before and after the fault occurs. The voltage on the bus
decays and nears zero around 115 ms (7 cycles) after the fault.
Fig. 20. Voltage decay with motor load (EMTS)
The frequency decay after CB1 opens is shown in Fig. 21.
The frequency decay, caused by motor deceleration after the
breaker opened, and the rate of the motor bus voltage decay are
both determined by the type of motors in use and the type of
loads being driven [14]. Additionally, the transmission line
Fig. 18. Voltage decay during a fault (EMTS) capacitance also keeps the motors excited and can extend the
Most UFLS relays are supervised with an undervoltage voltage decay [8].
block element and a short time delay to prevent underfrequency
tripping for fault and transient conditions. The typical
undervoltage block setting range is 50 to 80 percent of the rated
bus voltage, and the short time delay is 3 to 6 cycles [13].
During this fault simulation, the undervoltage block asserts due
to low bus voltage and prevents the UFLS misoperation.13
Fig. 23. Frequency decay with four motors (event report)
When the voltage decays below the undervoltage block
threshold, the 27B81 bit is asserted, as shown in Fig. 24. All
three levels of UFLS (81D1P, 81D2P, and 81D3P) pick up
Fig. 21. Frequency decay with motor load (EMTS) during the test and then time out and trip after 6 cycles. The
81D1P element picks up 16.7 ms (1 cycle) after the breaker is
The currents and voltages from the EMTS simulation were opened. The undervoltage block asserts 153 ms (9 cycles) after
saved in a COMTRADE file format and replayed in a UFLS the 81D1P element picks up. The Relay Word bits that indicate
relay using a test set. The settings programmed in the UFLS the UFLS element trip are 81D1T, 81D2T, and 81D3T. The
relay are shown in Table XII. TRIP bit asserts and trips the UFLS lockout relay.
TABLE XII
UNDERFREQUENCY RELAY SETTINGS
Protection Setting Set Point
UFLS Pickup 1 (81D1P) 59.3 Hz
UFLS Delay 1 (81D1D) 6 cycles
UFLS Pickup 2 (81D2P) 59 Hz
UFLS Delay 2 (81D2D) 6 cycles
UFLS Pickup 3 (81D3P) 58.7 Hz
UFLS Delay 3 (81D3D) 6 cycles
Undervoltage block setting (27B81) 5.1 kV LN, primary Fig. 24. Digital signals with four motors (event report)
The undervoltage block setting is 67 percent of the rated bus The special case of UFLS relay applications on a motor bus
voltage (13.2 kV, LL). During the test, the UFLS relay was is a known issue that has been described in [13] and [8]. The
programmed to record an event report. Fig. 22, Fig. 23, and prevailing solution to this problem is to increase the time delay
Fig. 24 show the event report for this case. Fig. 22 shows that to about 20 cycles or greater. In most cases, extending the time
the motor loads hold the bus voltage up after CB1 is opened. delay allows the voltage to decay below the undervoltage block
setting before the underfrequency element times out. The UFLS
relay performance was studied for different loading conditions
using the model shown in Fig. 16. The loading conditions are
listed as follows:
• Motor load (varying from one to four motors) along
with a resistor connected to the bus
• Motor load (varying from one to four motors) along
with a capacitor connected to the bus
• Motor load (varying from one to four motors) along
with an inductor connected to the bus
• Only motor load (varying from one to four motors)
Fig. 22. Voltage decay with four motors (event report)
connected to the bus; RLC components were not
Shortly after CB1 opens, the frequency decays below the connected to the bus
lowest underfrequency setting (81D3P), as shown in Fig. 23. The responses of the UFLS relay with a 6-cycle and 30-cycle
delay for all the loading conditions are shown in Table XIII.
Extending the time delay works for most loading conditions and
prevents a misoperation. The only loading condition when this
fails to provide the required supervision is Test 8, when a single
motor and a capacitor are connected to the bus. In this case, a14
time delay of 33 cycles would have prevented the UFLS undervoltage block is typically set to 50 to 80 percent of the
operation. rated bus voltage. A high-undervoltage block setting makes the
TABLE XIII
element secure from misoperations due to motor loads and
TEST RESULTS FOR 6-CYCLE AND 30-CYCLE DELAYS WITH transmission line faults. A low-undervoltage block setting
VOLTAGE SUPERVISION makes the element dependable and ensures that the UFLS relay
UFLS Levels UFLS Levels operates for a system underfrequency event where voltage
1, 2, 3 1, 2, 3 could sag at the bus.
RLC Load Connected 6-Cycle 30-Cycle Table XIV shows a comparison of the UFLS relay operation
Test Connection Motors Delay Delay
for two undervoltage pickup settings: 67 percent and 80 percent
1 Resistor 4 Trip No Op of the rated bus voltage. The time-delay setting is 6 cycles. The
2 Resistor 3 Trip No Op higher voltage setting of 80 percent increases security because
3 Resistor 2 Trip No Op
it takes less time for the voltage to decay to 80 percent of the
rated voltage and to block the UFLS relay from tripping with
4 Resistor 1 Trip No Op
the undervoltage block element. It takes a longer time for the
5 Capacitor 4 Trip No Op voltage to decay below the 67 percent voltage threshold and to
6 Capacitor 3 Trip No Op block the UFLS relay. Reducing the voltage setting increases
the number of misoperations. However, to ensure dependable
7 Capacitor 2 Trip No Op
operation in case of a true underfrequency event when bus
8 Capacitor 1 Trip No Op voltages could also decrease, Xcel Energy NM/TX uses an
9 Inductor 4 Trip Trip undervoltage block setting of 67 percent. Note that with the
lower undervoltage block setting of 67 percent, the UFLS relay
10 Inductor 3 Trip No Op
misoperates for all the tests, as shown in Table XIV.
11 Inductor 2 Trip No Op Increasing the undervoltage block pickup improves security
12 Inductor 1 Trip No Op for some loading conditions. However, to secure the UFLS
13 None 4 Trip No Op
relay completely, additional supervision or a longer time delay
is required.
14 None 3 Trip No Op
B. Current Supervision
15 None 2 Trip No Op
Current supervision can be used to differentiate between a
16 None 1 Trip No Op
system-wide underfrequency event and a loss of source
condition on a motor bus. If sufficient current is flowing into
IV. MODERN DAY POWER SYSTEM UFLS SOLUTION the motor bus, it indicates that loads are connected and the
Cases 1 and 2 in Section III (B) prove the need for the UFLS underfrequency is due to a system-wide event. The UFLS relay
relay to be supervised to prevent misoperations. The following should operate for this case. On the other hand, if the current
three main supervision methods are used to differentiate measured is much lower than the normal load current of the bus,
between a system-wide underfrequency event and a fault or the UFLS relay can be blocked because this indicates a loss of
transient switching condition: source. To test current supervision for motor bus applications,
• Voltage supervision an overcurrent element (50P2) was set to 50 percent of a single
• Current supervision motor’s full load current. The UFLS relay logic is shown in
• ROCOF supervision Fig. 25.
The UFLS relay test results for each supervision method are
presented in this section along with a summary of all the
methods.
A. Voltage Supervision
As shown in Fig. 17, the frequency decays at a load bus
during a transmission line fault and could result in the UFLS Fig. 25. UFLS relay with current supervision
relay misoperating. To prevent this, the underfrequency The current decay when the source breaker is opened is
element is supervised with an undervoltage block. The shown for two cases.15
TABLE XIV
TEST RESULTS WITH VOLTAGE, CURRENT, AND ROCOF SUPERVISION
Number of UFLS With UFLS With UFLS With UFLS With
RLC Load Motors Undervoltage Undervoltage Current ROCOF
Test Connection Connected Block = 67% Block = 80% Supervision Supervision
1 Resistor 4 Trip No Op No Op No Op
2 Resistor 3 Trip No Op No Op No Op
3 Resistor 2 Trip No Op No Op No Op
4 Resistor 1 Trip No Op No Op No Op
5 Capacitor 4 Trip No Op No Op No Op
6 Capacitor 3 Trip Trip No Op No Op
7 Capacitor 2 Trip Trip Trip No Op
8 Capacitor 1 Trip Trip Trip No Op
9 Inductor 4 Trip No Op No Op No Op
10 Inductor 3 Trip No Op No Op No Op
11 Inductor 2 Trip No Op No Op No Op
12 Inductor 1 Trip No Op No Op No Op
13 None 4 Trip No Op No Op No Op
14 None 3 Trip No Op No Op No Op
15 None 2 Trip Trip No Op No Op
16 None 1 Trip Trip Trip No Op
1) Case 1: Only Motor Loads
In this simulation case, all four motors are connected to the
bus and the RLC load is offline. Fig. 26 shows the decay of
current after CB1 is opened.
Fig. 27. Digital signals with four motors (event report)
2) Case 2: One Motor and Capacitor Connected to
Fig. 26. Current decay with four motors (event report)
the Bus
In this simulation case, one motor and a capacitor load are
The digital signals in Fig. 27 show that two levels of connected to the bus. The decay in current after CB1 is opened
underfrequency (81D1 and 81D2) pick up 16.7 ms (1 cycle) is shown in Fig. 28. The current takes a longer time to decay as
after CB1 is opened. The third level (81D3) picks up 25.2 ms compared to Fig. 26.
(1.5 cycles) after CB1 is opened. The current supervision
(50P2) drops out 59.45 ms (3.5 cycles) after CB1 opens. The
50P2 bit drops out and blocks the underfrequency elements
from timing out. This prevents the UFLS misoperation. Fig. 27
shows the digital signals for the same case with only voltage
supervision when the UFLS relay misoperated.16
TABLE XV
UFLS RELAY SETTINGS WITH ROCOF SUPERVISION
Protection/Logic setting Set Point/Logic
UFLS Pickup 1 (81D1P) 59.3 Hz
UFLS Delay 1 (81D1D) 6 cycles
UFLS Pickup 2 (81D2P) 59 Hz
UFLS Delay 2 (81D2D) 6 cycles
UFLS Pickup 3 (81D3P) 58.7 Hz
Fig. 28. Current decay with one motor and one capacitor (event report) UFLS Delay 3 (81D3D) 6 cycles
ROCOF Pickup 1 (81D4P) 59.7 Hz
The digital signals in Fig. 29 show that the frequency
elements (81D1, 81D2, and 81D3) pick up and then time out. ROCOF Delay 1 (81D4D) 2 cycles
The current supervision (50P2) does not drop out fast enough ROCOF Pickup 2 (81D5P) 59.4 Hz
to prevent the UFLS operation. The undervoltage block
ROCOF Delay 2 (81D5D) 2 cycles
(27B81) picks up after the UFLS has tripped. Both current and
voltage supervision could not have prevented the misoperation ROCOF Pickup 3 (81D6P) 59.1 Hz
for this case. ROCOF Delay 3 (81D6D) 2 cycles
Undervoltage block setting (27B81) 5.1 kV LN, primary
Logic Variable 1 (LV1) 81D1 * !(81D4T * !LV1)
Logic Variable 2 (LV2) 81D2 * !(81D5T * !LV2)
Logic Variable 3 (LV3) 81D3 * !(81D6T * !LV3)
Logic Variable 4 (LV4) 81D1T * !LV1
Logic Variable 5 (LV5) 81D2T * !LV2
Logic Variable 6 (LV6) 81D3T * !LV3
Fig. 29. Current decay with one motor and one capacitor (event report) Trip logic LV4 or LV5 or LV6
As compared to voltage supervision results shown in
Each fixed-time underfrequency trip bit (81D1T, 81D2T, or
Table XIV, there are fewer misoperations with current
81D3T) is supervised with an ROCOF element (LV1, LV2, or
supervision for a motor bus.
LV3). The desired ROCOF supervision rate is 12 Hz/s, as
C. ROCOF Supervision shown in (8).
The ROCOF during a system-wide underfrequency event is 81D4P − 81D1P
much lower than the ROCOF during a source opening to de- ROCOF supervision =
81D4D / 60
energize a motor bus. The UFLS relay logic with ROCOF (8)
59.7 − 59.3 Hz
supervision is shown in Fig. 30, where ROCOF pickup = UFLS = = 12 Hz/s
2 / 60 s
pickup +0.4 Hz. This logic uses two definite-time frequency
elements with a difference of 0.4 Hz in the pickup settings and The worst-case (lowest) ROCOF for the system shown in
2-cycle time delay to create a ROCOF element. This is different Fig. 16 was 34 Hz/s. In this worst-case simulation, all four
from the built-in ROCOF elements that are available in some motors and the capacitor load are connected to the bus. The
microprocessor-based relays. ROCOF setting of 12 Hz/s is twice the frequency decay
experienced in South Australia during the 2016 blackout and at
least half of the worst-case ROCOF recorded in the simulation
(34 Hz/s).
The frequency decay at some high-inertia motor buses after
source disconnection could be lower than 12 Hz/s. The ROCOF
setting would have to be decreased to below 12 Hz/s for these
systems [14]. Current supervision can also be used in addition
to ROCOF to improve security for such a system.
The UFLS relay operation with ROCOF supervision is
shown in Table XIV. The relay correctly restrains for all cases
Fig. 30. ROCOF supervision and provides adequate security.
The settings used in the relay for ROCOF supervision are The results for the three supervision methods (voltage,
shown in Table XV. current, and ROCOF, shown in Table XIV) can be summarized
as follows:17
UFLS relays are typically set with voltage supervision.
Voltage supervision can be set at a certain percentage of
rated voltage (50 to 80 percent) and applied to every bus.
This threshold does not have to be calculated for an
individual bus and is easy to set. However, as shown in
Table XIV, this is not sufficient to prevent misoperations
at a motor bus.
• Extending the time delay to 30 cycles will prevent
misoperations at a motor bus. However, with increased
penetration of renewables, there may be a need to
reduce the 30-cycle time delay due to lower system
inertia and faster ROCOF.
• Current supervision also improves the security of the
UFLS relay but does not prevent misoperation for all
cases. The current thresholds are not universal and have
to be calculated based on the individual bus load.
Fig. 31. Case 1 comparison of faster load shedding to staggered load
Additionally, UFLS relays may not be connected to shedding
current transformers, thus requiring additional wiring in
the relay panel. 2) Case 2: 25 Percent Wind Generation
The ROCOF element provides correct supervision for Fig. 32 shows the frequency response for the 25 percent
every test, as shown in Table XIV. The ROCOF wind generation case. The ROCOF is the same as the original
supervision can be applied to any bus with capable case, and the same amount of load is shed (500 MW). Faster
microprocessor-based relays. This threshold must be set load shedding results in a 0.2 Hz improvement of the frequency
below the worst-case (lowest) ROCOF of the motor bus nadir, and frequency recovers to 60 Hz about a second faster.
during source disconnection.
D. Faster UFLS Implementation
Using the ROCOF supervision scheme allows a change in
the test system UFLS program. All intentional time delays can
now be securely set to 6 cycles to allow faster load tripping for
underfrequency events. The four test cases from Section III are
now revisited, and results of faster ROCOF-supervised UFLS
are compared to the original results.
1) Case 1: 100 Percent Synchronous Generation
Fig. 31 shows the frequency response comparing staggered
tripping versus tripping all loads in a UFLS level at the same
time. The ROCOF is the same as the original case. Both cases
shed the same amount of load (500 MW). The frequency nadir
is about the same for both cases, but faster load shedding allows
the frequency to recover to 60 Hz faster than staggered load
shedding. The frequency settles out at about the same value for Fig. 32. Case 2 comparison of faster load shedding to staggered
load shedding
both cases.
3) Case 3: 50 Percent Wind Generation
Fig. 33 shows the frequency response for the 50 percent
wind generation case. The ROCOF is the same as the original
case; however, only 500 MW of load is shed with faster load
shedding instead of 650 MW using staggered time delays. As
Fig. 33 shows, the frequency nadir stays above 58.7 Hz,
avoiding unnecessary load shedding. Faster load shedding
results in a 0.2 Hz improvement of the frequency nadir. More
importantly, the frequency settles out at about 60.3 Hz instead
of 61.8 Hz, thus avoiding the potential for overfrequency
generator tripping.You can also read