CAMBRIDGESHIRE'S VISION 2007 - 2021 Countywide Sustainable Community Strategy - Working together to improve the quality of life for all who ...
←
→
Page content transcription
If your browser does not render page correctly, please read the page content below
CAMBRIDGESHIRE’S VISION
      2007 – 2021
      Countywide Sustainable Community Strategy

Working together to improve the quality of
life for all who live, learn, work and travel in
Cambridgeshire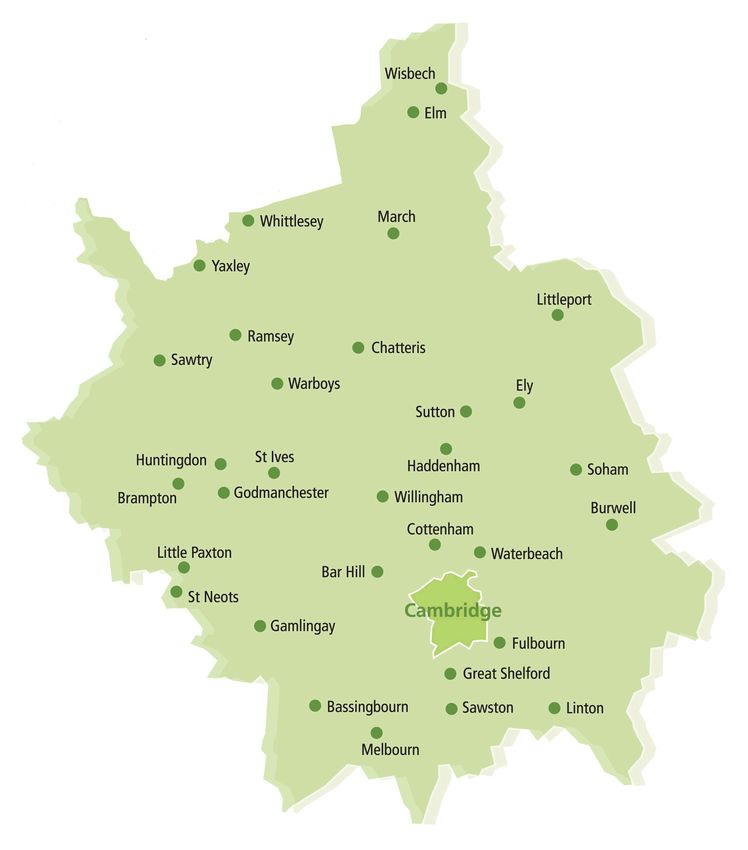
CONTENTS

Foreword                        page 3
Vision Statement                page 4
Vision in Context               page 5
Introduction to the County      page 8
The Five Themes:
Managing Growth                page 17
Economic Prosperity            page 19
Environmental Sustainability   page 22
Equality and Inclusion         page 24
Safe and Strong Communities    page 27
Partner Organisations          page 29

                                         2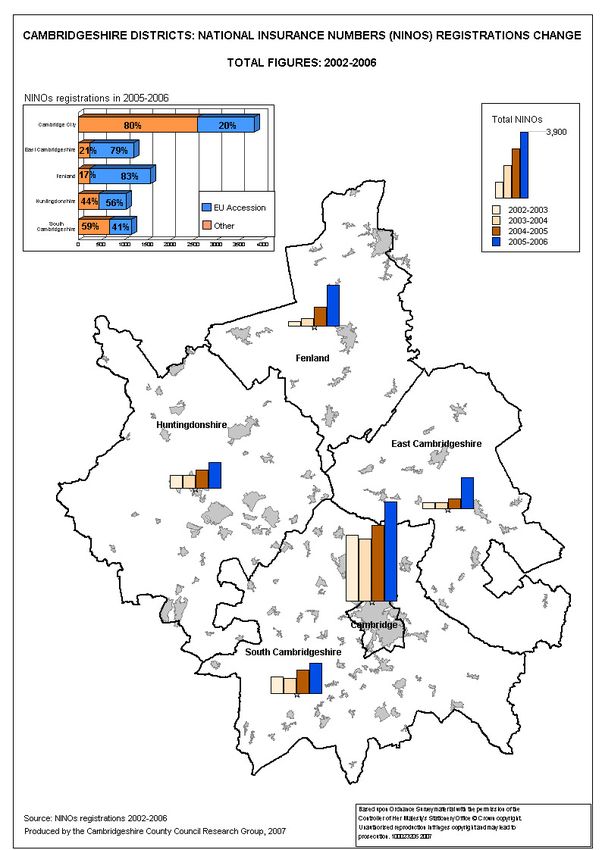
FOREWORD
This vision sets out the commitment from partner organisations to provide high quality cost effective public services that meet the
needs of the people of Cambridgeshire now, and in the future.

Cambridgeshire is a good place in which to live, learn, work and visit but it is also a county facing many challenges, not least of
which is the anticipated housing and population growth. We can meet these challenges by working together to improve the quality
of life for everyone.

We have set out in this document our collective vision and the priority areas we will be focusing on to ensure the needs of all our
residents are met. The priorities in this vision document have been identified through the input and engagement of different
partnerships and organisations and under the coordination of an overarching Board that brings together high level representatives
from key organisations across the public, private and voluntary sectors involved in the delivery of local services. This Board is
called Cambridgeshire Together.

We will continue our joint work to tackle the issues that are most
important; and we want to work with you to achieve this.

The Cambridgeshire Together Board

                                                                                                                                      3
VISION STATEMENT
Our vision is for Cambridgeshire to be a county of strong, growing, prosperous and inclusive communities supported by excellent
services where people can fulfil their potential; live longer, healthier lifestyles; and influence decision-
decision-making.
We will deliver this vision by focusing on five key goals, each with a set of priorities to achieve them. These are (in no particular order):
* Growth – accommodating growth, creating flagship communities and ensuring the benefits of growth and infrastructure are enjoyed by all
communities
* Economic Prosperity – supporting the special role of Cambridgeshire as a centre of knowledge and innovation, especially in low carbon
technologies
* Environmental Sustainability – meeting the challenges of climate change while maintaining a high quality environment
* Equality and Inclusion – supporting vulnerable groups and enabling them to participate fully in community life, and encouraging healthier and
more sustainable lifestyles
* Strong Communities – engaging citizens in service planning and improvement and ensuring our communities enjoy good quality of life and
health, with low crime, unemployment, discrimination and inequalities
The need to ensure sustainability through our actions is an underlying principle through this vision. The social, economic and environmental aspects
of the priority outcomes in this vision have to be considered to ensure that our goals are achieved and sustained, i.e. incomes rise, educational
standards increase, the health of our communities improves and the general quality of life is improved.
Cambridgeshire Together has a clear and strong commitment to:
* Recognising geographical, social and economic differences within the county and responding appropriately to challenges and needs;
* Working in partnership at the local, sub-regional and regional level;
* Empowering our local communities to engage in shaping service planning and delivery;
* Focusing on our citizens and celebrating Cambridgeshire’s diversity by promoting social inclusion;
* Recognising and supporting the role of the voluntary sector in service delivery and community and citizen involvement
We already have a number of strong partnerships within the county such as the Children and Young People Strategic Partnership (CYPSP) and the
Cambridgeshire & Peterborough Waste Partnership (RECAP) among many others. We want to build on existing examples of good practice by
conducting a review of our governance arrangements, linking to the LAA, to ensure these are fit for purpose and enable us to achieve an even more
integrated approach to service planning and delivery.
4OUR SHARED VISION FOR CAMBRIDGESHIRE IN CONTEXT
A local, regional
regional and national drive for partnership and locality working
The purpose of this vision is to set the long term priorities for Cambridgeshire, which will promote the well being of local people, economy and
environment. We need to build on successes and move forward in an ever changing environment, emerging trends and changes in government
policy that are moving the partnership agenda to the core of what we do, as local agencies tackle issues together to achieve better results and
greater efficiency.
The priorities in the five district-based Sustainable Community Strategies have provided the building blocks for this document, which covers the
period from 2007 to 2021. The aim is to bring together the ambitions and aspirations of all Cambridgeshire’s communities and the organisations
providing services to them. We expect this document to develop and to be reviewed every three years to ensure our objectives remain relevant and
challenging.
Cambridgeshire’s Local Area Agreement (LAA) will be the three year delivery plan for this vision. The LAA, alongside the Action Plans developed by
other key partnerships, will focus on delivery of outcomes that will make a difference on the ground.
For thirty years or more, successive governments have acknowledged that many of society’s most intractable problems can only be dealt with by
agencies working together to tackle them at community level.
In October 2006 the Local Government White Paper, Strong and Prosperous Communities, was pubished setting out government’s ambitions to give
local people and local communities more influence and power to improve their lives. The White Paper emphasized the need to deliver better public
services through a rebalancing of the relationship between central government, local government and other public service providers, and local
people.
Effective action depends on local public service providers having the freedom and ability to adapt and change what they are doing, and on strong
joint working at the local level that facilitates the reshaping of services to meet the different needs of different communities.
We recognise the opportunities and challenges the new national agenda sets out for Cambridgeshire and we will respond to this agenda for change
by continuing to strenthen our commitment and approach to partnership working, improve the capacity of partnerships and partner organisations,
and develop shared responses to improve the delivery of services.
What we do is set within the wider context of national and regional policy. We will consider key policy developments and strategies such as the
recent Comprehensive Spending Review (CSR 2007) setting out the governments long term review of government spending; the Regional Spatial
5Strategy (RSS) laying out the framework for planning and development in the East of Enland to the year 2021; the Regional Economic Strategy
(RES) setting out how the region can maintain its position as a leading UK, and global, region; and the Review of Sub-National Economic
Development and Regeneration (SRN) of economic development, while keeping the needs and aspirations of our local communities at the heart of
what we do.
Vision for Cambridgeshire, the Local Area Agreement (LAA) and the Local Strategic Partnerships (LSPs)
Cambridgeshire’s Vision
National Countywide Sustainable
Community Strategy Cambridgeshire’s Local Area
Priorities
Agreement - LAA
(Cambridgeshire Together) (Vision’s delivery plan)
Regional
Priorities
Sustainable Community
District Sustainable Community Strategies Action Plans
Strategies
Local
Priorities (Local Strategic Partnerships)
OUTCOMES
6Overview of governance arrangements and partnerships involved in delivery of outcomes:
Local Area Agreement Joint Accountability Committee (Scrutiny)
Cambridgeshire Together Board
LOCALITY WORKING
Cambridgeshire
Chief Executive’s
Liaison Group
(CELG)
LAA Reference Group (LAARG)
(Officer Support to Board)
District Local
Strategic Parish Plans
Partnerships Neighbourhood Panels Neighbourhood
(LSPs) Management
Key Thematic Partnerships (*)
• Community Safety Strategic
Group
• Children & Young People
Strategic Partnership (CYPSP)
• Economic Development Forum /
Greater Cambridge Partnership LSP thematic
• Cambs Care Partnership and partnerships
Adult Task Group
• Health and Well Being
Partnership (new)
• Climate change & environment
partnership (new)
• CVSIC
(*) Governance arrangements under the Local Area Agreement are undergoing a review at the time of writing this document (January 2008)
7INTRODUCTION TO CAMBRIDGESHIRE
Cambridgeshire’s population has grown by 26% since 19811 and the county is forecast to be among the fastest growing in the country over the next
fifteen years2. 73,300 new homes are planned between 2001 and 20213. Population forecasts linked to this increase suggest that
Cambridgeshire’s population will grow a further 15% between 2006 and 20214. The population is ageing rapidly; the number of people aged 85+ is
forecast to increase by 58%, compared to a national average increase of 53%.
Forecast population change 2006-
2006-2021 (Source: Cambridgeshire County Council Research Group)
Total
Total Population Population Population
Year
Population aged 0 - 19 aged 20 - 64 aged 65+
2006 578,800 138,000 352,700 88,100
2011 621,900 141,300 377,900 102,700
2016 650,400 142,400 384,500 123,500
2021 664,800 143,300 381,300 140,200
The Office for National Statistics produces official population projections, based on historical trends, which form an element of the calculation used
to allocate government funding to local authorities. These projections suggest that Cambridge City’s population will grow by 9%, East
Cambridgeshire’s by 20%, Fenland’s by 18%, Huntingdonshire’s by 13% and South Cambridgeshire’s by 15%2. Alternative forecasts are produced
locally that are based on the planned distribution of new housing. These policy-based forecasts suggest that Cambridge City’s population will grow
by 31%, East Cambridgeshire’s by 6%, Fenland’s by 11%, Huntingdonshire’s by 3% and South Cambridgeshire’s by 24%4 This distribution of growth
reflects a policy-led concentration of development in and around Cambridge and in the market towns.
At a time of major growth in the economy and housing needs of Cambridgeshire sustainability is key for the county to meet the pressures
development puts on the environment, infrastructure and other supporting services such as schools and health services. A 40% increase in the
delivery rate of new housing and the doubling of affordable housing is needed to support growth. Investment in social infrastructure must also meet
the demands of growth in development in order to tackle social deprivation. In addition, the potential effects of climate change are of particular
significance with many areas at risk of flooding.
Cambridgeshire has already embraced a strategy for increasing the rate of housing development as set out in the Cambridgeshire and Peterborough
Structure Plan 2003, reiterated and strengthen in the emerging Regional Spatial Strategy (RSS – the East of England Plan). The increase has
8already been witnessed by the actual housing completions of recent years. Cambridgeshire is part of the London – Stansted- Cambridgeshire –
Peterborough growth area. The strategy for growth specified in the Structure Plan and draft RSS seeks to deliver 73,300 homes between 2001 to
2021, concentrated in and around Cambridge and in the county’s market towns.
Planning new communities in Cambridgeshire is fully integrated, combining infrastructure provision, housing strategy and economic growth. We
have implemented a new programme designed to ensure progress is kept on track and issues are tackled in a timely manner. Partnership working
between agencies is coordinated by Cambridgeshire Horizons, the local delivery vehicle.
Cambridgeshire is the home to one of Europe’s leading and most dynamic high technology clusters that is also the focus of economic growth in the
East of England. Cambridge City has a national and international reputation as a centre of learning with its world famous university, and research
supported by the emergence of high technology industries in and around it. The relative prosperity of the city together with its history and the quality
of its built and natural environment make it a desirable place in which to live and work and to visit. The City sees significant commuting into the city
for employment as well as four million tourist visitors each year.
A substantial number of new homes will be built in and around the city over the next few years. Growth brings opportunities for building well
designed affordable homes – these are needed as at present only one quarter of Cambridge City residents can afford even the cheapest 25% of
housing in the City5. . Housing growth also brings opportunities for investment in sustainable transport and new community facilities and open
spaces. This growth, however, will also put pressure on the city and increase demands on community facilities and public services.
There are marked differences in levels of income between communities living in different parts of the city. Nearly one person in nine and one child
in five lives in a household claiming Housing or Council Tax Benefit, with half of all claimants concentrated in a fifth of the geographic area6. People
living and working in the city are amongst the most highly qualified in the country but a significant proportion of economically active adults (16%) do
not hold any qualification at all7.
Migrant workers are making up an increasing proportion of the local labour market and the city has the highest volume of internal and international
migration per 1,000 population in the country8. The minority ethnic population in the City is the highest proportion in the county, with 11% of people
from ethnic groups other than White9. Over 40 different languages are spoken in the city reflecting its diverse communities.
South Cambridgeshire
Cambridgeshire consists of approximately 900 square kilometres of countryside that surround the city of Cambridge. It is predominantly a
rural area that contains no towns, but has a number of smaller settlements and 101 parishes. The district is part of one of the government's four
"growth" areas identified for substantial development over the next 10-12 years. Population forecasts predict the district will grow by 24% by 2021
from a population of 138,200 people in 200610. Although the population of the growth areas is likely to be younger and economically active, the
population in the rural areas is likely to become older. Population forecasts show an 87% increase in people aged over 65 by 2021.
The district has, once again, been ranked in the top ten places to live by Channel 4's Location, Location, Location. The programme stated that it is a
quiet place to live, with exceptionally low crime figures and an impressive 100% of residents having a kerbside recycling facility. The positive
comments go on to mention the good travel links to London and Stansted Airport and the fact that there is plenty to do in the district, as well as in
neighbouring Cambridge City.
9East Cambridgeshire is essentially rural in nature with the three market towns of Ely, Littleport and Soham. The character of the area is mixed, with
the Southern area around Newmarket being relatively prosperous whilst some parishes in the north of the district have previously received European
transitional area funding. The City of Ely with its outstanding cathedral is an attraction for national and international tourists. Overall, the quality of
life in East Cambridgeshire is high, and in a recent national survey Ely was rated one of the 10 most desirable places to live in the UK. The district
has a population of 76,40011, with an increasing proportion over retirement age. The traditional agricultural employment of the Fens is
declining and is being steadily overtaken by new industries such as the biotech and knowledge based industries spreading north from
Cambridge.
The largest single factor affecting the area is the impact of population growth. East Cambridgeshire has been one of the fastest growing districts in
the Country. This population increase brings with it challenges - particularly concerning the availability of affordable housing and the increasing
pressure on the transport infrastructure, particularly the A10 corridor and the rail route to Cambridge and London, related to out-commuting. The
last census revealed that almost half of all employed residents commute to work outside the district. This pattern has been confirmed by recent
local surveys of new housing and rail commuters. Overall, unemployment is low, but employment growth is also low.
When measured using the national Index of Multiple Deprivation, East Cambridgeshire is ranked at 285 out of 354 authorities (with 1 being the
most deprived)12. This picture does not, however, reflect the pockets of deprivation that do exist in the district as a result of the declining traditional
industries, limited public transport access and rural isolation. According to the 2011 Census, just 2% of East Cambridgeshire’s population is from
ethnic groups other than White . The largest ethnic minority population in the district is Travellers.
Fenland
Fenland is a rural district in the north of the county. It is an area of unique and beautiful landscapes and has a thriving local community. Fenland’s
four market towns of Wisbech, March, Whittlesey and Chatteris, provide the main service, commercial and social centres for the area. However,
many residents live in rural settings and therefore access to services is a key concern for local people.
In the past few years, great progress has been made through partnership working in improving the quality of life for Fenland’s communities. The
District does however face a number of challenges related to the area’s high level of deprivation. Teenage pregnancy is higher than across the rest
of Cambridgeshire13, and nearly one in four children in Fenland are now considered to live in a low-income household14, with clear implications for
their health and educational achievement. Life expectancy in Fenland has improved in recent years, particularly for men, but remains lower than
the rest of Cambridgeshire. Life expectancy for women in Fenland is around three and a half years lower than for women in South
Cambridgeshire15. , The average number of premature deaths is significantly higher than the Cambridgeshire average16. The high number of deaths
is related to poor diet, low levels of exercise, high levels of smoking, and high level of road traffic accidents. The district also has the highest level of
obesity in the East of England17 and high levels of diabetes18.
Fenland is a fast and growing district, and there is a need to ensure services and infrastructure are fit to serve Fenland’s growing population, with a
large and growing migrant population, particularly from Eastern Europe. There is shortage of affordable housing with the increase in house prices
outstripping increases in average earnings. Average full-time wages in Fenland are comparably low compared to the rest of the county ( £421.90
per week compared to Cambridgeshire’s average of £493.0019). Raising skill levels in the district is a key challenge that must be addressed to help
break the cycle of deprivation by attracting higher skilled jobs to the area. But there is also great potential for increased inward investment and
10business growth in priority sectors. Future business growth is most likely to be achieved in sectors relating to Environmental Technologies, Food and
Drink, Manufacturing and Engineering, and Knowledge Based Business.
Huntingdonshire is the largest district within Cambridgeshire by both area and population size. It is a diverse area of nearly 350 square miles with
approximately half the population living in four market towns – Huntingdon, St Neots, St Ives and Ramsey – and the remainder in key settlements
and villages in varied and attractive countryside. Huntingdon and St Neots are the largest towns and are the area’s key economic and service
centres. The district is a generally prosperous area where the majority of people enjoy a good quality of life. However, there are pockets of higher
relative deprivation within the market towns – Oxmoor in Huntingdon, Eynesbury in St Neots and parts of Ramsey – and some rural areas are
affected by sparsity, isolation and poor access to services and facilities.
Huntingdonshire is at the centre of the Cambridge to Peterborough growth area and has experienced significant growth in the past 20 years, which
has resulted in an imbalance between jobs, houses and infrastructure. As a result a large number of people commute out of the area to work and a
there is a lack of facilities in some communities. Growth has led to a good mix of new homes that sit alongside historic buildings and current and
future opportunities to provide strategic open space. Provision of affordable housing is a challenge, with average house prices at more than six
times the average annual wage20 and the pressures of land availability and funding. Managing the opportunities and pressures from future growth
is a continuing focus in the area.
11Other challenges facing the county that will require all partner agencies to work together to tackle them include:
Community Safety21
Domestic violence is the most common form of violence in rural areas. Much has been
done to support victims in the county, but it remains a largely under-reported crime and
a crime with the highest proportion of repeat victims. In Cambridge and Huntingdon it is
Cambridgeshire - Recent Trend in the top reason for referrals to Children’s Services, the second highest reason in Fenland
Total Crime and East Cambridgeshire, and third in South Cambridgeshire.
60000 Alcohol misuse is also a growing problem in the county, which requires partnership
working to address. In addition to the health implications, alcohol misuse increases the
50000 risk of an individual becoming involved, either as a victim or offender, in a range of
Number of Crimes
40000
serious offences including sexual assault, rape, domestic abuse, physical assault and
robbery.
30000
In Cambridgeshire alcohol use increases with age and is more prevalent in girls than
20000 boys. For year 8 pupils (12 to 13 year olds), 26% of males and 28% of females reported
having drunk some alcohol in the week before survey. This figure rises to 47% of males
10000 and 50% of females for pupils in year 10 (14 to 15 year olds). Fenland and South
Cambridgeshire have noticeably higher rates than the county average.
0
2003/04 2004/05 2005/06 2006/07 Neighbourhood Panels across the county have identified other areas of public concern:
Year antisocial behaviour and inappropriate speed. Parking is also a cause for concern in
built up community areas. These are all issues where partnership working can make a
significant contribution to finding solutions.
12Climate change
Tackling climate change may be one of the most
difficult challenges facing the county. The various
reasons for this challenge being especially important
for Cambridgeshire could be highlighted as:
* The current and expected rate of growth with an
opportunity to build sustainability into new and
expanded communities
* High levels of motor traffic and carbon emissions
which need to be mitigated with minimum impact
on quality of life in local communities
* A relatively low lying county susceptible to both
fluvial and (potentially) coastal flooding
* Capitalising on an advanced and dynamic
economy with excellent potential to grow and to
lead in low carbon technology and businesses
Dark blue shows area that
could be affected by flooding
from a river, if there were no
flood defences
Source: Environment Agency
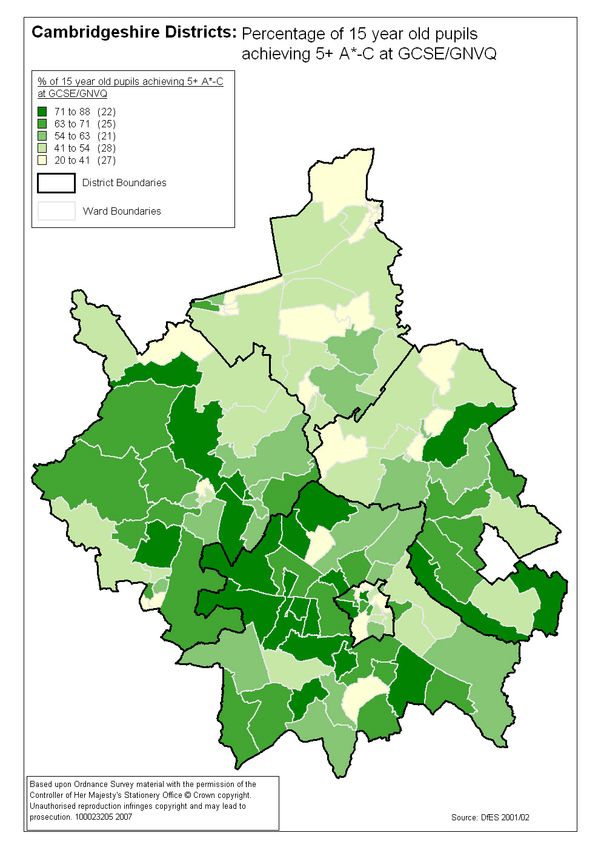
13Education
Educational achievement continues to be of very high
importance to the life chances of individual children and
young people in Cambridgeshire.
There are relative differences in attainment across the
county, most notably in Fenland. In 2006, 46.4% of pupils in
Fenland achieved 5+GCSEs at grades A-C compared to 59.9%
for the whole of Cambridgeshire (and below the national
average of 58.8%)
We must extend educational opportunity across the county by
promoting rich environments for learning in schools, colleges,
libraries and homes.
The achievement of children and young people cannot be
measured solely in terms of educational achievement. We
recognise the huge impact of health inequalities, social
factors and economic circumstances on the life chances of
children and young people and we will work to address these
where they exist.
14Migration
International migration is now a bigger factor in the growth of the national
population than natural change. The demographic impact is even greater
in some parts of the country – of which Cambridgeshire is one.
Migrant workers range from the highly educated and skilled, to those who
are highly motivated but have no formal education; from migrants who
come as seasonal workers, to those recruited by overseas companies to
work in international businesses, to others who came with their families
because there were no employment opportunities in their countries of
origin.
The increase in diversity has brought enormous economic and social
benefits, but change and migration can also create some challenges. Many
migrant workers are working below their skill level even though the skills
they possess can be in areas where there are skills shortages. The well-
being and integration of migrant workers is affected by their financial
situation, access to adequate and affordable accommodation and access
to English language courses designed to meet their needs.
High levels of migration can also put immediate pressures on some
services. There is a need for all partners to understand what these
changes mean for local public services. Coordination needs to go beyond
local authority and agency boundaries making links with key agencies in
the private sector such as major employers and housing providers.
15Diverse needs
IMD 2004: Cambridgeshire SOA rankings
The county is a relatively prosperous place with average earnings in
Cambridgeshire above the national and regional average, although IMD 2004: Rankings for Cambridgeshire
1 to 74 (most deprived) (73)
there are wide variations across the area. In the CLG Index of 74 to 147
147 to 220
(73)
(73)
Multiple Deprivation (IMD) 2007, Cambridgeshire ranked 135 out 220 to 293
293 to 365 (least deprived)
(73)
(73)
Wisbech
Wisbech
of 149 shire counties and unitary authorities, placing it among the
least deprived 20% of authorities in the country. Prosperity and
quality of life however will not continue as a matter of course
without growth in the research and hi-tech sectors being met by Whittlesey
Whittlesey March
March
affordable housing and infrastructure to support its on-going
development.
Yaxley
Yaxley
There are also contrasts in the distribution of wealth across the Chatteris
Chatteris
county with pockets of significant deprivation present in both rural
Ramsey
Ramsey
and urban settings. Out of the 354 district councils and unitary Sawtry
Sawtry
authorities in the IMD, Huntingdonshire, South Cambridgeshire and Ely
Ely
East Cambridgeshire score among the least deprived 20%, Soham
Soham
St.
St. Ives
Ives
Cambridge City scores among the least deprived 40%, and Fenland
scores among the most deprived 40%. Huntingdon
Huntingdon
Burwell
Burwell
Below district level there is considerable variation in deprivation. Cambridge
Cambridge
Three small areas in the county (known as super output areas) fall Cambourne
Cambourne
within the most deprived 20% of super output areas in the country.
St.
St. Neots
Neots
All of these are in or around Wisbech in north Fenland. A further
ten super output areas fall among the most deprived 25% Gamlingay
Gamlingay
Sawston
Sawston
nationally. Six of these are in Fenland, one is in the Oxmoor area of
Huntingdon and three are in Kings Hedges ward in Cambridge. Linton
Linton
Melbourn
Melbourn
Inequalities are present in the city area but those rural areas that
are more remote from cities, particularly to the north and east of
the county, experience generally lower levels of skills and income
and greater health inequalities than the rest of the rural or urban
economy. (C) Crown Copyright. All rights reserved. Cambridgeshire County Council, 100023205, 2004. Source: ODPM 2004
16OUR PRIORITIES:
1. Managing Growth
2. Economic Prosperity
3. Environmental Sustainability
Sustainability
4. Equality and Inclusion
5. Safe and Strong Communities
{PICTURES TO BE INCLUDED HERE}
171. MANAGING GROWTH
We need to ensure the effective management and
delivery of new communities, the growth of KEY POINTS
existing communities and consider the impact upon quality of
life that this will have in Cambridgeshire. * 73,300 new homes are planned for Cambridgeshire
between 2001 and 2021
This requires an understanding of the long term impact
* Between 2006 and 2021 there is a forecast total
which growth will have on the services we deliver. This
population increase of 15% (compared to the
includes determining the things we need to do to deliver
England average of 8%)
sustainable growth (such as providing affordable housing),
and the things we need to do to respond to growth (such * The number of young people (0 to 19) is expected to
as employing more teachers and nurses). increase by 4% (compared to the England average of
a 2% drop). The increase in the number of young
The supply of good quality and affordable housing has people is forecast for growth areas and market towns
an important impact on the ability of the local area with decreases in rural areas
to attract skilled workers and secure labour mobility. * The number of older people (65+) is expected to
increase by 59% (compared to 31% across England)
New settlement growth also needs to be planned in a way with the following breakdown:
that helps maintain low crime levels. In addition, we need - 64% increase in 65 – 74s
to provide infrastructure that encourages physical activity such - 53% increase in 75 – 84s
as walking and cycling and environments that support social - 58% increase in 85+s
networks, which have a positive effect on mental and physical * ‘Entry level’ house prices have increased countywide
health. from £68,500 in early 2001 to £132,000 in 2006.
Increases in road traffic volume is also a key issue that
will need to be addressed and carefully managed.
18PRIORITY OUTCOMES
OUTCOMES HOW WILL OUTCOMES BE ACHIEVED?
1.1 Provision of affordable housing in new and 1.1.1 Providing new affordable housing and adaptations to existing housing in
established communities established communities
1.2.1 Ensuring early provision of services for children and young people, including
schools and children’s centres
1.2.2 Ensuring early provision of affordable leisure and appropriate community facilities
and social infrastructure that is accessible to all
1.2 Appropriate infrastructure
infrastructure for new and established
communities 1.2.3 Ensuring easily accessible local and strategic open spaces that are safe, clean
and rich in biodiversity
1.2.4 Providing a well maintained and managed highways network
1.2.5 Ensuring the appropriate infrastructure and transport networks are in place and
maintained to facilitate and sustain economic development
1.2.6 Supplying new developments with necessary services
1.2.7 Ensuring planned growth is sustainable with job and housing growth running in
tandem
1.3.1 Improving community safety through well designed and managed developments
1.3 Well designed and well managed developments 1.3.2 Ensuring high sustainability standards are present in the design, mix and
construction and occupation of new developments including energy efficiency and more
sustainable waste management
192. ECONOMIC PROSPERITY
The draft regional economic strategy for the East of England identifies Greater
Cambridge as one of the seven ‘engines of growth’ for the region – a real KEY POINTS
economic geography that will drive the future economy and growth for the
county.
* The Cambridge sub-region is expected to
accommodate 75,000 jobs over the period 2001-
The enhanced role envisaged for upper tier local authorities in the Sub National
2021
Review of economic development will also enable local authorities to lead
alongside partners in achieving economic development. * In 2006, 78% of the working age population in
A successful economy capable of adapting to changing circumstances must be Cambridgeshire were in employment
built on strong foundations. * Unemployment claimant rate has fallen across
More people across the county are able to fully contribute and benefit from its Cambridgeshire since April 1999. The
economic growth. We want to see our communities thriving in the City, the unemployment figure for the county is 1.2%
market towns and rural areas within Cambridgeshire. (December 2007)
* Claimants of Incapacity Benefit have increased
We also want to foster a culture where people aspire to train and learn over time with significant parts of this increase
throughout life, with clear progression pathways for vocational training that being driven by the rise in mental health
improves business performance. Education and training provision must meet problems (from 26% of claims in 1999 to 38% in
the needs of employers. 2007)
* 98,000 people across the county – nearly one in
It is important to achieve an equitable distribution of economic prosperity and four adults – have no qualifications
social opportunity and address employability issues, by overcoming barriers to * There are differences in educational attainment
economic participation, increasing economic opportunities for disadvantaged across the county. The number of Year 11 School
communities, and promoting to employers the value and benefits of a flexible, leavers not in education, employment or training
diverse and healthy workforce. (NEET) is high in Cambridge City and Fenland
20PRIORITY OUTCOMES HOW WILL OUTCOMES BE ACHIEVED?
2.1.1 Promoting and supporting the following sectors specific to Cambridgeshire –
o agriculture and food processing;
o creative and cultural industries;
o environmental goods and services;
o high technology and advanced manufacturing;
o Information and Communications Technologies;
2.1 Sustainable growth
growth of business sectors o pharmaceuticals and life sciences; and
critical to the future economic success.
success. o heritage, tourism and leisure
2.1.2 Developing the supply chain for the environmental and low carbon technology sector from
skills and training through to support for new and established businesses
2.1.3 Exploiting Cambridge’s image and reputation to support the county’s knowledge based
economy and the commercialisation of R&D
2.1.4 Ensuring the appropriate infrastructure and transport networks are in place and maintained
to facilitate and sustain economic development
2.2.1 Promoting the integration of business start up spaces
2.2 A high level of start up of new and
development of existing businesses and social 2.2.2 Capitalising on the opportunities for Local Authorities presented in the Sub-National Review
enterprises of Economic Development and Regeneration
2.3.1 Ensuring all children and young people have a sure start in life and an equal opportunity to
thrive and fulfil their potential within their families and communities
3 Economic well-
2.3 well-being of children and young
people 2.3.2 Reducing the number of children affected by poverty
2.3.3 Supporting young people in transition from early years to school, to further education,
employment or training
2.3.4 2.4.5 Raising the educational attainment of all children and young people, and narrowing the
gap for more vulnerable groups
21PRIORITY OUTCOMES HOW WILL OUTCOMES BE ACHIEVED?
2.4.1 Ensuring the skills base of the local labour force is better matched to the needs
of employers
2.4.2 Addressing the barriers to employment, skill and enterprise for all minority
groups and those with a work limiting illness including adults with learning disabilities
2.4 Reduced barriers to employment and enterprise for all and adults in contact with secondary mental health services
2.4.3 Growing the social economy, particularly capitalising the skills and experience
of older people which are no longer in paid employment
2.4.4 Ensuring there is a skilled, knowledgeable and competent workforce to deliver
the support required for older people and disabled adults1
2.4.6 Supporting lone parents, economically inactive adults / adults without
qualifications
1
Disabled People are defined as people with learning disabilities, physical disabilities, sensory impairments, mental health issues and living with HIV/AIDS
223. ENVIRONMENTAL SUSTAINABILITY
KEY POINTS
To deliver sustainable communities we need to meet the needs of
the present without compromising the ability of future generations to * Residents, businesses, organisations and visitors in
meet their own needs. Cambridgeshire produce an estimated equivalent of 6.5
million tonnes of carbon dioxide per year (this equates to
Climate change is a fundamental challenge to our future. The 11.8 tonnes for every person in the county each year)
effects of climate change can already be seen and the consequences * Around 92% of these emissions come from powering our
could be catastrophic for the natural world and society. homes, businesses and vehicles
* The Cambridgeshire and Peterborough Structure Plan
The average global surface temperature has increased by about 0.6%
provides the framework for land use and new developments
in the last hundred years, and there is strong evidence that most of
in Cambridgeshire up to 2016. Adopted in 2003 it requires
the warming over the last 50 years has been caused by man. This is
that new developments include ‘energy conservation
mainly because of the release of greenhouse gasses (such as carbon
measures and energy efficient siting of buildings’.
dioxide) leading to an ‘enhanced’ greenhouse effect.
* Less than 4% of energy used in the UK in 2005 came from
To tackle climate change the county will need to move to a low- renewable sources. The government is committed to
carbon economy, and reduce emissions, as well as adapting to increasing this and has set a target of 10% of UK electricity
known impacts including flooding, extreme weather, heatwaves and to be generated renewably by 2010, aiming for 20% by
summer drought. Cambridgeshire is particularly vulnerable to these 2020.
because many areas are low lying and we have some of the lowest * Households in Cambridgeshire generate over 309 thousand
rainfall areas in the UK. tonnes of waste a year.
* Climate change is already happening, with warmer wetter
We must ensure current decisions are robust in the face of climate winters, and hotter drier summers. More and more severe,
change. “extreme weather events” such as a storms, torrential
rainfall and droughts, are expected. Rising sea levels could
affect the low-lying norther parts of the county.
23PRIORITY OUTCOMES HOW WILL OUTCOMES BE ACHIEVED?
3.1.1 Reducing carbon emissions
3.1.2 Promoting a low energy future and the use of renewable energies
3.1 Adapting to and mitigating the effects of climate
change.
change. 3.1.3 Reducing the reliance on the use of the car by promoting sustainable forms of
transport such as public transport, cycling and walking
3.1.4 Ensuring a more efficient use of resources and more environmentally aware
procurement
3.1.5 Reviewing the likely impacts of climate change on the community, services and new
development, and ensuring that adaptation measures are put in place, including climate
proofing new buildings and infrastructure
3.2.1 Ensuring a more efficient use of resources and more environmentally aware
procurement
3.2 Efficient use of resources
3.2.2 Increasing recycling and minimising waste
3.3.1 Protecting and enhancing the environment in open spaces and the countryside for
the benefit of people and wildlife
3.3 Attractive and healthy environments
3.3.2 Ensuring consistent, reliable and reasonable journey times and minimising the
impact of congestion on the travelling public throughout the county
244. EQUALITY AND INCLUSION
Promoting equality, diversity and inclusion is a responsibility shared by
all the partner agencies in Cambridgeshire Together. We want to create a KEY POINTS
fair society in which everyone has the opportunity to fulfil their potential
and we will target social and economic disadvantage through the
prioritisation of available resources and joined up service delivery. * According to the Index of Multiple Deprivation 2007, three
Poverty and social exclusion have costly implications for the economy areas in Cambridgeshire are in the most deprived quintile
and society in terms of ill health, fragmented communities, wasted (20%) nationally. All are in north Fenland.
potential, lost income and pressure on services. * Other areas of concern are parts of Huntingdon, other areas in
Fenland and the Kings Hedges, Arbury and Abbey Wards in
We must ensure our strategies and action plans address issues affecting Cambridge.
both urban and rural areas, in a way that meets the needs of our * 15% of Cambridgeshire residents report a limiting long term
residents, making services accessible to all. illness, although estimates of disability can be as high as 22%
* To continue to deliver the same level of service to our ageing
Cambridgeshire is a diverse county. In 2001, 4% of the county’s population by 2021 we would need:
population was recorded as being from an ethnic group other than White - to support an extra 2,000 to live at home
(with a further 5% from)White non-British groups). Bangladeshi, - 500 additional places in residential care
Pakistani and Black Caribbean groups are disproportionately located in - 250 in nursing care
the most deprived areas of Cambridgeshire. Travellers form the largest - 150 extra care housing units
single ethnic minority group. They often experience poorer outcomes in * There are clear health inequalities across the county
terms of health, education and housing than the population as a whole. * Nearly a quarter of adults in Cambridgeshire are smokers and
half of these die prematurely of a smoking related ailment.
We are also experiencing a rapidly growing increase of migrant workers * Teenage pregnancy rates remain high in identified small
across the county. Their needs vary but research shows rural migrants areas, closely linked with socio-economic deprivation
are often poorer, and more vulnerable to exploitative living conditions. * Travellers form the largest ethnic minority group. As a group
they have below average life expectancy. Traveller children
Our aim is to ensure there is fair and equal treatment by all local have worse health and lower access to preventative services
services, promoting the involvement and inclusion of all people than the general population.
regardless of gender, ethnicity, age, religion and belief, and sexual * National Insurance Numbers allocated by residence to non UK
orientation. citizens is up from 4,180 in 2002/03 to 8,810 in 2005/06
25PRIORITY OUTCOMES HOW WILL OUTCOMES BE ACHIEVED?
4.1 Equality in health
health for all communities 4.1.1 Reducing inequalities by improving health outcomes, particularly in relation to disabled
people, travellers and new migrant populations
4.1.2 Improving and providing more integrated services for children with learning difficulties
and disabilities and complex needs
4.1.3 Increasing life expectancy , improving quality of life and reducing the prevalence of
smoking for all parts of the community
4.2.1 Improving the emotional health and well being of children and young people
4.2.2 Improving the sexual health of young people and reducing the teenage conception rate
4.2 Healthy children and young people 4.2.3 Reducing the incidence of obesity and the number of children and young people with an
unhealthy weight
4.2.4 Increasing the number of children and young people accessing play and positive
activities
4.3.1 Supporting schemes to improve rural and community transport
4.3 Appropriate access to services for all
communities 4.3.2 Ensuring the needs of migrant workers and their children are addressed., by focusing on
improving language skills and information, advice and guidance with regard to accessing
services and understanding the roles of various agencies
4.3.3 Improving access to and participation in leisure, recreation, lifelong learning and culture
26PRIORITY OUTCOMES HOW WILL OUTCOMES BE ACHIEVED?
4.4 Older, vulnerable or disabled people are able 4.4.1 Supporting carers through the provision of specific services or advice and information.
to lead independent lives. Supporting family / informal carers to continue with their lives, families, work and contribution
to the community
4.4.2 Providing older people with the care and support that they want as close to home as
possible, and minimising the need for emergency hospital admissions and delayed discharge
from hospital
4.4.3 Supporting disabled people to lead independent lives, free from discrimination with care
and support to live in and contribute to their local community
4.4.4 Ensuring that housing related support is available to support vulnerable people to secure
and maintain independent living
275. SAFE AND STRONG COMMUNITIES
Improving community safety, creating safer environments and KEY POINTS
making our communities stronger by enabling individuals and wider
communities take a greater role in service planning and delivery is
* After three years of reductions, crime increased in 2006/07
important to us.
* Domestic violence is the most common form of violence in
We want to provide strong local leadership and quality responsive rural areas in Cambridgeshire.
services. Our communities will have more of a say and influence * Between April 07 and mid July 07 there were 310 referrals
through a range of options to engage with service providers such as to Children’s Services related to domestic violence in the
neighbourhood panels, parish planning and parish arrangements, family
and neighbourhood management. Our residents will be active * In 2006 the total number of people killed or seriously
participants in the shaping of their future. injured on roads in the county was 423. In 2006 the total
number of children (aged less than 16) killed and seriously
Greater resident participation in decision-making and an enhanced injured in the county was 32
role for community groups will also help the local area to promote * According to the 2006 BVPI User Satisfaction survey:
community cohesion by supporting the development of shared - 32% of respondents think vandalism, graffiti and other
futures and emphasizing what binds communities together. deliberate damage to property or vehicles was a very big
or fairly big problem in their local area
A new focus will be placed on enabling and supporting the voluntary - 22% of respondents think that people being rowdy or
sector’s role in campaigning and providing a voice for many drunk in public places was a very big or fairly big
vulnerable groups to ensure their views are reflected in our policies, problem in their local area
strategies and plans. The role of the sector in improving public - 69% of respondents agree that the local area is a place
services needs to be fully recognised by all partners. where people from different backgrounds get on well
together.
- 30% of respondents felt they can influence decisions
affecting their local area
* Cambridgeshire’s Quality of Life Survey in 2006 show that
40% of respondents had engaged in voluntary work during
the last year
28PRIORITY OUTCOMES HOW WILL OUTCOMES BE ACHIEVED?
5.1.1 Reducing levels of crime, especially serious violent and sexual crimes, domestic
5.1 Low level of crime and reduced fear of crime
crime and violence, terrorism, anti-social behaviour including inappropriate vehicle use and re-
antisocial behaviour offending
5.1.2 Providing reassurance and building public confidence
5.2.1 Reducing the number of injuries and preventable child deaths
5.2 Communities that are safe 5.2.2 Reducing the number of children and young people experiencing bullying in and out
of school
5.2.3 Reducing the number of people killed or seriously injured
5.2.4 Reducing the harm caused by drug, alcohol and substance misuse
5.2.5 Reducing the incidence of family breakdown by supporting families through the
provision of appropriate services
5.3.1 Increasing the level of volunteering and building the capacity of the capacity of the
5.3 Cohesive communities that make
make the most of voluntary sector
diversity and demonstrate a high level of trust.
5.3.2 Connecting service providers and local residents by engaging with local communities
including children & young people, hard to reach groups, Parish Councils, voluntary
organisations and neighbourhood forums
5.3.3 Promoting community cohesion
29The partner organisations
Cambridgeshire Together is the partnership bringing together representatives from the public, private and voluntary sectors. It directs and oversees
progress on delivering this vision and its three year delivery plan – the Local Area Agreement- and has a key role in providing community leadership
and effective, efficient and joined up delivery of services.
Cambridgeshire Together includes representatives from:
* Cambridgeshire County Council
* East Cambridgeshire District Council
* East Cambridgeshire Strategic Partnership
* Cambridge City Council
* Cambridge City Local Strategic Partnership
* South Cambridgeshire District Council
* South Cambridgeshire Strategic Partnership
* Huntingdonshire District Council
* Huntingdonshire Strategic Partnership
* Fenland District Council
* Fenland Strategic Partnership
* Cambridgeshire Primary Care Trust
* Cambridgeshire Police Authority
* Cambridgeshire Fire and Rescue Authority
* Cambridgeshire ACRE (Actions for Communities in Rural England)
* Cambridgeshire Infrastructure Voluntary Sector Consortium
* Greater Cambridge Partnership
Partnerships such as the thematic countywide partnerships, and the five District Local Strategic Partnerships, have also a key role to play in the
identification of priorities and delivery of outcomes.
30Data sources
Introduction
1 Cambridgeshire County Council Research Group population estimates 1981-2006
2 Office for National Statistics 2004-based population projections (trend-based)
3
EERA draft East of England Plan, December 2004
4 Cambridgeshire County Council Research Group 2005-based population forecasts
5 Cambridge Sub-Region Strategic Housing Market Assessment, 2007. 26% of Cambridge City residents can afford the average price of the lowest priced quartile
of homes.
6 Mapping Poverty in Cambridge City 2006
7 2001 Census
8 Office for National Statistics, Migration Indicators by Local Authority Areas, 2001-2006
9 2001 Census
10 Cambridgeshire County Council Research Group 2005-based population forecasts
11 Cambridgeshire County Council Research Group mid-2006 estimate
12 Indices of Deprivation 2007, Communities and Local Government
13 Public Health and Health Inequalities Dataset 2007, ONS conceptions in girls aged under 16 and under18 2002-2004
14 23% of children in Fenland live in a household where an adult claims at least one key benefit. Source: Department of Work and Pensions May 2007 benefit
claimants; Cambridgeshire County Council Research Group mid-2006 population estimates
15 Office for National Statistics, life expectancy at birth 2004-2006
16 Age standardised all cause mortality for people aged under 75, 2004-2006, NCHOD
17 Synthetic estimates of obesity prevalence 2007, Information Centre for Health and Social Care
18 Quality and Outcomes Framework 2006/2007, Information Centre for Health and Social Care
19 Median weekly gross income of full-time workers. Office for National Statistics, Annual Survey of Hours and Earnings 2007
20 Cambridge Sub-Region Strategic Housing Market Assessment. Ratio of average earnings to average house prices is 6.15.
14Community Safety
Partnership Strategic Assessment for Community Safety, October 2007, Cambridgeshire County Council
Child referrals to Social Services Report, August 2007, Research Group, Cambridgeshire County Council
Education
Cambridgeshire County Council, Office of Children and Young People’s Services Management Information
Diverse Needs
Indices of Deprivation 2007, Communities and Local Government
31Priorities
1. Managing growth
EERA draft East of England Plan, December 2004
Cambridgeshire County Council Research Group 2005-based population forecasts
Land Registry property sales Jan-March 2006 and Jan-March 2001
2. Economic Prosperity
EERA draft East of England Plan, December 2004
Office for National Statistics Annual Population Survey 2006
Office for National Statistics Claimant Count Unemployment December 2007
Department for Work and Pensions Benefits, May 1999 and May 2007
2001 Census
Cambridgeshire Connexions destinations of Year 11 school leavers in 2006
3. Environmental Sustainability
Cambridgeshire County Council’s Climate Change Strategy 2005
4. Equality and inclusion
Indices of Deprivation 2007, Communities and Local Government
2001 Census
Population Growth and Capacity Planning for Health and Social Care. 2nd Edition, January 2006. Anglia Support Partnership and Cambridgeshire County
Council Research Group
Synthetic estimates of obesity prevalence 2007, Information Centre for Health and Social Care
Cambridge Sub-Region Traveller Needs Assessment, 2006
Department for Work and Pensions, National Insurance Number Registrations to non-UK nationals, 2002/3 to 2005/6
5. Safe and Strong Communities
Partnership Strategic Assessment for Community Safety, October 2007, Cambridgeshire County Council
Child referrals to Social Services Report, August 2007, Research Group, Cambridgeshire County Council
2006 Joint Road Casualty Data Report
2006 Road Safety Monitoring Report
32You can also read