Islamic Politics and Local Development: Evidence from Indonesia* - IEA World Congress
←
→
Page content transcription
If your browser does not render page correctly, please read the page content below

Islamic Politics and Local Development: Evidence from
                           Indonesia*
                   Giacomo De Luca†              Andrew Pickering‡              Jahen F. Rezki§

                                                     June 2019

                                                      Abstract

      This study investigates the role of Islamic parties on government policy choice and economic out-
      comes. The analysis was conducted using the results from Indonesian mayoral elections. Using a
      regression discontinuity (RD) design, we compare districts in which the Islamic coalition barely
      won or lost in the mayoral elections. This study suggests that districts in which the Islamic party
      barely won the election tend to have lower government expenditures and government revenues.
      Moreover, in terms of spending by sectors, the leaders of Islamic parties tend to spend more on
      education relative to total expenditure. However, none of the evidence suggests that Islamic
      mayors affect economic outcomes (e.g. GDP per capita, GDP per capita growth, unemployment
      rate). We argue that the ability of Islamic parties to collect taxes due to the implementation of
      laws related to Islamic law and partisan alignment influences these results. Moreover, this pa-
      per suggests that the education sector is very important for Islamic parties to spread their ideology.

      Keywords: Islamic Parties, Indonesia, Policy Choice, Regression Discontinuity
      JEL Classification: D72, D78, H7, O1, Z12

   * We thank Thomas Cornelissen, Avital Livny, Anirban Mitra, Alex Moradi, Jared Rubin, Steven Stillman, and Carolyn
Warner for helpful comments. We are also thankful to the attendees of seminars at the University of York and at Chapman
University for their feedback. We thank Kevin Evans and Jan Pierskalla for sharing the data and LPEM-FEB UI for data
supports. Jahen Rezki acknowledges financial support from Indonesia Education Endowment Fund (LPDP-RI) and
Institute for Humane Studies (IHS). All errors are our own.
   † University of York, United Kingdom. Email giacomo.deluca@york.ac.uk
   ‡ University of York, United Kingdom. Email andrew.pickering@york.ac.uk
   § Universitas Indonesia. Email jahen@lpem-feui.org

                                                          1
1     Introduction

It is important to determine whether Islamic party rule affects policy choice and economic perfor-

mance, because many Islam majority countries have become more democratised in recent decades.

Numerous countries have implemented direct elections, although many issues and deep scepticism

surround its implementation. One of the consequences of democratisation in the Muslim world

is the growth of political parties that use Islam for their main platform. Many people are afraid

that religious conservatism would lead to policies that are harmful to economic development.

Nonetheless, there is limited evidence on the effect of Islamic parties on policies.

     There has been a growing interest by economists to determine connections between religion and

economic development. Iyer (2016) provides an extensive literature survey on the economics of

religion. Moreover, a study by Kuran (2018) has conducted an extensive review of recent research

on the effects of Islam on economic performance. Rubin (2017) has argued that the reason why the

Middle East country is still very much behind western countries is because it is difficult to achieve

economic success when religion plays an important role in politics, since many interest groups have

bargaining power in politics. A study by La Porta et al. (1999) has observed that countries with a

higher proportion of Catholics or Muslims exhibit worse government performance. Conversely,

Noland (2005) has found that a large Muslim population is positively associated with economic

growth in either cross-country or within country estimation.1

     Even though many are sceptical of the role religion plays in politics, especially Islam, several

studies have been able to determine why voters might still support Islamic parties in political

election. For example, many voters still perceive Islamic parties as cleaner than other parties and

less corrupt (Henderson and Kuncoro, 2011). Moreover, Islamic parties use economic conditions to

win popular votes in many Muslim countries (Pepinsky et al., 2012). For example, The Prosperous

Justice Party (PKS) in Indonesia focuses on issues of social justice and economic conditions when

campaigning (Mujani and Liddle, 2009).2

     This paper investigates the role of Islamic parties on policy choices and economic outcomes in

Indonesia. There are four reasons why Indonesia is an ideal case study to answer this question.

First, Indonesia has the largest Muslim population of any country in the world. Grim et al. (2011)

estimate that Indonesia has a Muslim population of around 204 million and contributes to around

12.65% of the global Muslim population. Indeed, almost 82% of the Indonesian population is
    1 Some country specific studies on the role of Islam on policies and outcomes have been conducted by Meyersson
(2014) in Turkey and Bhalotra et al. (2014) and Chaudhary and Rubin (2016) in India.
   2 See Pepinsky et al. (2012) for more comprehensive information about Islamic parties and economic appeals throughout

the Muslim world.

                                                           2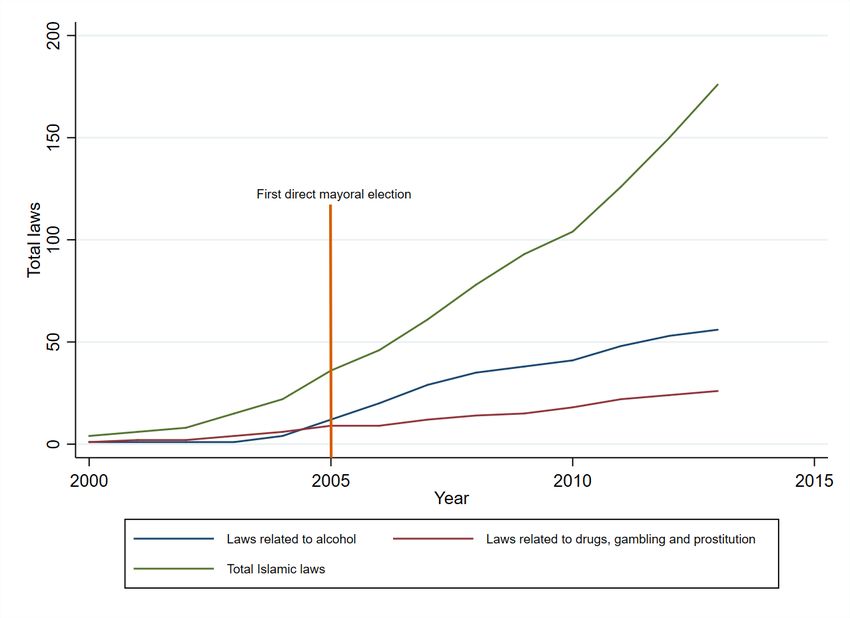
Muslim. Second, Indonesia has been transitioning from Suharto’s authoritarian regime into a more

democratic country. The country just held a direct election for the president, as well as elections

for governors and mayors. Third, Indonesia has begun decentralising its government since 2001;

Local governments now have greater responsibilities for public goods provisions. Finally, since

the majority of Indonesians are Muslim, the power of Islamic parties has grown exponentially.

During Suharto’s New Order regime (Orde Baru), Islamic parties were repressed by the government.

However, since 1999, they are now free to spread their movement and ideology. As a result, in recent

years, Islamic parties have become more influential in Indonesian politics. Moreover, although the

majority of Indonesians are Muslim, Indonesia is not a Muslim country.

   To study the causal impact of Islamic parties on policy choices and economic performance, we

implemented a regression discontinuity (RD) design (Lee et al., 2004; Lee, 2008; Lee and Lemieux,

2010). Specifically, we investigated the treatment effect of mayors from Islamic parties who either

barely won or lost their respective elections. We used data on the mayoral election results at Indone-

sian district levels from 2005 to 2013, which was provided by the General Election Commission

of Indonesia (Komisi Pemilihan Umum) and also shared by Pierskalla and Sacks (2018). For the

outcome and socio-economic indicators, we used data provided by the INDO-Dapoer dataset,

which is managed by the World Bank and provides information about the district characteristics in

Indonesia.

   The results indicate that districts in which Islamic parties barely won the election exhibit lower

total expenditure per capita and total expenditure relative to regional gross domestic product

(RGDP).3 It corresponds to a decrease by 28.6 percentage points and 21.6 percentage points, re-

spectively. Moreover, Islamic mayors reduce total revenue per capita by 20.9 percentage points

and further reduce the share of total revenue per GDP by 20 percentage points. This study also

finds that districts with Islamic mayors cannot generate more local taxes compared to districts with

secular mayors. Moreover, local tax per capita is reduced by approximately 22 percentage points

and 2.9 percentage points relative to total GDP.

   There are two mechanisms behind these findings: First, district revenues are mostly driven by

central government transfers; Therefore, local governments rely heavily on the central government.

During the study period, the President of Indonesia was from the secular party. Therefore, it is

likely that the central government would reduce transfers to districts in which Islamic parties had

barely won their elections. Second, districts with Islamic mayors tend to have difficulties generating

more local taxes due to the implementation of laws that are motivated by Islamic law (Shari’a law).
  3 For   brevity, we also refer to GDP instead of RGDP.

                                                           3
For example, banning alcohol, and restricting nightclubs, pubs and other entertainment industries.
Due to these restrictions, there are less economic activities in districts with Islamic mayors, which
results in lower tax revenues.
This study also assesses whether Islamic parties are likely to implement progressive policies,
especially on the provision of public goods. The results indicate that Islamic mayors tend to spend
more on education sectors relative to total expenditures but not for total education expenditure per
capita. In this regard, the treatment effects for education expenditure relative to total expenditure is
approximately 2.9 percentage points, or it increases the dependent variable by 17 percentage points
relative to the mean. Moreover, the effects on infrastructure and health expenditures relative to
total expenditures are not as apparent, since the treatment effects are statistically insignificant.
Finally, this study finds that Islamic parties do not affect economic indicators, such as real GDP
per capita, real GDP per capita growth and unemployment rate. These results are in accordance
with the findings from Ferreira and Gyourko (2009) in the US, where political parties do not have
any effect on economic outcomes. One possible explanation is that no significant differences exist
in terms of economic policy choices between the mayors from Islamic parties and those from the
secular parties. We also implemented several robustness and validity checks (e.g. using different
polynomial order and bandwidth) and the results remain statistically and economically significant.
This paper contributes to the literature on the effect of religion on political policy outcomes
(Iyer, 2016; Kuran, 2018; Meyersson, 2014, 2017; Bhalotra et al., 2014; Blaydes, 2014; Henderson
and Kuncoro, 2011). More specifically, this study provides the causal impact of Islamic parties on
policy choices and economics performance. This study further illustrates the mechanism that causes
Islamic parties to behave differently. This study also explains the role of political parties (Besley and
Case, 2003; Lee et al., 2004; Pettersson-Lidbom, 2008; Ferreira and Gyourko, 2009), especially those
with a religious ideology. Previous studies have mainly used political ideology to differentiate
political parties, but this study specifically considers only political parties with an Islamic ideology.
From our understanding, this is the first study to provide evidence in support of the idea that
religious political parties, especially Islamic ones, affect state capacity.
Third, this study extends the growing research on the role of local government in Indonesia
(Sjahrir et al., 2013; Skoufias et al., 2014; Lewis, 2018; Martinez-Bravo et al., 2017). Unlike previous
studies, which only investigate the role of local government, this study attempts to explain the role
of Islamic parties in Indonesian politics at the district level. Finally, this study finds that political
alignment is crucial within the context of Indonesia, especially when the political parties of the
central and districts governments differ. Nevertheless, the political alignment in Indonesia and its
4impact on policies remains unclear. Finally, significantly contributes to the extant literature within
an Indonesia context, as well as within the broader scope of religious ideology and government
preferences.
The rest of the paper proceeds as follows: section 2 provides an extensive review of related
studies. Section 3 presents the conceptual framework for this study. The political and institutional
framework is explained in section 4. Section 5 states the data specifications, and section 6 analyses
the results. Lastly, section 7 concludes this study.
2 Literature Review
This paper is related to several other studies, such as those that explore the effect of religion on
economic performance. Iyer (2016) provides a comprehensive literature review on the develop-
ment of research in economics related to religion. Moreover, a study by Kuran (2018) documents
many previous papers that have investigated the effects of Islam on economic performance. The
study further reveals that the Islamic religion affects every aspect (e.g. economic outcomes, social
behaviour, health and development, etc.). However, the effects are quite mixed, and thus the results
are inconclusive.
In regard to country-specific research, Meyersson (2014) has investigated the role of Islamic
mayors in Turkey on some social progressive policies, and found that municipalities in which
the Islamic party barely won a mayoral election exhibit higher high school completion rates for
women; Moreover, the women in these municipalities tend to postpone marriage. This finding may
be explained by the fact that Islamic parties tend to increase access to education for the poor by
building more schools and rescinding headscarf ban policies.
Another study by Meyersson (2017) has observed that Turkey, which has been led by an Islamic
government, did not grow faster compared to other countries. Using a synthetic control method
after the Islamic party (Justice and Development Party/AKP) gained control of the government,
this study found that the presence of AKP in the government did not improve economic indicators,
such as GDP per capita and the labour market. However, improvement in the health and education
sectors was observed, likely due to the fact that AKP policies focus heavily on these two sectors.
Moreover, other studies have found that Islamic parties improve development outcomes. Bhalo-
tra et al. (2014), for example, have observed that, in India, Members of Parliaments who are Muslim
advocate policies that improve health and education outcomes (e.g. lower child mortality rate
and improvement in literacy rate and education attainment). The study also suggests that there is
no religious favouritism, as the Muslim population benefits less than the non-Muslim population.
5Similarly, Blaydes (2014) has found that in Egypt, women living in areas ruled by radical Islamist
organisations have better reproductive health outcomes compared to women living in areas led
by the non-Islamist organisations. The authors therefore argue that Islamist organisations provide
health services to citizens with otherwise limited access. An improvement in health facilities creates
a net benefit for women living in this area.
Studies on Islamic parties and economic development in Indonesia, although limited, have
become an area of interest for many researchers. Henderson and Kuncoro (2011) investigated the
role of Islamic parties on local corruption at the district level in Indonesia. Using data from the
general election for parliamentary districts between 1999 and 2004, this study suggests that districts
in which secular parties won the election in 1999 experienced more bribery in 2004. One reason
for this, as suggested by the study, is that voters perceived Islamic parties to be reformist and
relatively cleaner than the secular parties, which had dominated parliament before 1999. Therefore,
Islamic parties were associated with a higher probability of implementing policies that would
reduce corruption.
A study by Bazzi et al. (2018) explores the long-term effects of the Islamic institution (e.g. donat-
ing land to waqf or charitable organisation) on the support for Islamic movement in Indonesia. The
study used the termination of land reform in 1960 (Basic Agrarian Law), for which the government
wanted to redistribute land to the rural population. When this policy failed, many landowners —
who were primarily conservative — transferred their land into a waqf trust. Using the differences-
in-discontinuity design by exploiting the population density threshold to determine the intensity of
the government’s land take-over, this study shows that, in the long-term, this reform created strong
support for Islamic parties and the adoption of laws motivated by the Islam religion. Moreover,
many Islamic schools were built, which also helped spread support for the Islamic movement.
Second, this study also relates to the effect of political parties on the outcomes. Besley and
Case (2003) have found that, in the US, when the Democratic party controls the state legislature,
state spending per capita increases, especially spending related to family assistance. The study
conducted by Lee et al. (2004) employed a regression discontinuity design to examine close U.S.
congressional elections; This study found that the variation in congressional voting preference
can be explained by party affiliation. Moreover, Pettersson-Lidbom (2008) used an RD design to
examine changes in party control in Swedish local elections; The findings suggest that party control
has a causal effect on spending, taxes and unemployment. The left-wing party results in higher
government spending and a lower unemployment rate.
Conversely, Ferreira and Gyourko (2009) have suggested that there is no evidence that a near-win
6or near-loss for the democratic party affects the outcomes (e.g. size of the governments, government
spending or crime rates). Indeed, because cities tend to have homogeneous characteristics, the
mayor’s ability to implement extreme partisanship policies is limited. However, this study has
noted an incumbent effect: meaning that when the Democratic Party barely wins the election, they
have a higher chance of being re-elected in the upcoming election.
Third, this study is also related to the role of local government and, specifically, the impact
of direct mayoral elections. For example, Skoufias et al. (2014) have found that direct mayoral
elections are associated with higher spending on health, although they have no effect on revenues or
budget surplus. Similarly, Lewis (2018) has suggested that direct mayoral elections do not affect the
generation of own source taxes. However, this study has found that directly elected mayors spend
less on infrastructure, likely due to the fact that direct elections reduce rent-seeking behaviour
policies, and therefore these districts perform relatively better than those in which the mayor was
appointed by a parliament. Sjahrir et al. (2013) have also noted that directly elected mayors tend to
implement political budget cycles, especially when they are running for re-election.4
Fourth, this paper concerns the role of political alignment on the local government state capacity.
Because district governments in Indonesia rely heavily on central government transfers, partisan
alignment between the president and a local mayor might affect the central government transfers to
the local government. A study by Larcinese et al. (2006) suggests that, in the US, states receive more
funds if they supported the president in the previous presidential election. Moreover, governors
belonging to the same party as the president will receive more federal funds, meaning that party
affiliation is very important.5
In general, studies that explore the role of Islamic parties on policy choices are few. Specifically,
within the context of Indonesia, although the number of studies conducted on the role of local
government have increased, there is no conclusion regarding whether Islamic mayors reduce
rent-seeking behaviour and implement policies that lead to better development outcomes and
improved economic performance. Furthermore, previous studies have also suggested that the
effects of religion on economic performance are mixed. Thus, this study fills the gap in the literature
by providing the causal impacts on the relationship between Islamic parties and policy choices.
4 Studies by Martinez-Bravo et al. (2017) and Martinez-Bravo (2016) also explain the important role of mayors in
Indonesia. However, these studies investigate the role of mayors that are appointed by district parliaments.
5 Other studies related to political alignment, such as Grossman (1994), Johansson (2003), Levitt and Snyder Jr (1995),
Ansolabehere and Snyder Jr (2006) and others.
73 Conceptual Framework
Based on the previous literature mentioned in section 2, political parties have mixed effect on
outcomes, as suggested by Besley and Case (2003), Lee et al. (2004), Pettersson-Lidbom (2008) and
Ferreira and Gyourko (2009). Moreover, research on the effects of religion, specifically religious
parties, on policies and outcomes has not reached a consensus in regard to whether or not Islamic
parties will implement policies that are less progressive and more conservative. Indeed, many
Islamic parties attempt to impose regulations motivated by Islamic laws.
In regard to Indonesia, the number of Sharia laws passed by the government since 2005 has
steadily increased, although these instances are clustered in specific areas, such as West Sumatra,
Aceh and West Java. These laws are usually related to banning alcohol and narcotics, as well as
restricting clubs and pubs (also, however, requirements to wear Islamic clothes at work/school,
requirements to read the Quran, regulations on Zakah, etc.). We predict that the implementation
of these laws will affect the local government’s ability to generate taxes from certain economic
activities (e.g. restaurant/hotel that sell alcohol, pubs, nightclubs, etc.).
We expect that local governments run by Islamic mayors will be less able to generate tax
revenues. Restrictions imposed by Islamic law will reduce the incentives for industries to conduct
certain business activities. Moreover, we also expect that, because local governments rely on central
government transfers, districts with Islamic mayors will tend to receive less in government revenue.
Therefore, due to the reduction in government transfers, these districts will face a decrease in
government spending.
Previous studies have shown that Islamic parties tend to implement more progressive policies re-
lated to public goods provisions and development sectors (e.g. education and health). As explained
by Meyersson (2014), Bhalotra et al. (2014) and Blaydes (2014), an Islamic government is associated
with better development outcomes. In an Indonesian context, we are specifically interested in
observing the impacts of an Islamic government on education spending, as Islam is focused on
education for training and systematic development (Tarbiyah). Indeed, education, religion and
Islamic parties are closely interrelated. For example, after the end of Suharto’s presidency, hundreds
of Islamic schools have opened, all of which are connected with one of the two Islamist groups: 1)
the Prosperous Justice Party (PKS) and 2) the Hidayatullah movement (Hefner and Zaman, 2007).
Hefner and Zaman (2007) have suggested that PKS and Hidayatullah provide examples of how
social movements through education increase people’s awareness of an ideology. Furthermore,
other organisations that also focus on education, such as Muhammadiyah and Nahdatul Ulama have a
close connection with the Islamic parties.
8Districts in which Islamic mayors barely won the election are expected to increase their spending
on education relative to total expenditure, especially because education spending is one way for
Islamic parties to increase their number of political supporters and to spread their political ideology.
Thus, we expect the impact of Islamic mayors to be more significant for education than any other
sector. Also, because they will need to reallocate government spending from other sectors due to
budget constraints, we expect the impact of Islamic parties on other sectors to be insignificant.
4 Political and Institutional Framework
4.1 Religion and Politics in Indonesia
After the end of Suharto’s regime in 1998, Indonesia began democratising. The number of political
parties has risen, including Islamic parties.6 Even though Indonesia is one of the most populous
Muslim countries in the world, Indonesia is not an Islamic country. Before 1998, Islamic parties
did not have enough power in the parliament; Indeed, there was only one Islamic party: The Unity
and Development Party (PPP), founded in 1973. However, this party has never won an election.
During his presidency, President Suharto sought to reduce the presence of Islam and communism
and to ensure that all political parties retained their official platforms to "Five Principles" (Pancasila)
(Pepinsky et al., 2012).7
Since the fall of Suharto, many new Islamic parties have emerged onto the political arena. The
Prosperous Justice Party (PKS) is a new party that explicitly claims Islam as their platform.8 The
Moon and Star Party (PBB) and the Reform Star Party (PBR) also have substantial support from
devout Muslims. Moreover, there are two other parties that use Pancasila as their main ideology
and are more open to multi-faith religions, such as The National Awakening Party (PKB) and the
National Mandate Party (PAN). However, these two parties were founded by the two largest Islamic
organisations in Indonesia. Indeed, the PKB was founded in 1998 by the leaders of Nahdatul Ulama
(Ulama’s Revival/NU), a traditionalist Muslim organisation with more than 60 million members
in 2013 (Sobary, 2013). Furthermore, the PAN was also founded in 1998, although by the former
head of Muhammadiyah, a more modernist version of NU. Both parties are closely connected with
6 CarnegieEndowment (2013) classifies Indonesian political parties into two broad groups: Secular parties and Islamic
Parties. The major secular parties are the Democratic Party (PD), the Party of the Functional Groups (Golkar), the
Indonesian Democratic Party-Struggle (PDI-P), the Great Indonesia Movement Party (Gerindra), the People’s Conscience
Party (Hanura) and the National Democratic Party (Nasdem).
7 Pancasila is the foundation philosophy of the Indonesian state; It is composed by five main principles: 1) Belief
in one single God; 2) Civilized humanitarianism; 3) A unified Indonesia; 4) Democracy guided by the wisdom of the
representative’s people and 5) Social justice for all Indonesians.
8 Formerly, it was known as the Prosperous Party (PK), but it failed to meet the minimum parliamentary threshold in
the 1999 general election.
9Masyumi, an Islamic party that proposed the implementation of sharia law in Indonesia during the
general 1955 election (Higashikata and Kawamura, 2015; Pepinsky et al., 2012; Mujani and Liddle,
2009).
Even though the number of Islamic parties has grown since 1998, they have never won the
general election. In the 1999 general election, the big five Islamic parties (PKB, PPP, PAN, PBB
and PK) received a total of 35.682 million votes (33.73%). The number was slightly lower than
the total votes for the winner of the 1999 general election, which was the Indonesian Democracy
Party-Struggle (PDI-P), with 35.689 million votes (33.74%). In 2004, the Islamic parties (PKB, PPP,
PKS and PAN) earned around 36.86 million votes (32.49%). In 2009, the Islamic parties (PKS, PAN,
PPP and PKB) earned 25.17 million votes (24.18%) which were lower than what they had earned in
the previous two elections. On the national level, especially after the country began implementing
direct presidential elections, Islamic parties have never been able to nominate their own politician
for the election. However, at the local levels, Islamic parties have been able to win several local
executive posts (Mayor and Governor). 9
Although the evidence indicates that Indonesian politics is more secular (Mujani and Liddle,
2009), Islamic parties and Islam are still important. Many Indonesian citizens still consider Islamic
parties to be cleaner than secular parties, as well as less corrupt (Henderson and Kuncoro, 2011).
Moreover, Islamic parties in Indonesia still have a political advantage and are more popular than
non-Islamic parties, especially during periods of economic uncertainty (Pepinsky et al., 2012).10
4.2 Administrative Framework
Indonesia has three tiers of government: central, province and Kabupaten or Kota (Regencies and
Cities, for simplicity, referred to as districts or local government). Local government plays an
important role in Indonesia, especially once the country’s political system began decentralising
in 2001. Local governments are now responsible for infrastructure, health, agriculture, trade and
industry, transportation, labour market and environment. District governments are responsible for
the first nine years of education (six years of primary school and 3 years of secondary education).
In the health sector, local governments are responsible for primary health services provision and
the supply of health workers. On average, local government expenditure covers almost 75% of total
district expenditures (Lewis, 2016). Between 2001 and 2007, districts expenditures doubled, and
9 See Figure A1 and Figure A2 for the development of Islamic parties’ vote shares in the 2004 and 2009 general elections.
In 2009, the Islamic parties earned higher vote shares in the western part of Indonesia, especially in Sumatra and Java.
Nonetheless, many Islamic parties won the mayoral and governor elections since the implementation of direct elections
for local governments.
10 In recent years, Islam fundamentalism has become more popular in the country and, as a result, many Islamic parties
have begun advocating policies that impose Islamic laws (Foreign Policy, 1999).
10further increased between 2008 and 2009 (Sjahrir et al., 2014). In 2016, the ratio between district
total expenditures and total central government expenditures was around 38% (Ministry of Finance,
2016).
In terms of revenues, local governments can collect revenues from various sources, such as
shared taxes, shared non-taxes, specific allocation grants, a general-purpose grant, etc. Own source
revenues (PAD) and transfers from the central government are the main sources of local government
revenues (World Bank, 2007). Of these two, however, the central government transfers comprise the
largest share (almost three-quarters) of the local government’s total revenue (Ministry of Finance,
2016). Common in many developing countries, decentralisation gives local governments more
responsibilities, but narrows its ability to generate revenue. Although districts can adjust tax rates,
it should be within specified range.
Since 2005, based on Law No. 32/2004, Indonesia has implemented direct elections for governors
and mayors (Pilkada Langsung). Citizens directly elect local leaders that were previously appointed
by the local parliament (DPRD). The elections are held every five years and the mayors can run for
office twice. The elections occurred gradually because some mayors had just assumed leadership
right before the law was passed by the government. Moreover, due to many newly established
districts (the result of decentralisation), some districts need to first establish the status of their
administrative area to start holding mayoral elections. At the end of 2005, approximately 40%
of local governments were directly elected by the citizens (Lewis, 2016). Between 2005 and 2007,
roughly 229 mayoral were elections held across the country. By 2010, all districts had already
conducted direct elections (Skoufias et al., 2014).
To become a candidate for a mayoral election, political parties need to have at least 15% seats
in the local parliaments or 15% of the vote share in the previous general elections.11 Therefore, if
the party has less than 15% of the seats, they need to form a coalition with other parties. To win
the election, the candidates need more than 50% or 25% of the votes. If no candidate earns 25% of
the votes, then a second round of elections will be held between the two candidates from the first
round who received the most votes. The party coalitions in the local elections vary. It is possible
that certain parties will make a coalition in certain areas, while in other areas they will be competing
against one another. It is also possible that certain parties that form a coalition for the mayoral
elections will be opposition parties at the central level.
11 Recently,
according to law No.1/2014, it needs at least 20% of the seats in the parliament or 25% of the vote share in
the previous general elections.
115 Data and Specification
5.1 Data Description
Data on the district mayoral election were collected from the General Election Commission, the
Republic of Indonesia (KPU) and from Pierskalla and Sacks (2018). Data on the district mayoral
elections were collected from 2005 to 2013, which covers two direct mayoral elections in Indonesia.
If an election had two rounds, we used the second-round data. We excluded areas such as Aceh,
Papua and Papua Barat, because these have different political environments. DKI Jakarta was also
excluded because the mayor was appointed by the Governor. For the outcomes and socio-economic
variables, we relied on Indonesian Statistics (BPS) and data from the INDO-DAPOER shared by
the World Bank group. Table 1 and Table 2 present the summary statistics for the data in this study.
Table 1 reports the summary statistics used in the analysis. The total number of observations in this
study is 1,522: 731 of the districts elected Islamic mayors and 791 of the districts elected secular
party mayors. Columns (1) - (3) consist of the mean and the standard deviation for the full sample,
Islamic and secular mayors, respectively. Column 4 in Table 1 reports the mean differences in the
group between districts with Islamic mayors and secular mayors, as well as the standard error (in
parentheses).
5.1.1 Main Explanatory Variable
The main explanatory variable in this study is the vote share margin between Islamic party candi-
dates and secular party candidates. In this study, we used the margin between the mayors from
an Islamic coalition and a secular coalition. Due to the possibility of Islamic and secular parties
jointly forming a coalition (mixed coalition), we classified a coalition as an Islamic party coalition if
the number of Islamic parties was higher than the number of secular parties within the coalition.
For the robustness check, we also estimated the RD design by excluding mixed coalitions from the
observations and the results remain unchanged (See Section 6.4).
Table 1 and Table 2 indicate that the mean of the Islamic vote margin is around -0.6% and that
the standard deviation is around 0.216. The maximum vote margin in the sample is 90% in Ogan
Komering Ulu, and the lowest vote margin is -80% in Surakarta. The negative mean value for the
vote share is also supported by the fact that the number of districts with Islamic mayors in the
sample is lower than the mayors from secular parties. Another important explanatory variable for
our empirical model is the dummy variable for mayors from an Islamic party, which will have a
value of one if it is from the Islamic party and zero otherwise. Approximately 48% of our sample
12Table 1: Summary Statistics
Mayor Type Difference
All Islamic Secular (2) - (3)
(1) (2) (3) (4)
Mean Mean Mean Est.
(S.D.) (S.D.) (S.D.) (S.E.)
Main Variables
Log Total Expenditure per Capita 15.06 15.02 15.10 -0.077**
(0.606) (0.619) (0.593) (0.034)
Total Expenditure per GDP 0.429 0.411 0.443 -0.032
(0.392) (0.386) (0.397) (0.026)
Log Total Revenue per Capita 14.45 14.42 14.48 -0.058*
(0.563) (0.572) (0.554) (0.031)
Total Revenue per GDP 0.433 0.437 0.430 0.006
(0.406) (0.459) (0.358) (0.025)
Log Total Tax per Capita 12.28 12.26 12.31 -0.051
(0.790) (0.758) (0.817) (0.044)
Total Tax per GDP 0.053 0.056 0.051 0.004
(0.063) (0.077) (0.049) (0.003)
Log Education Expenditure per capita 13.16 13.15 13.16 -0.0104
(0.649) (0.624) (0.670) (0.039)
Education Share 0.168 0.171 0.164 0.006*
(0.055) (0.059) (0.052) (0.003)
Log Infrastructure Expenditure per capita 12.32 12.31 12.33 0.023
(1.104) (1.030) (1.165) (0.052)
Infrastructure Share 0.084 0.085 0.083 0.002
(0.042) (0.041) (0.042) (0.002)
Log Health Expenditure per capita 11.902 11.896 11.907 -0.010
(0.768) (0.723) (0.805) (0.046)
Health Share 0.048 0.049 0.047 0.002***
(0.014) (0.015) (0.013) (0.0009)
Log GDP per Capita 15.54 15.51 15.56 -0.050
(0.642) (0.594) (0.677) (0.040)
Log GDP per Capita Growth 0.047 0.048 0.045 -0.002
(0.092) (0.100) (0.084) (0.005)
Unemployment Rate 0.061 0.062 0.060 0.001
(0.033) (0.034) (0.033) (0.002)
Explanatory Variables
Islamic Party Vote Margin -0.006 0.153 -0.154 0.308***
(0.216) (0.153) (0.150) (0.007)
Additional Variables
Islamic Vote Share in General Election (in %) 36.52 44.90 28.78 16.11***
(13.68) (13.36) (8.41) (0.567)
Population Density 921.04 870.13 968.02 -921.04
(1914.23) (1830.60) (1988.28) (98.30)
Urban Rate (in %) 68.06 65.51 70.42 -4.903***
(26.75) (28.25) (25.07) (1.367)
Political Competition 0.851 0.857 0.845 0.011***
(0.060) (0.056) (0.064) (0.003)
Literacy Rate (in %) 92.95 93.59 92.35 1.241***
(5.95) (5.41) (6.35) (0.303)
Observation 1,522 731 791 1,522
Notes: Columns (1)-(3) report means and standard deviation in parentheses. Column (4) reports differences of
group means between columns (2) and (3) with standard error in parentheses. * p < 0.10, ** p < 0.05, *** p < 0.01.
13Table 2: Descriptive Statistics
Variable Obs Mean Std. Dev. Min Max
Main Variables
Total Expenditure per Capita (in million IDR) 1,505 4.1 3.4 0.464 48.3
Total Expenditure per GDP 1,142 0.41 0.40 0.001 2.97
Total Revenue per Capita (in million IDR) 1,506 2.1 1.4 0.1 17.4
Total Revenue per GDP 1,480 0.40 0.39 0.009 3.18
Total Tax per Capita (in million IDR) 1,503 0.326 0.4 0.003 6.3
Total Tax per GDP 1,252 0.052 0.063 0.0003 0.764
Total Education Expenditure per capita (in million IDR) 1,081 0.627 0.389 0.005 3.628
Education Share 1,081 0.170 0.056 0.008 0.5
Total Infrastructure Expenditure per capita (in million IDR) 1,076 0.387 0.507 0.002 5.691
Infrastructure Share 1,076 0.080 0.042 0.0018 0.258
Total Health Expenditure per capita (in million IDR) 1,080 0.195 0.172 0.003 2.102
Health Share 1,080 0.047 0.015 0.004 0.138
Real GDP per Capita (in million IDR) 1,288 7.1 7.3 0.564 77.1
Log Real GDP per Capita Growth 1,029 0.05 0.09 -1.02 1.43
Unemployment Rate 1,234 0.061 0.033 0.001 0.208
Government Transfer per Capita (in million IDR) 1,467 1.5 1.1 0.001 12.9
Government Transfer per GDP 1,251 0.295 0.305 0.0001 2.57
Explanatory Variables
Islamic Party Vote Margin 1,522 -0.006 0.21 -0.8 0.9
Islamic Vote Share in General Election (in %) 1,522 36.52 13.68 8 95
Mayor from Islamic Party 1,522 0.480 0.499 0 1
Additional Variables
Log Income per Capita 1,488 15.54 0.637 13.24 18.16
Population Density (number of people per km2 ) 1,519 921 1914 1.59 12911
Urban Rate (in %) 1,522 68.06 26.75 0.96 100
Political Competition Fractionalisation 1,522 0.851 0.060 0.5 0.94
Literacy Rate (in %) 1,522 92.95 5.95 60.58 99.84
14comprises mayors who are affiliated with Islamic parties: roughly 731 of 1522 districts. Moreover,
the standard deviation for this variable is 0.499.
5.1.2 Dependent Variables
There are several dependent variables in this study: 1) log total expenditure per capita and the share
of total expenditure relative to GDP; 2) log total revenue per capita and the share of total revenue
per GDP and 3) log total tax per capita and the share of total tax per GDP. The mean for total
expenditure per capita is 15.06 or Rp 4.1 million (US$ 273) and the standard deviation is roughly
0.606.12 We can also see that the total expenditure in areas where Islamic parties won the election is
less by 7.7 percentage points than in areas where secular parties won the election. We also used
the share of total expenditure relative to GDP, for which the mean is approximately 0.429 and the
standard deviation is 0.392.
For log total revenue per capita, the mean for this variable is 14.45 or Rp 2.1 million (US$ 140)
and the standard deviation is around 0.563. The mean difference for log total revenue per capita
between Islamic and secular parties is statistically significant at 10%; In regard to total revenues per
capita, there is 5.8% disparity between districts with mayors from an Islamic party and districts
with mayors from a secular party. The mean for the share between total revenue relative to GDP is
around 0.433 and the standard deviation is approximately 0.406.
Lastly, we used log total tax per capita, which is the total amount of own source and tax sharing
revenues. The mean for this variable is 12.28 (US$ 21.73) and the standard deviation is 0.790. There
is no significant difference between the mean values for Islamic and secular mayors. Moreover,
total tax per capita is less because local districts do not have enough power to generate revenue
from taxes, and thus rely heavily on central government transfers. The ratio between total tax per
GDP also suggests that tax revenues generated by local districts is quite small: the mean for this
variable is roughly 0.053 and the standard deviation is around 0.063.
The next set of dependent variables relates to the provision of public goods. We used the log total
government expenditure per capita for the education, infrastructure and health sectors. Moreover,
we also wanted to discover the share of government expenditure for public goods provisions
relative to total expenditure. The mean for log education expenditure per capita is around 13.16 or
Rp 627,000 (US$ 41.8). The mean for the share of education expenditure relative to total government
expenditure is approximately 0.17 and the standard deviation is around 0.055. Districts with an
Islamic party leader have a 6% higher education share compared to districts with a secular party
12 US$ 1 ≈ Rp 15,000.
15leader, and the mean difference is statistically significant at 10%.
The mean for log infrastructure expenditure per capita is approximately 12.32 or Rp 387,000
(US$ 25.8) with a 1.104 standard deviation. In terms of the share between infrastructure expenditure
and total expenditure, the mean is around 8.4% and the standard deviation is approximately 0.042.
Finally, for health expenditures per capita, the mean for this variable is roughly 11.902 or Rp 195,000
(US$ 13) and the mean for the health expenditure relative to total expenditure is around 4.7%.
We also sought to determine whether the policy choices implemented by Islamic mayors
affected economic outcomes, such as log real GDP per capita, log real GDP per capita growth and
unemployment rate. The mean for log GDP per capita is 15.54 (US$ 473) with a 0.642 standard
deviation. Moreover, in terms of log GDP per capita growth, the mean is around 4.7% and a 0.092
standard deviation. The difference in means between districts with Islamic and secular mayors
is statistically insignificant. Finally, the unemployment rate for the whole sample is roughly 6.1%
and the standard deviation is around 0.033. Whereas the unemployment in districts with Islamic
mayors is around 6.2 percentage points, it is 6 percentage points in districts with secular parties.
Thus, we cannot conclude a causal effects of Islamic party rule on these outcome variables.
5.2 Econometric Model and Research Design
This paper investigates whether mayors from Islamic parties make significantly different policy
choices compared to mayors from secular parties. To answer this question, we first identified a
causal effect by implementing a regression discontinuity design with a close victory margin. As
suggested by Hahn et al. (2001) and Imbens and Lemieux (2008), a RDD can be used to identify a
causal effect by exploiting a discontinuity in the treatment assignment. We compared the policy
choices in districts with Islamic mayors to those with secular party mayors. As typical in RD
designs, the underlying assumption in this study is that the two types of districts are identical in all
aspects, except mayor political party.
Following Imbens and Lemieux (2008), Yd (0) and Yd (1) represent the potential outcomes. Yd (0)
is the outcome in which the Islamic party barely lost the election and Yd (1) is the outcome in which
the Islamic party barely won the election d. V Md is the forcing variable, which is the vote margin
between the Islamic party’s mayor and the secular party’s mayor. The impact of an Islamic mayor
on policies is given by Yd (1) − Yd (0). However, both outcomes cannot be observed simultaneously,
and we therefore need to observe the average effect of Islamic parties across subgroups of the
relevant population. For example, suppose Id = 0 if a district was not exposed to an Islamic party
mayor and Id = 1 if it was exposed to an Islamic party mayor. The observed outcomes Yd will
16be Yd (0) if Id = 0 and Yd (1) if Id = 1. Finally, the average treatment effect at the cut-off, c = 0 or
V Md = c will be:
τRD = E[(Yd (1) − Yd (0)|V Md = c] = E[Yd (1)|V Md = c] − E[Yd (0)|V Md = c] (1)
As previously mentioned, the main identifying assumption in this design is that E[Yd (1)] and
E[Yd (0)] are continuous in the Islamic vote margin, V Md . Following Imbens and Lemieux (2008), it
suggests that all other unobserved variables that would affect the outcomes Yd are also continuously
related to V Md .
We employed (local) linear and quadratic regressions with optimal bandwidth as the main
method in this paper, as suggested by Cattaneo et al. (2018) and Calonico et al. (2014).13 The use of
a low-order polynomial has also been proposed by Gelman and Imbens (2018), because it is less
sensitive to overfitting and boundary problems, and also it is more robust.14 The empirical model
in this study is the following:
Yd,t+1 = β 0 + π1 Id,t + P( βV Md,t ) + ε d,t , ∀ V Md,t ∈ (c − h, c + h) (2)
where Yd,t+1 represents the policy choices and outcome variables of interest in district d during the
following year t+1. Id,t is the dummy variable whose value is one if the mayor from the Islamic
party won the mayoral election in election t at district d. P is the order of polynomial in the V Md,t ,
which is the vote margin between the Islamic party and the secular party candidates at time t and
in district d. More formally:
V Md,t = VSId,t − VSSd,t (3)
where VSId,t is the vote share for the Islamic party candidate at district d and time t, and VSSd,t is
the vote share for the secular party candidate at district d and time t.
We used the sharp RD design for this study, where Id,t will be:
1,
if V Md,t ≥ 0
Id,t = (4)
0,
if V Md,t < 0
The cut-off score in this paper will be c = 0. P( βV Md,t ) is the continuous control function. β
13 SeeImbens and Kalyanaraman (2012) for another type of optimal bandwidth for RD design.
14 Thispaper uses a nonparametric approach because it has three main features: 1) the bandwidth is based on non-
parametric approximation and generated in a data-driven procedure, 2) the RD point estimates is the optimal mean
square error (MSE) and 3) it incorporates the effects of local parametric specifications. See Hahn et al. (2001), Imbens and
Kalyanaraman (2012), Calonico et al. (2014) and Cattaneo et al. (2017) for further discussion.
17represents the vote share coefficients. π1 is the pure Islamic candidates effect (or the treatment) and
is estimated by the victory margin in a linear and quadratic form. h is a neighbouring around c or
cut-off score and will be refereed as the bandwidth.
We also controlled the estimation using several pre-determined covariates. Heteroscedasticity
and standard errors are clustered at the district levels.15 All estimations used a triangular kernel, as
suggested by Cattaneo et al. (2018), because it yields a point estimator with optimal properties in a
mean squared error (MSE). Following Calonico et al. (2017) in all tables, we report the conventional
estimates of RD design with conventional standard errors; However, the significance levels are
based on the robust bias-corrected p-value levels (per definitions in Calonico et al. (2014) and
Calonico et al. (2018)).
6 Results
6.1 Main Results
Local Government Budget Capacity
This section first explores the effects of an Islamic leader on the government budget capacity. We
first analysed the standard RD plots. Figure 1 depicts the plots for log total expenditure per capita
in panel (a); total expenditure per GDP in panel (b); log total revenue per capita in panel (c); total
revenue per GDP in panel (d); log total tax per capita in panel (e); and total tax per GDP in panel (f).
All figures are plotted on the full bandwidth and for a linear control function. We used a data-driven
approach to choose the bins. Specifically, we utilized evenly spaced bins that mimic the variance of
the data.16
The figures depict a relationship between the Islamic party vote margin (on the x-axis) and the
outcome variables the year immediately following the election (on the y-axis). The vertical line
indicates the cut-off at zero. Thus, there is a negative association between the Islamic party vote
margin with log total expenditure per capita and total expenditure per GDP. Moreover, there is
a negative jump at the cut-off when Islamic parties barely won the mayoral elections. The same
patterns can be observed for total revenues (panels (c) and (d)) and total taxes (panels (e) and
(f)), where the figures suggest that Islamic party vote share has a negative relationship with these
outcomes. Moreover, the negative jump at the cut-off supports the initial argument, which states
that Islamic party rule has a negative association with government capacity.
15 See
Bartalotti and Brummet (2017) for the implementation of RD design with clustered data.
16 This
method was chosen because is it yields an RD plot with more dots that characterise local means, and therefore
provide a better variability of the data. See Cattaneo et al. (2018) and Calonico et al. (2017) for further information.
18Even though the RD plots for the government budget capacity suggest a negative association
between Islamic parties and the outcomes, a formal analysis of the regression results was conducted.
Table 3 provides the results for the dependent variables during the year after the election. The
dependent variable in panel A is log total expenditure per capita (columns (1)-(5)) and total
expenditure relative to GDP (columns (6) - (10)). In panel B, the variables are log total revenue per
capita and total revenue relative to GDP. Finally, log total tax revenue per capita and total tax per
GDP are the variables in panel C.
Columns (1) and (6) report the estimation results with a zero polynomial and global bandwidth.
Columns (2) - (3) and (7) - (8) were estimated using a linear polynomial. Moreover, columns (4) - (5)
and (9) - (10) present the RD estimations obtained using a quadratic polynomial form. Covariates are
included for all columns. The control variables include population density, urban rate, Islamic party
vote share, political competition, log income per capita and literacy rate. We used two different
bandwidth types, as proposed by Cattaneo et al. (2018). Moreover, one common Mean Square Error
(MSE) optimal bandwidth was used for columns (2), (4), (7) and (9). For columns (3), (5), (8) and
(10), we used two different MSE-optimal (MSE/2) bandwidths. All columns were estimated using a
triangular kernel, and the robust standard errors are clustered at the district levels.
From panel A in Table 3, it is evident that districts run by Islamic mayors have lower log total
expenditure per capita as well as share of total expenditure per GDP. The results are robust for
different RD specifications. In column (1), using a local constant polynomial order with full band-
width, it can be seen that Islamic party rule exhibits 17.7 percentage points less total expenditure
per capita than secular party rule. In column 2, when using a linear polynomial with mean square
error bandwidth, the bandwidth size becomes 0.411. In terms of the magnitude, Islamic party rule
reduces total expenditure per capita by 28.6 percentage points, and is statistically significant at 1%.
The results remain robust when we use different local polynomial orders and bandwidth types.
Similarly, the results for the share of total expenditure relative to GDP are statistically and economi-
cally significant. Districts in which Islamic parties barely won the election exhibit approximately
21.6% percentage points less total expenditure per GDP, and this is statistically significant at 5%.
19Figure 1: Local State Capacity and Vote Margin.
(a) Log Total Expenditure per Capita (b) Total Expenditure per GDP
(c) Log Total Revenue per Capita (d) Total Revenue per GDP
(e) Log Total Tax per Capita (f) Total Tax per GDP
Notes: The figures show the relation between the state capacity by districts and the win margin of the islamic
party candidate in the mayoral election based on the full bandwidth and a linear control function. We use a
data-driven approach to choose the bins. More specifically, we use even spaced bins that mimic the variance
in the data. See Cattaneo et al. (2018) and Calonico et al. (2017) for further information.
20Table 3: State Capacity and Islamic Vote Margin
(1) (2) (3) (4) (5) (6) (7) (8) (9) (10)
Panel A Log Total Expenditure pc. Total Expenditure/GDP
Islamic Party, t -0.177*** -0.286*** -0.342** -0.357** -0.362** -0.125*** -0.216** -0.217*** -0.224** -0.264**
(0.059) (0.092) (0.118) (0.124) (0.150) (0.056) (0.084) (0.081) (0.086) (0.104)
Bandwidth Size 1.000 0.411 0.184 0.498 0.303 1.000 0.234 0.183 0.581 0.319
N 1246 1246 1246 1246 1246 914 914 914 914 914
Effective N (Left of Cut-off) 664 620 578 631 606 510 400 457 493 465
Effective N (Right of Cut-off) 582 551 413 564 513 404 317 286 397 365
Panel B Log Total Revenue pc. Total Revenue/GDP
Islamic Party, t -0.168*** -0.356** -0.325** -0.415** -0.429** -0.053 -0.209** -0.201*** -0.218** -0.217**
(0.059) (0.123) (0.121) (0.163) (0.158) (0.047) (0.090) (0.074) (0.091) (0.098)
Bandwidth Size 1.000 0.208 0.155 0.287 0.265 1.000 0.186 0.135 0.460 0.436
N 1251 1251 1251 1251 1251 1021 1021 1021 1021 1021
Effective N (Left of Cut-off) 666 503 635 570 625 566 387 521 537 510
21
Effective N (Right of Cut-off) 585 441 385 491 476 455 331 292 440 440
Panel C Log Total Tax pc. Total Tax/GDP
Islamic Party, t -0.141 -0.223* -0.305* -0.331* -0.341 -0.003 -0.029* -0.029** -0.034* -0.034*
(0.076) (0.138) (0.157) (0.195) (0.197) (0.009) (0.015) (0.010) (0.018) (0.018)
Bandwidth Size 1.000 0.251 0.136 0.244 0.237 1.000 0.164 0.111 0.271 0.251
N 1239 1239 1239 1239 1239 1023 1023 1023 1023 1023
Effective N (Left of Cut-off) 660 557 474 549 524 568 373 510 486 486
Effective N (Right of Cut-off) 579 470 362 459 455 455 314 261 383 375
Polynomial None Linear Linear Quadratic Quadratic None Linear Linear Quadratic Quadratic
Bandwidth Type Global MSE MSE/2 MSE MSE/2 Global MSE MSE/2 MSE MSE/2
Controls Yes Yes Yes Yes Yes Yes Yes Yes Yes Yes
* Notes: The dependent variables are log total expenditure per capita at time t+1 and the share of total expenditure per GDP at time t+1 in panel A. Log total revenue per capita at
time t+1 and the share of total revenue per GDP at time t+1 in panel B and log total tax per capita at time t+1 and the share of total tax per GDP at time t+1 in panel C. Islamic party
is the the dummy if the mayor is from Islamic party at time t. Results based on Indonesia’s mayoral elections from 2005 to 2013. All columns are estimated with a triangular kernel as
suggested by Imbens and Lemieux (2008). All estimations follow the procedures used by Calonico et al. (2017) and Cattaneo et al. (2018). The table reports conventional RD estimates.
Heteroscedasticity and cluster-robust standard errors are in parentheses. Significance levels based on robust standard errors. The unit of clustering is the district of the mayor. The
set of controls are population density, urban rate, Islamic party vote share, political competition, log income per capita and literacy rate. ∗ p < 0.10, ∗∗ p < 0.05, ∗∗∗ p < 0.01.We also wanted to determine whether Islamic party rule affects government ability to generate
revenue. From panel B, it can be seen that the results suggest that the treatment effects between
Islamic parties and the outcome variables are negative and statistically significant. In column 1,
we can observe that mayors from Islamic parties are associated with 16.8% less total revenue per
capita, a result that is statistically significant at 1%. In regard to the share of total revenue per GDP,
the relationship is negative and statistically significant. Mayors from Islamic parties who barely
won the election attain 20.9% lower total revenue per GDP. When the RD specifications are varied,
similar results are obtained in terms of the coefficient and the significance levels. All results from
columns (7) - (10) suggest that Islamic parties will lower the total revenue per GDP from around
20.1% to 21.8%, and these results are economically significant in terms of magnitude.
Finally, we analysed whether the presence of Islamic parties affects total tax revenues. Panel
C suggests that districts with Islamic mayors are associated with lower total tax per capita. The
treatment effects in columns (2) - (4) range from 22% to 33%. The results are statistically significant
at 10%. Similarly, when using the share of total tax relative to GDP, the results remain statistically
significant, although only at 10%. Thus, districts with Islamic mayors will have 2.9% to 3.4% lower
total tax revenue relative to total GDP.
The results from Table 3 suggest that Islamic party rule is associated with lower government
capacity to generate revenue and lower government expenditures. These results confirm that
districts with the mayors from Islamic parties tend to have lower local state capacity.
Government Spending and Provision of Public Goods
We analysed the effect of Islamic parties on public goods provision using the following outcome
variables: 1) log education expenditure per capita and the share of total education expenditure
relative to total expenditure; 2) log infrastructure expenditure per capita and the share of total
infrastructure expenditure relative to total expenditure; and 3) log health expenditure per capita
and the share of total health expenditure relative to total expenditure.
22You can also read