Fiscal condition of the public sector in Brazil
←
→
Page content transcription
If your browser does not render page correctly, please read the page content below
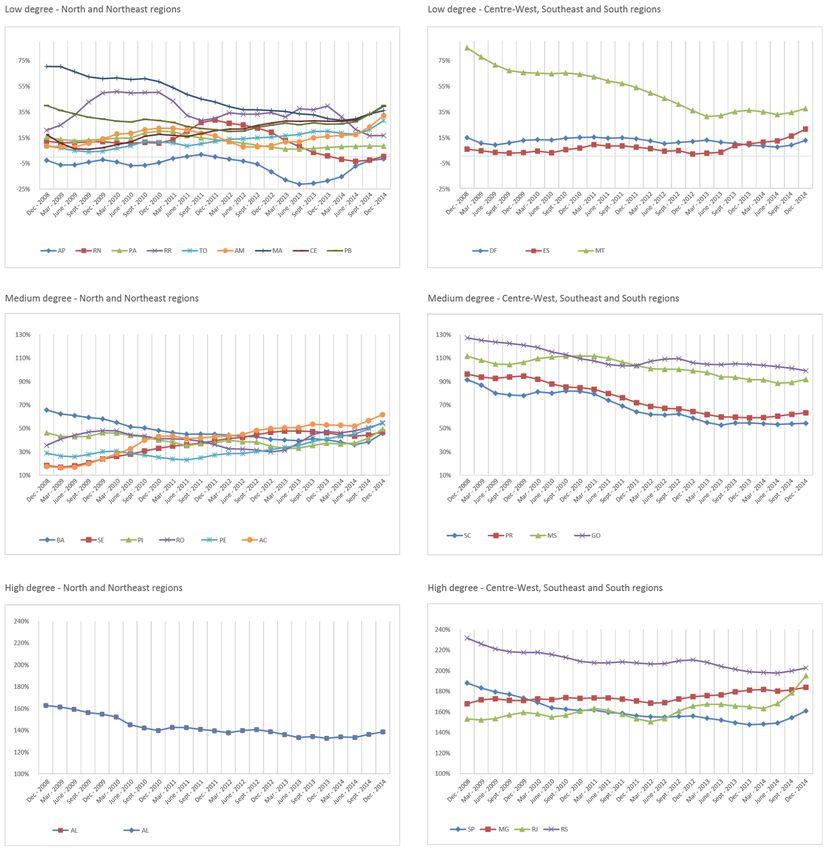
Photo: Sergio Amaral/MDS

                           Fiscal condition of the public sector in Brazil:
                           an analysis with an emphasis on the states in the North
                           and Northeast regions of the country and on financing
                           for rural development

                                 Investing in rural people

                                IFAD Strategy for Brazil 2016-2021 and Series of Studies on Rural Poverty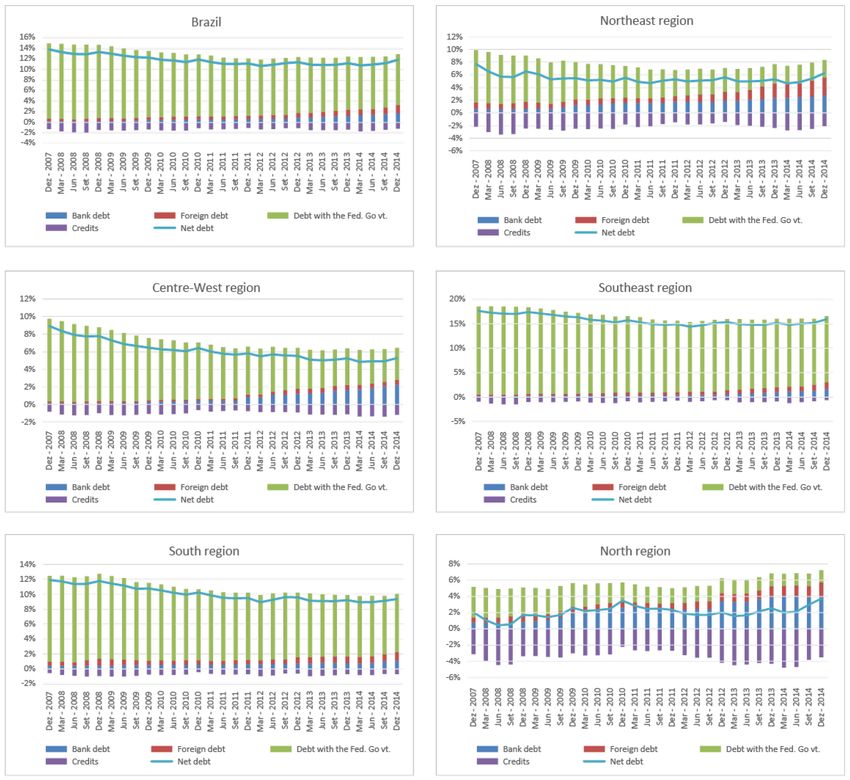
Fiscal condition of the public sector in Brazil: an analysis with an emphasis on the states
in the North and Northeast regions of the country and on financing for rural development
Rodrigo Octávio Orair; Sergio Wulf Gobetti; André Amorim Alencar and João Marcelo
This publication is a result of a partnership between the International Policy Centre for Inclusive Growth (IPC-IG),
the United Nations Development Programme (UNDP), the Institute for Applied Economic Research (Ipea)
and the International Fund for Agricultural Development (IFAD).

Copyright© 2016
International Policy Centre for Inclusive Growth
United Nations Development Programme

International Policy Centre for Inclusive Growth (IPC - IG)
United Nations Development Programme

SBS, Quadra 1, Bloco J, Ed. BNDES, 13º andar
70076-900 Brasília, DF - Brazil
Telephone: +55 61 21055000

ipc@ipc-undp.org          www.ipc-undp.org

The International Policy Centre for Inclusive Growth is jointly supported by the
United Nations Development Programme and the Government of Brazil.

Rights and Permissions

All rights reserved.

The text and data in this publication may be reproduced as long as the source is cited.
Reproductions for commercial purposes are forbidden.

The International Policy Centre for Inclusive Growth disseminates the findings of its work
in progress to encourage the exchange of ideas about development issues. The papers are
signed by the authors and should be cited accordingly. The findings, interpretations, and
conclusions that they express are those of the authors and not necessarily those of the
United Nations Development Programme or the Government of Brazil.

IPC-IG/UNDP Director: Niky Fabiancic                                        IFAD:
IPC-IG/UNDP Research Coordinators:                                          Leonardo Bichara Rocha, Country Programme
Diana Sawyer, Fábio Veras Soares,                                           Officer of the IFAD Brazil Country Office
Rafael Guerreiro Osorio (Ipea) and                                          Hardi Vieira, IFAD Programme Officer for Brazil
Luis Henrique Paiva.                                                        Octavio Damianiand Arilson Favareto, Consultants
                                                                            and Adenike Ajagunna, Administrative Assistant.
Ipea President: Jessé Souza
                                                                            SEMEAR:
International Fund for Agricultural Development (IFAD)                      Dirce Ostroski, Coordinator
Country Programme Manager in Brazil: Paolo Silveri                          Elisa Tavares, Administrative Support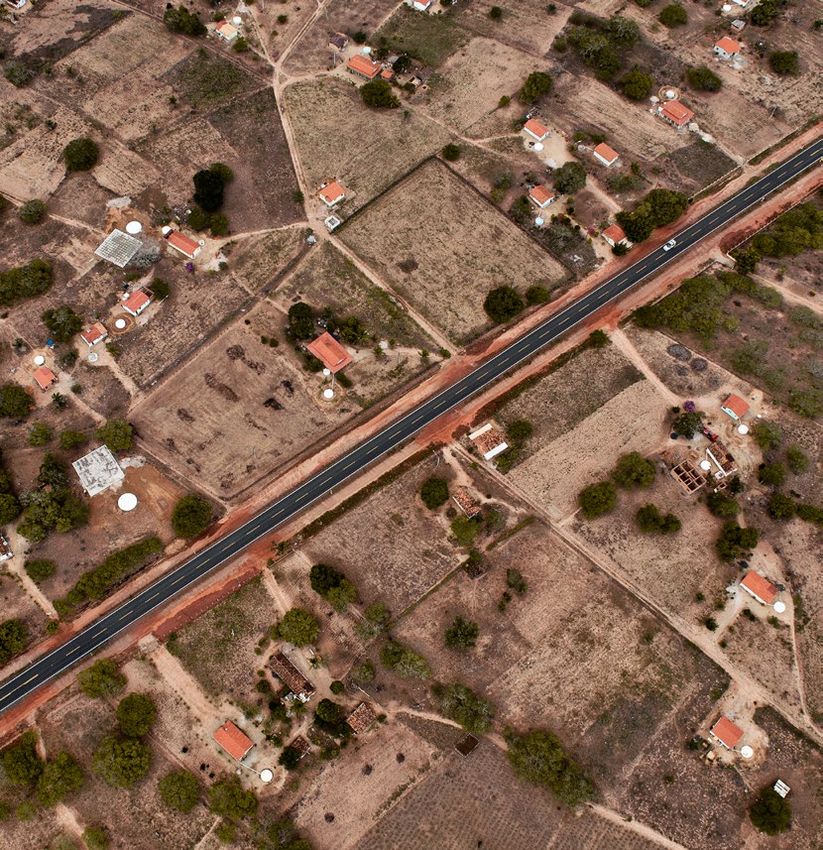
FISCAL CONDITION OF THE PUBLIC SECTOR IN BRAZIL:
         AN ANALYSIS WITH AN EMPHASIS ON THE STATES IN THE NORTH
        AND NORTHEAST REGIONS OF THE COUNTRY AND ON FINANCING
                                         FOR RURAL DEVELOPMENT

                             Rodrigo Octávio Orair; 1 Sergio Wulf Gobetti; 2
                              André Amorim Alencar 3 and João Marcelo 4

      1 INTRODUCTION
The goal of this study is to evaluate the fiscal condition of the Brazilian public sector, focusing
on the situation of state governments in the North and Northeast regions of the country and
on international financing for rural development. The paper comprises six sections, including
this introduction. Section 2 presents a broader view of the fiscal condition of the public sector,
featuring consolidated fiscal indicators from each of the three government levels (central, state
and municipal). The analysis allows for the identification of tendencies in public finances
from an aggregate and, therefore, non-detailed perspective.
      Sections 3, 4 and 5 narrow the focus on an evaluation of the fiscal condition of
state governments, especially in the North and Northeast regions of Brazil, with individual
analyses of the indicators of degree of indebtedness and payment capacity, the evolution
of bank and external credits (including financing for rural development), the determining
factors of indebtedness and the evolution of the main categories of revenue and expenditure.
Finally, the last section presents a summary of the results and some comments on the
fiscal condition of the public sector, tendencies looming on the horizon and potential
future scenarios.

1. International Policy Centre for Inclusive Growth (IPC-IG) and Institute for Applied Economic Research (Ipea).
2. Institute for Applied Economic Research (Ipea).
3. Consultant.
4. Statistical consultant.

This publication is a result of a partnership between the International Policy Centre for Inclusive Growth (IPC-IG),
the United Nations Development Programme (UNDP), the Institute for Applied Economic Research (Ipea) and the
International Fund for Agricultural Development (IFAD). It was also published by the IPC-IG as Working Paper
No. 140, April/2016.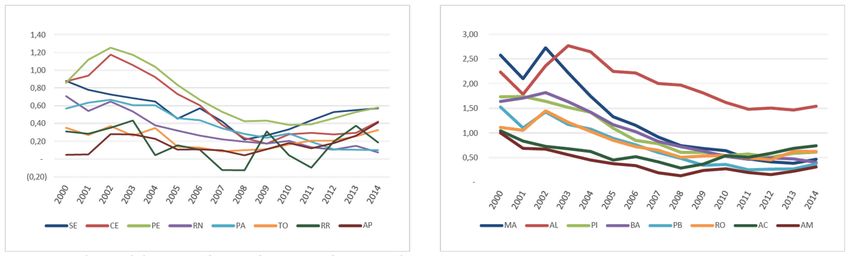
2                            International Policy Centre for Inclusive Growth

     2 FISCAL CONDITION OF THE CONSOLIDATED PUBLIC SECTOR
The accounts of the Brazilian public sector have undergone significant changes over the past
30 years. This period goes back to the foreign debt crisis of the 1980s, monetary stabilisation
with the Real Plan in the first half of the 1990s and a cycle of fiscal policy, characterised by
adjustments during 1999–2005 and a greater fiscal flexibility after 2005. Therefore, it is fitting
that some of this history is recounted, to enable a better understanding of the institutional
framework that governs Brazilian public finances today.
     This section aims to present an overview of the evolution of the fiscal situation of the
Brazilian public sector, from a historical perspective that is clearly inspired by studies such as
by Varsano (1996), Mora and Giambiagi (2005), Serra and Afonso (2007), Piancastelli and Boueri
(2008), Giambiagi (2008), Giambiagi and Além (2008), and Rezende, Oliveira and Araújo (2008).
In particular, we seek to contextualise and characterise the variation in fiscal policy towards a
period of more flexibility after 2006 and its effects on the current fiscal situation of the public
sector, following studies that analysed the recent shift towards greater fiscal flexibility
such as Barbosa (2013), Lopreato (2014), and Gobetti and Orair (2015).
     The starting point is to verify that voluntary capital flows to the majority of countries
in Latin America were interrupted after the excessive external indebtedness of the 1970s, in
conjunction with unfavourable international developments at the turn of the next decade
(interest rate and oil price shocks, and the 1982 Mexican moratorium). The Brazilian foreign
debt reached a peak of 33.2 per cent of Gross Domestic Product (GDP) in 1984 and represented
the main component of the public debt. A downward spiral then began, until the recent
conversion of the public sector into a net external creditor (see Figure 1). 5
     During the ‘foreign debt crisis’, new loans were practically restricted to renegotiations
with multilateral organisms, mainly the International Monetary Fund (IMF), aiming at
rescaling commitments and/or closing the balance of payments. Operations featured typical
conditionalities, such as the implementation of fiscal adjustment measures; during the same
period a series of efforts to equalise fiscal imbalances were made, although still erratically.
By virtue of the difficulty of accessing new credit and rescaling financial commitments, foreign
debt was reduced by approximately 28 per cent of GDP in a little over a decade (1984–1995)
and came to represent a small portion of total indebtedness.
     At the same time, the public sector was exhibiting positive primary results (see Table 1),
and the net domestic debt remained relatively stable at close to 22 per cent of GDP. Total debt
reached 28 per cent of GDP in 1995, which is the lowest level for the historic series depicted in
Figure 1, a year after the introduction of the monetary stabilisation policy (Plano Real), which
represented the end of the hyperinflationary period. However, such positive results were
precarious because the public sector used inflationary mechanisms to reach fiscal goals
through monetary seigniorage or the corrosion of the real value of expenditure by delaying
payments. Moreover, they were influenced by stabilisation plans that had led to the
devaluation of securities and the artificial decrease of debt stock.
     This scenario changed in the early 1990s. First, a cycle of international liquidity began,
with a return of capital flows to Latin American countries after the balancing out of foreign
debt and its restructuring according to the moulds of the Brady Plan (1989/1994). Brazil took
advantage of this period to implement its plan to combat inflation, based on a stable,
overvalued exchange rate that would lead to competitive pressure on prices and constrain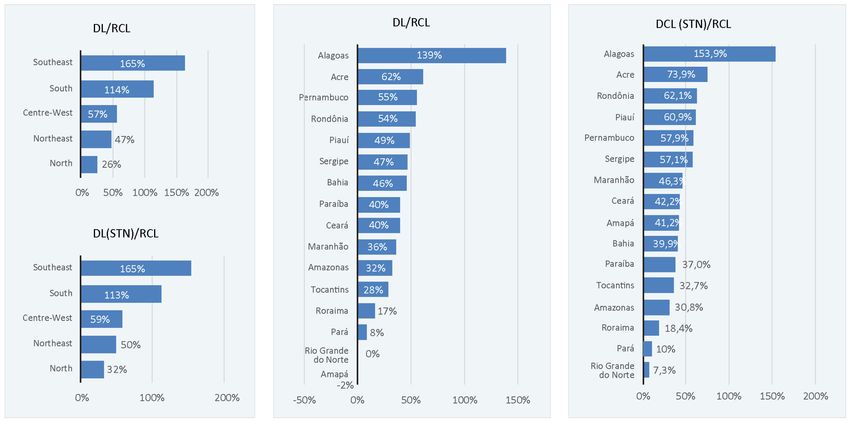
IFAD Strategy for Brazil 2016-2021 and Series of Studies on Rural Poverty                         3

inflationary expectations. High domestic interest rates were one of the requirements of the
macroeconomic regime, aiming at restricting domestic liquidity and stimulating capital
injection to accumulate reserves and protect the exchange rate regime. Furthermore,
the repressed character of the public deficit was evidenced after the end of the inflation
mechanism and under additional pressures from social expenditures, resulting from
the renewal of the social contract during redemocratisation (1985–1990).

FIGURE 1
Public sector net debt (1981–2014) as a percentage of GDP

Note: Information on state-owned companies from 2001 onwards does not include Petrobras and Eletrobras.
Source: Authors’ elaboration, based on data from Giambiagi and Além (2008) for 1981–2000 and from the Central Bank
for 2001–2014.

     The Real Plan was unequivocally successful in terms of fighting inflation, but, on the other
hand, it created a series of fiscal and external imbalances, which in turn led to the speculative
attack on the Brazilian currency and the abandonment of the semi-fixed exchange rate during
late 1998/early 1999. Suffering the impacts of high interest rates and declining fiscal results
(see Table 1), public debt started an uphill climb from 1995 onwards and reached 38.9 per cent
of GDP on the brink of change to the flexible exchange rate system in January 1999. At the
time, a significant portion of the public debt comprised domestic securities indexed to
the interest rate. Predicting the effect that exchange devaluation would have on debt, the
Brazilian government made a new deal with the IMF, which predicted a primary surplus
goal of 2.75 per cent of GDP for 1999.
     The period between 1999 and 2002 was marked by profound changes in fiscal policy.
The imperative of fiscal adjustment precipitated a series of initiatives for institutional reform
that included formal primary surplus goals, as stated in the Budget Guidelines Law from 2000
onwards, and the Law of Fiscal Responsibility (2000), which established stricter control over
public indebtedness and expenditure, as well as principles that guided the conduct of fiscal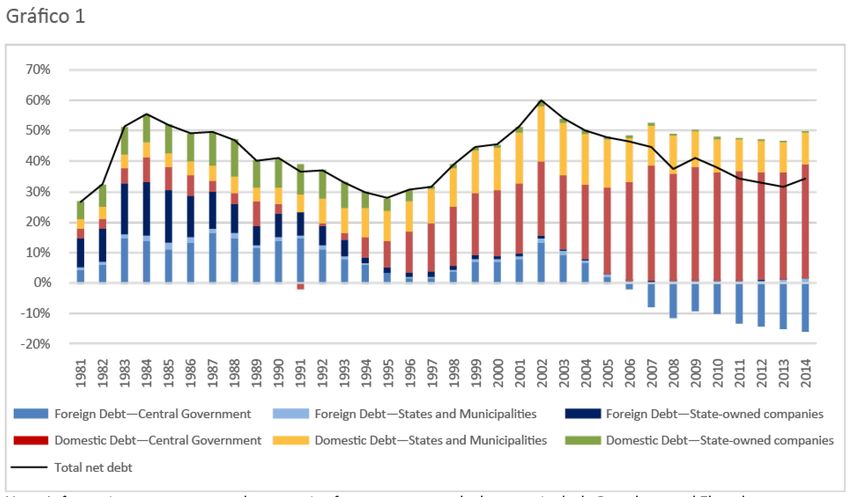
4                                        International Policy Centre for Inclusive Growth

   authorities. Under the new fiscal regime, the public sector was able to increase its primary
   surplus to an average of 3.18 per cent of GDP between 1999 and 2002—following an average
   deficit of 0.18 per cent of GDP between 1995 and 1998 (see Table 1 and Figure 2).

   TABLE 1
   Fiscal indicators by government period (1985–2014)—annual averages as a percentage of GDP
                                                       1985/89   1990/94   1995/98    1999/02   2003/06   2007/10   2011/14   2014
Primary Result (I)                                       0.65      2.80      -0.18       3.18     3.45      2.78      1.59    -0.59
Central government                                      -0.45      1.53       0.16       1.92     2.41      1.95      1.26    -0.37
Regional governments                                     0.06      0.64      -0.27       0.56     0.87      0.81      0.35    -0.14
State-owned companies                                    1.04      0.63      -0.07       0.70     0.17      0.03     -0.02    -0.08
Interest (II)                                            5.80      2.84       5.91       7.27     7.24      5.37      5.10     5.64
Nominal result (III) = (I) + (II)                       -5.15     -0.04      -6.09      -4.09    -3.79     -2.58     -3.52    -6.23
Exchange rate adjustment (IV)                              -         -          -        5.06    -1.47      0.29     -1.58    -1.74
Other conditioning factors of net indebtedness (V)         -         -          -        0.39     0.40     -0.19      0.00     0.16
GDP growth effect (VI)                                     -         -          -       -4.43    -6.05     -4.81     -2.91    -2.08
Net debt variation (VII) = (IV) + (V) + (VI) – (III)       -         -          -        5.11    -3.34     -2.13     -0.97     2.57
Memo: Public sector net debt                               -         -          -       51.71    49.68     40.27     33.25    34.11
   Note: Data for the inflation period (before 1995) consider real interest and operating income.
   Information on state-owned companies does not include Petrobras and Eletrobras from 2002 onwards.
   Source: Authors’ elaboration, with data from the Central Bank for 1996–2014 and from Giambiagi and Além (2008)
   for 1985–1995.

   FIGURE 2
   Nominal results of the Brazilian public sector (1998–2014)—values as a percentage of GDP

   Note: Interest is presented as negative values. Information on state-owned companies does not
   include Petrobras and Eletrobras from 2002 onwards.
   Source: Authors’ elaboration with data from the Central Bank.

         Paradoxically, the fiscal adjustment efforts did not translate directly into control over
   indebtedness. Net debt reached its peak of 59.8 per cent of GDP at the end of 2002 (Figure 1),
   an increase of over 20 percentage points in only fou’r years, which might be attributed to
   the financial component of public indebtedness and the economic downturn. 6 The country
   went through a turbulent scenario of successive crises of emerging economies, including two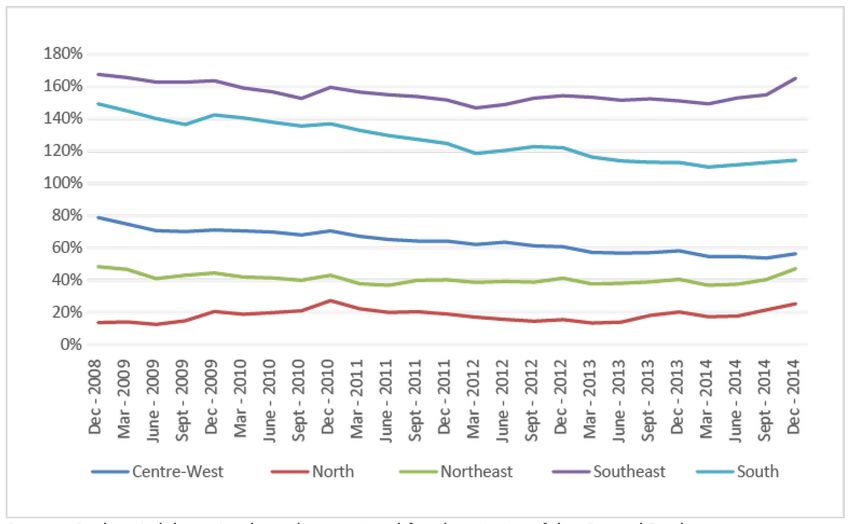
IFAD Strategy for Brazil 2016-2021 and Series of Studies on Rural Poverty         5

Brazilian exchange rate crises (1998/1999 and 2002/2003). First, interest rates were kept high
to stimulate the entry of foreign capital and form a cushion of reserves, necessary for the
protection of the exchange rate regime. Meanwhile, restrictive monetary policy—meant to
fight inflation—demanded that money inflows be sterilised through the issuance of public
bonds, to avoid the expansion of liquidity in the domestic economy.
     With the deterioration of the foreign macroeconomic scenario, the high interest rates
turned into a defensive mechanism to stem the flight of capital and loss of reserves, as well as
to stop excessive devaluation and exchange rate volatility. The financial component became
a crucial part of the ascending trajectory of public debt: rollover operations of public securities
at high interest rates and impacts from exchange rate devaluations on domestic debt indexed
to the exchange rate and on foreign debt. On average, interest payments were around
7.3 per cent of GDP per year, and exchange rate adjustments represented 5.1 per cent
of GDP per year between 1999 and 2002.
     Local governments made an important contribution to the process of fiscal adjustment
with a growing indebtedness. A significant portion of the increased debt originated from
states and municipalities (+6.3 percentage points, from 13.3 per cent of GDP in 1998 to 19.6
per cent in 2002). This happened even with the conversion of average deficits of 0.27 per cent
of GDP between 1995 and 1998 into primary surpluses from 1998 onwards—of an average of
0.56 per cent of GDP between 1999 and 2002 (see Table 1 and Figure 2). During this last period,
an institutional framework was consolidated, aimed at controlling indebtedness in regional
governments and shifting their relationship with the central government.
     The financial fragility of the regional level was evidenced by the end of the inflation
mechanism, followed by an economic downturn by the second half of the 1990s, difficulty in
debt rollover with private creditors and a worsening of the fiscal war, which restricted states’
tax revenues. Demanding the rescheduling of state debts (except for the states of Amapá and
Tocantins) and those of large municipalities between 1997 and 1999, the central government
harnessed the precarious situation to take steps towards ensuring the contribution of
the regional level to the generation of primary surpluses. The renegotiation comprised an
operation whereby the Federal Government assumed the debts of regional governments in
exchange for long-term loans (30 years). The regional governments committed to monthly
instalments subject to a fixed ceiling of a portion of their income (13 per cent of net current
revenue). This process was complemented in 2000 with the approval of the Fiscal
Responsibility Law, which, in addition to the limits imposed on expenditure and indebtedness,
conditioned new credit operations to prior authorisation by the Ministry of Finance. 7
     In practice, the financial engineering stemmed the process of debt rollover by regional
governments and made them generate a primary surplus equal to what they owed the
Federal Government. With the continuing indebtedness of 1999–2002, the net debt of local
governments reached its peak of 19.6 per cent of GDP in 2002, composed almost entirely of
federal debts. Debt rescheduling with the Federal Government was based on a general price
index (IGP-DI), more susceptible to fluctuations in exchange rates and wholesale prices,
plus a real interest rate of 6–9 per cent per year. On the one hand, a high level of debt stock
correction was established, although inferior to market rates at the time. On the other hand,
the low tax collection performance during the economic downturn meant that the payment
instalments, subject to a ceiling proportional to current revenue, were often below what was
necessary to ameliorate the debt.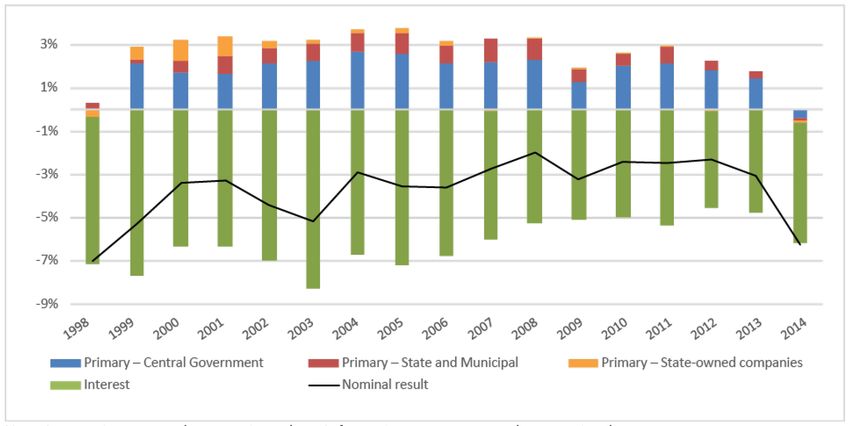
6                            International Policy Centre for Inclusive Growth

     From 2003 onwards, under the rule of Luis Inácio Lula da Silva, the Brazilian government
implemented a new fiscal adjustment, with an increase in primary surplus goals, after public
indebtedness reached nearly 60 per cent of GDP during the exchange rate crisis of the 2002
election period. The early Lula administration kept the same essential characteristics of the
previous macroeconomic regime, such as relatively high levels of primary surplus and interest
rates to control inflation. This resulted in average yearly surpluses of 3.45 per cent of GDP
between 2003 and 2006, the highest in Table 1, and nominal interest rates of 7.2 per cent
of GDP, which were very close to the 7.3 per cent of GDP in 1999–2002.
     The main distinction was a consequence of the new cycle of liquidity and commodity
prices on international markets. The country presented a primary surplus in its payment
balance once again and a tendency for exchange rate valuation over the medium term.
Parallel to this fact, the government undertook a change in the composition of public debt:
not only substituting foreign debt and internal exchange-indexed securities with fixed-rate
and inflation-linked securities, but also aggressively acquiring foreign exchange reserves,
which transformed the public sector into a net creditor of foreign currency.
     Therefore, at the end of 2006, through the combination of fiscal efforts and the
resumption of growth, the net debt fell to 46.5 per cent of GDP, as can be seen in Figure 1.
These transformations are important because they reduced the financial vulnerability of
the public sector with a decrease in the level of indebtedness and a shift in its composition,
because exchange rate devaluations began to reduce (and no longer increase) debt.
      It is in this scenario of less vulnerability and greater economic growth that a change occurs
in Brazilian fiscal policy towards a phase of fiscal expansion, starting in 2006. This phase was
characterised by the progressive reduction of primary results in structural terms, which culminated
in a deficit of 0.59 per cent of GDP in 2014—the first deficit of the inflation target regime. 8
     Initially, and in fact for most of the period, fiscal flexibility did not stop indebtedness from
continuing to decrease. Between 2006 and 2010, net debt decreased by 8.5 percentage points
of GDP and, between 2010 and 2013, by a further 6.4 percentage points. This decrease occurred
even with the country traversing the most acute period of the 2008 international financial crisis,
in which the government implemented a broad package of anticyclical fiscal measures, and the
new economic downturn after 2011, when many of these measures were renewed or broadened
in scope. Only in 2014, following a strong economic retraction and the aforementioned primary
deficit, did indebtedness rise again, from 31.5 per cent to 34.1 per cent of GDP.
      From a longer-term perspective and compared to the start of the primary surplus target
regime, the net indebtedness of the Brazilian public sector decreased significantly. In 2014, it
reached a relatively low level, comparable to those observed in the first half of the 1990s, and with
a composition that was less vulnerable to external shocks. The problem was that the cost of debt
stabilisation—that is, the primary surplus required to avoid its growth—became excessively
high over the preceding years due to another factor, related to the composition of indebtedness,
namely the simultaneous accumulation of public assets and liabilities with an enormous interest
differential between them. In other words, Brazilian indebtedness has decreased significantly in
net terms but has in fact increased in gross terms (or at least remained stable), as can be seen in
Table 2. The liabilities of the public sector grew by about 5 percentage points between 2006 and
2014, for two main reasons: the accumulation of foreign exchange reserves (from 7.6 per cent to
17.8 per cent of GDP) and the capitalisation of official financial institutions (from 0.5 per cent to
9.9 per cent of GDP), such as the Brazilian Development Bank (BNDES)—used before and after
the crisis to subsidise public and private investments.
IFAD Strategy for Brazil 2016-2021 and Series of Studies on Rural Poverty 7
TABLE 2
Public sector net and gross debt (2006–2014)—values as a percentage of GDP
2006 2007 2008 2009 2010 2011 2012 2013 2014
Public sector net debt
46.5 44.6 37.6 40.9 38.0 34.5 32.9 31.5 34.1
(I) = (II) + (VI) + (IX) + (XI) + (XVI)
Federal Government (II) = (III) + (IV) + (V) 30.2 29.8 24.5 29.2 26.9 24.3 22.5 21.2 23.1
Debt* (III) 51.3 49.0 44.6 44.6 43.1 42.1 41.9 40.6 40.9
Security debt 44.6 44.3 39.8 41.1 40.4 39.9 39.7 38.6 38.8
Bank debt 0.1 0.1 0.1 0.1 0.1 0.2 0.2 0.2 0.2
Debt assumed by the Federal Government
1.0 0.8 0.7 0.5 0.4 0.2 0.1 0.0 0.0
(Law No. 8.727)
Foreign debt 5.6 3.8 4.1 2.9 2.3 1.8 1.9 1.7 1.9
Credits** (IV) -24.0 -22.3 -22.3 -23.9 -25.2 -24.4 -25.6 -25.2 -26.0
Official financial institutions -0.5 -0.5 -1.4 -4.4 -6.6 -7.3 -8.6 -9.1 -9.9
Worker’s Aid Funds (FAT) in the banking network -5.1 -4.7 -4.4 -4.2 -3.8 -3.6 -3.6 -3.6 -3.7
Debts with subnational governments -15.2 -14.2 -13.7 -12.4 -11.6 -10.7 -10.5 -9.9 -9.5
Other internal credits -3.1 -2.9 -2.8 -2.9 -3.2 -2.8 -2.9 -2.6 -2.9
Foreign credits 0.0 0.0 0.0 0.0 0.0 0.0 0.0 0.0 0.0
Relationship with the Central Bank (V) 3.0 3.1 2.2 8.5 8.9 6.6 6.3 5.8 8.1
State government (VI) = (VII) + (VIII) 13.1 11.9 11.6 10.5 10.0 9.2 9.4 9.4 10.0
Debt (VII) 14.2 13.1 12.7 11.7 11.1 10.4 10.6 10.6 11.1
Securities debt 0.0 0.0 0.0 0.0 0.0 0.0 0.0 0.0 0.0
Bank debt 0.3 0.2 0.2 0.4 0.5 0.5 0.7 1.1 1.6
Debt with the Federal Government 13.4 12.4 12.0 10.9 10.1 9.3 9.1 8.5 8.2
Foreign debt 0.5 0.4 0.5 0.4 0.5 0.5 0.8 1.0 1.3
Credits (VIII) -1.0 -1.2 -1.2 -1.1 -1.1 -1.1 -1.2 -1.3 -1.1
Municipal government (IX) = (X) + (XI) 1.9 1.8 1.8 1.7 1.6 1.6 1.6 1.7 1.6
Debt (X) 2.0 1.8 1.8 1.7 1.6 1.6 1.6 1.6 1.6
Securities debt 0.0 0.0 0.0 0.0 0.0 0.0 0.0 0.0 0.0
Bank debt 0.1 0.1 0.1 0.2 0.2 0.2 0.2 0.2 0.3
Debt with the Federal Government 1.8 1.7 1.7 1.6 1.5 1.4 1.4 1.4 1.4
Foreign debt 0.1 0.1 0.1 0.1 0.1 0.1 0.1 0.1 0.1
Credits (XI) -0.1 -0.1 -0.2 -0.1 -0.1 -0.1 -0.1 -0.1 -0.1
Central Bank (XI) = (XIII) + (XIV) + (XV) 0.4 0.3 -1.0 -1.2 -1.1 -1.2 -1.3 -1.3 -1.3
Liabilities (XIII) 11.7 16.1 17.0 20.6 20.9 21.2 21.9 21.1 24.6
Monetary base 5.0 5.4 4.7 5.0 5.3 4.9 5.0 4.8 4.8
Securities debt 0.0 0.0 0.0 0.0 0.0 0.0 0.0 0.0 0.0
Repo operations 3.2 6.9 10.5 13.7 7.4 7.8 11.1 10.3 14.7
Deposits in the Central Bank 3.5 3.8 1.8 1.9 8.1 8.5 5.8 6.1 5.1
Credits (XIV) -8.4 -12.7 -15.9 -13.2 -13.0 -15.8 -16.9 -16.6 -17.8
Other accounts in the Central Bank -0.8 -0.9 -0.9 -0.9 -0.8 -0.8 -0.8 -0.5 -0.4
Central Bank credits to financial institutions 0.0 -0.1 0.6 -0.1 -0.1 -0.1 -0.1 0.7 0.5
International reserves -7.6 -11.7 -15.5 -12.3 -12.2 -14.9 -16.0 -16.9 -17.8
Relationship with the Federal Government (XV) -3.0 -3.1 -2.2 -8.5 -8.9 -6.6 -6.3 -5.8 -8.1
Treasury Account 9.4 10.1 8.2 12.2 10.4 10.9 13.2 12.7 11.0
Federal security debt in the Central Bank’s
-12.3 -13.2 -15.9 -19.2 -18.1 -17.2 -19.2 -18.6 -20.2
portfolio
Exchange rate equalisation 0.0 0.0 5.5 -1.6 -1.3 -0.3 -0.2 0.1 1.2
State-owned companies (XVI) 0.8 0.8 0.8 0.7 0.6 0.6 0.6 0.6 0.7
Memo: General government gross debt 55.5 56.8 56.0 59.3 51.8 51.3 54.8 53.3 58.9
Memo: Public sector liabilities 63.9 65.9 62.6 66.2 65.2 64.7 65.6 64.2 68.8
Note: *Repurchase agreements not included. **Does not include the balance of the Treasury Account
and repurchase agreements.
Source: Authors’ elaboration, with data from the Central Bank.
The accumulation of low-profitability assets—predominantly BNDES credits based on the
Long-Term Interest Rate (TJLP) and fixed income securities issued by the US government with
close to zero rates—totalling nearly 20 percentage points of GDP, was counterweighted by an8 International Policy Centre for Inclusive Growth
increase in public indebtedness. This happened through the issuance of federal government
securities, whose average cost is much higher, or because, by virtue of the way that monetary
policy functions when it is too focused on short-term liquidity control, it demanded repo
operations with federal government securities by the Central Bank, based on the short-term
basic interest rate (Selic). This explains not only the divergent trajectory between the two debts
(net and gross) but also the high rate of nominal interest, which, despite the reduction in the
net debt stock, reached an average of 5.1 per cent of GDP between 2011 and 2014.
In this context, allied to low economic growth and increased interest rates to fight
inflation, the level of public indebtedness once again depends on significant improvements
in primary results. This will involve—at least in the medium term—strong restrictions by the
Federal Government on the clearance of credit operations for states and municipalities, more
control over expenditures and a revision of tax exemptions and subsidies instituted during the
previous period. The fiscal adjustment under way since 2015 is interrupting the flexibility that
characterised the period between 2006 and 2014.
Another aspect of this period of fiscal expansion was the increased flexibility regarding
restrictions to the indebtedness of regional governments. As can be seen in Table 2, approval
by the Federal Government allowed for the banking debt of states and municipalities to
increase by 1.4 percentage points of GDP, and foreign debt by another 0.9 percentage points.
Although a portion of the loans was used in the restructuring of liabilities, substituting debt
with the Federal Government by cheaper loans, the main purpose was to finance capital
investments, taking credit from the public banking sector or multilateral organisms,
which will be analysed further in Section 4.
It is important to note that the net debt of regional governments had been decreasing
between 2002 and 2008, while credit taking was still subject to rigid control. Fundamental to
this process were the acceleration of economic growth, which drove state revenues, and the
tendencies of exchange rate valuation and inflation control, which positively influenced the
index of the rescheduled debt with the Federal Government (IGP-DI).
This picture changed, however, from 2008 onwards, with not only a deterioration of the
macroeconomic scenery but mainly through the resumption of external and banking credit.
Debt with the Federal Government maintained its downward trajectory, falling a further
4.2 percentage points of GDP in 2008–2014 (from 13.7 per cent to 9.5 per cent of GDP) and,
at first sight, more than made up for the new operations. Only after 2011 did the volume
of the contraction of credit surpass the discharge of commitments with the Federal
Government, causing an increase in indebtedness. The regional governments’ net debt
fell by 2.5 percentage points of GDP in 2008–2011 and rose by 0.8 percentage points in
2011–2014, reaching 11.6 per cent of GDP in 2014, a level similar to the early 1990s.
In other words, the resumption of foreign and bank indebtedness by regional
governments indicates a change in the composition of the debt rather than a trajectory of
increasing indebtedness. Even so, it is a very expressive phenomenon. At the state level, which
concentrated credit taking, foreign and bank credit leapt from BRL23.3 billion to BRL160 billion
between 2008 and 2014, and its weight relative to the total debt increased from 6 per cent
to 26 per cent. The debt with the Federal Government remains the main liability of state
governments, but it has lost importance somewhat in relation to the total debt. As will be seen
in the next section, it is now secondary in many states. New, previously repressed sources of
expenditure financing partially explain why the states’ primary results shrunk from a surplusIFAD Strategy for Brazil 2016-2021 and Series of Studies on Rural Poverty 9
level of slightly under 1 per cent of GDP up to 2008 to a deficit of 0.24 per cent of GDP in 2014.
Other factors responsible for the deterioration of fiscal results are related to the impacts of
economic slowdown on tax revenue and, indirectly, on the volume of transfers by the
Federal Government. These factors will be analysed in more detail in Section 5.
For now, what is important is to understand the broader characteristics of fiscal
policy that are crucial in sustainability evaluation. Reducing primary results and increasing
indebtedness are not necessarily undesirable, as long as the fiscal space is channelled
towards public expenditures that boost the development process. For a better evaluation
of the determinants of fiscal deterioration, we present Table 3 from Gobetti and Orair’s
study (2015), which details the components of the primary result of the three levels
of the government between 2009 and 2014.
The numbers show that the reduction in the primary result of the general government
(Federal Government, states and municipalities) as a proportion of GDP between 2009 and
2014 is almost entirely explained by the increase in expenditure, given that revenues were
stable, even with tax exemptions at the federal level. That is, the process of greater fiscal
flexibility that started in 2006 did not directly result in significantly worse fiscal results during
most of the period, because revenues were driven by high growth rates in product and
wages. 9 From 2011 onwards, continuing expansion of expenditures in a scenario of low
economic growth and slowing tax revenues led to a rapid deterioration of fiscal results.
An analysis of the expenditures, however, shows that they grew according to different
determinants in the federal and regional levels. In the federal level, growth is explained mainly
by expenditures for social benefits, subsidies and costing, while in the regional level, both
for states and municipalities, the main determinants are expenditures on the wages and
retirement pensions of public servants.
Public investment, which presumably would be the main target of increased fiscal
flexibility, remained relatively stable between 2009 and 2014, excluding the years of
presidential and state governor elections (2010 and 2014), when the political cycle influences
the amount of expenditures. Apart from that, the data indicate that there was an interruption
in the tendency of increasing investments that prevailed during the early fiscal expansion
phase. This was observed across all spheres—federal, state and municipal. 10
Analysing the series of capital investments from a middle-term perspective, such as in
Table 4, we can see that the main increase, across all spheres of the government, , occurred
between 2006 and 2010. In addition, in this phase, the clearance of credit operations had just
started. In contrast, between 2011 and 2014, when a great volume of loans was contracted,
total public investment—state investment in particular—stopped growing. This situation,
revealed by aggregate data, suggests caution, insofar as it shows that states would have
utilised the fiscal space opened by credit operations to cover their increased personnel costs.
In other words, although a significant part of the operations were tied to investments, state
governments seem to have promoted a substitution of sources of financing, freeing up funds
previously tied up in investments to cover expenses on wages and retirement pensions.
This analysis will be deepened in Section 5.10 International Policy Centre for Inclusive Growth
TABLE 3
Primary result of the general government (2009–2014)—values as a percentage of GDP
Description 2009 2010 2011 2012 2013 2014 2009–2014
Primary revenue 22.18 21.71 22.59 22.45 22.68 21.80 -0.38
Taxes 13.70 13.69 14.30 13.96 14.16 13.56 -0.14
Social contributions 5.47 5.45 5.62 5.81 5.78 5.79 0.32
Others 3.01 2.57 2.67 2.68 2.75 2.45 -0.56
Legal grants 3.84 3.62 3.94 3.85 3.68 3.81 -0.03
Central government
Net revenue 18.34 18.09 18.65 18.60 19.00 17.99 -0.35
Total expenditure 17.16 16.88 16.51 16.99 17.51 18.30 1.15
Personnel 4.61 4.33 4.14 3.99 3.97 4.02 -0.59
Social benefits 8.49 8.24 8.16 8.61 8.89 9.29 0.80
Subsidies 0.18 0.23 0.41 0.46 0.62 0.65 0.46
Costing 2.78 2.84 2.73 2.87 3.00 3.22 0.44
d/q grants 1.36 1.37 1.29 1.36 1.24 1.26 -0.10
Capital investments 0.97 1.15 0.96 0.99 0.92 1.04 0.07
d/q grants 0.36 0.38 0.31 0.42 0.28 0.30 -0.06
Financial investments 0.14 0.08 0.10 0.07 0.10 0.09 -0.05
Primary result 1.18 1.21 2.14 1.61 1.49 -0.31 -1.50
Primary revenue 11.66 11.47 11.32 11.45 11.60 11.50 -0.16
Taxes 8.73 8.74 8.62 8.90 9.16 9.13 0.40
Social contributions 2.22 2.09 2.08 1.96 1.82 1.77 -0.45
Others 0.71 0.64 0.61 0.60 0.62 0.60 -0.11
Grants 2.23 2.25 2.16 2.25 2.23 2.20 -0.03
State governments
Net revenue 9.43 9.21 9.16 9.20 9.37 9.30 -0.13
Total expenditure 8.77 8.64 8.23 8.62 9.07 9.53 0.77
Personnel 5.45 5.29 5.29 5.56 5.70 6.00 0.56
Social benefits 0.03 0.03 0.03 0.04 0.04 0.04 0.02
Subsidies 0.01 0.01 0.00 0.00 0.01 0.01 0.00
Costing 1.91 1.82 1.75 1.87 1.96 1.95 0.04
Capital investments 0.92 1.04 0.70 0.70 0.91 1.08 0.16
Others 0.46 0.46 0.44 0.45 0.45 0.45 -0.01
Primary result 0.66 0.57 0.93 0.57 0.29 -0.24 -0.90
Primary revenue 7.80 7.78 7.91 8.21 8.07 8.27 0.47
Taxes 1.96 1.98 2.05 2.16 2.20 2.30 0.33
Social contributions 5.42 5.34 5.44 5.61 5.48 5.58 0.16
Others 0.41 0.45 0.42 0.44 0.39 0.39 -0.02
Municipal governments
Grants 0.04 0.05 0.04 0.04 0.06 0.07 0.03
Net revenue 7.76 7.73 7.88 8.17 8.01 8.21 0.45
Total expenditure 7.59 7.58 7.75 8.16 7.88 8.28 0.69
Personnel 3.79 3.66 3.72 3.96 4.08 4.39 0.60
Social benefits 0.03 0.03 0.03 0.03 0.03 0.04 0.01
Subsidies 0.00 0.00 0.00 0.00 0.00 0.00 0.00
Costing 2.73 2.64 2.72 2.73 2.65 2.72 -0.02
Capital investments 0.76 0.90 0.92 1.01 0.73 0.81 0.05
Others 0.27 0.35 0.36 0.42 0.38 0.33 0.05
Primary result 0.17 0.15 0.12 0.01 0.13 -0.07 -0.25
Primary revenue 33.82 33.27 34.09 34.18 34.86 33.93 0.11
d/q non-recurring 0.71 0.07 0.38 0.27 0.68 0.50 -0.20
Total expenditure 31.80 31.35 30.89 31.99 32.94 34.56 2.76
General government
Personnel 13.85 13.28 13.16 13.51 13.74 14.41 0.57
Social benefits 8.54 8.30 8.22 8.68 8.97 9.37 0.83
Subsidies 0.19 0.25 0.41 0.47 0.64 0.66 0.47
Costing 6.06 5.93 5.91 6.10 6.38 6.62 0.57
Capital investments 2.29 2.71 2.27 2.28 2.28 2.63 0.34
Others 0.87 0.89 0.91 0.95 0.93 0.87 0.00
Primary result 2.02 1.92 3.19 2.20 1.92 -0.63 -2.65
Statistic discrepancy -0.11 -0.18 -0.31 -0.18 -0.14 0.12 0.23
Source: Gobetti and Orair (2015).IFAD Strategy for Brazil 2016-2021 and Series of Studies on Rural Poverty 11
TABLE 4
Gross fixed capital formation of the public administration (1996–2014)—
values as a percentage of GDP
Central State Municipal Public Federal state- Public
Year
government government government administration owned companies sector
1996 0.35 0.67 1.12 2.14 0.58 2.72
1997 0.39 0.82 0.68 1.88 0.69 2.57
1998 0.41 1.14 0.80 2.34 0.80 3.15
1999 0.26 0.61 0.65 1.52 0.76 2.28
2000 0.23 0.74 0.72 1.69 0.77 2.46
2001 0.41 0.83 0.63 1.87 0.85 2.72
2002 0.45 0.78 0.95 2.18 1.11 3.29
2003 0.20 0.53 0.75 1.47 1.08 2.55
2004 0.21 0.58 0.79 1.59 1.01 2.60
2005 0.33 0.65 0.61 1.59 1.00 2.60
2006 0.38 0.74 0.83 1.95 0.97 2.92
2007 0.42 0.50 0.82 1.74 1.08 2.82
2008 0.44 0.70 1.01 2.15 1.38 3.53
2009 0.60 0.91 0.75 2.26 1.79 4.04
2010 0.79 1.04 0.88 2.71 1.87 4.58
2011 0.60 0.69 0.90 2.19 1.62 3.81
2012 0.55 0.70 0.98 2.23 1.84 4.07
2013 0.65 0.91 0.73 2.28 1.98 4.27
2014 0.73 1.07 0.80 2.61 1.60 4.21
2002–2006 0.28 0.62 0.75 1.65 1.02 2.67
2007–2010 0.56 0.79 0.87 2.22 1.53 3.74
2011–2014 0.64 0.84 0.85 2.33 1.76 4.09
Source: Authors’ elaboration.
3 FISCAL CONDITION OF STATE GOVERNMENTS:
DEGREE OF INDEBTEDNESS AND PAYMENT CAPACITY
In this section, we present an analysis of the indicators of indebtedness and payment capacity,
centred on the states of the North and Northeast regions of Brazil over the most recent period
(2008–2014), together with the result of the application of a methodology for the classification
of credit risk. The objective is to qualify the analysis of the trajectory of the public debt of state
entities, which, as was seen in the previous section, was characterised by a profound alteration
of its composition, whereby new bank and foreign credit operations took the place of
declining debt with the Federal Government. 11
Starting with regional comparisons, Figure 3 shows the evolution of net debt as a
proportion of regional GDP (ND/GDP) and allows for the identification of a unique pattern of
change in the composition of indebtedness, which occurred more pointedly in the North and
Northeast regions of the country (in addition to the Centre-West). 12, 13 In the North region, the
debt with the Federal Government fell more significantly (-2.3 percentage points of regional
GDP) and was converted into a residual share (from 73 per cent to 21 per cent of the total
debt). The counterpart was the increase in bank and foreign debts (+3.2 percentage points
and +1.2 percentage points, respectively), which turned into the largest components of
indebtedness. The North also has the distinction of being the only region exhibiting an
increase in its level of indebtedness: the ND/GDP indicator increased from 2 per cent to
3.7 per cent; however, this should be put into perspective: it has the lowest degree of
indebtedness as a proportion of GDP.12 International Policy Centre for Inclusive Growth
A similar phenomenon was observed in the Northeast region: the debt with the Federal
Government fell by 5.5 percentage points of GDP and became less relevant (from 84 per cent
to 34 per cent of the total debt), while bank and foreign debts became increasingly important
(respectively, +2.1 percentage points and +1.8 percentage points of GDP). There was a slight
reduction in the ND/GDP indicator in the Northeast region between 2007 and 2014
(-1.5 percentage points of GDP), with a tendency to expand from 2011 onwards.
Therefore, it can be concluded that the change in net debt composition, through an
increase in the significance of bank and foreign debts, occurred more intensively in the North
and Northeast regions of Brazil. This was partly because the level of indebtedness in these
regions was relatively low compared to others, and the proportion of debt with the Federal
Government decreased more rapidly. Even so, the uptake of new credits was significant, and,
from the point of view of fiscal sustainability, it is interesting to know whether it compromised
the capacity of states to honour their prior commitments.
FIGURE 3
Net debt of subnational entities by region—December 2007 to December 2014;
values as a percentage of regional GDP
Source: Authors’ elaboration based on regional fiscal statistics from the Central Bank.IFAD Strategy for Brazil 2016-2021 and Series of Studies on Rural Poverty 13
FIGURE 4
ND/CLD (DL/RCL) indicator determined by the Central Bank, by region
(December 2007 to December 2014)
Source: Authors’ elaboration based on regional fiscal statistics of the Central Bank.
FIGURE 5
CLD/CLR (DL/RCL) for purposes of determining the limit of LRF indebtedness in states of the
North/Northeast regions (2000–2014)
Source: Authors’ elaboration from information from Fiscal Management Reports.
To analyse the capacity for payment, the ratio between net debt and Current Net Revenue
(CNR/RCL) will be used as an indicator. It measures the size of debt stock relative to the
available budgetary resources. The higher the indicator, the less the capacity of entities to
honour their financial commitments. The indicators are presented in Figures 4 to 7 and ponder
two alternative concepts to net debt: 1) Net Debt (ND/DL), ascertained by the Central Bank
alongside the financial institutions; and 2) Consolidated Net Debt (CND/DCL), which is
declared by entities in the Fiscal Management Reports and which follows the Law of Fiscal
Responsibility (LFR/LRF). 14 In Figure 6, despite some changes in the order of states,
there are two indicators that exhibit similar results.14 International Policy Centre for Inclusive Growth
In general, it can be observed that states in the North and Northeast regions are below the
other regions and have shown tendencies towards stability for the greater part of 2008–2013,
and a slight deterioration since early 2013. Moreover, the analysis reveals that the main
exception is the state of Alagoas, the only state in the North or Northeast region with a net debt
surpassing 100 per cent of the CNR/RCL during 2014. Among the remaining states, the highest
indicators were found in Acre, Rondônia, Piauí and Pernambuco (close to or over 50 per cent).
The CND/CNR (DCL/RCL) indicator serves as reference for ascertaining the
indebtedness limit of two times the CNR/RCL established by the Federal Senate Resolution
No. 40 of 20 December 2001. As can be observed in Figures 5 and 6, all the states in the
North and Northeast regions are framed by this criterion. 15 Figure 5 also shows that, at the
start of the implementation of the LRF, Piauí and Bahia came close to the limit, and the
states of Alagoas and Maranhão actually exceeded it. Since then, almost all of the states
have converged to lesser values, and even Alagoas, which has a greater CND/DCL than CLD
(RCL), demonstrates a downward trend. However, the same figures point to an inflection
since early 2013, with traces of deterioration in the indicators in the North and Northeast
regions (in addition to the Southeast).
FIGURE 6
Indicators of public debt/RCL based on the Central Bank’s concept of net debt (ND)
and the LRF’s concept of consolidated net debt (CND)—regions of the country and states
of the North and Northeast regions (2014)
Source: Authors’ elaboration based on information from Fiscal Management Reports and the Central Bank’s regional statistics.
Such findings are corroborated by individual analysis, as evidenced in Figure 7 by the
separation of states between North and Northeast regions (left side) and other regions
(right side) and by brackets according to CND/CNR (DL/RCL) at the end of the period:
up to 0.4; between 0.4 and 1.0; and over 1.0; representing low, medium and high degrees of
indebtedness, respectively. In the North/Northeast set, there is a higher concentration in the
low bracket, whereas the other regions exhibit a more even distribution. Among the states
in the low bracket, Tocantins, Amazonas, Ceará and Paraíba have exhibited more significantIFAD Strategy for Brazil 2016-2021 and Series of Studies on Rural Poverty 15 deterioration from 2013 onwards. In the middle bracket, six states in the North or Northeast have exhibited an ascending trajectory over the same period (Bahia, Piauí, Rondônia, Pernambuco and Acre, with the single exception of Sergipe). FIGURE 7 Net debt/RCL indicator evaluated by the Central Bank—state governments (December 2007 to December 2014); rolling average over three quarters Source: Authors’ elaboration, with regional statistics from the Central Bank.
16                           International Policy Centre for Inclusive Growth

     To deepen the analysis, we have implemented an adaptation of the methodology
for classification of credit risk employed by the National Treasury Secretariat to guarantee
credit operations to individual states. The methodology is described in Ordinance
No. 306/2012 of the Ministry of Finance, which establishes two steps for granting the
guarantee. The first refers to the fiscal situation, which will be applicable to states
in the North and Northeast regions, and a second one, which depends on the type
of operation to be guaranteed, which will be excluded from this discussion.
     Since the Ordinance is not specific about fiscal concepts, and even less so regarding
data sources, we have opted to use data from the states’ Annual Balances, complemented
by the RCL and DCL from the Fiscal Management Reports and by the primary result and
interest expenditures from the Central Bank. The evaluation is a composite of eight
indicators that point to degree of indebtedness, debt service and fiscal effort in service
of the debt, expenditures on personnel, investment, costing and social security,
as well as savings capacity. Table 5 presents this set of indicators.
     Following the methodology, grades from 0 to 6 are attributed according to the values
of the indicators. The higher the grade, the worse the fiscal situation for the item. Grades
are attributed for each of the last three years, and then a weighted average is applied:
0.5 for 2014, 0.3 for 2013 and 0.2 for 2012. Finally, as described in Table 6, a final grade
for the states is obtained, and we arrive at a classification of their fiscal situation in Table 7.
      The classification of states in the North and Northeast regions, generally speaking,
is of low or very low credit risk. The only state with a high credit risk is Alagoas; it has a high
degree of indebtedness, combined with more favourable fiscal results. With the second worst
grade, Pernambuco is in an opposite situation, combining a low degree of indebtedness with
worrisome fiscal results (high and rising primary deficit, low savings capacity and high and
rising commitment of revenue to personnel costs).
      The analysis undertaken in this section suggests that the fiscal condition of most
states in the North and Northeast regions is relatively healthy in the short term, considering
the indicators of degree of indebtedness and payment capacity, and the classification of credit
risk. However, such a statement must be made cautiously because the degree of indebtedness
stopped improving in 2011, payment capacity has been deteriorating for a large number of
states since early 2013, and, as seen in Section 5, all of them have recorded worsening fiscal
results, with poor short-term prospects.
      The most credible scenario is a downgrading in the classifications of credit risk
over the next few years, inasmuch as they more appropriately capture recent trends of
fiscal deterioration. However, this does not seem to point towards explosive indebtedness
behaviour. First, because the Federal Government has been promoting a reorientation of fiscal
policy through the fiscal adjustment starting in 2015, which will imply, at least in the short
term, the tightening of restrictions regarding the approval of new credit operations.
IFAD Strategy for Brazil 2016-2021 and Series of Studies on Rural Poverty 17
TABLE 5
Indicators of the fiscal situation of the states in the North and Northeast regions of Brazil
Indicator Acronym Year AC AL AM AP BA CE MA PA PB PE PI RN RO RR SE TO
2012 0.6 1.4 0.3 0.0 0.5 0.4 0.4 0.1 0.4 0.5 0.5 0.0 0.5 0.2 0.5 0.3
Indebtedness Ind 2013 0.6 1.4 0.2 -0.2 0.4 0.3 0.3 0.1 0.3 0.4 0.4 0.0 0.5 0.3 0.5 0.2
2014 0.5 1.4 0.1 -0.1 0.4 0.3 0.4 0.1 0.3 0.3 0.4 0.2 0.3 0.3 0.5 0.2
2012 4.8% 13.3% 2.4% 1.3% 3.0% 2.7% 2.6% 1.3% 1.8% 4.2% 2.2% 0.6% 3.4% 3.4% 3.1% 1.7%
Debt service in RCL SDrcl 2013 4.6% 15.1% 1.9% -0.1% 3.3% 2.4% 3.3% 1.3% 1.7% 3.7% 1.8% 0.7% 3.8% 4.3% 3.5% 1.6%
2014 4.1% 24.0% 4.5% -0.1% 3.9% 2.5% 7.9% 1.6% 4.2% 4.4% 2.0% 1.3% 3.7% 3.0% 3.8% 1.0%
2012 -0.8 0.2 -3.6 -10.6 -0.8 -2.5 -1.3 0.1 -2.4 -1.7 -3.5 2.3 1.7 4.7 0.6 -3.2
Primary result
RPsd 2013 -1.2 0.6 -2.1 -136.8 1.1 0.8 2.9 0.5 -1.3 -1.9 -1.0 2.2 -4.0 0.9 0.7 -2.7
debt servicing
2014 -2.0 0.5 1.0 -104.5 2.1 -2.1 1.2 4.1 -0.2 -0.7 4.4 6.4 0.9 1.4 -1.6 -2.9
2012 50% 63% 51% 54% 61% 57% 57% 62% 62% 61% 64% 74% 53% 41% 69% 52%
Expenditure on
DPrcl 2013 53% 60% 49% 56% 62% 56% 56% 62% 58% 60% 41% 74% 58% 50% 68% 62%
personnel in RCL
2014 62% 60% 51% 56% 59% 56% 52% 59% 68% 66% 54% 65% 59% 45% 70% 58%
2012 21% 18% 16% 26% 17% 18% 19% 23% 30% 12% 31% 19% 23% 37% 24% 26%
Savings capacity CGPP 2013 18% 20% 19% 23% 15% 22% 19% 22% 30% 15% 33% 20% 17% 15% 24% 23%
2014 16% 21% 23% 28% 17% 22% 25% 25% 28% 9% 36% 20% 20% 26% 23% 26%
2012 20% 16% 15% 9% 7% 17% 13% 8% 13% 10% 13% 4% 8% 13% 7% 14%
Investments
as a proportion Pidt 2013 18% 12% 17% 11% 6% 13% 12% 8% 12% 12% 17% 4% 12% 15% 4% 11%
of expenditure
2014 18% 11% 13% 7% 6% 13% 10% 6% 9% 10% 11% 5% 8% 14% 6% 10%
2012 87% 0% 57% 957% 64% 56% 74% 67% 45% 104% 63% 52% 198% 2629% 61% 358%
RPPS contributions as
a proportion of social PCRdp 2013 69% 0% 56% 508% 66% 54% 30% 55% 48% 91% 80% 57% 127% 8958% 64% 306%
security expenditures
2014 63% 0% 57% 1409% 65% 56% 123% 65% 52% 63% 63% 65% 175% 3187% 69% 411%
2012 28% 56% 69% 29% 67% 69% 51% 67% 71% 66% 63% 62% 61% 37% 54% 44%
Tax revenue as
a proportion of RTdc 2013 27% 58% 72% 28% 67% 71% 53% 66% 69% 67% 63% 61% 58% 26% 54% 43%
costing expenditures
2014 28% 56% 73% 29% 64% 69% 53% 62% 65% 63% 62% 61% 60% 27% 51% 41%
Source: Authors’ elaboration based on information from Annual Balances, Fiscal Management Reports and regional
statistics of the Central Bank.
TABLE 6
Average grades according to criteria from Ministry of Finance Ordinance No. 306/3012
Indicator Weight AC AL AM AP BA CE MA PA PB PE PI RN RO RR SE TO
Ind 10 0.7 6.0 0.0 0.0 0.0 0.0 0.0 0.0 0.0 0.2 0.0 0.0 0.2 0.0 0.0 0.0
SDrcl 9 0.0 5.3 0.0 0.0 0.0 0.0 0.0 0.0 0.0 0.0 0.0 0.0 0.0 0.0 0.0 0.0
RPsd 8 6.0 3.8 4.8 6.0 3.0 4.5 3.0 3.7 6.0 6.0 4.8 0.0 2.0 0.2 2.9 6.0
DPrcl 7 2.7 4.3 2.1 3.0 4.2 3.3 3.1 4.3 4.4 4.3 3.0 5.8 3.1 0.9 5.7 3.2
CGPP 4 1.8 1.7 1.9 0.2 2.6 1.5 1.4 0.6 0.0 3.8 0.0 1.7 1.3 0.9 0.4 0.1
Pidt 3 0.5 2.6 2.1 4.2 5.3 2.1 3.2 4.9 3.2 3.9 2.4 6.0 4.3 2.5 5.5 3.2
PCRdp 2 1.6 6.0 4.0 0.0 3.1 4.1 2.8 3.2 5.1 0.6 2.6 4.1 0.0 0.0 3.2 0.0
RTdc 1 6.0 2.8 1.1 6.0 1.6 1.2 3.3 1.7 1.3 1.7 2.1 2.2 2.4 5.6 3.2 4.5
Weighted average 2.1 4.5 1.7 2.0 2.0 1.8 1.6 1.9 2.3 2.5 1.7 1.7 1.4 0.6 2.1 1.9
Source: Authors’ elaboration.18 International Policy Centre for Inclusive Growth
TABLE 7
Classification of fiscal situation according to Ministry of Finance Ordinance No. 306/2012
State Grade Fiscal situation
AL C- Very weak fiscal situation, very high credit risk
PE B Strong fiscal situation, low credit risk
PB B Strong fiscal situation, low credit risk
AC B Strong fiscal situation, low credit risk
SE B Strong fiscal situation, low credit risk
AP B Strong fiscal situation, low credit risk
BA B+ Strong fiscal situation, low credit risk
TO B+ Strong fiscal situation, low credit risk
PA B+ Strong fiscal situation, low credit risk
CE B+ Strong fiscal situation, low credit risk
AM B+ Strong fiscal situation, low credit risk
RN B+ Strong fiscal situation, low credit risk
PI B+ Strong fiscal situation, low credit risk
MA B+ Strong fiscal situation, low credit risk
RO A- Very strong fiscal situation, very low credit risk
RR A Very strong fiscal situation, very low credit risk
Source: Authors’ elaboration.
Furthermore, the debt with the Federal Government, by far the largest proportion of
indebtedness in the South and Southeast regions and secondary yet significant in the North
and Northeast regions, is being restructured. Since the period of decreases in basic interest
rates after 2003, governors and mayors have been fiercely resistant to the index used to
adjust the debt with the Federal Government (IGP-DI plus 6–9 per cent interest), which is
highly susceptible to volatility in exchange rates and retail prices. After substantial
negotiations, the Federal Government made a deal in 2014 to replace it with a new
index, defined as the lowest rate per year between the basic interest rate (Selic) and
a tax composed of the consumer price index (IPCA) plus a 4 per cent yearly interest.
Grounded in a draft bill approved by Congress, the deal stated that until the start
of 2015, new contracts were to be signed between the Federal Government and regional
entities, featuring the new index and retroactive correction of outstanding balances since
the signing date of previous contracts. Within the scope of fiscal adjustment, Congress
approved a draft bill in June 2015 that postpones the deadline for the Federal Government
to sign the new contracts until January 2016. In short, the combination of hardening control
over the authorisation of new credit operations together with a restructuring and reduction
of Federal Government debt stock, set for 2016, will contribute to restrict an eventually
untenable trajectory of indebtedness, despite significant fiscal deterioration.
4 FISCAL CONDITION OF STATE GOVERNMENTS:
FOREIGN AND BANK FINANCING
The purpose of this section is to deepen the analysis of the process of change in the
composition of indebtedness of state governments and the role of international financing
for rural development. To that end, we will conduct an analysis of information from creditor
institutions and the purpose of credit, which is available in the Credit Operations Registries
(COCs) of state governments, for 2008–2013. 16IFAD Strategy for Brazil 2016-2021 and Series of Studies on Rural Poverty 19
State credit registries show a significant reduction in outstanding balances for
debt refinancing operations, which comprise the restructured/renegotiated debt with
the Federal Government. These operations conform to the analysis of the previous section
based on information from the Central Bank, despite conceptual differences and differences
in accounting criteria. Table 8 presents outstanding balances at the end of each year
according to the purpose of the credit, differentiating the North and Northeast regions
from the others. It reaches the same conclusion as seen in the previous section: refinanced
debt decreased more intensely in the North and Northeast regions, nominally from BRL39.4
billion to BRL32.9 billion. This space was occupied by the other purposes of the credit.
The subtotal, after excluding the refinancing of the debt, increased from BRL9.5 billion in
2008 to BRL39.6 billion in 2013 in the North and Northeast regions.
In analysing the composition of the other purposes of credit, the first four categories
in Table 8 are related to the financing of rural development projects. The first encompasses
the financing of projects strictly destined for rural development. The remaining three
categories are related to rural development more broadly, consolidating projects destined for
the promotion of: i) fighting rural poverty; ii) sustainable development; and iii) environmental
development, which includes environmental preservation, irrigation and water resources.
In the stricter context of financing rural development, credit operations amounted to,
on average, BRL209.6 million in 2008–2013, and about half, BRL94.3 million on average,
was destined for the North and Northeast regions. It is a limited and relatively stable
proportion of total debt. The amounts become more significant and are rising when the
other three categories related to rural development more broadly are added—from
BRL2.3 billion to BRL7.4 billion. The North and Northeast regions were the main
destination for the funds, which grew from BRL1.9 billion to BRL6.4 billion.
It is worth noting that this growth has only followed the same trends observable for all
purposes of credit in Table 8. When considered in relation to the subtotal, which excludes
debt refinancing, the proportion for financing rural development more broadly remained
fairly stable at 10 per cent of the outstanding balance. More precisely, the subtotal of state
debts increased, driven by operations connected to urban infrastructure and to new
programmes supporting state investments, which grew almost fourfold (from BRL16.3
billion to BRL61.2 billion). 17 In the North and Northeast regions, this growth was even
larger: the outstanding balance of urban infrastructure operations and new programmes
supporting investment grew almost fivefold (from BRL5.7 billion to BRL26.2 billion).
Tables 9 to 11 detail the same information on debts by main creditors, excluding the
parcel of the Federal Government. In the tabulation of these data, it was necessary to add
an additional ‘undetermined’ category by virtue of the ‘creditor’ field not being filled out in
registries. This problem is significant for the pre-2011 period and was recently minimised.
In 2013 it was possible to obtain information regarding creditors for 93.5 per cent of the total
amount of credit operations. Taking this last year as a base, it can be verified that the main
creditors are public banks, representing about half of the state debts (48 per cent in the North
and Northeast regions and 51 per cent of the country as a whole): the Brazilian Development
Bank (BNDES), Banco do Brasil (BB), Caixa Econômica Federal (CEF), Banco do Nordeste (BNB)
and the Banco da Amazônia (BASA). They are followed, in terms of relevance, by multilateral
organisations (41 per cent in the North and Northeast and 38 per cent of the total of state
debts): the International Bank for Reconstruction and Development (IBRD), the Inter-AmericanYou can also read