Social housing purchasing strategy - For Income-Related Rent Subsidy (IRRS) places December 2016 update - Ministry of Social ...
←
→
Page content transcription
If your browser does not render page correctly, please read the page content below
Social housing purchasing strategy
For Income-Related Rent Subsidy (IRRS) places
December 2016 update
Contents
Contents ............................................................................................................. 2
Introduction ....................................................................................................... 5
Part 1: Future direction for the social housing market and the Government’s
objectives........................................................................................................... 6
  A social investment approach for social housing and supports .................................. 6
  The Government’s comprehensive plan for the housing system – an integrated system
  of supports and a diverse market ......................................................................... 7
  A significant amount has been achieved, and MSD continues to work towards achieving
  the goals outlined in the 2015 release .................................................................. 8
  What has changed between the 2015 release and the 2016 release? ........................ 9
Part 2: Informing providers, developers, investors and financiers of social
housing ............................................................................................................ 10
  What is the profile of people on the social housing register? .................................. 10
  How many IRRS places are there currently, and how many additional places would
  MSD like to purchase? ...................................................................................... 13
  How many social housing places are in the pipeline? ............................................. 14
What are the funding and contractual parameters? ......................................... 16
  What are the funding limits and arrangements? ................................................... 16
     Income-Related Rent Subsidy (IRRS) .............................................................. 16
  What are the contracting arrangements for tenancy and property services?............. 19
     Short-term spot contracts for the duration of a specific tenancy .......................... 19
     Long-term capacity contracts for a specific house, unit or apartment ................... 20
     Upfront and operating subsidies for long-term contracts in Auckland ................... 21
How do providers of social housing get involved? ............................................ 24
  How do I get a contract to provide social housing? ............................................... 27
     Opportunities available in all regions ............................................................... 27
     Opportunities in areas of high demand ............................................................. 28
  Are there opportunities for providers to purchase Housing New Zealand properties? . 29
  How will the performance of social housing providers be assessed? ........................ 30
How do providers of social services get involved?............................................ 31
     Funding for social services.............................................................................. 31
Part 3: Purchasing intentions ........................................................................... 33
  Purchasing intentions for change within the base ................................................. 34
  Purchasing intentions for additional IRRS places................................................... 36
Appendix 1: Background on social housing in New Zealand ............................. 39

Social Housing Purchasing Strategy – 2016 update                                                                           Page 2
Appendix 2: What roles do government agencies and providers of social
housing have? .................................................................................................. 40
Appendix 3: What support is available to people with housing needs?............. 43
Housing Support Products ................................................................................. 43
Income Support: Extra Help .............................................................................. 44
Conditional Grant Assistance ............................................................................. 45
Case management support for independence ....................................................... 45
Appendix 4: Registered community housing providers (CHPs) as at 24
November 2016 ................................................................................................ 47
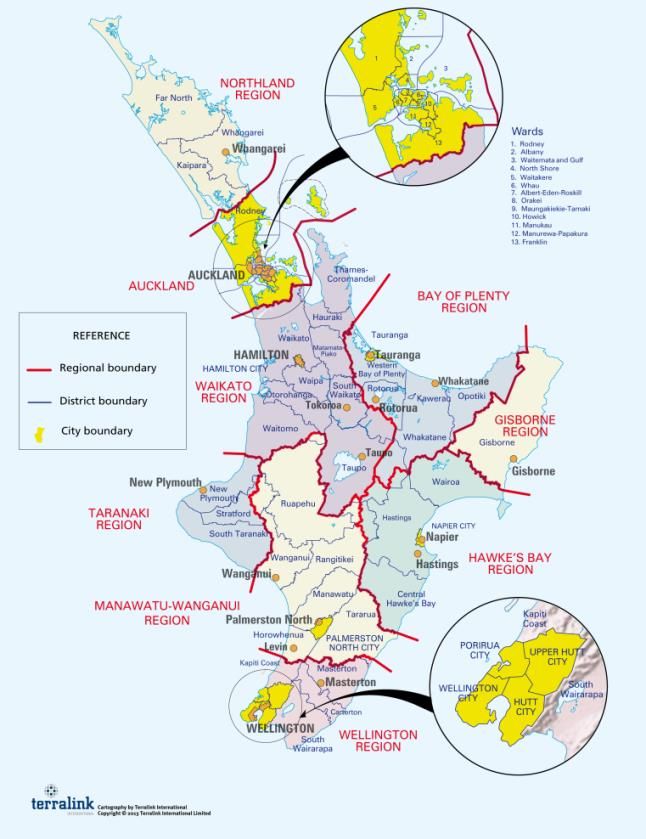
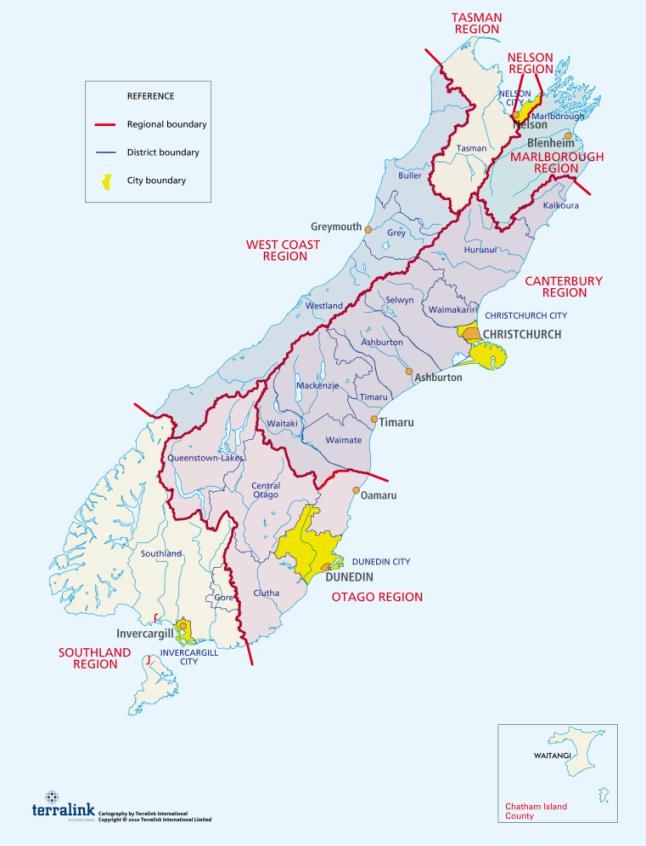
Appendix 5: Map showing regions and TLAs ..................................................... 50
Appendix 6: Weekly rent by TLA....................................................................... 52
Appendix 7: CHP pipeline, as at 30 Sept 2016 .................................................. 54
Auckland ...................................................................................................... 54
Rest of New Zealand...................................................................................... 54
Appendix 8: HNZ pipeline, as at 31 Aug 2016 ................................................... 56
Appendix 9: Overview of methodology used to develop purchasing intentions in
part 3 ............................................................................................................... 58
Social Housing Purchasing Strategy – 2016 update Page 3
The Government has a comprehensive plan for housing vulnerable New
Zealanders
The 2016 Social Housing Purchasing Strategy is the Ministry of Social Development’s strategy for
purchasing subsidised social housing places (Income-Related Rent Subsidy or ‘IRRS’ places) through to
June 2020. A key purpose of the Strategy is to share information with existing and potential providers
about the types and locations of social housing places that are needed, and how MSD will fund and
contract for these places, to support provider’s investment decisions.
What are we trying to achieve?
MSD continues to focus on developing a well-targeted and integrated support system. This means that
people with the highest need have access to social housing for the duration of their need, can access
supports that meet their broader needs, and are supported to move to independence when ready.
The Purchasing Strategy outlines MSD’s plan to ensure that:
the right people
are provided with the right place
for the right length of time
at the right cost.
How are we making it happen?
More social housing places More houses of the right Subsidies and contract
size, in the locations with settings to encourage
the greatest need significant growth in the
CHP sector
MSD plans to purchase over MSD is also signalling that The Strategy outlines the
6,400 additional social housing change within the base is funding and contracting
places by June 2020 required to better match supply parameters that have been set
This number is ambitious and with demand to encourage a strong, diverse
recognises that there are a number There are just over 61,400 social market of community housing
of areas in New Zealand where housing places in ‘the base’. The providers (CHPs). This includes
there is significant unmet demand base is the current number of both CHPs operating at scale in
for social housing. properties for which MSD is paying urban areas, and CHPs catering
This figure is made up of: IRRS across New Zealand. to groups of tenants with
specific needs
An additional 3,800 IRRS places MSD is seeking to reconfigure the
to be secured over four years, base so that the locations and types These parameters include:
half of these will be in Auckland of properties in the base are better significant subsidies to help
Approximately 2,600 IRRS matched to demand. CHPs build new houses in
places currently in the pipeline Auckland and across New
For example, to better meet
(this means they are contracted Zealand
identified demand MSD is seeking to
or highly likely to eventuate)
increase the number of one and two long-term contracts in areas
From 2017 MSD will publish a bedroom properties in the base. of high demand and projected
quarterly update showing the
The Strategy specifies the locations population growth
number of places in the pipeline
that we have been able to house in which MSD is seeking to market rent limits that reflect
people in and the number of new significantly increase the number of current conditions, which will be
places that have been added to the places, based on what we know updated annually.
pipeline. Increasing visibility of about demand from a range of
what’s happening in the market will sources. MSD is looking to secure The Strategy also provides
give providers a comprehensive more of these places from information on how MSD works with
information base on which to community housing providers. providers, and contracts for and
support decisions. funds social housing. It also outlines
the range of housing supports that
are available to those in need.
Social Housing Purchasing Strategy – 2016 update Page 4
Introduction
The Ministry of Social Development (MSD) is tasked with supporting New Zealanders
who need help with housing – from providing help with emergency housing, managing
the social housing register, supporting community housing providers and subsidising
rents through the Income-Related Rent Subsidy and Accommodation Supplement to
providing people with the assistance they need to move on to and remain in private
accommodation.
This year’s update of the Social Housing Purchasing Strategy (formerly known as the
Social Housing Purchasing Intentions) gives providers clear information about the social
housing places MSD is seeking to subsidise, how and at what price. This includes sharing
information about demand for housing both now and in the next few years and
specifying where MSD will be seeking to increase the supply of social housing.
The total number of tenancies that can be afforded within the available funding is
dependent on policy settings and market conditions. The volume estimates provided
here reflect MSD’s current intentions, but the actual volumes purchased are likely to
vary, and the intentions set out here do not commit MSD to purchasing at these
volumes.
MSD needs flexibility to respond effectively to unexpected changes in demand, and to
meet local needs. MSD will be monitoring changes in the register closely and adapting its
purchasing to meet changing needs. The volumes set out for each region and location
are not targets, nor are they limits. It may not be necessary to purchase up to these
volumes, or conversely there may be a need to exceed the places recommended, as a
result of unexpected demand increases.
The Purchasing Strategy is in three parts:
Part 1 – provides information on MSD’s Purchasing Strategy and market-shaping
principles – see page 6.
Part 2 – outlines the current funding and contracting settings – see page 10.
Part 3 – sets out MSD’s purchasing intentions – what the future looks like and
what MSD is seeking to purchase and where – see page 33.
How to use this document
Key information for providers is in blue shaded boxes. Plain text provides background or
contextual information.
Key information for social housing providers
has been included in blue shaded boxes.
Social Housing Purchasing Strategy – 2016 update Page 5
Part 1: Future direction for the social housing market
and the Government’s objectives
A social investment approach for social housing and
supports
The Government is focused on making sure that those who need help with housing get
the support they need – that the right person is in the right place, for the right time and
at the right cost.
Taking a social investment approach to housing means:
using data and information to understand the characteristics of the people MSD is
seeking to support
understanding what services they are currently accessing
measuring the effectiveness of these services
sharing what is learned so that future investment is based on evidence of what
works and for whom.
Stable housing provides a strong platform from which people can move towards
independence and achieve other goals, such as further education and employment.
Before 2014 people had to go to Housing New Zealand for housing and to MSD for other
supports. Now that MSD manages the social housing register and subsidises social
housing – through the Income-Related Rent Subsidy (IRRS) and contracts with providers
– people can come to MSD for both.
MSD has moved away from a one-size-fits-all approach to housing. The focus is now on
an integrated support system where supports are well targeted, so that people can
access what they need, and are supported to independence.
MSD is continuing to trial new ways of working which will enable it to gain a greater
understanding about what approaches are most effective in supporting people.
As part of implementing the social investment approach, MSD is testing innovative ways
of working with both providers of social housing and people who are accessing housing
and broader supports from MSD. For example, MSD is:
testing a Sustaining Tenancies approach to gain a greater understanding about
the supports people in social housing who are at risk of losing their tenancies
require to sustain their tenancies
piloting a Housing First approach in Central, West and South Auckland, which is
focused on supporting people who are homeless into sustainable long-term
housing while seeking to address any of the other issues they may be facing.
What MSD learns from these pilots will enable it to make future investment decisions
based on real evidence of what works.
To increase its understanding about current tenants, and share what is learned, MSD is
working on its first social housing valuation. The valuation will provide data to support
future investment decisions.
Social Housing Purchasing Strategy – 2016 update Page 6A key part of taking a social investment approach is for MSD to understand and evaluate
its own performance and that of providers. Key outcomes MSD will be looking to
measure the performance of the system against include:
There is a sustainable supply of good quality housing and tenancy management that
meets the long-term needs of social housing tenants.
Housing and other social needs of tenants are addressed, leading to healthier and
more stable families and communities.
Social housing tenants are supported to independence, when appropriate.
Working towards these outcomes will also support the achievement of a range of other
outcomes Government is seeking, such as the Better Public Services Result 1 – reducing
long-term welfare dependency.
The Government’s comprehensive plan for the housing
system – an integrated system of supports and a diverse
market
The Government continues to focus on achieving the objectives of the Social Housing
Reform Programme, which have been defined as one or more of the following:1
a. people who need housing support can access it and receive social services that meet
their needs:
b. social housing is of the right size and configuration, and in the right areas, for
households that need it:
c. social housing tenants are helped to independence, as appropriate:
d. there is more diverse ownership or provision of social housing:
e. there is more innovation and more responsiveness to social housing tenants and
communities:
f. the supply of affordable housing is increased, especially in Auckland.
Housing provides a platform from which to address other issues that people may be
experiencing. MSD’s role as the purchaser of social housing places and provider of a
range of other supports enables a more holistic approach to be taken to meet people’s
needs.
An increasing proportion of social housing places will be provided by
community housing providers
To help ensure sustainability in the market, MSD is seeking to grow the proportion of
social housing places that are provided by community housing providers (CHPs), both at
scale and niche. At a high level, MSD would expect to see approximately equal
proportions of additional IRRS places being provided by CHPs and Housing New Zealand
(HNZ).
MSD is also looking to continue to support new and existing providers into the market
who have expertise in successfully supporting particular cohorts of tenants with a broad
1
Housing Corporation Act 1974, s50D. Retrieved from
http://www.legislation.govt.nz/act/public/1974/0019/latest/DLM6754535.html
Social Housing Purchasing Strategy – 2016 update Page 7spectrum of needs. MSD has a focus on metropolitan areas and areas it has identified as
having the greatest need for additional social housing places.
Increasing diversity in the market means more innovative and responsive services can
be provided to tenants and will enable MSD to learn more about what works for whom.
Providers know their tenants’ needs best and many are already supporting their tenants
to access other services in the community.
HNZ is increasing provision of places in the short to medium term, with a focus on areas
of high demand.
A key part of this work is for MSD to set clear expectations for social housing tenants,
including the expectation that tenants will make the same trade-offs and decisions that
people in the private housing market have to make. For example, in 2015 a policy
change was implemented to require applicants to nominate three different areas where
they could live, instead of just one, and requiring people who decline a vacant social
house to have a ‘good and sufficient’ reason for doing so.
MSD expects housing providers to use this Purchasing Strategy to assist with their
investment decisions. It provides the information needed to support decisions about
where to invest, the characteristics of tenants and people on the social housing register,
and how MSD will be seeking to work with social housing providers.
A significant amount has been achieved, and MSD
continues to work towards achieving the goals outlined
in the 2015 release
Since the release of the 2015 Purchasing Intentions, a range of work has been
progressed towards achieving the objectives of the Social Housing Reform Programme.
This includes:
completing over 3,000 tenancy reviews, which has resulted in over 700 people
moving into alternative accommodation and more than 100 people purchasing
their own homes
developing the first social housing valuation, which will provide data and
information to support evidence-based decision-making, such as on what is
needed to improve matching and to gain a better understanding of tenants and
their needs
aiming to deliver more than 2,000 emergency housing places at any one time by
April 2017, and creating a new Emergency Housing Special Needs Grant to
support people with an urgent unmet housing need for up to seven days at a time
reviewing the way we assess for social housing to more accurately reflect tenants’
needs
making new Housing Support Products available, to support people towards
independence
having new housing places in the pipeline, both in Auckland and across New
Zealand, to meet social housing need
Social Housing Purchasing Strategy – 2016 update Page 8 transitioning HNZ properties to CHPs to diversify the market (including opening
up the IRRS) to support better outcomes for tenants
implementing more flexible contracting arrangements to support a broader range
of providers to enter the market and increase the number of social housing places
that are available .
What has changed between the 2015 release and the
2016 release?
After the 2015 release MSD asked providers whether the information was useful and
would support investment decisions. As a result, this year MSD has changed what is
included in the document and how it is presented. The document will continue to evolve
in future iterations.
There are two main changes between this update and the 2015 update. This update
includes:
greater clarity on the supply pipeline – see page 14 for an overview of the
number of places in the pipeline, and appendices 7 and 8 for details of places in
the CHP and HNZ pipelines
more detailed information on the funding and contracting parameters – see part 2
from page 16 onwards for details of subsidies available, weekly market rent
limits, contract settings, and information on how to get involved.
Social Housing Purchasing Strategy – 2016 update Page 9Part 2: Informing providers, developers, investors and
financiers of social housing
Part 2 provides an overview of the operational policy settings for providers of social
housing. It will cover the following questions:
What is the profile of people on the social housing register?
How many social housing places are in the pipeline?
What are the funding and contracting parameters?
How do providers get involved?
What is the profile of people on the social housing
register?
This section provides an overview of people on the social housing register at a
national level.
Regional profiles covering indicators of demand and supply at a local level are
available on the MSD website.
Figure 1: Number of people on the Housing Register and Transfer
Register - trend
4,630
4,602
5,000
4,189
3,877
3,658
3,562
3,549
4,000
3,476
There were
3,399
3,352
5,770 people
on the
combined 3,000
Housing
Register and
Transfer
2,000
Register, as at
1,410
1,306
1,246
1,210
1,189
1,168
1,143
1,135
the end of
1,068
1,036
September
2016 1,000
0
Sep-14
Dec-14
Sep-15
Dec-15
Sep-16
Jun-14
Mar-15
Jun-15
Mar-16
Jun-16
Housing register Transfer register
Social Housing Purchasing Strategy – 2016 update Page 10Figure 2: Number of people on the register by priority level - trend
7,000
Priority B
Priority A
6,000
Just over 6 in
5,000
every 10 2,107
people on the 4,000
register are
3,000
classified as
priority A 2,000
3,663
1,000
0
Sep-14
Dec-14
Sep-15
Dec-15
Sep-16
Jun-14
Mar-15
Jun-15
Mar-16
Jun-16
Figure 3: Size of house required by people on the register - trend
3,000
2,457 Sep-15
2,500 Dec-15
1,919 Mar-16
2,000
Just over 4 in Jun-16
every 10 1,500 Sep-16
844
people on the 1,000
427
register 500 123
require a 1- 0
bedroom
1 bedroom
2 bedrooms
3 bedrooms
4 bedrooms
5 or more bedrooms
property
Figure 4: Household type of people on the register - trend
3,000
2,481 Sep-15
2,500 Dec-15
2,015
Mar-16
2,000
Jun-16
1,500 Sep-16
Almost half of
1,000 672
the households
431
on the register 500 169
2
has one or 0
2+ adults with
2+ adults
Single with child(ren)
Unknown
Single aged 24 years
Single aged 25 years
more children
child(ren)
or younger
+
Social Housing Purchasing Strategy – 2016 update Page 11years
Māori
Auckland
register is
people are
aged 25-39
in every ten
in every ten
one in three
people on the
people on the
Just over four
Just over four
register are in
Approximately
1,000
1,500
2,000
2,500
3,000
1,000
1,500
2,000
2,500
3,000
1,000
1,500
2,000
2,500
0
0
0
500
500
500
Auckland Super City 2,417
Christchurch City 597
NZ European 24 and under
Wellington City 259
664
Hamilton City 207
September 2016
1,408
Tauranga District 201
Lower Hutt City 199 25–39
Napier City 156 Māori
Porirua City 154
2,022
Unknown/Other 153
Whangarei District 145 2,483 40–54
Palmerston North City 139
Social Housing Purchasing Strategy – 2016 update
Gisborne District 112 Pacific peoples
1,766
Rotorua District 88
805
Hastings District 86 55–64
Dunedin City 64
Figure 5: Age of main applicant - trend
792
Marlborough District 63 Other
Whakatane District 60
Figure 6: Ethnicity of main applicant - trend
Far North District 57 65 and over
1,004
Nelson City 56
525
New Plymouth District 48
Upper Hutt City 39 Unknown1
Wanganui District 33 Unknown
70
1
Horowhenua District 30
Kapiti Coast District 30
Western Bay Of Plenty… 27
Taupo District 24
Tasman District 23
Figure 7: TLAs with 20 or more people on the register, as at 30
Jun-16
Mar-16
Dec-15
Sep-16
Sep-15
Jun-16
Waikato District 23
Mar-16
Dec-15
Sep-16
Sep-15
Waimakariri District 23
Manawatu District 20
Page 12How many IRRS places are there currently, and how
many additional places would MSD like to purchase?
Current and planned IRRS places can be grouped into three categories:
The base - as at 30 September 2016, there were 61,404 IRRS places being funded.
This figure is the ‘base’ number of IRRS places.
The pipeline - in addition, there are 2,626 net IRRS places that are in the ‘pipeline’.
The ‘pipeline’ refers to the net number of additional places that MSD has contracted
for and/or the MSD Housing Contracts team has assessed as being highly likely to
eventuate. These places might be new builds, buy-ins, leases or transfers. The
pipeline is a realistic estimate of the number of IRRS places that have a high
certainty of eventuating, beyond the current base. 2 See appendices 7 and 8 for
details of the pipeline for IRRS places likely to be provided by CHPs and HNZ
respectively.
The purchasing intentions - the purchasing intentions outlined in part 3 of this
document show the location and size of an additional 3,800 IRRS places that MSD
would like to purchase – beyond the base, and beyond the pipeline.
The purpose of separating the pipeline from the purchasing intentions is to ensure that
all available funding is used to house people in need. If less certain places are counted in
the pipeline and don’t eventuate, MSD would be left with funding that could have been
used to house people in need. Given the current number of people on the social housing
register, it is vital that all available funding is used to house people in need.
Figure 8 shows the relationship between the base, the pipeline, and the purchasing
intentions for additional places.
Figure 8: Relationship between base IRRS places, IRRS pipeline, and purchasing
intentions (not to scale)
Purchasing intentions 3,800
Additional IRRS places that MSD would like to
IRRS
purchase over the next 4 years places 6,426
IRRS
places
Pipeline 2,626
IRRS places that have been contracted for and/or net IRRS
have a high certainty of eventuating places
Base 61,404
IRRS
Current number of IRRS places
places
2
In cases where a provider has historically delivered more slowly than planned, the historical proportion of
places that have been delivered to plan has been applied to the current contracted volume. MSD will continue
to track providers’ ability to perform to plan, and update the assumptions in future updates.
Social Housing Purchasing Strategy – 2016 update Page 13How many social housing places are in the pipeline?
Table 1 provides an estimate of the total number of IRRS places in the base, the
pipeline, and MSD’s purchasing intentions through to 30 June 2020.
Table 1: Overview of base IRRS places, pipeline, and MSD’s purchasing intentions
through to 30 June 2020
Auckland Rest of NZ
TOTAL
HNZ CHPs HNZ CHPs
Base (as at 30 Sept 2016) 25,795 2,796 32,453 360 61,404
Pipeline 852 857 (1,437) 2,354 2,626
Purchasing intentions 1,900 1,900 3,800
Total additional places
3,609 2,817 6,426
by June 2020
Percentage of total
56% 44% 100%
additional places
Figure 9 below provides further detail of the pipeline. It shows the pipeline for places
provided by HNZ and by CHPs, split out by whether the places are in Auckland or the
rest of New Zealand. The simultaneous increase in CHP places and decrease in HNZ
places in the rest of New Zealand in June 2017 shows the expected transfer of HNZ
properties in Tauranga to a CHP.
Figure 9: Net pipeline for IRRS places, by provider and location
3,000
2,500
2,000
1,500
1,000
500
-
(500)
(1,000)
(1,500)
(2,000)
Nov-18
Nov-16
Nov-17
Nov-19
Jul-17
Jul-18
Jul-19
Mar-17
Mar-18
Jan-19
Mar-19
Mar-20
Jan-17
Jan-18
Jan-20
May-17
Sep-17
May-18
Sep-18
May-19
Sep-19
May-20
CHPs Auckland CHPs Rest of NZ
HNZC Auckland HNZC Rest of NZ
Social Housing Purchasing Strategy – 2016 update Page 14Figure 10 shows the net pipeline for Auckland and the rest of New Zealand.
Figure 10: Net pipeline for IRRS places, Auckland and rest of New Zealand
1,800
1,600
1,400
1,200
1,000
800
600
400
200
-
(200)
Sep-17
Sep-18
Sep-19
Jan-17
Jan-18
Jan-19
Jan-20
Nov-16
Mar-17
May-17
Jul-17
Nov-17
Mar-18
May-18
Jul-18
Nov-18
Mar-19
May-19
Jul-19
Nov-19
Mar-20
May-20
Auckland Rest of NZ
Social Housing Purchasing Strategy – 2016 update Page 15What are the funding and contractual parameters?
What are the funding limits and arrangements?
Income-Related Rent Subsidy (IRRS)
Most social housing tenants pay no more than 25 percent of their net household income
on rent, up to the market rent for the property. The tenant’s contribution is referred to
as income-related rent (IRR). MSD purchases social housing tenancies by paying the
difference between market rent and the IRR through the Income-Related Rent Subsidy
(IRRS).
Weekly market rent limits
Market rent refers to the rent that a property would command in the private rental
market. Most social housing places are typically purchased near the lower
quartile of market rent for the location. Appendix 6 has additional information on
rent at Territorial Authority (TA) level, including lower quartile, geometric mean, and
upper quartile, as at October 2016. The information in Appendix 6 is based on bond data
and covers all tenancies, not just social housing tenancies. The Ministry of Business,
Innovation and Employment updates this data on its website on a monthly basis.3
MSD has set limits for the weekly market rent it will pay for a social housing place, by
location and number of bedrooms (see Table 2 below). While the majority of social
housing places will remain near the lower quartile of market rent, some new builds may
be closer to these limits. The shading in the table indicates the relative size of the
weekly limits; darker shading represents higher limits.
MSD recognises that these limits will make regular stand-alone social housing
uneconomic for some suburbs. This may mean that either MSD will not purchase social
housing places in those suburbs, or providers will need to develop innovative models to
make those suburbs economic.
Some existing social housing places are beyond the limits set out in Table 2. MSD plans
to remove those places from purchasing over time, and will be discussing these
situations with individual providers.
Market rent limits will be updated annually, following review of market conditions.
Table 2: Weekly market rent limits for social housing places
Number of bedrooms
Territorial Local Authority
1 2 3 4 5
(TLA)
Ashburton District $250 $300 $350 $400 $450
Auckland $450 $550 $650 $750 $850
Buller District $250 $300 $350 $400 $450
Carterton District $250 $300 $350 $400 $450
Central Hawke’s Bay District $250 $300 $350 $400 $450
3
http://www.mbie.govt.nz/info-services/housing-property/sector-information-and-statistics/rental-bond-data
Social Housing Purchasing Strategy – 2016 update Page 16Central Otago District $250 $300 $350 $400 $450 Chatham Islands Territory $250 $300 $350 $400 $450 Christchurch City $350 $450 $550 $650 $750 Clutha District $250 $300 $350 $400 $450 Dunedin City $275 $350 $425 $500 $575 Far North District $250 $300 $350 $400 $450 Gisborne District $250 $300 $350 $400 $450 Gore District $250 $300 $350 $400 $450 Grey District $250 $300 $350 $400 $450 Hamilton City $275 $350 $425 $500 $575 Hastings District $275 $350 $425 $500 $575 Hauraki District $250 $300 $350 $400 $450 Horowhenua District $250 $300 $350 $400 $450 Hurunui District $250 $300 $350 $400 $450 Invercargill City $250 $300 $350 $400 $450 Kaikoura District $250 $300 $350 $400 $450 Kaipara District $250 $300 $350 $400 $450 Kapiti Coast District $275 $350 $425 $500 $575 Kawerau District $250 $300 $350 $400 $450 Lower Hutt City $275 $350 $425 $500 $575 Mackenzie District $250 $300 $350 $400 $450 Manawatu District $250 $300 $350 $400 $450 Marlborough District $250 $300 $350 $400 $450 Masterton District $250 $300 $350 $400 $450 Matamata-Piako District $250 $300 $350 $400 $450 Napier City $275 $350 $425 $500 $575 Nelson City $275 $350 $425 $500 $575 New Plymouth District $275 $350 $425 $500 $575 Opotiki District $250 $300 $350 $400 $450 Otorohanga District $250 $300 $350 $400 $450 Palmerston North City $275 $350 $425 $500 $575 Porirua City $275 $350 $425 $500 $575 Queenstown Lakes District $400 $500 $600 $700 $800 Rangitikei District $250 $300 $350 $400 $450 Rotorua District $250 $300 $350 $400 $450 Ruapehu District $250 $300 $350 $400 $450 Social Housing Purchasing Strategy – 2016 update Page 17
Selwyn District                  $275      $350   $425   $500   $575
 South Taranaki District          $250      $300   $350   $400   $450
 South Waikato District           $250      $300   $350   $400   $450
 South Wairarapa District         $250      $300   $350   $400   $450
 Southland District               $250      $300   $350   $400   $450
 Stratford District               $250      $300   $350   $400   $450
 Tararua District                 $250      $300   $350   $400   $450
 Tasman District                  $275      $350   $425   $500   $575
 Taupo District                   $275      $350   $425   $500   $575
 Tauranga City                    $275      $350   $425   $500   $575
 Thames-Coromandel District       $250      $300   $350   $400   $450
 Timaru District                  $250      $300   $350   $400   $450
 Upper Hutt City                  $275      $350   $425   $500   $575
 Waikato District                 $275      $350   $425   $500   $575
 Waimakariri District             $275      $350   $425   $500   $575
 Waimate District                 $250      $300   $350   $400   $450
 Waipa District                   $250      $300   $350   $400   $450
 Wairoa District                  $250      $300   $350   $400   $450
 Waitaki District                 $250      $300   $350   $400   $450
 Waitomo District                 $250      $300   $350   $400   $450
 Wanganui District                $250      $300   $350   $400   $450
 Wellington City                  $350      $450   $550   $650   $750
 Western Bay of Plenty District   $250      $300   $350   $400   $450
 Westland District                $250      $300   $350   $400   $450
 Whakatane District               $250      $300   $350   $400   $450
 Whangarei District               $275      $350   $425   $500   $575

Social Housing Purchasing Strategy – 2016 update                        Page 18
What are the contracting arrangements for tenancy and
property services?
This section outlines the contracting arrangements for tenancy and property services.
Registered CHPs can contract with MSD under two possible mechanisms:
short-term spot contracts – short-term spot contracts cover the duration of a
specific tenancy. These contracts have set terms, but vary in duration. The majority
of current IRRS places are on short-term spot contracts
long-term capacity contracts – long-term capacity contracts cover a specific
house, unit or apartment for a set period of time. The terms of long-term contracts
are negotiated between MSD and the provider.
Short-term spot contracts for the duration of a specific
tenancy
Short-term spot contracts are available to any registered CHP.
Short-term spot contracts
MSD uses a standard Outcome Agreement to enter into short-term spot contracts
with social housing providers.
o http://housing.msd.govt.nz/documents/information-for-housing-
providers/providers/irrs-outcome-agreement-june-2015.docx
In addition, the Community Housing Provider Operational Guidelines outline
the business processes, administrative functions and the way in which CHPs and MSD
will work together. This document forms part of the Outcome Agreement.
o http://housing.msd.govt.nz/information-for-housing-providers/irrs-
tenancies/index.html#Guidelines1
MSD uses an online tool (Business Online Services) to manage the allocation of spot
contracts to CHPs. The Business Online Services User Guide provides detailed
information on the steps a CHP would take to secure a social housing tenant – how
CHPs can let MSD know when they have a vacancy, how they can view a shortlist of
possible tenants, how MSD can help if the client needs assistance to pay rent and
bond, and how to process a signed tenancy agreement.
o http://housing.msd.govt.nz/information-for-housing-providers/irrs-
tenancies/index.html#Userguides2
Frequently asked questions: http://housing.msd.govt.nz/information-for-housing-
providers/providers/community-housing-providers-faqs.html
Social Housing Purchasing Strategy – 2016 update Page 19Long-term capacity contracts for a specific house, unit or
apartment
Changes to the Housing Restructuring and Tenancy Matters Act 1992 have enabled MSD
to enter into flexible purchasing arrangements with social housing providers. This change
was made as a result of feedback from providers that IRRS spot contracts were not
sufficient to supply new social housing, particularly in Auckland.
MSD is willing to offer new contract terms where it:
is sufficiently certain about social housing need to be confident that MSD faces low
vacancy and demand risk based on:
− a good understanding of tenant types
− the likelihood that the tenants will have a permanent social housing need
− the level of tenant turnover
considers the price in a long-term contract represents good value considering the
likelihood of achieving supply with a spot contract and the price for a spot contract
on the same property.
Long-term capacity contracts
The parameters for long-term contracts are:
Long-term contracts will be a maximum of 25 years in length.
Contracts with providers will set an expectation that tenants are supported to
independence, where appropriate.
MSD will seek to develop and test contracts over the next 12 months in some of the
following areas for new builds and turn-key properties:
Area Negotiating parameters For further
information
Auckland EITHER: See next section
Upfront funding of up to 50 percent of market for further details
value, OR
An operating supplement of up to 50 percent of
market rent, OR
A combination of upfront funding and operating
subsidy
Whangarei EITHER: RFP is available
Hamilton Upfront funding of up to 35 percent of market on the GETS
Wellington value, OR website –
Lower Hutt City An operating supplement of up to 35 percent of responses close
Christchurch market rent. 31 March 20174
These parameters are based on a broad assessment of different regional markets and
will help to identify the expected benefits (eg boosting social housing supply) and risks
(eg paying for vacant properties) of entering into new contracts and will help to
distinguish between proposals that should or should not be considered. The MSD
Contracts team will evaluate each proposal and negotiate on a case-by-case basis the
specific terms and conditions of the contract with the provider.
For more information: RFP will be released on https://www.gets.govt.nz
4
https://www.gets.govt.nz/MSD/ExternalTenderDetails.htm?id=18199139
Social Housing Purchasing Strategy – 2016 update Page 20Upfront and operating subsidies for long-term
contracts in Auckland
MSD is currently able to negotiate flexible contract terms with
CHPs to provide additional social housing places in Auckland
that are either new builds or turn-key properties.
CHPs can select from one of three possible options:
Option 1: Upfront funding, OR
Option 2: Operating supplement, OR
Option 3: Combination of upfront funding and an operating supplement.
This section will provide an overview of each of the three options.
Market value limits
Under all three options, market value limits apply, as outlined in Table 3 below.
Table 3: Market value limits for upfront and operating subsidies for long-term contracts
in Auckland
One Two Three Four Five
bedroom bedrooms bedrooms bedrooms bedrooms
Market value limit $450,000 $580,000 $615,000 $650,000 $900,000
Option 1: Upfront funding
MSD is able to negotiate upfront funding of up to 50 percent of the total market
value of new build/turn-key social housing which provides additional social housing
places in Auckland. This option is not available for HNZ.
Table 4 provides examples of the level of upfront funding available for houses at the
market limit value for each size house.
Table 4: Market value limits for which upfront funding can be negotiated
One Two Three Four Five
bedroom bedrooms bedrooms bedrooms bedrooms
Market value limit $450,000 $580,000 $615,000 $650,000 $900,000
50 percent of market
value limit (maximum
$225,000 $290,000 $307,500 $325,000 $450,000
upfront funding
available)
Social Housing Purchasing Strategy – 2016 update Page 21Option 2: Operating supplement
MSD is able to negotiate operating supplements of up to 50 percent of market rent
(in addition to IRRS) for new build/turn-key properties, or properties leased from the
private rental market, which provide additional social housing places in Auckland. The
maximum operating supplement available is subject to weekly market rent limits (Table
2).
Table 5 provides examples of different social housing cash flows available through this
option.
Table 5: Examples of cash flow available through the maximum operating supplement
parameter
Examples Weekly IRR IRRS Maximum Total
market operating weekly
rent supplement cash flow
A two-bedroom social
housing tenancy in
$440 $75* $365* $220 $660
Auckland with a weekly
market rent of $440
A two-bedroom social
housing tenancy in
$550 $75* $475* $275 $825
Auckland with a weekly
market rent of $550
* The part of the rent paid by the tenant is called income-related rent (IRR). This
amount will vary depending on the tenant’s household income and the market rent level.
The remainder of the rent paid by MSD is called the Income-Related Rent Subsidy
(IRRS). IRR and IRRS will vary depending on the tenant’s household income and the
market rent for the social housing tenancy.
Option 3: Combination of upfront funding and an operating supplement
MSD is able to negotiate combinations of upfront funding and operating supplements for
new build/turn-key social housing properties in Auckland, as outlined in Table 6 below.
Note that weekly market rent limits (Table 2) and market value limits (Table 3) apply.
Table 6: Combinations of upfront funding and operating supplements MSD is able to
negotiate up to
Upfront funding and… … an operating supplement
Up to 50 percent of market value… … nil
Up to 45 percent of market value… … up to 5 percent of market rent
Up to 40 percent of market value… … up to 10 percent of market rent
Up to 35 percent of market value… … up to 15 percent of market rent
Up to 30 percent of market value… … up to 20 percent of market rent
Up to 25 percent of market value… … up to 25 percent of market rent
Social Housing Purchasing Strategy – 2016 update Page 22Up to 20 percent of market value… … up to 30 percent of market rent
Up to 15 percent of market value… … up to 35 percent of market rent
Up to 10 percent of market value… … up to 40 percent of market rent
Up to 5 percent of market value… … up to 45 percent of market rent
Nil… … up to 50 percent of market rent
Table 7 provides examples of the amount of additional funding available through
different combinations of upfront funding and operating supplements for new build/turn-
key properties which provide additional social housing places in Auckland.
Table 7: Examples of cash flows available under combination of upfront funding and
operating subsidies
Examples Upfront IRR + Weekly Total
funding IRRS operating weekly
supplement cash flow
A two-bedroom new build
social housing property in
Auckland with a market value
30% of $530 +
of $520,000, a weekly market 20% of $530
$520,000 $530 $106
rent of $530, upfront funding =$106
= $156,000 = $636
of 30 percent of market value
and an operating supplement
of 20 percent of market rent
A two-bedroom new build
social housing property in
Auckland with a market value
30% of
of $580,000, a weekly market 20% of $550
$580,000 $550 $660
rent of $550, upfront funding = $110
= $174,000
of 30 percent of market value
and an operating supplement
of 20 percent of market rent
A two-bedroom new build
social housing property in
Auckland with a market value
of $520,000, a weekly market 15% of $530 +
35% of $530
rent of $530, upfront funding $520,000 $530 $185.50
= $185.50
of 15 percent of market value = $78,000 $715.50
and an operating supplement
of 35 percent of weekly market
rent
A two-bedroom new build
social housing property in
Auckland with a market value
15% of $550 +
of $580,000, a weekly market 35% of $550
$580,000 = $550 $192.50 =
rent of $550, upfront funding = $192.50
$87,000 $742.50
of 15 percent of market value
and an operating supplement
of 35 percent of market rent
Social Housing Purchasing Strategy – 2016 update Page 23How do providers of social housing get involved?
This section provides a high-level outline of the process for an organisation to become
registered as a community housing provider (CHP), contract with MSD, match
applications to properties, make offers, start tenancies, and end tenancies. For each
stage of the process, links are provided to more detailed information.
Step 1: Talk with organisations involved in the social housing sector
As an initial step, it might be useful to talk with some of the key organisations involved
in the sector.
Community Housing Regulatory Authority (CHRA) – CHRA registers and regulates
community housing providers. Website: http://chra.mbie.govt.nz/
Community Housing Aotearoa (CHA) – CHA is a national organisation for community
housing providers. Website: http://communityhousing.org.nz/about-us
CHPs in your local area - if your organisation is not currently registered as a CHP,
you may wish to consider whether you want to become registered as a CHP, or
partner with an existing CHP in your area. Registration is not always appropriate for
an organisation. There may be benefit in partnering with a CHP that is already
registered and has experience in social housing and tenancy management. Appendix
4 has a list of registered CHPs as at 24 November 2016. Please refer to the CHRA
website for the most up-to-date list of registered CHPs, including their contact
details.5 CHRA is planning to release a Guidance Note on sub-contracting in early
2017.
Ministry of Social Development (MSD) – MSD contracts with CHPs to provide IRRS
places. Email: Social_Housing@msd.govt.nz. Website:
http://www.housing.msd.govt.nz/information-for-housing-providers/index.html
Step 2: Become a registered community housing provider
To become a provider of social housing receiving the Income-Related Rent Subsidy,
potential providers need to be registered with the CHRA.
Organisations will need to meet the eligibility criteria and demonstrate capacity to meet
the prescribed Performance Standards. If your organisation wishes to seek registration,
they should first meet with CHRA to discuss your organisation’s circumstances and
suitability for registration, the expectations of registered CHPs, and the regulatory
requirements of being a registered CHP. CHRA has produced a Guidance Note on what it
takes to be a social landlord. It can be viewed at:
http://chra.mbie.govt.nz/assets/Uploads/Guidance-notes/guidance-note-class-i-social-
landlord-sept-16.pdf.
Under the Housing Restructuring and Tenancy Matters (Community Housing Provider)
Regulations 2014, local authorities and council-controlled organisations cannot register
as CHPs. However, a subsidiary of a local authority or council-controlled organisation
may apply to register as a CHP if it is operating at arm’s length. The subsidiary must be
5
Community Housing Regulatory Authority. (2016). Retrieved from http://chra.mbie.govt.nz/about-
chra/register/
Social Housing Purchasing Strategy – 2016 update Page 24genuinely operating independently from the parent. This should be evident from its
constitution, membership of its governing body, and its governance and financial
management structures. There is no restriction on other organisations from becoming
CHPs, provided they meet CHRA requirements. There is currently no requirement for
HNZ to be a registered CHP.
Website: http://chra.mbie.govt.nz/i-want-to-apply-for-registration/how-to-apply/
Email: CHRA@mbie.govt.nz
Phone: 04 896 5908
Step 3: Contract with MSD for provision of IRRS tenancies
Once registered, CHPs will be eligible to enter into a contract with MSD for IRRS
tenancies.
Part 3 of this document outlines the areas and typologies (number of bedrooms) for
houses that MSD anticipates being interested in purchasing over the next four years.
These are indicative intentions; actual purchasing may be either greater or less than
what is indicated in this document. Purchasing intentions will be updated each year, to
reflect changes in demand, supply, and funding availability.
For more information:
Operational guidelines: http://www.housing.msd.govt.nz/documents/forms/provider-
forms/operational-guidelines-chps.pdf
Guidelines and forms: http://www.housing.msd.govt.nz/information-for-housing-
providers/irrs-tenancies/index.html
IRRS Outcome Agreement:
http://www.housing.msd.govt.nz/documents/information-for-housing-
providers/providers/irrs-outcome-agreement-june-2015.docx
Frequently asked questions: http://www.housing.msd.govt.nz/information-for-
housing-providers/providers/community-housing-providers-faqs.html
Step 4: MSD assesses potential tenants’ needs
MSD assesses each person’s, or household’s, eligibility for social housing based on their
needs. When we assess their needs we look at:
their ability to afford alternative private housing
the standard of their current housing
the extent to which the applicant’s current housing meets their needs (including
overcrowding)
particular factors such as accessibility or discrimination that may prevent them from
finding housing
their ability to afford private housing in the long term.
Depending on their needs and options, households may be put on the social
Social Housing Purchasing Strategy – 2016 update Page 25housing register and referred to a social housing provider.
MSD has recently reviewed and updated the needs assessment model for social housing
to ensure that it is fit for purpose and well integrated with other MSD supports. The
eligibility criteria used to assess social housing need can be found on the links given
below.
For more information:
Application process: http://www.housing.msd.govt.nz/housing-options/social-
housing/application-process.html
Social housing register: http://housing.msd.govt.nz/information-for-housing-
providers/register/index.html
Social Allocation System (SAS) criteria:
http://www.workandincome.govt.nz/map/legislation/ministerial-directions/eligibility-
for-social-housing-direction/index.html
Step 5: CHPs match applications to properties
Providers are responsible for matching applicants to properties, based on their
needs. People and households with the greatest needs are placed first.
Step 6: Make offers, start tenancies, end tenancies
The Social Housing Provider Operational Guidelines explain the processes involved in
day-to-day tenancy management – such as making offers to potential tenants, starting
tenancies and ending tenancies.
Social Housing Provider Operational Guidelines:
http://www.housing.msd.govt.nz/information-for-housing-providers/irrs-
tenancies/index.html
Social Housing Purchasing Strategy – 2016 update Page 26How do I get a contract to provide social housing?
There are currently several ways providers can get involved, depending on the type of
contract and where they wish to provide social housing.
Opportunities available in all regions
There are two opportunities that are available to providers in
all regions:
short-term spot contracts – short-term spot contracts
will be offered to CHPs in areas as outlined in part 3 of this
document.
transfer of HNZ properties and tenancies to CHPs –
CHPs interested in buying existing HNZ properties and
tenancies should respond via the request for information
(RFI) process outlined below. CHPs are encouraged to
register their interest in transfers that meet their organisation’s needs and risk
profile. For example, this might relate to either small- or large-scale transfers,
focusing on a particular geographical location, or working with tenants with specific
characteristics or needs.
Nationwide: Transfer of HNZ properties and tenancies to CHPs
In September 2015 the Treasury released an RFI to identify opportunities in relation to
the transfer of existing HNZ properties and tenancies for ongoing social housing
purposes.
The RFI will inform decisions about future transfers, should the Government decide to
proceed. This RFI is not about the recent transfer processes in Tauranga.
The RFI is not a procurement process. It is intended to provide the opportunity for
potential market participants to engage with the Government and a platform for ongoing
engagement. It is envisaged that the RFI will be updated periodically as the
Government’s views on, and interest in, different types of potential opportunities
emerge.
For more information:
http://www.treasury.govt.nz/statesector/socialhousing/rfi
Social Housing Purchasing Strategy – 2016 update Page 27Opportunities in areas of high demand
In addition to the two opportunities described in all regions, there
are other opportunities for CHPs to get involved in areas of high
demand.
building, buying or leasing properties to be used for
social housing – in high-demand areas
purchase of additional social housing places – in Auckland
development of vacant or underutilised Crown land – in Auckland
long-term capacity contracts – in Whangarei, Auckland, Hamilton, Wellington,
Lower Hutt and Christchurch; see page 20 for further details.
High-demand areas: Building, buying or leasing properties for social housing
In September 2015 the Treasury released an RFI to identify opportunities in relation to
the development of land or buildings it owns, or intends to acquire, for new
social housing or a mix of social and affordable housing in high-demand areas.
The RFI is not a procurement process. It is intended to provide the opportunity for
potential market participants to engage with the Government and a platform for ongoing
engagement. It is envisaged that the RFI will be updated periodically as the
Government’s views on, and interest in, different types of potential opportunities
emerge.
For more information:
http://www.treasury.govt.nz/statesector/socialhousing/rfi
Auckland: Purchase of additional IRRS places
In November 2015 MSD released a request for proposals (RFP) to engage providers to
deliver additional IRRS places in Auckland.
The aim of the RFP is to provide additional social housing places in the high-demand
Auckland market for prospective tenants from the social housing register, over and
above the current availability of social housing places.
The RFP seeks to contract for IRRS places under different, more tailored, contractual
arrangements from those used for existing IRRS contracts, to help promote the supply of
social housing places in Auckland.
For more information:
https://www.gets.govt.nz/MSD/ExternalTenderDetails.htm?id=17027338
Auckland: Using vacant or underutilised Crown-owned land to provide IRRS
places
In March 2016 MSD released an invitation to partner (ITP) to establish a panel of CHPs
to deliver additional IRRS housing services in Auckland.
The ITP is solely for situations where:
Social Housing Purchasing Strategy – 2016 update Page 28 properties become available for the provision of social housing from the
development of vacant and underutilised Crown-owned land, or
other third-party property development opportunities are identified by
government agencies.
This is an opportunity for CHPs to partner with MSD to help people with high housing
needs to access affordable, well-maintained housing in the high-demand Auckland
market.
It is possible to use funding from the RFP above to provide places in the ITP.
For more information:
https://www.gets.govt.nz/MSD/ExternalTenderDetails.htm?id=17336104
Are there opportunities for providers to purchase
Housing New Zealand properties?
As outlined in part 1, the Social Housing Reform Programme includes the transfer of
some Housing New Zealand properties and tenancies to registered CHPs. The purpose of
the transfers is to help grow the community housing sector and encourage innovation to
better meet tenants’ needs. This process is referred to as ‘social housing transfers’, as
ownership of the properties is transferred to the CHP.
Where HNZ properties and tenancies are transferred to a new landlord, the tenancy
agreements will not change. Tenants will:
continue to be housed for the duration of their need
have their eligibility assessed by the Ministry of Social Development, as it is now
have the same rights as they do now, and CHPs taking on transferred properties will
have the same responsibilities as HNZ has now.
Any properties transferred to a new provider are required to remain in use as social
housing and cannot be sold unless the Government agrees to this. The Government
would give that approval only if the house is no longer needed, or it is to be redeveloped
to better match social housing needs.
CHPs are regulated and monitored by the Community Housing Regulatory Authority.
For further information: http://chra.mbie.govt.nz/
Transfers of Housing New Zealand stock
There are currently two processes under way to transfer Housing New Zealand
properties and tenancies to CHPs:
Christchurch – the Government is proposing to transfer up to 2,500 social houses in
Christchurch to community housing providers. The proposal is for a single transfer
transfer of between 2,000 and 2,500 HNZ properties, mainly in Bryndwyr, Riccarton
and Shirley, while HNZ would continue to own and manage up to 3,900 properties in
other areas of the city. The Government expects that any successful bidder will enter
a 25-year contract with the Ministry of Social Development to provide housing places.
Social Housing Purchasing Strategy – 2016 update Page 29You can also read