Why Are Americans Consuming Less Fluid Milk? A Look at Generational Differences in Intake Frequency - Hayden Stewart Diansheng Dong Andrea Carlson
←
→
Page content transcription
If your browser does not render page correctly, please read the page content below

United States Department of Agriculture

Economic
Research            Why Are Americans Consuming Less
Service

Economic
                    Fluid Milk? A Look at Generational
Research
Report              Differences in Intake Frequency
Number 149

May 2013            Hayden Stewart
                    Diansheng Dong
                    Andrea Carlson
United States Department of Agriculture

 Economic Research Service
 www.ers.usda.gov
 Follow us on twitter at http://twitter.com/USDA_ERS

 Access this report online:
 www.ers.usda.gov/publications/err-economic-research-report/err149.aspx

 Download the charts contained in this report:
  • Go to the report’s index page www.ers.usda.gov/publications/
 		err-economic-research-report/err149.aspx
    • Click on the bulleted item “Download ERR149.zip”
    • Open the chart you want, then save it to your computer

 Recommended citation format for this publication:
 Stewart, Hayden, Diansheng Dong, and Andrea Carlson. Why Are Americans
 Consuming Less Fluid Milk? A Look at Generational Differences in Intake
 Frequency, ERR-149, U.S. Department of Agriculture, Economic Research
 Service, May 2013.

 Cover photo credit: Shutterstock.

 The U.S. Department of Agriculture (USDA) prohibits discrimination in all its programs and
 activities on the basis of race, color, national origin, age, disability, and, where applicable, sex,
 marital status, familial status, parental status, religion, sexual orientation, genetic information,
 political beliefs, reprisal, or because all or a part of an individual’s income is derived from any
 public assistance program. (Not all prohibited bases apply to all programs.) Persons with
 disabilities who require alternative means for communication of program information (Braille,
 large print, audiotape, etc.) should contact USDA’s TARGET Center at (202) 720-2600 (voice
 and TDD).

 To file a complaint of discrimination write to USDA, Director, Office of Civil Rights, 1400
 Independence Avenue, S.W., Washington, D.C. 20250-9410 or call (800) 795-3272 (voice) or
 (202) 720-6382 (TDD). USDA is an equal opportunity provider and employer.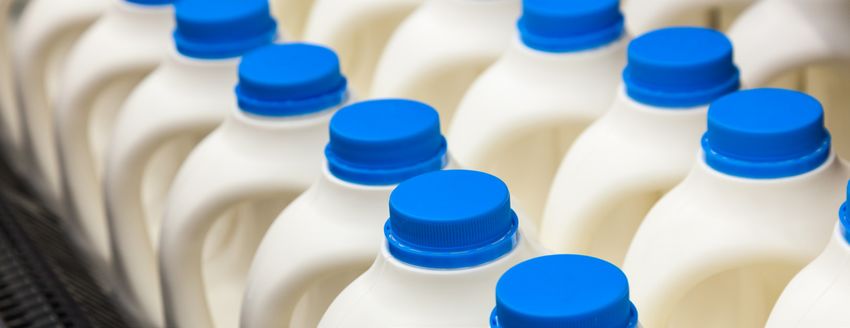
United States Department of Agriculture

Economic
Research     Why Are Americans Consuming Less
Service
             Fluid Milk? A Look at Generational
Economic     Differences in Intake Frequency
Research
Report
Number 149
             Hayden Stewart
May 2013     Diansheng Dong
             Andrea Carlson

             Abstract

             Americans are drinking less fluid milk, on average. In this study, ERS researchers find
             that declining consumption since the 1970s reflects changes in the frequency of fluid milk
             intake, rather than changes in portions. USDA survey data collected between 1977 and
             2008 reveal that Americans are less apt to drink fluid milk with their midday and night-
             time meals than in earlier years, reducing the total number of consumption occasions per
             day. Moreover, more recent generations of Americans show greater decreases in consump-
             tion frequency, holding constant other factors such as education and race. The majority of
             Americans born in the 1990s consume fluid milk less often than those born in the 1970s,
             who, in turn, consume it less often than those born in the 1950s. All other factors constant,
             as newer generations with reduced demand gradually replace older ones, the population’s
             average level of consumption of fluid milk may continue to decline.

             Keywords: fluid milk, fluid milk demand, fluid milk products, intake frequency,
             consumption frequency, generational change, cohort effects, portion sizes, milk drinking,
             dairy products, dairy checkoff, school lunches, consumer habits, childhood habits

             Acknowledgments

             The authors extend their thanks for comments from Dennis Clason, New Mexico State
             University; Joseph Balagtas, Purdue University; Hiroshi Mori, Senshu University; Mark
             Lino, USDA, Center for Nutrition Policy and Promotion; and Lisa Mancino, USDA,
             Economic Research Service. We also thank Maria Williams for editorial service and
             Cynthia A. Ray for design.
ii   Why Are Americans Consuming Less Fluid Milk? ERR-149                                                              Economic Research Service, USDA

            Contents

            Summary . . . . . . . . . . . . . . . . . . . . . . . . . . . . . . . . . . . . . . . . . . . . . . . . . . . . . . . . . . .  iii

            Introduction. . . . . . . . . . . . . . . . . . . . . . . . . . . . . . . . . . . . . . . . . . . . . . . . . . . . . . . . . . 1

            Identifying Trends in the Frequency and Quantity of Fluid Milk
            Consumption . . . . . . . . . . . . . . . . . . . . . . . . . . . . . . . . . . . . . . . . . . . . . . . . . . . . . . . . 3

            Modeling Trends in Fluid Milk Consumption Across the Generations . . . . . . . . 11
                  Variables Used in the Analysis. . . . . . . . . . . . . . . . . . . . . . . . . . . . . . . . . . . . . . . . 12

                  Model Specification . . . . . . . . . . . . . . . . . . . . . . . . . . . . . . . . . . . . . . . . . . . . . . . . 15

            Estimating the Model and Examining Results. . . . . . . . . . . . . . . . . . . . . . . . . . . . . 17
                  Generational Change Contributing to Decreases in Consumption
                  Frequency. . . . . . . . . . . . . . . . . . . . . . . . . . . . . . . . . . . . . . . . . . . . . . . . . . . . . . . . 17

                  Portions Remaining Largely Stable . . . . . . . . . . . . . . . . . . . . . . . . . . . . . . . . . . . . 21

            Considering the Health Implications of Trends in Milk Consumption. . . . . . . . . 22

            References . . . . . . . . . . . . . . . . . . . . . . . . . . . . . . . . . . . . . . . . . . . . . . . . . . . . . . . . . . 23

            Appendix I: Comparing Consumption Across Different USDA Dietary
            Intake Surveys. . . . . . . . . . . . . . . . . . . . . . . . . . . . . . . . . . . . . . . . . . . . . . . . . . . . . . . 26

            Appendix II: Model Specification and Estimation. . . . . . . . . . . . . . . . . . . . . . . . . . 28
United States Department of Agriculture
A report summary from the Economic Research Service May 2013
United States Department of Agriculture
Economic
Research Why Are Americans Consuming Less
Why Are Americans Consuming Less
Service
Economic
Fluid Milk? A Look at Generational
Research
Report Differences in Intake Frequency
Number 149
May 2013 Hayden Stewart
Diansheng Dong
Andrea Carlson
Fluid Milk? A Look at Generational
Differences in Intake Frequency
Hayden Stewart, Diansheng Dong, and Andrea Carlson
Find the full report
at www.ers.usda.
gov/publications/err-
economic-research-
What Is the Issue?
report/err-149.aspx
Most Americans do not consume enough dairy products. The Dietary Guidelines for Americans,
2010 recommends 2 cup-equivalents per day for children aged 2 to 3 years, 2.5 for those aged
4 to 8 years, and 3 for Americans older than age 8. However, per capita dairy consumption has
long held steady at about 1.5 cup-equivalents, despite rising cheese consumption. This stasis in
per capita dairy consumption results directly from the fact that Americans are drinking progres-
sively less fluid milk. Since 1970 alone, per capita fluid milk consumption has fallen from 0.96
cup-equivalents to about 0.61 cup-equivalents per day.
The Federal Government encourages dairy consumption, including fluid milk, cheese, and yogurt,
among other foods, through the Dietary Guidelines for Americans, 2010. Special emphasis is
placed on fat-free and low-fat products. USDA further supports this message through programs
like the National School Lunch Program (NSLP). The NSLP stipulates that schools must provide
fluid milk and it must be low-fat or skim, rather than whole. Dairy farmers and fluid milk proces-
sors are also working to promote dairy products. The popular “Got Milk?” campaign, for one,
encourages drinking fluid milk.
This report examines trends in Americans’ fluid milk consumption, including average portion
sizes and generational differences in the frequency of milk drinking, to investigate possible
explanations for the continued decreases.
What Did the Study Find?
Data from USDA dietary intake surveys conducted between the 1970s and 2000s show that
Americans—on occasions when they drink fluid milk—continue to consume about 1 cup (8
fluid ounces). Given the stability of portions, trends showing decreases in per capita consump-
tion since the 1970s mainly reflect changes in consumption frequency. Between the 1970s and
2000s, people have become less apt to drink fluid milk at mealtimes, especially with midday and
nighttime meals, reducing the total number of consumption occasions:
• Between surveys in 1977-78 and 2007-08, the share of preadolescent children who did not
ERS is a primary source drink fluid milk on a given day rose from 12 percent to 24 percent, while the share that drank
of economic research and milk three or more times per day dropped from 31 to 18 percent.
analysis from the U.S.
Department of Agriculture,
providing timely informa-
tion on economic and policy
issues related to agriculture,
food, the environment,and
rural America. www.ers.usda.gov• Between 1977-78 and 2007-08, the share of adolescents and adults who did not drink fluid milk on a given
day rose from 41 percent to 54 percent, while the share that drank milk three or more times per day dropped
from 13 to 4 percent.
Underlying these decreases in consumption frequency are differences in the habit to drink milk between newer
and older generations. All else constant (e.g., race and income), succeeding generations of Americans born
after the 1930s have consumed fluid milk less often than their preceding generations:
• Americans born in the early 1960s consume fluid milk on 1.1 fewer occasions per day than those born
before 1930.
• Americans born in the early 1980s consume fluid milk on 0.3 fewer occasions per day than those born in
the early 1960s.
Differences across the generations in fluid milk intake may help account for the observed decreases in per
capita fluid milk consumption in recent decades despite public and private sector efforts to stem the decline.
Furthermore, these differences will likely make it difficult to reverse current consumption trends. In fact,
as newer generations replace older ones, the population’s average level of fluid milk consumption may
continue to decline.
How Was the Study Conducted?
ERS researchers pooled data from five USDA dietary intake surveys for analysis. These included the 1977-78
Nationwide Food Consumption Survey, the 1989-1991 Continuing Survey of Food Intakes by Individuals
(CSFII), 1994-1996 CSFII, the 2003-04 National Health and Nutrition Examination Survey (NHANES),
and the 2007-08 NHANES. Respondents in each survey were asked to report their intake of all foods and
beverages on one or more days. This study focused on individuals’ fluid milk consumption during a single,
24-hour period.
Researchers reviewed the existing literature on fluid milk demand, compared consumption data across periods
in the different surveys, and then conducted a formal hypothesis test for whether newer generations are
consuming fluid milk fewer times per day, and whether changes in portion sizes are also affecting consumption
trends. This was accomplished by estimating an econometric model that predicts both the frequency and total
quantity of fluid milk consumed by Americans who participated in USDA food consumption surveys, based on
their birth year, race, household income, and demographic characteristics.
www.ers.usda.govEconomic Research Service, USDA Why Are Americans Consuming Less Fluid Milk? ERR-149 1
Introduction
Most Americans do not consume enough dairy products. The Dietary Guidelines
for Americans, 2010 recommends 2 cup-equivalents per day for children aged 2
to 3 years, 2.5 for those aged 4 to 8 years, and 3 for Americans older than age 8.
By contrast, actual dairy consumption has held steady between 1.45 and 1.55 cup-
equivalents per capita since the 1970s, despite a near tripling of cheese consumption
over the past 40 years (USDA-ERS, 2013a). The reason for this stasis in overall
dairy consumption is that Americans are drinking progressively less fluid milk.
Long a dietary staple, fluid milk once accounted for the majority of overall dairy
consumption. However, as chronicled by Popkin (2010, p. 1), there has been a
“slow continuous shift downward” in milk drinking since the 1940s. Since 1970
alone, per capita consumption has fallen from 0.96 to 0.61 cup-equivalents per
day (USDA-ERS, 2013a). Moreover, this trend appears to cut across different age
groups. Younger people aged 2 to 18 years consumed less fluid milk in the 2000s
than did children and adolescents in the 1970s (Cavadini et al., 2000; Popkin,
2010).1 Adults (over 18) have also been consuming less fluid milk over time (Enns
et al., 1977; Popkin, 2010).
The Federal Government encourages dairy consumption, including fluid milk,
cheese, and yogurt, among other products, through the Dietary Guidelines for
Americans, 2010.2 Special emphasis is placed on consuming more fat-free and
low-fat milk and milk products in particular. These foods provide many of the same
nutrients as higher fat dairy products with fewer calories (p. 38).
USDA further supports its dairy message through programs like the National School
Lunch Program (NSLP), the Special Supplemental Nutrition Program for Women,
Infants, and Children (WIC), and the Special Milk Program. The NSLP, for one,
requires participating schools to offer students low-fat or skim fluid milk—and no
whole milk. Only skim milk may be flavored (e.g., strawberry or chocolate).
Like the Federal Government, dairy farmers and fluid milk processors are concerned
about low levels of dairy consumption. Both invest in checkoff3 programs to
increase sales of and demand for dairy products and ingredients (National Dairy
Promotion and Research Board, 2013). Some efforts supported by checkoff
programs focus primarily on fluid milk, including the popular “Got Milk?”
campaign. Others like “Fuel Up to Play 60” emphasize all dairy products consump-
1Popkin (2010) examined the consumption of milks, sugar-sweetened beverages (SSB),
diet beverages, juices, alcoholic beverages, and unsweetened tea and coffee. SSBs include
carbonated and uncarbonated soft drinks, sugared waters, and energy drinks, among oth-
ers. He studied consumption trends for children and adolescents aged 2 to 18 years. Popkin
(2010) separately examined beverage consumption for adults aged 19 and older.
2The Dietary Guidelines for Americans, 2010 are issued by USDA and the U.S. Depart-
ment of Health and Human Services (DHHS) to provide evidence-based nutrition information
and advice for people age 2 and older. They also serve as the nutritional basis for Federal
food and nutrition assistance education programs.
3A checkoff program collects funds from producers of a particular agricultural commodity
and uses these funds to promote and conduct research on that commodity.2 Why Are Americans Consuming Less Fluid Milk? ERR-149 Economic Research Service, USDA
tion, including milk drinking. This particular initiative encourages children to be
physically active and “fuel up” with nutrient-rich foods like low-fat and skim milk,
cheese, and yogurt. Dairy farmers contribute $0.15 per 100 pounds of milk they
commercially market to checkoff programs, while fluid milk processors contribute
$0.20 per 100 pounds they sell in consumer-type packages. Yet, so far, the efforts
of dairy farmers, fluid milk processors, and the Federal Government have not
increased dairy consumption to recommended levels, while fluid milk consumption
continues to fall.
Previous research on declining fluid milk consumption—the main reason for
stationary dairy consumption levels—finds that generational differences (“cohort
effects”) are a contributing factor. Using dietary intake surveys collected by USDA
between the 1970s and the 2000s, Stewart et al. (2012) recently demonstrated that
more recent generations consume smaller quantities of fluid milk. For example,
on average, Americans born in the 1980s consume less fluid milk per day than
Americans born in the 1960s, holding constant other factors such as income and
race. These findings may reflect the persistence of childhood habits—each succes-
sive generation grows up less accustomed than their parents to drinking fluid milk
and carries that habit forward into adult life.
In this study, ERS researchers used USDA dietary intake surveys from the 1970s,
1980s, 1990s, and 2000s to identify the number of times per day that Americans
consume fluid milk, as well as to identify portion sizes. A possible explanation
for decreases in the quantity of fluid milk consumed over time is that Americans
are consuming it fewer times per day. However, Americans may also be using
fluid milk in different ways. For example, if Americans consume fluid milk more
often than they used to as a snack in a coffee drink and less often as a standalone
beverage at mealtimes, then average portion sizes could change. Given Stewart et
al.’s (2012) findings on generational change, the researchers also tested whether
newer generations are consuming fluid milk less frequently than older generations.Economic Research Service, USDA Why Are Americans Consuming Less Fluid Milk? ERR-149 3
Identifying Trends in the Frequency and Quantity of Fluid
Milk Consumption
To monitor trends in the American diet, ERS estimates the quantities of foods avail-
able for consumption annually (USDA-ERS, 2013b). ERS food availability data
suggest that Americans have been consuming less fluid milk since the 1940s. Data
on per capita consumption since the 1970s (USDA-ERS, 2013a)4 reveal a decrease
in average consumption from about 0.96 cups to about 0.61 cups of fluid milk
per day over the past 40 years (fig. 1). Increases in the consumption of 2-percent,
1-percent, and skim milk have partly offset decreases in whole milk consumption.5
These products are hereafter referred to as lower fat milk. Consumption of lower fat
milk products accounted for about 20 percent of total consumption in the 1970s and
about 70 percent by the end of the 2000s.
4These data are created by adjusting food availability data for food spoilage and other
forms of food loss to better proxy for consumption. Loss-adjusted food availability data are not
available prior to 1970.
5Whole milk has a minimum fat content of 3.25 percent. ERS researchers were not able
to separately identify consumption trends for 2 percent (reduced-fat), 1 percent (low-fat), and
skim milk. As noted in the text above, current dietary recommendations place special empha-
sis on low-fat and skim milk.4 Why Are Americans Consuming Less Fluid Milk? ERR-149 Economic Research Service, USDA
Trends in fluid milk consumption can also be examined using USDA dietary
surveys intermittently collected since the 1970s. Unlike ERS food availability data,
these surveys break down food consumption data by particular segments of the
population, such as children. Survey participants provided their household income,
age, educational attainment, race, and ethnicity, among other characteristics. They
also provided one or more 1-day “dietary recalls.” These recalls include information
on the foods and beverages consumed by the individual on the previous day.
The information provided shows how many times fluid milk was consumed, and
whether each consumption occasion was part of a meal or snack. It is also possible
to estimate the amounts of fluid milk consumed as a beverage, in cereal, or even as
an ingredient in a food, such as a soup.6 In this study, the researchers focused on
individuals’ fluid milk consumption over the 24-hour period covered by their initial
1-day dietary recall.
ERS limited the analysis to the consumption of plain and flavored fluid milk
consumed alone as a beverage, put in cereal, poured in coffee, or used as an ingre-
dient in selected coffee drinks.7 In 2007-08, these products accounted for 93 percent
of all fluid milk consumed by survey participants in all uses. Excluded from the
study were milk in eggnog, malted milk, milkshakes, weight loss shakes, soups,
and baked goods, among other foods. Also excluded from the results reported in
this study were soy beverages.8 USDA dietary records distinguish among whole,
2-percent, 1-percent, skim, and other types of fluid milk, though survey partici-
pants cannot always recall which type of milk they consumed. See also Appendix I:
Comparing Consumption Across Different USDA Dietary Intake Surveys.
ERS analysis of USDA food consumption surveys collected since the 1970s
confirms that fluid milk intake has declined for preadolescent children (aged 2 to
12 years), as well as for Americans beyond childhood (fig. 2). In 1977-78, preado-
lescent children drank, on average, 1.7 cups per day, while in 2007-08 children this
age drank only 1.2 cups per day (30 percent less). Similarly, in 1977-78, Americans
aged 13 and over drank, on average, 0.8 cups per day, while in 2007-08, people
this age drank only 0.6 cups (25 percent less). USDA dietary intake surveys also
confirm that milk drinkers in 2007-08 were more likely to choose a lower fat
product than milk drinkers in 1977-78 (fig. 3).
To better understand declining fluid milk consumption, ERS examined how often
Americans consume fluid milk at mealtimes (table 1). For example, in 1977-78,
39 percent of adolescents and adults drank milk with a morning meal; 24 percent
consumed it with a midday meal; and 21 percent had fluid milk with a nighttime
6Recipes developed for use with more recent food consumption surveys are available in
the USDA Food and Nutrient Database for Dietary Studies (FNDDS). See USDA, Agricultural
Research Service (2013a).
7Includes only coffee drinks that are 50 percent or more milk such as a latte (75 percent
milk), café con leche (51 percent), mocha (66 percent), cappuccino (51 percent), and sweet-
ened milk coffee with ice (58 percent).
8Americans consume only a small amount of soy beverages compared with their con-
sumption of cow’s milk. ERS researchers confirmed that including the former in the analysis
would not significantly affect the study’s results.Economic Research Service, USDA Why Are Americans Consuming Less Fluid Milk? ERR-149 5
meal.9 By 2007-08, those percentages had decreased to 28 percent, 8 percent, and 9
percent, respectively.
From the same two surveys, similar trends were seen in the consumption habits of
preadolescent children. In the later survey, young children consumed fluid milk
with fewer meals (especially, fewer midday and nighttime meals) than did the
young children of the earlier survey. However, unlike adolescents and adults, young
children have partly offset mealtime decreases in milk consumption with increases
while snacking.
In total, Americans consumed fluid milk less frequently in 2007-08 than they did in
1977-78 or 1994-96 (fig. 4). Over the 30 years between 1977-78 and 2007-08, the
share of individuals not consuming any fluid milk on a given day rose from 12 to 24
percent among preadolescent children, and from 41 to 54 percent among adolescents
and adults. Furthermore, the shares consuming fluid milk several times a day fell.
By 2007-08, only 45 percent of preadolescent children and 14 percent of adoles-
cents and adults consumed fluid milk on more than one occasion.
Besides consuming milk less often, Americans may be changing their fluid milk-
drinking habits in other ways, but so far, those changes have had little effect on
portion sizes. ERS researchers hypothesized that, if individuals are consuming fluid
milk more often in a coffee beverage than they used to and less often as a standalone
beverage at meals than they used to, average portion sizes may change.
9Midday meal is defined as a meal occasion occurring between 11 a.m. and 5 p.m.6 Why Are Americans Consuming Less Fluid Milk? ERR-149 Economic Research Service, USDA
Nonetheless, from the data available, ERS finds that, on the occasions when
Americans do consume fluid milk, they have continued to drink at least as much as
they did in the 1970s (fig. 5). Americans drank about 1 cup (8 fluid ounces) of fluid
milk per occasion in 2007-08, on average, versus 0.8 cups in 1977-78. That portions
appear not to have decreased, in turn, suggests that decreases in the frequency of
consumption, shown in table 1 and figure 4, primarily underlie the downward trend
in intake, shown in figures 1 and 2.Economic Research Service, USDA Why Are Americans Consuming Less Fluid Milk? ERR-149 7
Table 1
Americans less apt to consume fluid milk at mealtimes1
Percentage of preadolescent children consuming fluid milk
Morning meal Midday meal2 Night meal Snack
1977-78 NFCS 71.3 50.7 35.5 19.9
(0.6) (0.7) (0.7) (0.5)
1989-91 CSFII 68.0 41.8 29.4 18.2
(1.3) (1.4) (1.3) (1.1)
1994-96 CSFII 64.0 33.7 23.5 21.0
(0.9) (0.9) (0.8) (0.8)
2003-04 NHANES 57.4 26.7 22.1 26.4
(1.9) (1.7) (1.6) (1.7)
2007-08 NHANES 55.6 29.3 17.5 24.7
(1.7) (1.5) (1.3) (1.4)
Percentage of adolescents and adults consuming fluid milk
Morning meal Midday meal2 Night meal Snack
1977-78 NFCS 38.8 24.0 21.5 13.2
(0.4) (0.4) (0.3) (0.3)
1989-91 CSFII 38.1 14.9 14.1 11.3
(0.7) (0.5) (0.5) (0.4)
1994-96 CSFII 35.8 10.4 10.6 12.1
(0.6) (0.4) (0.3) (0.4)
2003-04 NHANES 28.9 7.4 9.3 14.4
(0.9) (0.5) (0.6) (0.7)
2007-08 NHANES 28.2 8.0 8.8 13.8
(0.8) (0.5) (0.6) (0.7)
1Standard errors reported in parentheses.
2Midday meal is defined as a meal occasion occurring between 11 a.m. and 5 p.m.
Notes: Decreases in the percentages of individuals consuming fluid milk with their morning, midday,
and nighttime meals between 1977-78 and 2007-08 are statistically significant at the 10-percent level
for both age groups.
Source: Calculated by the authors using the 1977-78 Nationwide Food Consumption Survey (NFCS),
the 1989-1991 Continuing Survey of Food Intakes by Individuals (CSFII), the 1994-1996 CSFII, the
2003-04 National Health and Nutrition Examination Survey (NHANES), and the 2007-08 NHANES and
accompanying sample weights.
Overall, the data show that Americans are consuming fluid milk less frequently and,
in turn, consuming smaller quantities, but what is driving these changes in behavior?
Kaiser and Dong (2006) and Kaiser (2010) confirm that promotions sponsored by
checkoff programs increase demand. Gleason and Suitor (2001) confirm a posi-
tive relationship between children’s participation in the NSLP and their fluid
milk consumption. However, cohort effects may be exerting a greater impact on
consumption in the opposite direction.
Cohort effects exist when people belonging to the same generation make more
similar food choices to each other than to people born farther from them in time.
Since Schrimper (1979) first raised the possibility that cohort effects exist and8 Why Are Americans Consuming Less Fluid Milk? ERR-149 Economic Research Service, USDA
Economic Research Service, USDA                            Why Are Americans Consuming Less Fluid Milk? ERR-149   9

               shape trends in food consumption, much empirical research has followed. Mori et
               al. (2006) and Mori and Saegusa (2010) find that cohort effects influence fresh fruit
               and fish consumption in Japan. Stewart and Blisard (2008) find that they influence
               expenditures on fresh vegetables for at-home consumption in the United States.

               As to cohort effects and fluid milk consumption, Stewart et al. (2012) find that more
               recent generations of Americans drink less fluid milk. For example, Americans born
               in the 1960s are consuming 0.13 cups less whole milk and 0.28 cups less lower fat
               milk per day than Americans born before 1930, holding constant other factors like
               race and income. Moreover, Americans born in the 1980s consume 0.16 cups less
               whole milk and 0.13 cups less lower fat milk per day than those born in the 1960s.

               Cohort effects could influence U.S. fluid milk consumption for several reasons.
               These reasons begin with the unique experiences of each generation of American
               children. Every decade brings a wider selection of beverage choices at supermar-
               kets, restaurants, and other food outlets. Soft drinks, isotonic sports drinks, bottled
               water, and other products increasingly compete with fluid milk for a share of the
               consumer’s appetite. Changes have also occurred over time in the popularity of fast
               food, among other phenomena.
10 Why Are Americans Consuming Less Fluid Milk? ERR-149 Economic Research Service, USDA
Changes in the food environment can affect children’s beverage consumption.
Fisher et al. (2001) and Bowman et al. (2004) suggest that children’s fluid milk
consumption may decrease with exposure to competing beverages and fast food,
respectively. Regardless of other reasons, as successive generations of Americans
have grown up amid declining rates of fluid milk consumption, they may have
developed different life-long habits. The habit to drink milk may form (or not form)
in childhood. According to the Dietary Guidelines for Americans, 2010, individuals
“who consume milk at an early age are more likely to do so as adults” (p. 38).Economic Research Service, USDA Why Are Americans Consuming Less Fluid Milk? ERR-149 11
Modeling Trends in Fluid Milk Consumption Across the
Generations
Investigating consumption differences over time and across generations requires
a particular type of data set. Many studies of U.S. food demand use time series
data. These data typically span several decades and include information on food
consumption or expenditures, price, and consumer income. However, time series
data also tend to be highly aggregated. They do not typically contain information
on individual consumers. By contrast, cross-sectional data contain information on
individual consumers and may, therefore, be suitable for investigating the effects
of demographic characteristics on demand. Nonetheless, because such data seldom
span more than a couple years, they are not ideal for studying longrun trends. In
Deaton’s (1997) terminology, researchers need a “time series of cross sections.”
That is, they must pool cross-sectional surveys collected over several decades.
Mori and Stewart (2011) empirically demonstrate the advantages of such data over
traditional time series data. In this study, ERS pools the 1977-78 Nationwide Food
Consumption Survey (NFCS), 1989-1991 Continuing Survey of Food Intakes by
Individuals (CSFII), 1994-1996 CSFII, 2003-04 National Health and Nutrition
Examination Survey (NHANES), and 2007-08 NHANES.
A time series of cross-sectional surveys provides information on each generation’s
food choices at various times in history and at different ages in their lives. For
example, ERS researchers observed the number of times per day that members of
different generations reported consuming fluid milk in the 1977-78 NFCS and in the
2007-08 NHANES (fig. 6). As young children in 1977-78, Americans born in the
1970s tended to consume fluid milk almost twice a day; and by 2007-08, as young
adults in their 20s or 30s, they consumed it only 0.56 times per day. Despite their
youth, Americans born in the 1970s consumed fluid milk even less often in 2007-08
than members of some older generations. Over a 30-year span, Americans born in
the 1940s decreased the frequency of their fluid milk consumption from about 0.97
times per day (in 1977-78, in their 20s or 30s) to about 0.71 times per day (in 2007-
08, in their 50s or 60s).
Previous studies, including Popkin (2010), Cavadini et al. (2000), and Stewart et al.
(2012), have examined trends in the level of U.S. per capita fluid milk consumption.
In this study, ERS researchers further investigated whether the smaller quantities
of fluid milk being consumed by Americans are a result of their consuming it fewer
times throughout the day. The researchers also confirmed whether trends in portion
sizes likewise affect consumption levels. This was accomplished by estimating an
econometric model that predicts both the frequency and total quantity of fluid milk
consumed by Americans based on their generation (decade of birth), incomes, and
demographic characteristics. Definitions and mean values are provided in table 2 for
the model’s dependent and explanatory variables. In the next section, these variables
are explained and the model outlined.12 Why Are Americans Consuming Less Fluid Milk? ERR-149 Economic Research Service, USDA
Variables Used in the Analysis
The analysis focuses on fluid milk consumption by USDA survey participants over
24 hours. The number of times that an individual drank fluid milk during this period
is denoted as FREQUENCY. Preadolescent children consumed fluid milk on 1.65
occasions, on average, with moderate person-to-person variation. FREQUENCY
had a standard deviation of 1.2, among preadolescent children. By contrast, adoles-
cents and adults consumed fluid milk 0.81 times, on average, with a standard devia-
tion of 1.01. Of all survey participants, 58 consumed fluid milk on more than 6
occasions. Three people consumed it on more than 10 occasions. The maximum
value of FREQUENCY was 16 occasions.
Also of interest was a survey participant’s total consumption of fluid milk. This
dependent variable is denoted as QUANTITY. During the 24 hours covered by
the dietary recall of preadolescent children, the children—including those who
consumed no fluid milk at all—reported consuming 1.48 cups of fluid milk, on
average, over all consumption occasions. Adolescents and adults consumed a total
of 0.71 cups, on average. On the occasions when Americans do drink fluid milk,
they may consume it in portions that are about what they were in the 1970s (see
fig. 5). If portions have changed little, then changes over time in QUANTITY may
reflect primarily changes in FREQUENCY.
The researchers also created explanatory variables to proxy for exogenous
factors that may influence a person’s demand for fluid milk. FREQUENCY and
QUANTITY were hypothesized to vary with a person’s income, demographic char-
acteristics, and his or her decade of birth, among other factors. Extensive researchEconomic Research Service, USDA Why Are Americans Consuming Less Fluid Milk? ERR-149 13
Table 2
Mean values of variables used in the model
Children (age 2-12) Adolescents and adults
FREQUENCY Number of times fluid milk was consumed 1.65 0.81
QUANTITY Total intake of fluid milk over 24 hours (cups) 1.48 0.71
INCOME Household income (per capita 2003 dollars) 10,893.84 18,282.27
AGE Age at the time of survey participation (years) 6.96 42.21
HHSIZE Number of people living in household 4.52 3.13
PREGNANT 1 for pregnant; 0 otherwise 0.01
DIETING 1 for on a special diet; 0 otherwise 0.07
HISPANIC 1 for Hispanic ethnicity; 0 otherwise 0.14 0.09
BLACK 1 for Black; 0 otherwise 0.15 0.11
MALE 1 for male; 0 otherwise 0.51 0.46
COLLEGE 1 if household head finished college; 0 otherwise 0.28 0.29
WEEKEND 1 if dietary recall for a weekend; 0 otherwise 0.25 0.26
C1 1 if born prior to 1930; 0 otherwise 0.17
C2 1 if born between 1930-1934; 0 otherwise 0.05
C3 1 if born between 1935-1939; 0 otherwise 0.05
C4 1 if born between 1940-1944; 0 otherwise 0.07
C5 1 if born between 1945-1949; 0 otherwise 0.08
C6 1 if born between 1950-1954; 0 otherwise 0.09
C7 1 if born between 1955-1959; 0 otherwise 0.10
C8 1 if born between 1960-1964; 0 otherwise 0.11
C9 1 if born between 1965-1969; 0 otherwise 0.07
C10 1 if born between 1970-1974; 0 otherwise 0.07
C11 1 if born between 1975-1979; 0 otherwise 0.06
C12 1 if born between 1980-1984; 0 otherwise 0.04
C13 1 if born between 1985-1989; 0 otherwise 0.03
C14 1 if born between 1990-1994; 0 otherwise 0.02
TIME1 1 if 1977-78 NFCS; 0 otherwise 0.17 0.16
TIME2 1 if 1989-91 CSFII; 0 otherwise 0.21 0.20
TIME3 1 if 1994-96 CSFII; 0 otherwise 0.37 0.35
TIME4 1 if 2003-04 NHANES; 0 otherwise 0.13 0.14
TIME5 1 if 2007-08 NHANES; 0 otherwise 0.13 0.15
Source: Calculated by the authors using the 1977-78 Nationwide Food Consumption Survey (NFCS), the 1989-1991 Continuing Survey of
Food Intakes by Individuals (CSFII), the 1994-1996 CSFII, the 2003-04 National Health and Nutrition Examination Survey (NHANES), and the
2007-08 NHANES and accompanying sample weights.14 Why Are Americans Consuming Less Fluid Milk? ERR-149 Economic Research Service, USDA
has been conducted on methods for specifying this type of model. In this study,
ERS followed procedures outlined by Deaton (1997), Johnson (1980), and Stewart
and Blisard (2008) for defining explanatory variables and identifying cohort effects.
Previous studies have analyzed the effects of income, age, gender, race, ethnicity,
and other demographic characteristics on fluid milk consumption. Based on Lin et
al. (2003) and Davis et al. (2010), among other papers cited in this study, researchers
defined several variables for inclusion in the model (table 2). These included the
natural logarithm of a person’s age (AGE), which is consistent with research showing
that fluid milk consumption tends to be stable in childhood, falls in adolescence, and
continues to fall at a slower rate throughout adulthood (e.g., Lin et al., 2003; Mannino
et al., 2004; Sebastian et al., 2010). The researchers also included the natural loga-
rithms of a person’s household income (INCOME) and household size (HHSIZE), as
well as binary variables for gender (MALE), race (BLACK), ethnicity (HISPANIC),
whether at least one head of household has completed college (COLLEGE), and
whether consumption was reported for a Saturday or Sunday (WEEKEND). For teen-
agers and adults, the researchers added binary variables to control for whether survey
participants were dieting (DIETING) or pregnant (PREGNANT) during the 24 hours
described in their 1-day dietary recall.
In addition to factors identified as important determinants of fluid milk consump-
tion in past studies, researchers included explanatory variables for testing whether
the number of times per day that a person consumes fluid milk varies across the
generations. These binary explanatory variables include C2, for people born 1930-
34; C3, 1935-39; and so on in 5-year intervals, up to C14, 1990-94. By including
C2 through C14 in the econometric model, the researchers could calculate the
expected differences in consumption between each of these more recent cohorts and
Americans born prior to 1930.10 Evidence that more recently born cohorts consume
fluid milk less often than older cohorts would confirm that a cohort effect is contrib-
uting to declining consumption frequency. By contrast, finding no consistent vari-
ance of consumption frequency across generations would refute the hypothesis that
cohort effects are part of the trend.
ERS researchers also created binary variables that identify which USDA survey
an individual joined. One of these binary variables, TIME2, indicates that an indi-
vidual participated in the 1989-91 CSFII. Likewise, TIME3 identifies participants
in the 1994-96 CSFII. And, finally, TIME4 and TIME5 denote participants in the
2003-04 and the 2007-08 NHANES. The estimation results on these four variables
compare participants in the 1977-78 NFCS with participants in each of the subse-
quent surveys, holding all other explanatory variables in the model constant.11
Unlike C2 through C14, which capture differences between the generations likely
related to their experiences as children, TIME2 through TIME5 were hypothesized
10Individuals born prior to 1930 would not have likely been influenced as preadolescent
children by the changes in milk consumption that started in the 1940s. ERS researchers,
therefore, hypothesized that generational effects exist only for Americans born in 1930 or
more recently.
11For example, given that the other explanatory variables included a person’s income,
demographic characteristics, and his or her birth year, ERS researchers could interpret the
results on TIME5 to answer the question, “If the same population that existed in 1977-78 still
existed in 2007-08, how much would consumption have fallen or risen?”Economic Research Service, USDA Why Are Americans Consuming Less Fluid Milk? ERR-149 15
to capture the contemporaneous effects on all individuals of the availability of
competing beverages and other aspects of the food marketing system.
Finally, ERS created a variable to account for prices. Prices for fluid milk have
tended to fluctuate relative to prices for other nonalcoholic beverages. The researchers
divided the Consumer Price Index (CPI) for fresh whole milk by the CPI for all nonal-
coholic beverages.12 The ratio of the two CPIs was 0.98 in 1977, 1.03 in 1989, 1.04
in 1994, 1.16 in 2003, and 1.34 in 2007. Values greater than one indicate that the cost
of fresh whole milk has increased faster than the cost of nonalcoholic beverages in
general. However, the inclusion of the price variable in addition to TIME2 through
TIME5 did not improve estimation results. The likely reason is that, as compared
with data in a typical time series study, the available data showed the food choices
of Americans at only a small number of different price levels. Although the USDA
dietary surveys pooled for this study collectively span over 30 years, data were avail-
able only for the years in which one of the five surveys was administered. Thus, the
price variable was excluded from the final model.
Model Specification
How many times per day will an individual consume fluid milk products?
The dependent variable FREQUENCY takes on only integer values: zero for
nonconsumers, 1 for single occasion consumers, 2 for those who consumed on
two occasions, and so on. Econometric models optimized for analyzing this type
of data include the Poisson and negative binomial regression models. Greene
(1997) provides a technical overview of each. Dong et al. (2000) used these
models to study the number of times individuals patronize a restaurant. He et al.
(2004) used the negative binomial model to analyze the number of times people
consume beef, poultry, and seafood. In this study, ERS researchers assumed that
the number of times a person drinks fluid milk could be approximated by the
outcome of a Poisson distribution. By this model, the predicted value (conditional
mean) of FREQUENCY is λ = eβX where e is the base of the natural logarithm, X
is a set of explanatory variables, and β includes the parameters that describe the
relationship between the dependent and explanatory variables by their sign (+/-)
and magnitude. The researchers included in X a person’s income, demographic
characteristics, decade of birth, and survey year. Of course, the number of times that
a particular individual consumes fluid milk may vary from the predicted value on
any given day. The Poisson regression model assumes that the mean and variance of
FREQUENCY conditional on X are the same. Both equal λ. However, the closely
related negative binomial regression model relaxes this assumption. It instead
assumes that FREQUENCY has conditional mean λ and conditional variance
λ(1 + (1/θ)λ) where 1/θ is an “overdispersion” parameter. Thus, the conditional
variance of FREQUENCY may exceed its conditional mean because of either
heterogeneity across survey participants or omission from the regression model of
demand determinants for which the necessary data do not exist to explicitly create
explanatory variables. Researchers who work with count data will commonly
12The Bureau of Labor Statistics (BLS) has been publishing a CPI for whole fresh milk
since at least the 1970s and a CPI for fresh milk other than whole milk since 1997. The two
series have moved together closely. Changes in the two CPIs share a correlation coefficient
of 0.98 in the years for which both indices are available.16 Why Are Americans Consuming Less Fluid Milk? ERR-149 Economic Research Service, USDA
estimate both a Poisson and negative binomial model. They then select between the
two specifications by conducting a test for overdispersion.
The model further adds a second equation to the basic count data model for a
survey participant’s total daily intake of fluid milk over all consumption occasions.
The value of QUANTITY is zero if FREQUENCY equals zero (i.e., for consumers
who drank no milk). For other consumers, QUANTITY = αZ, where Z is a set of
explanatory variables and α contains the parameters that describe the relationship
among the variables. Researchers hypothesized that QUANTITY depends partly on
the number of times a person consumed fluid milk. Thus, FREQUENCY is included
in Z, along with the demographic characteristics of an individual that may influ-
ence portion sizes, such as his or her gender and age. Finally, the four survey date
variables are included in Z. If the parameters on TIME2 through TIME5 are found
to be negative and increasingly large in magnitude from older to newer surveys,
then that would suggest that portion sizes have tended to decrease since the 1970s.
Otherwise, it can be concluded that changing portion sizes have not contributed
much to the decline in fluid milk consumption shown in figures 1 and 2.
The two-equation model in this study is a triangular system. FREQUENCY
is modeled in the first equation and, in turn, helps to determine the value of
QUANTITY in the second equation. However, in this type of model, biased esti-
mates of the relationship between FREQUENCY and QUANTITY may result if
FREQUENCY is simply included among the other explanatory variables in Z in
our second equation.13 To mitigate this problem, ERS researchers instead included
the number of times per day that an individual is predicted to consume fluid milk,
λ=eβX, in Z.14
The researchers also allowed for the possibility that different factors may influ-
ence the food choices of preadolescent children and Americans age 13 and
older. The two-equation model is estimated separately for people in these two
age groups. Excluded from the model for preadolescent children are C2 through
C14, PREGNANT, and DIETING. C2 through C14 are excluded from this model
because it is customary to assume that young children are free of any habits associ-
ated with their year of birth (e.g., Mori and Saegusa, 2010); rather, they are still
forming the habits that will later define their generation.
Estimation of the model in the present study makes a novel contribution to research
on fluid milk consumption and the broader body of research on food demand. In
contrast to previous studies of milk demand like Lin et al. (2003) and Davis et
al. (2010) that use cross-sectional data, this study instead pools surveys collected
over 30 years. Moreover, to the authors’ knowledge, this study represents the first
application of count models to pooled survey data for testing whether generational
change contributes to trends in the consumption of any food commodity. Additional
information on the model, including the complete likelihood function, is provided
in Appendix II: Model Specification and Estimation.
13Unobservable differences in tastes, dietary knowledge, and medical conditions between
individuals could contribute to the error terms in both our equations for FREQUENCY and
QUANTITY. That is, these omitted variables could affect both the frequency of consumption
and portion sizes. This would then lead to endogeneity bias.
14This is an instrumental variable approach.Economic Research Service, USDA Why Are Americans Consuming Less Fluid Milk? ERR-149 17
Estimating the Model and Examining Results
Using data from the pooled USDA food consumption surveys, researchers estimated
both the model for preadolescent children and the model for Americans beyond their
preadolescent years by weighted maximum likelihood.15 As a preliminary exercise,
the researchers initially estimated only the first equation for FREQUENCY as a
standalone model. Poisson and negative binomial specifications were both consid-
ered. The researchers then used tests for overdispersion to select between these two
specifications. Based on these test results, the researchers selected a Poisson model
for preadolescent children and a negative binomial model for teenagers and adults.16
The complete models, including the second equation for QUANTITY, were then
estimated. The standard errors of βˆ and αˆ were calculated using a bootstrap proce-
dure.17 Lastly, ERS researchers confirmed the robustness of their key results.18 The
results of model estimation are reported in table 3 and table 4. As a supplementary
exercise, the researchers used these results to predict how a change in each of the
birth year (C2 through C14) and time variables (TIME2 through TIME5) would
affect the number of times per day that a person consumes fluid milk products
(FREQUENCY).19 These marginal effects are shown in figures 7 and 8.
Generational Change Contributing to Decreases in
Frequency of Consumption
The results confirm that newer generations of Americans are consuming fluid milk
products fewer times per day. For adolescents and adults, the marginal effects of the
birth year variables represent the expected differences in consumption between a
person born before 1930 and one born more recently, all else constant. For example,
Americans born in the early 1960s are expected to consume fluid milk on about 1.1
fewer occasions per day at age 20, age 30, and so on than Americans born before
1930 consume at each of these same ages. This marginal effect is calculated using
the estimation results for C8 (fig. 7). Moreover, Americans born in the early 1980s
15Sample weights provided by USDA for use with its surveys were incorporated into the
estimation.
16Consistent with test results for adolescents and adults, ERS researchers noted that the
mean of FREQUENCY (0.81) was less than the variance of FREQUENCY (1.01). This was
not the case for preadolescent children. FREQUENCY had a mean and variance of 1.65 and
1.43 among survey respondents in this age group, respectively.
17Efron and Tibshirani (1998, p. 52) report that 100 replications “gives quite satisfactory
results” and “very seldom” are more than 200 replications needed. For this study, ERS
researchers used 250 replications. Each replication included 64,192 observations drawn from
the original sample with replacement and a probability proportional to the sample weight
(Efron and Tibshirani, 1998; Lee and Forthofer, 2006).
18For example, ERS checked that the findings on C2 through C14 for adolescents and
adults were not driven by any correlation with changes in prices, changes in the availabilities
of milk and competing beverages, or changes in other factors correlated with time. This was
accomplished by re-estimating the equation for FREQUENCY for adolescents and adults
excluding all time variables, TIME2 through TIME5. Estimation results on C2 through C14
were qualitatively unchanged, confirming the robustness of our findings.
19ERS estimated these effects for each individual in the sample. They then used the
sample weights to calculate the weighted averaged effect across all individuals. See also
notes to figures 7 and 8.18 Why Are Americans Consuming Less Fluid Milk? ERR-149 Economic Research Service, USDA
Table 3
Frequency and quantity of fluid milk consumption, coefficient estimates for adolescents
and adults
FREQUENCY QUANTITY
Coefficient Std. Error Coefficient Std. Error
Birth year (generation) variables
C2 -0.31* 0.03
C3 -0.48* 0.03
C4 -0.60* 0.03
C5 -0.64* 0.04
C6 -0.82* 0.04
C7 -0.92* 0.04
C8 -0.90* 0.05
C9 -1.21* 0.05
C10 -1.28* 0.06
C11 -1.30* 0.07
C12 -1.35* 0.08
C13 -1.47* 0.09
C14 -1.42* 0.10
Time (survey) variables
TIME2 0.04 0.02 0.05 0.03
TIME3 0.04 0.02 0.04 0.03
TIME4 0.05 0.03 0.27* 0.04
TIME5 0.10* 0.04 0.10 0.04
Income and demographic variables
ln(INCOME) -0.03* 0.01 -0.02* 0.01
ln(AGE) -0.70* 0.04 -0.52* 0.02
ln(HHS) 0.04* 0.01
MALE 0.05* 0.01 0.39* 0.01
WEEKEND -0.12* 0.01
COLLEGE 0.09* 0.01 -0.05* 0.02
PREGNANT 0.44* 0.04 0.39* 0.06
DIETING -0.04 0.02 -0.07 0.03
BLACK -0.55* 0.02 -0.14* 0.03
HISPANIC -0.04 0.02 -0.19* 0.02
Other model parameters
CONSTANT 3.27* 0.18 3.13* 0.11
1/θ 0.22* 0.01
λ 0.17* 0.06
* = significant at the 1-percent level
Source: Model estimated by ERS researchers using weighted maximum likelihood, sample weights provided by data in the
1977-78 Nationwide Food Consumption Survey (NFCS), the 1989-1991 Continuing Survey of Food Intakes by Individuals
(CSFII), the 1994-1996 CSFII, the 2003-04 National Health and Nutrition Examination Survey (NHANES), and the 2007-08
NHANES. Standard error of equation for QUANTITY was 1.2.Economic Research Service, USDA Why Are Americans Consuming Less Fluid Milk? ERR-149 19
are expected to consume fluid milk on about 0.3 occasions less per day than those
born in the early 1960s. This finding follows from the estimation result for C8
and C12 and is also depicted in figure 7. Such large decreases in the frequency of
consumption between individuals born several decades apart could gradually reduce
per capita consumption as successively newer generations slowly replace older
generations and account for a steadily larger share of the overall population.
If there were no cohort effect and the other explanatory variables in the model had
remained unchanged, American adolescents and adults would have likely main-
tained the frequency of their fluid milk consumption from the 1970s into the 2000s.
This conclusion follows from the marginal effects of TIME2 through TIME5 (fig.
8). As discussed above, these variables are hypothesized to capture the contempo-
raneous effects of the food marketing system such as the availability of competing
beverages. For adolescents and adults, these effects are small and do not tend
to increase or decrease in magnitude from the older to more recent USDA food
consumption surveys. Once people are past childhood, their food choices seem to
be much more influenced by their childhood-formed habits than by changes over
their life times in the environment in which their food choices are made.
Table 4
Frequency and quantity of fluid milk consumption, coefficient estimates for preadolescent
children
FREQUENCY QUANTITY
Coefficient Std. Error Coefficient Std. Error
Time (survey) variables
TIME2 -0.10* 0.02 0.00 0.04
TIME3 -0.16* 0.02 -0.10* 0.04
TIME4 -0.19* 0.03 0.03 0.05
TIME5 -0.25* 0.02 -0.22* 0.05
Income and Demographic variables
ln(INCOME) -0.04* 0.01 -0.02 0.01
ln(AGE) -0.19* 0.01 0.18* 0.03
ln(HHS) 0.02 0.03
MALE 0.05* 0.01 0.19* 0.02
WEEKEND -0.22* 0.02
COLLEGE 0.08* 0.02 0.01 0.03
BLACK -0.32* 0.02 -0.19* 0.05
HISPANIC -0.01 0.02 0.06 0.03
Other model parameters
CONSTANT 1.37* 0.11 1.18* 0.27
λ 0.30* 0.08
* = significant at the 1-percent level
Source: Model estimated by ERS researchers using weighted maximum likelihood, sample weights provided by data
in the 1977-78 Nationwide Food Consumption Survey (NFCS), the 1989-1991 Continuing Survey of Food Intakes by
Individuals (CSFII), the 1994-1996 CSFII, the 2003-04 National Health and Nutrition Examination Survey (NHANES), and
the 2007-08 NHANES. Standard error of equation for QUANTITY was 1.12.20 Why Are Americans Consuming Less Fluid Milk? ERR-149 Economic Research Service, USDA
However, changes over time in the food environment—that is, trends in prices, mix
of competing products, etc.—appear responsible for reducing children’s fluid milk
consumption. As also shown in figure 8, these effects are increasingly negative
from the older to the newer surveys for preadolescent children. We find that preado-
lescent children tended to drink milk on 0.28 fewer occasions per day in 1994-96
than did preadolescent children in 1977-78, all else constant. By 2007-08, they were
consuming it on 0.42 fewer occasions per day than in 1977-78.
Finally, the estimation results for household income and demographic variables
generally agree with past studies. As shown in table 3, Americans drink milk fewer
times per day as they age. They also consume it more frequently if at least one head
of household has completed college. From these results and the findings of existing
studies, it follows that economic and demographic changes in the Nation’s popula-
tion are enhancing or mitigating the declining frequency of fluid milk consumption.
For example, more Americans are completing college (Cromartie, 2002). The median
age of the U.S. population has also increased from 28.1 years in 1970 to 32.9 years in
1990, and 37.2 years in 2010 (Hobbs and Stoops, 2002; Howden and Meyer, 2011).Economic Research Service, USDA Why Are Americans Consuming Less Fluid Milk? ERR-149 21
Portions Remaining Largely Stable
Changes in portions over time appear to contribute little to trends in fluid milk
consumption. For both preadolescent children and Americans age 13 and older,
estimates of the parameters in the model’s second equation reveal a positive rela-
tionship between FREQUENCY and QUANTITY. Americans who consume fluid
milk on more occasions per day tend to consume a larger quantity overall. However,
ERS researchers obtained negative, positive, and zero values for the parameters on
TIME2 through TIME5 in the same second equation. Thus, there is no evidence of
a trend in quantities consumed after accounting for the other variables in the second
equation of the model. This result is consistent with the earlier discussions of figures
4 and 5. It again suggests that portions have changed relatively little and, therefore,
that changes over time in QUANTITY reflect primarily changes in FREQUENCY.22 Why Are Americans Consuming Less Fluid Milk? ERR-149 Economic Research Service, USDA
Considering the Health Implications of Trends in Milk
Consumption
Americans are consuming less fluid milk, on average, because they drink it on fewer
occasions per day. In particular, they drink it less often with their midday and night-
time meals. Mitigating the decline are programs supported by dairy farmers, fluid
milk processors, and the Federal Government. Kaiser (2010) confirms that promo-
tions sponsored by checkoff programs increase the demand for fluid milk. Gleason
and Suitor (2001) similarly identify a positive association between children’s partic-
ipation in the NSLP and their consumption of fluid milk. These programs moderated
the decline in U.S. per capita fluid milk consumption between the 1970s and the
2000s. However, because greater decreases in consumption frequency are observed
among more recent generations of Americans, it may be difficult to reverse ongoing
consumption trends. Indeed, holding all other factors constant, the gradual replace-
ment in the population of older generations by newer generations will exert down-
ward pressure on Americans’ average consumption of fluid milk.
Sustained decreases in per capita fluid milk consumption would work against efforts
to raise Americans’ overall dairy consumption to recommended levels. To date,
Americans have merely maintained their total intake of dairy products by consuming
more Cheddar cheese and more mozzarella cheese (USDA-ERS, 2013a). However,
the Nation’s population would be closer to satisfying dairy recommendations in the
Dietary Guidelines for Americans, 2010 if Americans were still drinking as much
fluid milk as they did in the 1970s, in addition to the amounts of other dairy products
they now consume.20 Additionally, cheese products can contain as many or more
calories than fluid milk. On a per cup-equivalent basis,21 regular Cheddar cheese
(171 calories) has more calories than a glass of whole milk (149 calories). Whole-fat
mozzarella (128 calories) has slightly more calories than 2 percent milk (122 calories).
Part-skim mozzarella (108 calories) has slightly more calories than 1 percent milk
(102 calories) and somewhat more than skim milk (86 calories).
Nutrition and health policy researchers have warned of the potential health implica-
tions of declining fluid milk consumption (e.g., Cavadini et al. 2000; Popkin 2010).
If fluid milk consumption continues to decline in response to cohort effects, then
raising Americans’ dairy intakes and improving overall diet quality would require
substantially greater increases in the consumption of non-fluid products in skim
and low-fat form. Maintaining a focus on children may also be key to mitigating
or halting the downward trend in fluid milk consumption, because habit formation
implies that childhood food choices can affect longrun behavior.
20ERS food availability data show that Americans consume 1.53 cup-equivalents of dairy
products, on average, including 0.61 cup-equivalents of fluid milk (USDA-ERS, 2013a). Thus,
raising fluid milk consumption to 0.96 cup-equivalents per person, as in the early 1970s,
would raise the per capita total to about 2 cup-equivalents. As noted above, The Dietary
Guidelines for Americans, 2010 recommends 2 cup-equivalents per day for children aged 2 to
3 years, 2.5 for those aged 4 to 8 years, and 3 for Americans older than age 8.
21Consuming 8 ounces of fluid milk, 1.5 ounces of Cheddar cheese, or 1.5 ounces of
mozzarella cheese all count equally toward an individual’s consumption of dairy products.
Each is considered to be 1 cup-equivalent. Each is also available in higher and lower fat
forms. ERS researchers used the USDA National Nutrient Database for Standard Reference,
Release 25 (USDA, Agricultural Research Service, 2013b) to compare the number of calories
in selected forms of these foods’ per cup-equivalents.You can also read