Attraction, Dynamics, and Phase Transitions in Fire Ant Tower-Building - Frontiers
←
→
Page content transcription
If your browser does not render page correctly, please read the page content below
ORIGINAL RESEARCH
                                                                                                                                                published: 04 March 2020
                                                                                                                                           doi: 10.3389/frobt.2020.00025

                                             Attraction, Dynamics, and Phase
                                             Transitions in Fire Ant Tower-Building
                                             Gary K. Nave Jr. 1,2*, Nelson T. Mitchell 2 , Jordan A. Chan Dick 2 , Tyler Schuessler 3 ,
                                             Joaquin A. Lagarrigue 2,4 and Orit Peleg 1,2,5*
                                             1
                                               BioFrontiers Institute, University of Colorado Boulder, Boulder, CO, United States, 2 Computer Science, University of
                                             Colorado Boulder, Boulder, CO, United States, 3 Applied Mathematics, University of Colorado Boulder, Boulder, CO,
                                             United States, 4 Psychology and Neuroscience, University of Colorado Boulder, Boulder, CO, United States, 5 Santa Fe
                                             Institute, Santa Fe, NM, United States

                                             Many insect species, and even some vertebrates, assemble their bodies to form
                                             multi-functional materials that combine sensing, computation, and actuation. The
                                             tower-building behavior of red imported fire ants, Solenopsis invicta, presents a key
                                             example of this phenomenon of collective construction. While biological studies of
                                             collective construction focus on behavioral assays to measure the dynamics of formation
                                             and studies of swarm robotics focus on developing hardware that can assemble
                           Edited by:        and interact, algorithms for designing such collective aggregations have been mostly
                       Heiko Hamann,         overlooked. We address this gap by formulating an agent-based model for collective
      Universität zu Lübeck, Germany
                                             tower-building with a set of behavioral rules that incorporate local sensing of neighboring
                       Reviewed by:
                     Adam L. Cronin,         agents. We find that an attractive force makes tower building possible. Next, we explore
 Tokyo Metropolitan University, Japan        the trade-offs between attraction and random motion to characterize the dynamics and
                   Daniel Strömbom,
     Lafayette College, United States
                                             phase transition of the tower building process. Lastly, we provide an optimization tool
                 Wilfried Elmenreich,        that may be used to design towers of specific shapes, mechanical loads, and dynamical
              Alpen-Adria-Universität        properties, such as mechanical stability and mobility of the center of mass.
                   Klagenfurt, Austria

                  *Correspondence:           Keywords: social insects, agent based modeling (ABM), self-assembly, phase transition, collective construction,
                      Gary K. Nave Jr.       swarms and collective behavior
              gary.k.nave@gmail.com
                            Orit Peleg
             Orit.Peleg@colorado.edu         1. INTRODUCTION
                   Specialty section:        Collective aggregation is a prevalent behavior among social animals, where many individuals
         This article was submitted to       cluster together while feeding, defending against predators, or as a thermoregulation strategy,
         Computational Intelligence in       effectively reducing the exposed surface area per individual. Examples of species that aggregate
                             Robotics,       include vertebrates, such as penguins (Waters et al., 2012) and bats (Roverud and Chappell, 1991;
               a section of the journal
                                             Kerth, 2008) as well as insects, such as beetles (Deneubourg et al., 1990), ants (Theraulaz et al.,
          Frontiers in Robotics and AI
                                             2002; Reynaert et al., 2006), and cockroaches (Ame et al., 2004; Jeanson et al., 2005). While these
       Received: 20 November 2019            aggregations are often planar, eusocial insects, such as honey bees (Seeley, 2010; Kastberger et al.,
        Accepted: 13 February 2020
                                             2011), army ants (Franks, 1989), and fire ants (Mlot et al., 2011) extend this strategy and create
         Published: 04 March 2020
                                             three-dimensional assemblages. These self-assemblages are composed of a multitude of individuals
                             Citation:       who link their bodies, doing so without a global overseer and with limited cognitive abilities
   Nave GK Jr, Mitchell NT, Chan Dick
                                             (Anderson et al., 2002).
  JA, Schuessler T, Lagarrigue JA and
 Peleg O (2020) Attraction, Dynamics,
                                                 Ants in particular are capable of a wide variety of self-assemblages and collective behavior. For
      and Phase Transitions in Fire Ant      example, ants of the genus Oecophylla build chains for gap crossing and during nest construction
Tower-Building. Front. Robot. AI 7:25.       (Lioni et al., 2001). In addition, army ants are known for their construction of bivouacs (Franks,
       doi: 10.3389/frobt.2020.00025         1989), and are also capable of building bridges out of their bodies to cross gaps along a foraging

Frontiers in Robotics and AI | www.frontiersin.org                                  1                                                  March 2020 | Volume 7 | Article 25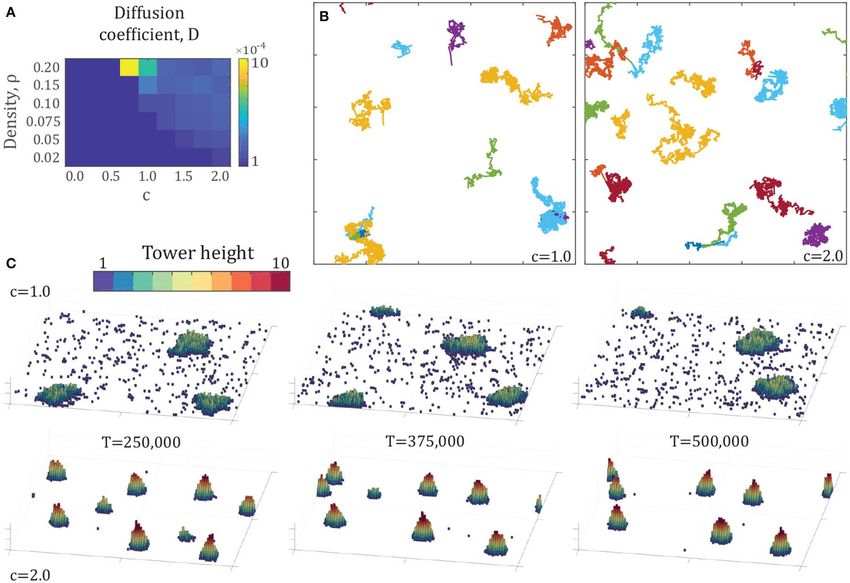
Nave et al.                                                                                                               Attraction in Ant Tower-Building

trail (Reid et al., 2015). Finally, as we will discuss further, fire ants       of a ring around the vertical rod or vegetation. We will take a
gather together to form rafts and towers when their habitat floods              more general definition of an available space in the present study,
(Mlot et al., 2011, 2012; Phonekeo et al., 2017).                               discussed below in section 2.1.
   The structures that these insects create are, in essence,                       The work of Phonekeo et al. (2017) shows an agreement
autonomous materials that embed sensing, computation, and                       between the resulting tower shapes in the long-timescale limit;
actuation. These properties are some of the long-standing                       however, it does not explore the time dynamics and parameter
aspirations in the fields of multi-functional materials and robotic             space systematically. This is what the present work aims to do,
materials (Şahin, 2004; Hughes et al., 2019). Self-assembling                  since local rules, such as these provide a systematic way of
agents have already begun to inspire robotic applications                       analyzing collective behavior through agent-based modeling, and
(Bonabeau et al., 1999; Brambilla et al., 2013; Hamann, 2018).                  importantly, they are directly implementable in swarm robotic
For example, Del Dottore et al. (2018) have described the concept               systems. By simulating the behavior of individuals following
of “growing robots,” which are systems of a large number of                     a set of local rules, it is possible to investigate how local
individual robots working together to mimic biological growth                   interactions between agents lead to global emergent behavior and
in plants or groups of molecules or cells. Other collective robots              explore the space of possible behavior beyond what is possible
are directly inspired by eusocial insects, such as the S-bots (Şahin           with experiments.
et al., 2002; Groß et al., 2006), which form chains to collectively                Modeling efforts of collective behavior using local behavioral
move larger payloads, just like ants working together to move                   rules include the boids model (or Vicsek model) (Reynolds,
larger food (Buffin and Pratt, 2016). Also inspired by ants,                    1987; Vicsek et al., 1995), which simulates agents moving under
Swissler and Rubenstein (2018) have developed robots with a new                 attraction, repulsion, and alignment as well as more complicated
docking mechanism to form self-assembling structures. Another                   models (Couzin and Krause, 2003; Mishra et al., 2012; Wilensky
class of robots, inspired by termites (Werfel et al., 2014), build              and Rand, 2015). However, boids-type models best describe the
three-dimensional structures out of external building materials.                behavior of more sparse collectives, such as flocks of birds or
Finally, the cube-shaped M-Blocks (Romanishin et al., 2015)                     schools of fish. To model ants building a tower, we must account
construct aggregations out of their own bodies, using magnetism                 for dense aggregations where the interaction range is limited
and angular momentum to climb on top of neighbors. These                        to a short length scale, preferably defined by the size of an
works represent examples from the emerging field of multi-agent                 individual agent. Models of more dense collective assemblies
robotic systems built out of many inexpensive individual robots                 include aggregation in slime mold based on chemical signal
and utilizing control strategies that may include redundancies to               amplification (Levine et al., 1997; Umeda and Inouye, 1999),
overcome individual malfunctions. While much of the focus in                    and nest building in wasps using an agent-based model in
robotics has been on developing the hardware, the algorithmic                   which swarms of builders deposit bricks and build up a nest
development of assembling processes has often been overlooked.                  (Theraulaz and Bonabeau, 1995; Bonabeau et al., 2000). Agent-
We address this gap by borrowing tools from computational                       based modeling has been successfully applied to studies of ant
material science and characterize the dynamics of 3-dimensional                 collective behavior as well (Dorigo et al., 2000) to modeling
aggregation formation inspired by fire ant towers.                              traffic organization in ant foraging (Goss et al., 1989; Couzin
   In nature, red imported fire ant (Solenopsis invicta) towers                 and Franks, 2003; Strömbom and Dussutour, 2018), bridge and
tend to occur in the event of flooding. Initially, fire ants gather             chain formation (Lioni et al., 2001; Garnier et al., 2013), and trail
together to form hydrophobic rafts (Mlot et al., 2011, 2012) to                 clearing (Bochynek et al., 2017). However, for the present study
float above the water surface. When the rafts approach vegetation               we must consider both moving ants as in traffic organization
emerging from the surface, they may attach to the vegetation                    and trail clearing, which climb the tower and form the shape,
and form towers on top of their floating rafts, as pictured in                  as well as stationary ants that support the structure as in bridge
Figure 1A. In a recent, Phonekeo et al. (2017) described an                     and chain formation. Based on the similarity to the aggregation
experimental assay of the tower-building process in fire ants.                  of inanimate systems, such as colloids (Deneubourg et al.,
The experimental setup involved fire ants constructing towers                   2002; Vernerey et al., 2018), we reason that ant tower building
around a vertical rod to represent the emergent vegetation. In                  would experience dynamic phase separation processes including
their analysis, the authors propose four rules which allow ants                 nucleation (Vlasov, 2019), jamming (Bak, 1996), and ripening
to build towers:                                                                (Voorhees, 1985). These phase transitions are also observed at
1. Do not move if ants are on top of you.                                       the thermodynamic transition between phases of matter, which
2. If atop other ants, repeatedly move a short distance in a                    have been studied experimentally (Panagiotou et al., 1984) as well
   random direction.                                                            as computationally (Rovere et al., 1990; Navarro and Fielding,
3. Upon reaching available space adjacent to non-moving ants,                   2015). Hence, we formulate an agent-based model with a set
   stop and link with them.                                                     of behavioral rules that lead to aggregation and experience
4. The top layer of the tower is not stable unless there is a                   dynamical phase transitions.
   complete innermost ring of ants gripping each other around                      Section 2 describes the details of the model we study in the
   the rod.                                                                     present work and lays out the modifications to the local rules
                                                                                (presented above) that we introduce to achieve tower-building.
Note that the “available space adjacent to non-moving ants” is                  In section 3, we explore the parameter space of the local rules to
primarily discussed by Phonekeo et al. (2017) in the context                    identify the impacts of each component: locking, unlocking, and

Frontiers in Robotics and AI | www.frontiersin.org                          2                                          March 2020 | Volume 7 | Article 25
Nave et al.                                                                                                                             Attraction in Ant Tower-Building

 FIGURE 1 | (A) Formation of towers by fire ants around vegetation, reproduced with permission from Phonekeo et al. (2017). (B) Schematic of computational model
 considered in this study, as described in section 2.2. Individual free agents (black) move to an adjacent square at every time step, while locked agents (red) remain
 stationary. The side view below the grid shows the 3-dimensionality of the model arena. The blue region represents the neighborhood of adjacent locations which an
 agent considers when searching for locked neighbors and for determining its attractive force. (C) Schematic representation of the three states an agent can assume in
 the model. Free agents move with constant velocity, locked agents stop to build towers, while covered agents cannot unlock.

attraction. We find that towers undergo a phase transition when                       we will refer to an agent that stops to support tower building as
varying the attraction parameter, and explore how this phase                          “locked.” Each pixel along the horizontal plane has an associated
transition changes across various densities. Finally, we introduce                    height equal to the number of locked agents on top of each other
an optimization algorithm to generate the largest possible tower                      in that location. The free agents, therefore, are moving under
for a given density of agents in the system. In section 4, we discuss                 2-dimensional rules along the surface defined by locked agents,
the significance of the results and talk about implications for both                  which is embedded in 3-dimensions. If an agent attempts to climb
the understanding of collective biological systems and the design                     on top of neighbors to a voxel that is more than ℓ higher, it does
of multi-agent robotic control strategies.                                            not move at this time step. Agents may move down any distance
                                                                                      but never move below the floor.
2. AGENT-BASED MODEL                                                                      Agents in the model may take on three different states,
                                                                                      depicted in Figure 1C: free, locked, or covered. A free agent may
We consider a system of N individual agents simulated to move                         move around the arena according to a specific set of behavioral
in a L × L × ∞ arena, discretized into a cubic lattice made of                        rules with a constant velocity of one voxel per time step. All
voxels of volume ℓ × ℓ × ℓ. The volume of an individual agent is                      agents determine their intended movement before moving, and
set to the be volume of a voxel, where ℓ ≡ 1. At each time step, an                   movement order is chosen randomly at each time step. To
individual agent can move into one of its 26 neighboring voxels:                      prevent two individuals from occupying the same position, if two
9 above, 9 below, and 8 on the same level. A schematic of agents                      free agents attempt to move to the same voxel, the second agent
moving within the arena is shown in Figure 1B. In the present                         to arrive randomly chooses an unoccupied voxel horizontally
work, we will not consider the effects of solid wall boundaries and                   adjacent to the target voxel. Locked agents are those which have
will instead implement periodic boundaries. The horizontal plane                      decided to become a part of a tower and allow their neighbors
of the arena, therefore, contains periodic boundary conditions—                       to climb on top of them. We explore different schemes for the
when an agent leaves the right side of the arena, for example,                        decision to “lock” as defined in sections 2.1 and 2.2. Covered
it re-enters the left side. Periodic boundaries are also taken                        agents are locked agents with at least one other agent on top
into account when distances between agents are calculated. The                        of them. Each time step consists of first evaluating movement
equations that define the periodic boundary conditions are given                      for all individuals and then evaluating locking decisions for
in (S1) and (S2) in Appendix 2. The vertical direction of the arena                   all individuals based on their new configuration. We will not
is semi-infinite, extending upward from a solid floor.                                consider the effect of stability and assume that each agent has
    Agents move horizontally and climb up if the voxel they                           infinite strength to support neighbors.
intended to move into is occupied by a locked agent. Note that                            It is likely that pheromones play a role in fire ant tower
the local rules described above, from Phonekeo et al. (2017), refer                   building, but for the present study, we consider whether this
to agents “linking” with one another, while in the present work                       behavior can arise from solely physical proximity to neighbors.

Frontiers in Robotics and AI | www.frontiersin.org                                3                                                  March 2020 | Volume 7 | Article 25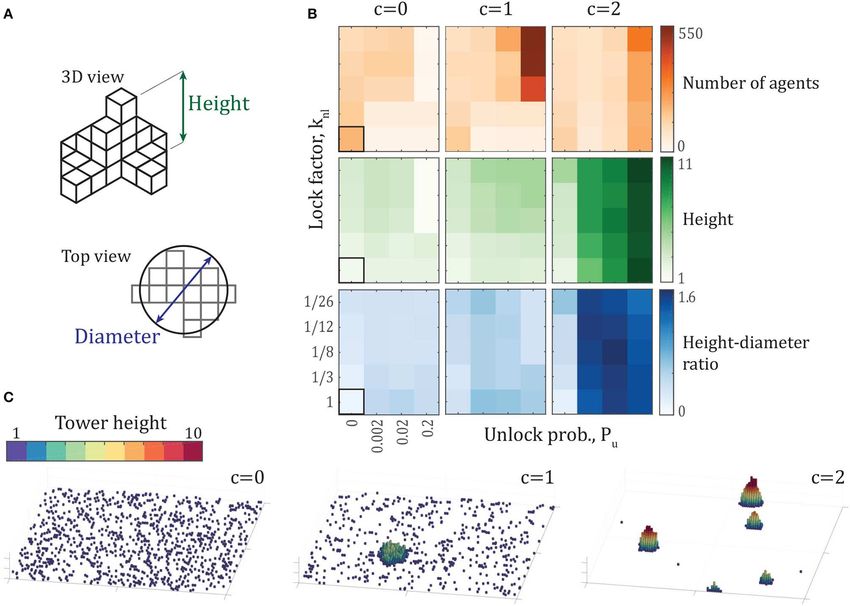
Nave et al.                                                                                                          Attraction in Ant Tower-Building

Hence, an agent can sense which of its surroundings 26 voxels              agents. This allows individuals past the first locked neighbor
are occupied by another agent. This local model will allow for             they encounter and move further in toward the center of
easier implementation by collective robotic systems, as it merely          an aggregation. To model this, we introduce a constant
requires local sensing.                                                    probability of unlocking Pu which applies equally to all
   Unless specified otherwise, all simulations contain N = 1, 000          uncovered locked agents. This rule introduces a distinction
agents moving in a 100 × 100 × ∞ arena, corresponding to a                 between locked agents and covered agents—covered agents
density of ρ = LN2 = 0.1. Based on preliminary simulations,                cannot unlock.
we have chosen to evaluate each trial for 500,000 time steps, for
which 97.8% of all simulations considered reached a steady state,          2.2.2. Neighbor-Influenced Locking Probability
where the largest tower size remained approximately constant               Second, we loosen the requirement that agents must lock upon
(±5% of N) for at least the last 100,000 time steps of the                 encountering another locked agent, and instead allow for their
simulation. Exceptions will be discussed below in section 3.2.             probability of locking to increase with an increasing number
                                                                           of locked neighbors. This new rule (ii) replaces the previously
2.1. Diffusion-Limited Aggregation                                         discussed rule that individuals lock immediately upon finding
We start by investigating whether a dynamic simulation of the              a locked neighbor. Instead, an individual has a probability to
proposed local rules above can lead to tower-building. As we               lock based on the number of locked agents in its neighborhood.
are not considering effects of stability, we will ignore rule (iv)         We define this probability of neighbor-influenced locking as
in the present study. We simulate the rules (i)–(iii) from Mlot            Pnl = knl Nn , with Nn representing the number of locked agents
et al. (2012) and Phonekeo et al. (2017) with a naive approach             in an individual’s neighborhood and knl specifying the increase
to what constitutes an available space adjacent to non-moving              in probability for each additional neighbor. The neighborhood
agents, assuming no direct knowledge of the agents about where             is defined as a distance of one above below, or horizontally
they are relative to the rest of the tower. At each time step, each        adjacent to the agent’s location, highlighted by the blue region
individual agent randomly chooses an adjacent square to move               in Figure 1B.
into, performing a random walk and fulfilling rule (ii). When                 The overall probability that a free agent chooses to lock is
an agent arrives in a voxel with at least one locked neighbor              given by,
sharing a corner, edge, or side, it decides to lock, fulfilling rule                          Pl = min {Psl + Pnl , 1} ,
(iii). Locked agents remain in place, and allow others to move on                                                                               (1)
top of them. Finally, when agents climb on top of locked agents,                                 = min Psl + knl Nn , 1 ,
the locked agent’s status changes to covered, fulfilling rule (i).         where Psl is the probability of spontaneously locking. Note that
For the sake of simple implementation, we also allow agents to             the model allows for up to 26 neighbors, so the value of Psl +
start tower building with a constant probability of spontaneous            knl Nn may be >1. In this case, locking is guaranteed. Therefore, a
                  1
locking, Psl = 20,000 .                                                    min function is used to state that when Psl + knl Nn > 1, the
    This model leads to aggregations which grow horizontally               locking probability is Pl = 1. Additionally, the inverse of the
rather than upward. An example of a final configurations from              neighbor locking factor, k1 , may be thought of as the number
                                                                                                       nl
one such simulation is shown in Appendix 1 and correspond
                                                                           of neighbors required to guarantee locking.
to the boxed-in panel of Figure S1. This is illustrated in
                                                                               The probability of spontaneous locking provides a baseline
Supplementary Video S1, where each tower growing outward in
                                                                           probability of locking, to allow for individuals to randomly seed
fractal shapes from a center point. This behavior arises due the
                                                                           towers. In our simulations, we keep this probability small and
higher likelihood of an agent performing a random walk to find                                 1
                                                                           set it to Psl = 20,000 . The neighbor-influenced locking factor
other agents near the outer edge of the aggregation.
                                                                           provides the urgency with which an agent locks next to locked
    These results closely resemble a phenomenon known as
                                                                           neighbors.
diffusion-limited aggregation (DLA) (Witten and Sander, 1981).
DLA was developed to model the aggregation of metal particles              2.2.3. Attraction Forces
which gather in wispy, fractal shapes, similar to the simulated            As we show below in section 3.1 and Appendix 1, the two
agent aggregation in Figure S1 for Pu = 0, knl = 1. DLA has also           rule modifications above are unable to reproduce large tower-
been observed in experimental colloidal aggregation systems, as            like structures. Therefore, we extend the random walk model
in Reynaert et al. (2006). Without any rule modifications, DLA             discussed above, and add an attractive “force” representing
is unable to form dense aggregations of agents, because agents             a behavioral tendency to cluster together. Under this effect,
on the edge of the aggregation shadow those closer to the center.          individual agents search their immediate local neighborhood for
Hence, we propose several modifications to the behavioral rules            other agents, and move toward the center of all neighbors. This
which are necessary to mimic the time dynamics of tower shapes             motion is then perturbed by the randomness associated with a
experimentally observed by Phonekeo et al. (2017).                         simple random walk model. The resulting velocity is given by,
                                                                                                               ni
2.2. Rule Modifications to Achieve                                                                          c X
                                                                                           vi = vrandom +         xj − x i ,                     (2)
Tower-Building                                                                                              ni
                                                                                                               j=1
2.2.1. Probability of Unlocking
First, we allow locked agents to unlock with a constant                    where ni is the number of neighbors in the agent’s immediate
probability, as long as they are not covered by other                      neighborhood sharing at least one corner, edge, or side with

Frontiers in Robotics and AI | www.frontiersin.org                     4                                         March 2020 | Volume 7 | Article 25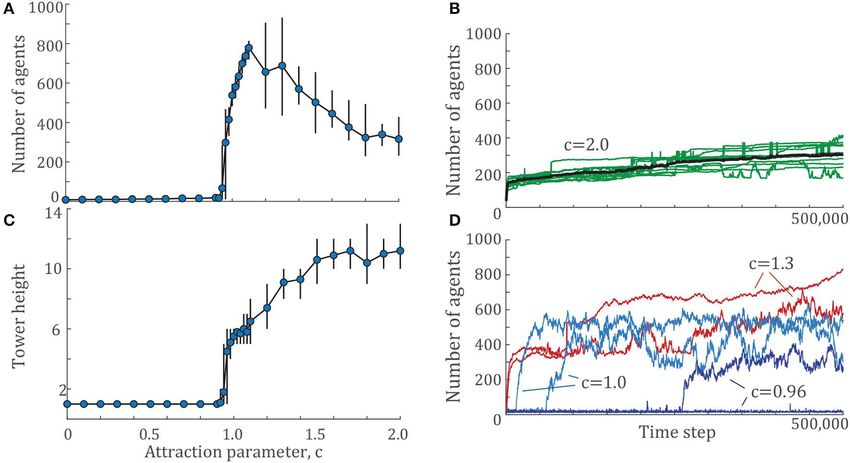
Nave et al.                                                                                                            Attraction in Ant Tower-Building

the agent’s current position, and c is ratio of the magnitude of             we optimize for tower size and height in section 3.5 and identified
attraction relative to the magnitude of randomness. Each agent               a set of parameters where a tower formed of nearly all individuals
moves toward the available voxel most closely aligned with the               in the simulation.
direction of vi . The resulting normalized velocity, v̂i is defined in
(S3) in Appendix 2. Each agent moves into the voxel defined by               3.1. Tower Geometry
the surface height at the resulting pixel.                                   To explore the range of possible tower shapes in the model,
   Software that simulates agents following these modified rules             we sweep the parameter space of the three rule modifications,
in MATLAB is provided in Supplementary Code S8.                              including probability of unlocking Pu , neighbor-locking factor
                                                                             knl , and attraction factor c. Resulting tower properties and
2.3. Set of Modified Behavioral Rules                                        example final configurations from these simulations are shown
With the three modifications mentioned above, we modify the                  in Figure 2. Every data point represents the mean of the largest
first three rules of Phonekeo et al. (2017) and Mlot et al. (2011)           tower’s properties for each of 10 simulations. The left column
into four new local rules:                                                   of the array of tower properties, representing simulations with
                                                                             c = 0, shows that without attraction, towers tend to contain a
1. Do not move if agents are on top of you.                                  small number of agents, a small height, and an especially low
2. Upon reaching available space adjacent to non-moving agents,              height-diameter ratio. These simulations with c = 0 represent the
   stop and lock with them with probability Pl = knl Nn .                    first two rule modifications—individual unlocking and neighbor-
3. If stopped and locked, but uncovered by other agents,                     influenced locking—alone. From the measured tower properties
   spontaneously unlock with probability Pu .                                in Figure 2B, we see the effects of the first two rule modifications
4. If free to move, move generally toward your neighbors with                without attraction. The aggregations with the largest number of
   some random noise as defined by equation (2).                             agents are found in the simulations with parameters knl = 1
                                                                             and Pu = 0, representing the case of no rule modifications
2.4. Measurements of Tower Geometry                                          at all. These aggregations lead to diffusion-limited aggregation
Each simulation is post-processed to measure the geometry of                 as discussed above and shown in Supplementary Video S1. The
each tower in order to determine how tower-like the aggregation              locking and unlocking rule modifications, therefore, decrease the
is. For the final configuration of each simulation, a 2-dimensional          number of agents in the largest aggregation. They do provide
height map is constructed by assigning each pixel in the 2D                  an increase in tower height and the height-diameter ratio. This
projection of the arena a value equal to its maximum height                  increase is modest, however, with the tallest average tower
(Figure 2A). We treat the resulting L × L array of pixel values              height reaching 3.4 agents tall for Pu = 0.002, knl = 12          1
                                                                                                                                                 ,
as an image and apply connected-component analysis (Shapiro,                 corresponding to a height-diameter ratio of 0.314. The largest
1996) to identify different towers—a labeled image is generated              height-diameter ratio occurs for the parameters Pu = 0.02, knl =
where any two non-zero pixels that share a corner or edge have               1, reaching a value of 0.49, with a corresponding average height
the same label. Each agent in the simulation is then given the label         of 2.2 and 19.9 agents in the largest tower for each simulation.
corresponding to its horizontal position within the labeled image.           Finally, the simulations with c = 0 and Pu = 0.2 with
As we are interested in building a single large tower, properties            a small lock factor knl ≤ 18 finish the simulations without
for the tower containing the largest number of agents from each              forming aggregations. Supplementary Video S2 and the c = 0
simulation are reported. Three tower properties are considered:              configuration snapshot in Figure 2C show the dynamics and
number of individuals per tower, maximum tower height, and                   final configuration, respectively, of one such simulation which is
the ratio of the tower height to its equivalent diameter. Equivalent         unable to form aggregations, with parameters Pu = 0.2, knl =
diameter is defined as the diameter of a circle with area equivalent          1
                                                                              26 , c = 0. These tower measurements show that without
to the tower’s base (Figure 2A).                                             attraction, all of the tested parameter sets produce aggregations
                                                                             that remain small in number of individuals, do not reach average
3. RESULTS                                                                   heights more than 3.4 layers, and remain wide and shallow.
                                                                                  When an attractive force is added, larger aggregations form,
To gain an intuition for the effects of the modifications to the             as shown by the center column of Figure 2B for an attraction
tower-building rules discussed in section 2.2, simulations were              ratio of c = 1. As unlock probability Pu increases and lock factor
run over a range of locking and unlocking parameters, knl and                knl decreases, larger aggregations form, with the largest reaching
Pu , across multiple attraction parameters, c, and in section 3.3,           over 500 individuals. However, these largest aggregations have
across varying densities of agents in the system, ρ. We begin with           the smallest height-diameter ratios of this set, showing that these
a parameter sweep across the locking and unlocking parameters                large aggregations are particularly wide, as is visible in the c = 1
and attraction parameter in section 3.1. Then, selecting a pair              example in Figure 2C and Supplementary Video S3. Increasing
of locking and unlocking parameters, we systematically vary                  the attraction ratio to c = 2 finally reveals a more typical tower-
attraction c to show a rapid phase transition, and investigate the           like shape, with taller aggregations, even reaching a height of 11
time dynamics of tower properties, both near and far from the                agents. Interestingly, these taller towers contain fewer agents than
phase transition in section 3.2. In section 3.3, we vary the density         the c = 1 case. The reason for this is clear in the snapshots shown
of agents along with attraction, and observe, in section 3.4, that           in Figure 2C and Supplementary Video S4 —stronger attraction
the center of mass of the towers may continue to move. Finally,              yields more densely-packed towers with larger height-diameter

Frontiers in Robotics and AI | www.frontiersin.org                       5                                          March 2020 | Volume 7 | Article 25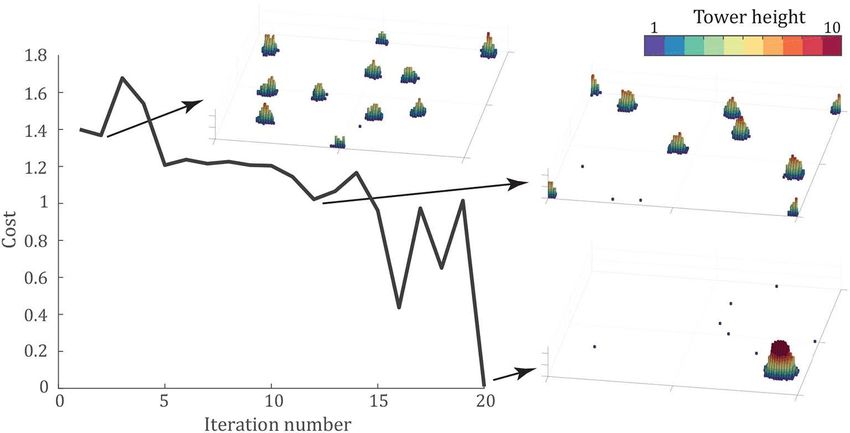
Nave et al.                                                                                                                             Attraction in Ant Tower-Building

 FIGURE 2 | (A) Schematics of tower height and diameter, defined in section 2.4. (B) Average number of agents (orange), tower height (green), and aspect ratio (blue)
 of the largest tower across a variety of parameters. Every data point represents the mean of the properties of the largest tower from each of 10 simulations after
 500,000 time steps. Aspect ratio (blue) is defined as the ratio of tower height to the diameter of a circle with area equal to the tower base. The bordered square
 represents the case of no rule modifications, with parameters Pu = 0, knl = 1, c = 0. Note that the axes of the property comparisons are not linear. (C) Examples of
                                                                                                   1
 the final configuration of agents after 500,000 time steps for c = {0, 1, 2} with Pu = 0.2, knl = 26 . Each panel shows the entire 100 × 100 arena. The videos of the
 simulations that result in these final configurations are shared as Supplementary Videos S2–S4.

ratios—the towers are so dense that multiple, smaller towers form                      individuals in the largest tower decreases (Figure 3A) while the
instead of most individuals aggregating into a single tower.                           height of the largest tower increases (Figure 3C).
                                                                                          In Figure 3B, we show the time dynamics of the number
3.2. Phase Transition and Time Dynamics                                                of agents for tower for two cases, close to the phase transition
of Tower-Building                                                                      and further from it. To illustrate tower growth further from the
The example configurations shown in Figure 2C represent the                            phase transition, Figure 3B shows the time histories of all 10
                                                                  1                                                      1
same set of locking and unlocking parameters, Pu = 0.2, knl = 26                       simulations for Pu = 0.2, knl = 26  , c = 2.0 in green and the mean
across c = {0, 1, 2}. These locking and unlocking parameters give                      of all simulations in black. One of these simulations is shown in
the largest towers for both c = 1 and c = 2, but no aggregations                       Supplementary Video S4. The tower formation process in this
at all for c = 0. To investigate the effects of the attraction                         model demonstrates two time scales: the time scale of initial
ratio c further, we selected a fixed pair of locking and unlocking                     nucleation, and the time scale of growth. Nucleation generally
parameters and explored both the height and number of agents                           occurs within the first 5,000 time steps, the first 1% of each
in the largest tower in the system for a densely sampled range                         simulation. After nucleation, towers often continue to grow
of the attraction parameter c. The results of these simulations are                    slowly through the rest of the simulation. Occasionally, two
shown in Figures 3A,C. The presence of a phase transition occurs                       towers will merge into one, which manifests as a sharp jump in
between c = 0.92 to c = 1.06, where the number of agents in the                        the time histories of Figure 3B. Some of these tower collisions
largest tower climbs from close to 0 to over 700 agents. The results                   last through the rest of the simulation, while others briefly merge
show that as c increases beyond that critical value, the number of                     and then separate again, which shows up as a sharp peak in the

Frontiers in Robotics and AI | www.frontiersin.org                                 6                                                 March 2020 | Volume 7 | Article 25
Nave et al. Attraction in Ant Tower-Building
FIGURE 3 | (A) The number of agents and (C) tower height of the largest tower across a range of attraction parameters, c for a given pair of locking and unlocking
1
values, Pu = 0.2, knl = 26 . Each data point shows the mean value over 10 simulations of 500,000 time steps each. Error bars indicate the maximum and minimum
1
values observed. (B) Example time histories from 10 simulations of Pu = 0.2, knl = 26 , c = 2.0 in green with the mean at each time step shown in black. (D) Time
histories from two examples for several c values near the phase transition, c = {0.96, 1.0, 1.3}.
time history of tower size. The fast nucleation followed by slow the decision-making of individuals. While these parameters
growth seen for c = 2.0 is typical for most simulations in the are testable within multi-agent robotic examples, they do not
present work. represent a variable that can be systematically changed in
However, there are some examples, particularly within the experiments with live fire ants, or robots, in order to test
phase transition regime, for which a critical slowing down occurs. the predictions of the model. To develop a set of testable
Trajectories close to the phase transition are shown in Figure 3D. predictions, we turn to explore the parameter of density
Two trajectories are shown for each of c = {0.96, 1.0, 1.3} with of agents, ρ.
1
Pu = 0.2, knl = 26 . The critical slowing down is particularly In our model, density is varied by changing the number
evident for the c = 0.96 trajectories, where agents aggregate into of individuals in a fixed arena size. The computational
a tower after 250,000 time steps while the other never transitions complexity of the model is O(N 2 ), so practical limits of
out of the disordered state. The c = 1.0 trajectories also show computational time place an upper bound on density we
variation in nucleation time, although in this case, all simulations explore here. In a 100 × 100 × ∞ arena, our test set is
have transitioned to their aggregated state, in which the largest N = {200, 500, 750, 1000, 1500, 2000} which corresponds to
tower contains at least 100 agents. The variation in tower size the densities ρ = {0.02, 0.05, 0.75, 0.1, 0.15, 0.2}. We will use
1
is highest for these examples, varying in size by 200 or more unlocking and locking parameters of Pu = 0.2, knl = 26 for
individuals. There are also cases where the towers continue to consistency with section 3.2.
grow in size, even after 500,000 time steps, which can also be seen The results of these simulations are presented in Figure 4,
in the case of c = 1.3. showing several key differences and similarities across densities.
As discussed in section 2, the simulation time of 500,000 was As density increases, less attraction is required for tower
chosen because nearly all simulations have reached a steady state. formation. The data points highlighted by circles in Figure 4B
The cases highlighted in Figure 3D represent the exceptions, and show the critical attraction ratio c∗ , which represents the
there is no guarantee that these simulations will ever converge. minimum value of c for which the largest aggregation is
The figure shows that c = {0.96, 0.98} are the only cases that give at least 100 individuals, representing the onset of the phase
a mixture of aggregated and non-aggregated results. transition. This result also implies that there exists a critical
density across a range of attraction factors, below which
3.3. The Effect of Density no tower formation occurs. Another key result is that the
The parameters varied up to this point in the model represent largest towers, in terms of number of agents per tower,
entirely behavioral parameters, that is, those associated with occur shortly after the transition from no towers at all.
Frontiers in Robotics and AI | www.frontiersin.org 7 March 2020 | Volume 7 | Article 25Nave et al. Attraction in Ant Tower-Building
FIGURE 4 | (A) Final configurations of various simulations after 500,000 time steps, comprising densities of ρ = {0.02, 0.075, 0.15, 0.2} and attraction factors of
c = {0.5, 1.0, 1.5, 2.0}. Each panel shows the entire 100 × 100 arena. (B) Number of agents, height, and height-diameter ratio over a range of density ρ and attraction
factor c. Note that the vertical axis is not linear. Each data point represents the average properties of the largest tower from 10 simulations after 500,000 time steps.
The circles on the density plot represent the onset of phase transition. The circles indicate the minimum attraction coefficient c for each density at which the largest
tower contains at least 100 agents.
Beyond this point, tower height and ratio increase while diffusion coefficient of each tower. The diffusion coefficient (D)
number of agents decreases. Finally, tower shape remains for a Brownian random walk follows the relationship,
close to constant across densities, particularly in height-
diameter ratio. MSD = 2Dt,
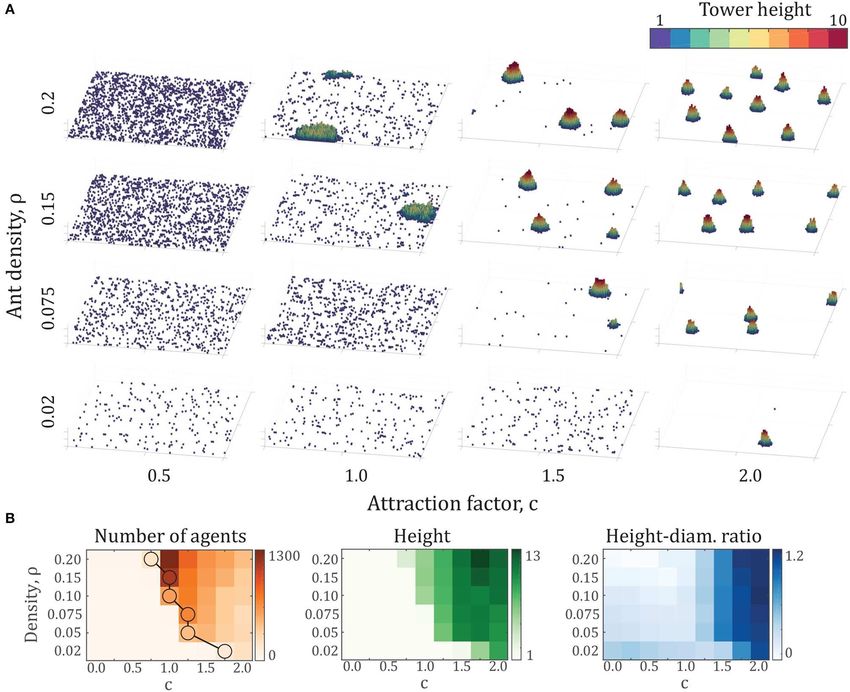
3.4. Moving Towers 1 X
T−t
2 (3)
The introduction of unlocking probability effectively adds MSD = x(t + t0 ) − x(t0 ) ,
T−t
noise to the system (equivalent to higher temperatures in t0 =0
thermodynamic systems), which allows towers to move. Agents
locking on one side of the tower while others unlock on the for each trajectory of length T. Therefore, we measure the mean
other side can lead to tower motion. Traces of the center of square displacement (MSD) of each tower in each simulation
area for each tower from two example simulations may be seen over a variety of times, t = {0, 250, 500, ..., 12, 500}, and perform
in Figure 5B. To quantify this phenomenon, we consider the a linear fit for each tower trajectory. The average slope of these
motion of towers as a Brownian random walk and investigate the lines is then twice the diffusion coefficient (Figure 5A).
Frontiers in Robotics and AI | www.frontiersin.org 8 March 2020 | Volume 7 | Article 25Nave et al. Attraction in Ant Tower-Building
FIGURE 5 | (A) Heat map of diffusion coefficients across the density-attraction space of Figure 4. Each point represents the mean diffusion coefficient calculated by
(3) of all tower trajectories over 10 simulations of 500,000 time steps. The diffusion coefficient is calculated over the first 37,500 time steps of each trajectory. (B)
Example trajectories from two simulations at the density ρ = 0.2 with attraction factors c = {1.0, 2.0}, with points every 250 time steps for 500,000 time steps. (C)
Snapshots in time of the same simulations as in the top-right, showing the motion, shape change, and appearance and disappearance of towers over time. Each
panel shows the entire 100 × 100 arena.
These results show that the maximum diffusion occurs in the higher heights. On the other hand, it may be best to include
highest density regime, and for the lowest attraction parameters as many individuals as possible in the tower, and the optimal
that generate aggregations, particularly for ρ = 0.2 at c = 0.75 tower would be the one that includes every single agent in the
and c = 1.0. These towers have lower height-diameter ratios, as tower. As observed in Phonekeo et al. (2017), fire ants built towers
seen in Figure 4B, which leads to a larger proportion of agents that equally distribute load among the individuals. Therefore, an
on the surface of the tower, and therefore a higher probability optimal tower from their perspective may be one that optimizes
that individuals on the surface will be unlocking. The towers for load distribution. In this section, we use a genetic algorithm
at c = 0.75 have a smaller number of agents than those of to explore optimal tower building considering each of these
c = 1.0, which leads to an even higher proportion of individuals optimization targets.
on the surface. This is illustrated in Figure 5C, showing the time- To search for an optimal tower, we employ the Covariance
evolution of tower configurations for two example simulations Matrix Adaptation-Evolutionary Strategy (CMA-ES) algorithm
(see also Supplementary Videos S5, S6). developed by Hansen et al. (2003). This algorithm randomly
generates parameter sets within the search space and evaluates
3.5. Tower Optimization a cost function for each parameter set. From the results of
One question that still remains is, what parameter values are this function evaluation, it updates the covariance matrix to
optimal for tower building? To answer this, we need to think expand in the direction of the most optimal value. Using
about what may constitute optimal. It may be that the optimal the updated covariance matrix, the algorithm generates new
tower reaches as high as possible, which would, in practice, allow parameter sets and repeats the process until convergence,
as many agents as possible to attach to a support structure. Or, generally defined as finding a parameter set with a cost function
for robotics applications, this would allow the tower to reach below some threshold.
Frontiers in Robotics and AI | www.frontiersin.org 9 March 2020 | Volume 7 | Article 25Nave et al. Attraction in Ant Tower-Building
FIGURE 6 | Optimization of the cost function given by (4) using the CMA-ES algorithm (Hansen et al., 2003). Panels show the final configuration of the best simulation
at iterations 2, 12, and 20 after 50,000 time steps. Each panel shows the entire 100 × 100 arena. The algorithm converges in 20 iterations, to the parameter set
Pu = 0.938, knl = 0.029, and c = 2.56, with the optimal configuration shown in the bottom-right.
We applied the CMA-ES algorithm to the tower-building A video of one simulation with these parameters is shown in
model introduced above, using the average final properties of Supplementary Video S7.
three trials for each parameter set across 10 parameter sets The CMA-ES optimization code of Hansen et al. (2003)
per iteration. For the optimization, we choose a cost function applied to the present model may allow future research and
defining the optimal tower as the largest tower, both in terms consideration of other conditions of optimal tower-building. For
of tower height and number of individuals within the tower. example, when designing a robotic system where each individual
Therefore, the cost function is given by, robot has a maximum load capability, it may be necessary to
calculate the maximum load experienced by an individual in the
Ntower htower tower and add that term to cost function.
f = 1− + max 0, 1 − , (4)
Nmax hmax
where Ntower and htower represent the number of individuals and 4. DISCUSSION
height of the largest tower, Nmax is the number of individuals in
the simulation, and hmax is a prescribed maximum height. The In this work, we have extended a previously proposed set of local
height term is included to ensure that the results are effectively rules to replicate the tower-building behavior of red imported
tower-like, preventing the optimal tower from simply achieving a fire ants, Solenopsis invicta. This model and its insights will
large, wide aggregation. From the results of the attraction sweep allow for the design of control strategies for tower-building
in Figure 3A, we observe that hmax = 14 is an approximate upper swarm robotics and greater insight into the collective behavior of
bound on tower height, so it is therefore chosen as hmax for the social insects. The results presented above show that individuals
purpose of this optimization. Note that a tower height of htower ≥ moving under the influence of local attraction are able to form
hmax results in a zero second term, and the simulation therefore large towers. We find that an attractive force is necessary for
allows for a taller tower. For the purposes of optimization, we significant tower-building and show the impacts of this attractive
reduce the simulation time to 50,000 time steps. This serves the force over a range of locking and unlocking parameters as well
practical role of making iterated simulation possible, but also as a range of densities. We find that the system contains a
places an effective minimization of convergence time. Therefore, sudden phase transition as the attraction parameter is varied,
we are optimizing for a tower that maximizes both height and and that this phase transition is density-dependent. Finally,
number of agents quickly (within 50,000 time steps). the largest towers, in both height and number of individuals,
Figure 6 shows the progression of the minimum cost at occur with a combination of very strong attraction and highly
each iteration of the CMA-ES algorithm along with snapshots probable unlocking.
of intermediate results to show the algorithm’s progress. The On the other hand, without attraction, no towers
optimal tower occurs for the parameters, Pu = 0.938, knl = form, as shown in the c = 0 case of Figure 2 and
0.029, and c = 2.56, which led to a tower of 993 agents Supplementary Video S2 and discussed further in the
reaching 16 agents tall after 50,000 time steps. The final Appendix 1 and Figure S1. The effective force of attraction
cost function, averaged over three trials, was f = 0.01. may also be thought of as a desire of the ants to climb, because
Frontiers in Robotics and AI | www.frontiersin.org 10 March 2020 | Volume 7 | Article 25Nave et al. Attraction in Ant Tower-Building
the tallest available square to move toward will also have the manner similar to, for example, the M-blocks of Romanishin et al.
most neighbors. (2015) or the Roombots of Spröwitz et al. (2014), which have
Near the phase transition, a critical slowing down occurs, and also been proposed for bridge-building applications (Nguyen-
there are parameter sets that do not result in tower formation Duc et al., 2019). The tower is a ubiquitous structure in
within a simulation time of 500,000 time steps. This critical building, and designing rigorous control strategies for tower-
slowing down is reminiscent of other examples of systems with building represents a fundamental starting point toward fully
phase transitions, such as the spin-glass model, the Ising model, autonomous, locally-sensed swarm building applications. In
and molecular dynamics models (Dasgupta et al., 1979; Hu, practice, a tower of robots could be useful in the case of,
2013). Further from the phase transition (c ≫ c∗ ), towers form for example, seeing over obstacles, providing scaffolding for
rapidly, but the possibility exists for these towers to encounter climbing, or clearly marking a location of interest. Robotic tower-
one another and merge into larger towers. The number of builders would need to be have the following capabilities: sense
individuals in the tower and tower motion are largest just after neighbors, climb onto and off of one another, and support
the phase transition, but the largest height occurs with stronger appropriate loads. At the moment, there is no robot with
attraction. Phase transitions have previously been observed all of these capabilities, and we believe that this would be
experimentally and computationally in other ant and insect a promising avenue for future robotics research. The control
systems, such as in Pharaoh’s ant foraging (Beekman et al., 2001) strategies introduced in the present study could also be further
and in marching desert locusts (Buhl et al., 2006). modified to more closely replicate experimentally-observed fire
Our results also illustrate the exploration-exploitation trade- ant behavior, developing a control strategy for interacting with a
off, which balances attraction forces with random movement and support structure.
unlocking events. Following this trade-off, stronger attraction
may lead to higher towers with fewer individuals, as the attraction
DATA AVAILABILITY STATEMENT
rapidly draws individuals from the edge of the aggregation
toward the center of the tower, and therefore upward. This All datasets generated for this study are available upon request.
balance of unlock probability and attraction is found through
the combined optimization of number of individuals and tower
height, which discovered that with an unlock probability of Pu = AUTHOR CONTRIBUTIONS
0.938 and an attraction of c = 2.56, it is possible to include nearly
NM, JC, TS, and JL developed the initial version of the present
all of the individuals in a simulation, with a tower reaching a
model as a project in a course taught by OP. GN refined
height of 16 layers. This large unlock probability of the largest
the model, conducted the simulations, and wrote and edited
towers in our simulations connects with the observation from
the manuscript. OP supervised the research and edited the
Phonekeo et al. (2017) that, in the experimental system, the
manuscript.
fire ants are constantly rebuilding their tower and circulating
ants throughout the tower. The work of Phonekeo et al. (2017)
showed that fire ants build towers of constant load, and future FUNDING
optimization work could incorporate the load experienced by
each individual to achieve towers that prioritize stability. More The study was conducted with institutional funding.
refined ant models may also incorporate the mechanics and
viscoelastic properties of fire ant aggregations (Tennenbaum ACKNOWLEDGMENTS
et al., 2016), which are observed to change depending on the
number of active ants, such as the free ants included in the We thank Prof. David L. Hu, and members of the Peleg lab
present model (Tennenbaum and Fernandez-Nieves, 2017). for insightful discussions, and the BioFrontiers Institute for the
The results of the parameter sweep in density values showed utmost support.
both similarities and differences across densities. In general, for a
fixed attraction ratio c, the tower height-diameter ratio remains
fairly constant, even as the numbers of agents per tower and
SUPPLEMENTARY MATERIAL
tower height vary. The biggest difference across densities is the The Supplementary Material for this article can be found
change in critical attraction parameter, c∗ . These observations online at: https://www.frontiersin.org/articles/10.3389/frobt.
lead to testable hypotheses for animal experiments. Below a 2020.00025/full#supplementary-material
certain density threshold, tower formation should cease, due to
Supplementary Video S1 | The diffusion-limited aggregation case of the model,
the move past the critical attraction. Additionally, the height- with Pu = 0, knl = 1, c = 0. The video is shown at a speed of 120 time steps
diameter ratio should remain constant across a large range of per second.
densities. Finally, we have shown that the towers built in our
Supplementary Video S2 | Simulation in which no aggregations form, with
simulations move over time, with a diffusion coefficient that is 1
Pu = 0.2, knl = 26 , c = 0. The video is shown at a speed of 10,000 time steps
dependent on both attraction and density, and should be taken per second.
into account when considering practical application to robotics. Supplementary Video S3 | Simulation in which large, wide aggregations form,
This work also lays the groundwork for future robotic studies, 1
with Pu = 0.2, knl = 26 , c = 1. The video is shown at a speed of 10,000 time
where robots are able to built towers out of themselves in a steps per second.
Frontiers in Robotics and AI | www.frontiersin.org 11 March 2020 | Volume 7 | Article 25Nave et al. Attraction in Ant Tower-Building
Supplementary Video S4 | Simulation in which many steep towers form, with Supplementary Video S7 | Simulation of the results of tower optimization, with
1
Pu = 0.2, knl = 26 , c = 2. The video is shown at a speed of 10,000 time steps Pu = 0.938, knl = 0.029, c = 2.56. The video is shown at a speed of 2,500 time
per second. steps per second.
Supplementary Video S5 | Simulation with large, wide moving aggregations in a Supplementary Code S8 | Three MATLAB code files, included in a .zip file.
1
dense environment, with Pu = 0.2, knl = 26 , c = 1, and N = 2, 000 individuals. TowerSimulation.m provides a function to run a single simulation,
The video is shown at a speed of 10,000 time steps per second. TowerAnalysis.m provides the analysis of the resulting
Supplementary Video S6 | Simulation with many steep moving aggregations in a towers, and TowerVideo.m provides the code used to visualize the
1 results of each simulation. A maintained repository of these codes is available at:
dense environment, with Pu = 0.2, knl = 26 , c = 2, and N = 2, 000 individuals.
The video is shown at a speed of 10,000 time steps per second. https://github.com/peleg-lab/TowerBuilding.
REFERENCES Goss, S., Aron, S., Deneubourg, J.-L., and Pasteels, J. M. (1989). Self-
organized shortcuts in the Argentine ant. Naturwissenschaften 76, 579–581.
Ame, J.-M., Rivault, C., and Deneubourg, J.-L. (2004). Cockroach doi: 10.1007/BF00462870
aggregation based on strain odour recognition. Anim. Behav. 68, 793–801. Groß, R., Tuci, E., Dorigo, M., Bonani, M., and Mondada, F. (2006). “Object
doi: 10.1016/j.anbehav.2004.01.009 transport by modular robots that self-assemble,” in Proceedings 2006 IEEE
Anderson, C., Theraulaz, G., and Deneubourg, J.-L. (2002). Self-assemblages in International Conference on Robotics and Automation, 2006. ICRA 2006
insect societies. Insect. Soc. 49, 99–110. doi: 10.1007/s00040-002-8286-y (Orlando, FL: IEEE), 2558–2564.
Bak, P. (1996). How Nature Works: The Science of Self-organized Criticality. New Hamann, H. (2018). Swarm Robotics: A Formal Approach. Berlin: Springer.
York, NY: Springer-Verlag. Hansen, N., Müller, S. D., and Koumoutsakos, P. (2003). Reducing
Beekman, M., Sumpter, D. J., and Ratnieks, F. L. (2001). Phase transition between the time complexity of the derandomized evolution strategy with
disordered and ordered foraging in pharaoh’s ants. Proc. Natl. Acad. Sci. U.S.A. covariance matrix adaptation (CMA-ES). Evol. Comput. 11, 1–18.
98, 9703–9706. doi: 10.1073/pnas.161285298 doi: 10.1162/106365603321828970
Bochynek, T., Tanner, J. L., Meyer, B., and Burd, M. (2017). Parallel foraging cycles Hu, C.-K. (2013). Slow dynamics in proteins and polymer chains. AIP Conf. Proc.
for different resources in leaf-cutting ants: a clue to the mechanisms of rhythmic 1518, 541–550. doi: 10.1063/1.4794631
activity. Ecol. Entomol. 42, 849–852. doi: 10.1111/een.12437 Hughes, D., Heckman, C., and Correll, N. (2019). Materials that make robots
Bonabeau, E., Dorigo, M., and Théraulaz, G. (1999). Swarm Intelligence: From smart. Int. J. Robot. Res. 38, 1338–1351. doi: 10.1177/0278364919856099
Natural to Artificial Systems. New York, NY: Oxford University Press. Jeanson, R., Rivault, C., Deneubourg, J.-L., Blanco, S., Fournier, R., Jost, C., et al.
Bonabeau, E., Guérin, S., Snyers, D., Kuntz, P., and Theraulaz, G. (2000). Three- (2005). Self-organized aggregation in cockroaches. Anim. Behav. 69, 169–180.
dimensional architectures grown by simple ‘stigmergic’ agents. Biosystems 56, doi: 10.1016/j.anbehav.2004.02.009
13–32. doi: 10.1016/S0303-2647(00)00067-8 Kastberger, G., Weihmann, F., and Hoetzl, T. (2011). “Self-assembly processes in
Brambilla, M., Ferrante, E., Birattari, M., and Dorigo, M. (2013). Swarm robotics: honeybees: the phenomenon of shimmering,” in Honeybees of Asia eds H. R.
a review from the swarm engineering perspective. Swarm Intell. 7, 1–41. Hepburn and S. E. Radloff (Berlin; Heidelberg: Springer-Verlag), 397–443.
doi: 10.1007/s11721-012-0075-2 Kerth, G. (2008). Causes and consequences of sociality in bats. Bioscience 58,
Buffin, A., and Pratt, S. (2016). Cooperative transport by the ant novomessor 737–746. doi: 10.1641/B580810
cockerelli. Insect. Soc. 63, 429–438. doi: 10.1007/s00040-016-0486-y Levine, H., Tsimring, L., and Kessler, D. (1997). Computational modeling of
Buhl, J., Sumpter, D. J., Couzin, I. D., Hale, J. J., Despland, E., Miller, E. R., et al. mound development in dictyostelium. Phys. D Nonlin. Phenom. 106, 375–388.
(2006). From disorder to order in marching locusts. Science 312, 1402–1406. doi: 10.1016/S0167-2789(97)00038-9
doi: 10.1126/science.1125142 Lioni, A., Sauwens, C., Theraulaz, G., and Deneubourg, J.-L. (2001).
Couzin, I. D., and Franks, N. R. (2003). Self-organized lane formation and Chain formation in Oecophylla longinoda. J. Insect Behav. 14, 679–696.
optimized traffic flow in army ants. Proc. R. Soc. Lond. B Biol. Sci. 270, 139–146. doi: 10.1023/A:1012283403138
doi: 10.1098/rspb.2002.2210 Mishra, S., Tunstrøm, K., Couzin, I. D., and Huepe, C. (2012). Collective
Couzin, I. D., and Krause, J. (2003) “Self-organization and collective behavior dynamics of self-propelled particles with variable speed. Phys. Rev. E 86:011901.
in vertabrates,” in Advances in the Study of Behavior eds P. J. B. Slater, J. S. doi: 10.1103/PhysRevE.86.011901
Rosenblatt, C. T. Snowdon, and T. J. Roper (San Diego, CA: Academic Press), Mlot, N. J., Tovey, C., and Hu, D. L. (2012). Dynamics and shape of large fire ant
32, 1–75. rafts. Commun. Integr. Biol. 5, 590–597. doi: 10.4161/cib.21421
Dasgupta, C., Ma, S.-K., and Hu, C.-K. (1979). Dynamic properties Mlot, N. J., Tovey, C. A., and Hu, D. L. (2011). Fire ants self-assemble into
of a spin-glass model at low temperatures. Phys. Rev. B 20:3837. waterproof rafts to survive floods. Proc. Natl. Acad. Sci. U.S.A. 108, 7669–7673.
doi: 10.1103/PhysRevB.20.3837 doi: 10.1073/pnas.1016658108
Del Dottore, E., Sadeghi, A., Mondini, A., Mattoli, V., and Mazzolai, B. (2018). Navarro, R. M., and Fielding, S. M. (2015). Clustering and phase behaviour of
Toward growing robots: a historical evolution from cellular to plant-inspired attractive active particles with hydrodynamics. Soft Matter 11, 7525–7546.
robotics. Front. Robot. AI 5:16. doi: 10.3389/frobt.2018.00016 doi: 10.1039/C5SM01061F
Deneubourg, J. L., Grégoire, J. C., and Le Fort, E. (1990). Kinetics of larval Nguyen-Duc, J., Mutlu, M., Hauser, S., Barnerdino, A., and Ijspeert, A. (2019).
gregarious behavior in the bark beetle Dendroctonus micans (coleoptera: “Cooperative bridge building by self-reconfigurable modular robots based on
Scolytidae). J. Insect Behav. 3, 169–182. doi: 10.1007/BF01417910 ants’ stigmergic behaviour,” in 9th International Symposium on Adaptive Motion
Deneubourg, J. L., Lioni, A., and Detrain, C. (2002). Dynamics of aggregation of Animals and Machines (AMAM 2019) (Lausanne).
and emergence of cooperation. Biol. Bull. 202, 262–267. doi: 10.2307/ Panagiotou, A., Curtin, M., Toki, H., Scott, D., and Siemens, P. (1984).
1543477 Experimental evidence for a liquid-gas phase transition in nuclear systems.
Dorigo, M., Bonabeau, E., and Theraulaz, G. (2000). Ant algorithms and stigmergy. Phys. Rev. Lett. 52:496. doi: 10.1103/PhysRevLett.52.496
Future Gen. Comput. Syst. 16, 851–871. doi: 10.1016/S0167-739X(00) Phonekeo, S., Mlot, N., Monaenkova, D., Hu, D. L., and Tovey, C. (2017).
00042-X Fire ants perpetually rebuild sinking towers. R. Soc. Open Sci. 4:170475.
Franks, N. R. (1989). Thermoregulation in army ant bivouacs. Physiol. Entomol. doi: 10.1098/rsos.170475
14, 397–404. doi: 10.1111/j.1365-3032.1989.tb01109.x Reid, C. R., Lutz, M. J., Powell, S., Kao, A. B., Couzin, I. D., and Garnier,
Garnier, S., Murphy, T., Lutz, M., Hurme, E., Leblanc, S., and Couzin, I. D. S. (2015). Army ants dynamically adjust living bridges in response to
(2013). Stability and responsiveness in a self-organized living architecture. PLoS a cost-benefit trade-off. Proc. Natl. Acad. Sci. U.S.A. 112, 15113–15118.
Comput. Biol. 9:e1002984. doi: 10.1371/journal.pcbi.1002984 doi: 10.1073/pnas.1512241112
Frontiers in Robotics and AI | www.frontiersin.org 12 March 2020 | Volume 7 | Article 25You can also read