Effectiveness of Fluorescent Viability Assays in Studies of Arctic Cold Seep Foraminifera
←
→
Page content transcription
If your browser does not render page correctly, please read the page content below
ORIGINAL RESEARCH
                                                                                                                                          published: 09 March 2021
                                                                                                                                   doi: 10.3389/fmars.2021.587748

                                            Effectiveness of Fluorescent Viability
                                            Assays in Studies of Arctic Cold
                                            Seep Foraminifera
                                            Katarzyna Melaniuk*
                                            Centre for Arctic Gas Hydrate, Environment, and Climate CAGE, Department of Geosciences, UiT The Arctic University
                                            of Norway, Tromsø, Norway

                                            Highly negative δ13 C values in fossil foraminifera from methane cold seeps have been
                                            proposed to reflect episodes of methane release from gas hydrate dissociation or free
                                            gas reservoirs triggered by climatic changes in the past. Because most studies on
                                            live foraminifera are based on the presence of Rose Bengal staining, that colors the
                                            cytoplasm of both live and recently dead individuals it remains unclear if, and to what
                                            extent live foraminifera incorporate methane-derived carbon during biomineralization,
                            Edited by:      or whether the isotopic signature is mostly affected by authigenic overgrowth. In this
                        Daniela Zeppilli,   paper, modern foraminiferal assemblages from a gas hydrate province Vestnesa Ridge
  Institut Français de Recherche pour
   l’Exploitation de la Mer (IFREMER),
                                            (∼1,200 m water depth, northeastern Fram Strait) and from Storfjordrenna (∼400 m
                                 France     water depth in the western Barents Sea) is presented. By using the fluorescent
                         Reviewed by:       viability assays CellTrackerTM Green (CTG) CMFDA and CellHunt Green (CHG) together
                    Clara F. Rodrigues,
                                            with conventional Rose Bengal, it was possible to examine live and recently dead
          University of Aveiro, Portugal
                      Alessandra Asioli,    foraminifera separately. Metabolically active foraminifera were shown to inhabit methane-
   Institute of Marine Sciences (CNR),      enriched sediments at both investigated locations. The benthic foraminiferal faunas
                                    Italy
                                            were dominated by common Arctic species such as Melonis barleeanus, Cassidulina
                 *Correspondence:
                  Katarzyna Melaniuk
                                            neoteretis, and Nonionellina labradorica. The combined usage of the fluorescence probe
           Katarzyna.Melaniuk@uit.no        and Rose Bengal revealed only minor shifts in species compositions and differences in
                                            ratios between live and recently dead foraminifera from Storfjordrenna. There was no
                 Specialty section:
       This article was submitted to        clear evidence that methane significantly affected the δ13 C signature of the calcite of
Deep-Sea Environments and Ecology,          living specimens.
             a section of the journal
         Frontiers in Marine Science        Keywords: CellTrackerTM Green CMFDA, Rose Bengal, gas hydrate, Vestnesa Ridge, Storfjordrenna, cold seep,
                                            Arctic
            Received: 27 July 2020
        Accepted: 15 February 2021
         Published: 09 March 2021
                                            INTRODUCTION
                              Citation:
     Melaniuk K (2021) Effectiveness
                                            Due to the present climate warming, the Arctic region is undergoing remarkably rapid
        of Fluorescent Viability Assays
        in Studies of Arctic Cold Seep
                                            environmental changes, termed the Arctic amplification (IPCC, 2013; Box et al., 2019). The increase
                          Foraminifera.     in global temperature and atmospheric CO2 has severe consequences for the Arctic Ocean, causing
            Front. Mar. Sci. 8:587748.      among others ocean acidification (Amap Assessment, 2018), loss of sea ice (Stroeve et al., 2012),
    doi: 10.3389/fmars.2021.587748          and increase in primary production (Arrigo and van Dijken, 2011). The ocean warming also impose

Frontiers in Marine Science | www.frontiersin.org                                1                                           March 2021 | Volume 8 | Article 587748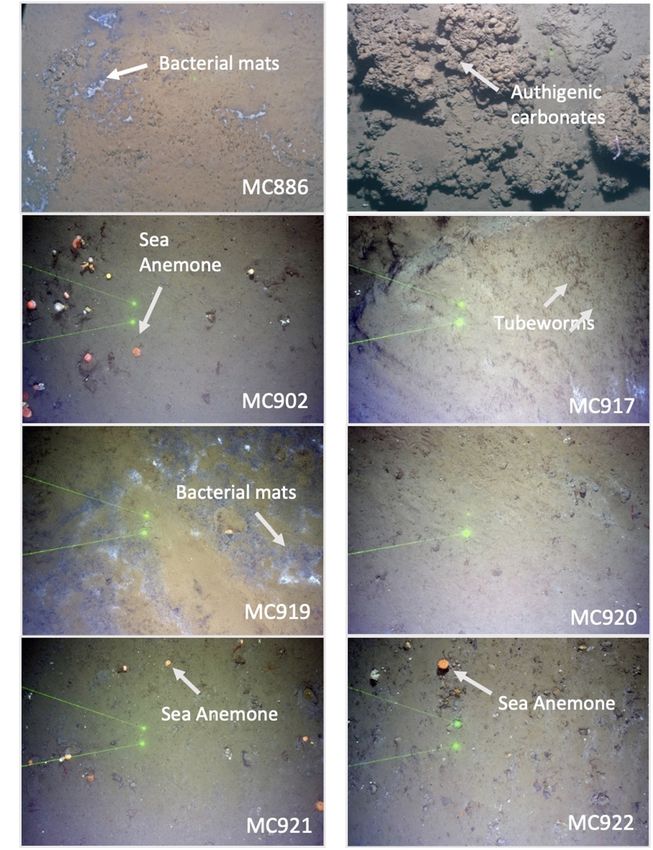
Melaniuk                                                                                                                    Cold Seep Foraminifera

a high risk of release of methane from geological reservoirs               dioxide (CO2 ) or bicarbonate (HCO3 2− ), causing changes in
(IPCC, 2007; Phrampus and Hornbach, 2012) as large amounts                 the carbon isotopic signature of pore water i.e., changes in the
of methane are stored on Arctic continental margins in the                 microhabitat (e.g., Whiticar, 1999; Rathburn et al., 2003; Treude
form of pressure-temperature sensitive gas hydrates (e.g., Maslin          et al., 2007).
et al., 2010; Ruppel and Kessler, 2017). Gas hydrate is a                      Since benthic foraminifera construct their tests by
widespread, ice-like substance formed when water and methane               incorporating carbon from the surrounding pore water or
or other hydrocarbon gases combine in marine sediments                     bottom water and from the intracellular storage of inorganic
under high pressure (3–5 MPa) and temperatures below ∼25◦ C                carbon (e.g., de Nooijer et al., 2009; Toyofuku et al., 2017), the
(e.g., Kvenvolden, 1993). Pressure release and/or increase in              foraminiferal calcite supposedly records the isotopic signal of
temperature can cause destabilization of gas hydrate reservoirs,           ambient waters (i.e., pore water or interstitial water in which
resulting in a release of free methane gas into the sediment               the foraminifera live) at the time of calcification (e.g., Rathburn
and/or water column (e.g., Archer et al., 2009; Maslin et al.,             et al., 2003; Panieri and Sen Gupta, 2008). Alternatively,
2010). Several studies have implied a link between the release             foraminifera might absorb the 13 C-depleted carbon via the food
of methane from geological reservoirs and climate change                   web (Panieri, 2006) or by feeding on, or living in symbiosis
during the Quaternary and the Paleocene periods (e.g., Wefer               with, methanotrophic bacteria, as suggested by Hill et al. (2004).
et al., 1994; Dickens et al., 1997; Smith et al., 2001). It is             Some studies show that the δ13 C measured in tests of living
feared that ongoing climate change can trigger destabilization             foraminifera collected from active seeps are not markedly
of gas hydrate reservoirs and methane release into the water               lower than those from non-seep sites, indicating that living
column and eventually to atmosphere (Ruppel and Kessler,                   foraminifera might not be able to record the episodes of methane
2017). Therefore, it is crucial to understand the fate of                  release (e.g., Rathburn et al., 2003; Torres et al., 2003; Etiope
methane in marine sediments in order to understand the                     et al., 2014; Herguera et al., 2014; Dessandier et al., 2020).
potential impact of methane release to future climate and                  Simultaneously, numerous other studies indicate that methane
Arctic ecosystems.                                                         has an effect on isotopic signatures of “live” foraminifera
    For the last decades, the carbon isotopic signature δ13 C of           (Rose Bengal stained; e.g., Hill et al., 2004; Mackensen
benthic foraminifera has been commonly used as a proxy in                  et al., 2006; Panieri, 2006; Wollenburg and Mackensen, 2009;
the reconstruction of productivity and origin and ventilation              Wollenburg et al., 2015).
of water masses in the past (e.g., Gooday, 1994, 2003; Smart                   Studies of live foraminiferal assemblages are commonly
et al., 1994; Rohling and Cooke, 1999; Murray, 2006; Ravelo                based on Rose Bengal staining, presumably marking specimens
and Hillaire-Marcel, 2007). Recent studies have shown that the             that were alive at the sampling time. Stained specimens can
δ13 C incorporated into the calcareous (CaCO3 ) tests of benthic           include both live and recently dead individuals (Bernhard
foraminifera can record episodes of release of methane in the              et al., 2006; Figueira et al., 2012) thus, it is still not
past (e.g., Torres et al., 2003; Millo et al., 2005; Martin et al.,        clear if live foraminifera have recorded the 13 C signal that
2010; Schneider et al., 2017; Sztybor and Rasmussen, 2017). The            comes from incorporation of carbon from methane in their
δ13 C in the shells of some fossil benthic foraminifera can be             shells during calcification. Compared to the conventional
lower than −10h (e.g., Hill et al., 2004; Schneider et al., 2017;          Rose Bengal, the CellTrackerTM Green (CTG) CMFDA (5-
Sztybor and Rasmussen, 2017), while the signature of calcite of            chloromethylfluorescein diacetate; Thermo Fisher Scientific) and
living foraminifera generally do not exceed −7.5h (Mackensen               CellHunt Green (CHG) (SETAREH biotech, LLC) probes are
et al., 2006; Wollenburg et al., 2015), it remains unclear if, and         reactive with internal cell components and gives a green-
to what extent live benthic foraminifera incorporate methane-              fluorescent coloring of the cytoplasm, indicating metabolically
derived carbon during biomineralization, or whether the isotopic           active foraminiferal specimens. The combined usage of the
signature is mostly affected by authigenic overgrowth from                 fluorogenic probes together with the Rose Bengal staining
carbonate precipitation.                                                   can be used to separate live foraminifera from recently dead
    Modern methane cold seeps can provide valuable information             individuals, and thus be a useful tool to build up a more
about changes in seepage intensity and the possible effects of             detailed picture of benthic foraminiferal distribution patterns and
methane seepage on the distribution patterns of live foraminifera          ecology. It might be especially useful in studies of heterogeneous
and the isotopic composition of their tests. The δ13 C of calcareous       and variable environments such as cold seeps, which depend
benthic foraminifera is determined by species-specific vital               on the highly variable flux of methane and can evolve and
effects (i.e., intracellular metabolic processes; e.g., Grossman,          change rapidly over time (Levin, 2005; Cordes et al., 2006;
1987; McCorkle et al., 1990; Mackensen et al., 2006) and                   Åström et al., 2020).
their microhabitat (e.g., sedimentary organic matter, dissolved                This paper presents results of a study of live benthic
inorganic carbon content, temperature, and re-mineralization;              foraminifera from a gas hydrate province on Vestnesa Ridge
e.g., McCorkle et al., 1985; Fontanier et al., 2006). Within cold          (∼1,200 m water depth; western Svalbard margin) and from gas
seeps, the release of methane from the seafloor is partly controlled       hydrate “pingo” structures from Storfjordrenna (∼400 m water
by sulfate-dependent anaerobic oxidation of methane (AOM)                  depth) in the western Barents Sea (Figure 1). The aims of the
and aerobic methane oxidation (MOx; Treude et al., 2007;                   study are to (1) identify species compositions of the benthic
Knittel and Boetius, 2009). Thus, as a product of these microbial          foraminiferal faunas in these Arctic methane seeps and (2) to
activities, 13 C-depleted carbon is released in the form of carbon         compare the carbon isotopic signature (δ13 C) in the tests of

Frontiers in Marine Science | www.frontiersin.org                      2                                     March 2021 | Volume 8 | Article 587748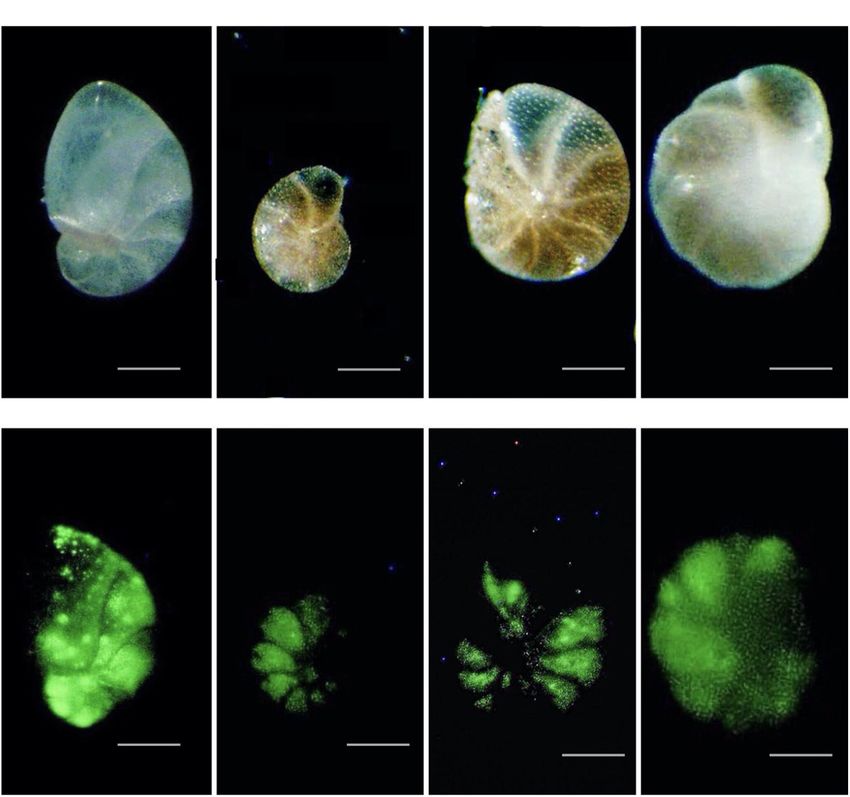
Melaniuk                                                                                                                                       Cold Seep Foraminifera

metabolically active (CTG or CHG labeled) foraminifera, with                          the gateway between the North Atlantic Ocean and the Arctic
Rose Bengal stained and with unstained tests (empty tests), to                        Ocean. This region is characterized by large annual fluctuations
determine if methane seepage has any significant effects on the                       in sea-ice cover. Relatively warm (3–6◦ C), saline (S < 35.4 psu),
isotopic signatures of calcite of live benthic foraminifera.                          and nutrient-rich Atlantic water pass through the Fram Strait
                                                                                      into the Arctic Ocean carried by the West Spitzbergen Current
                                                                                      (WSC) (e.g., Manley, 1995; Rudels et al., 2000; Walczowski
MATERIALS AND METHODS                                                                 et al., 2005). The southwestern part of the Vestnesa Ridge is
                                                                                      characterized by the presence of several active pockmarks (i.e.,
Study Area                                                                            shallow seabed depressions) where methane-rich fluids seep
Vestnesa Ridge is located northwest of Svalbard in the eastern                        from gas hydrate and free gas reservoirs (Bünz et al., 2012;
Fram Strait and is an approximately 100 km long sediment                              Figure 1B). The most active pockmarks, “Lomvi” and “Lunde,”
drift at water depths of ∼1,200–1,300 m. The Fram Strait forms                        are approximately 10–15 m deep depressions with diameters

  FIGURE 1 | Maps showing (A) sampling location, indicated by stars: yellow- Vestnesa Ridge; green- Control site 7,808; orange- Storfjordrenna pingos; (B)
  bathymetry of Vestnesa Ridge (swath bathymetry from Hustoft et al., 2009); control site (C) and bathymetry of Storfjordrenna pingos [(D); swath bathymetry from
  Serov et al. (2017)].

Frontiers in Marine Science | www.frontiersin.org                                 3                                            March 2021 | Volume 8 | Article 587748
Melaniuk Cold Seep Foraminifera
are presently active and show active methane seepage in the
form of acoustically detected gas/bubble streams (i.e., acoustic
flares) around the summits and one is in a “post-active stage”
and presently inactive (Hong et al., 2017; Serov et al., 2017).
Elevated concentrations of methane (mostly of thermogenic
origin) have been detected in both sediments and bottom
waters at GHP1, and gas hydrates were recovered in sediment
cores (Hong et al., 2017; Carrier et al., 2020). The δ13 CDIC
values of pore water for the top of GHP1 (MC902) reached
−24.2h (Dessandier et al., 2020). Seabed images acquired with
a Multicorer-TowCam during the CAGE17-2 cruise revealed the
presence of white and gray bacterial mats as well as sediments
colonized by chemosynthetic Siboglinidae tubeworms, biota well
known to indicate active hydrocarbon seepage (Niemann et al.,
2006; Treude et al., 2007; Figure 2). The megafauna community
associated with cold seeps has been previously documented
at the Storfjordrenna by Åström et al. (2016) and Sen et al.
(2018).
Sampling
Sediment samples were collected during the CAGE 15-2 cruise
in May 2015 to Vestnesa Ridge from the sites of active methane
emission, the Lomvi and Lunde pockmarks, and at site 7,808
located south-east from the Vestnesa Ridge as a control site where
no methane seepage occurs (Figures 1B,C). During CAGE cruise
17-2 in June 2017 to Storfjordrenna pingo area, several samples
were taken from the active gas hydrates pingo (GHP1) along a
transect from the top the pingo toward its edge (Figure 1D).
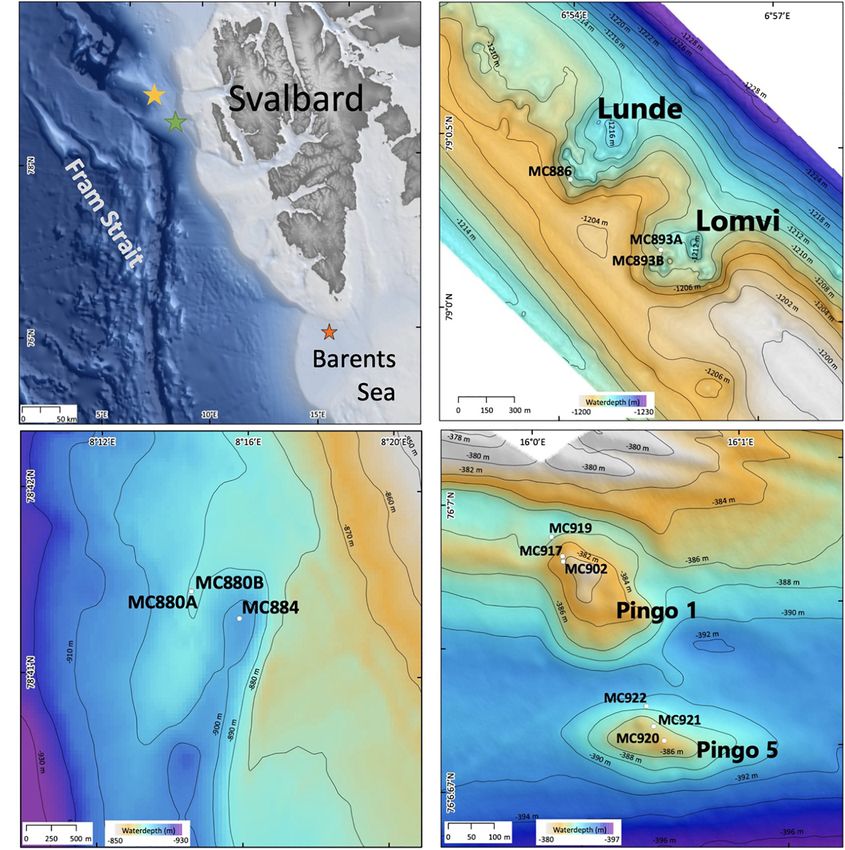
FIGURE 2 | Seafloor images from the Vestnesa Ridge MC886 Lunde For comparison, the inactive GHP5 was sampled in a similar
pockmark, MC893 Lomvi pockmark showing gray bacterial mats (A) and
authigenic carbonates (B), and from Storfjordrenna pingos site from active site
manner (Figure 1D).
gas hydrate pingo 1 (GHP1; MC902—MC919) showing tubeworms (D), gray The samples from both Vestnesa Ridge and the pingo area
bacterial mats (E) and sea anemones (C), and from the inactive site GHP 5 in Storfjordrenna (Table 1 and Figure 1) were collected with
(MC920—MC922) showing sea anemones (G,H). Distance between laser a multicorer equipped with six tubes (10 cm diameter) and
dots (green dots) = 20 cm. (F) regular marine sediment.
combined with a Towed Digital Camera (TowCam) developed
at the Woods Hole Oceanographic Institution’s Multidisciplinary
Instrumentation in Support of Oceanographic (MISO) Facility
of 400–600 m. The TowCam−guided multicore investigation onboard the R/V Helmer Hanssen. The live-stream feed from
of the Vestnesa Ridge shows heterogeneity of the site and the TowCam system were used to identify the different seafloor
presence of macrofauna and seafloor structures associated environments and to locate active methane vents, authigenic
with the occurrence of methane seepage. These include, e.g., carbonates, and bacterial mats for targeted accurate sampling
bacterial mats and tubeworm fields (Siboglinidae) within the locations (Figure 2).
Lunde pockmark, and Methane-Derived Authigenic Carbonate After recovery, undisturbed cores were selected for this
(MDAC) outcrops at the seafloor within the Lomvi pockmark study. The uppermost core section of each selected core was
(e.g., Sztybor and Rasmussen, 2017; Åström et al., 2018; Figure 2). subsampled using a flat spatula slicing the sediment into 1-cm
The δ13 CDIC values of pore water for the Lomvi pockmark have thick, horizontal intervals (0–1, 1–2, and 2–3 cm). Sediment
been reported to range between −25.1 and −37.7h and for samples from Vestnesa Ridge were processed as follows: One-
the Lunde pockmark −22.4h to −39.4h in surface sediments third of each slice designated for different treatments, (1) labeling
(Dessandier et al., 2019). with CTG, (2) staining with Rose Bengal, and (3) extraction
The Storfjordrenna hydrate mound “pingo” area is located of dissolved inorganic carbon (DIC) from pore waters. Each
∼400 m water depth on the Arctic continental shelf, south sample was transferred into plastic containers (125-ml HDPE).
of the Svalbard archipelago in the north-western Barents Sea The CTG solution was prepared beforehand as follows: 1.4 ml of
(Figure 1D). Similar to the Vestnesa Ridge, Storfjordrenna DMSO (dimethyl sulfoxide; not anhydrous) was added to 1 mg
is under influence of relatively warm Atlantic water (Loeng, CTG, mixed gently, and kept in the original plastic vial from
1991). The area is characterized by five gas hydrates mounds the supplier at −20◦ C. The solution was thawed approximately
(pingo-like features) spread within an area of 2 km2 . The gas 20 min before the sampling. CTG was added to 20 ml of seawater
hydrate pingos (GHPs) are between 8 and 12 m high, with sampled in the multicore tube and added to the sediment
diameters between 280 and 450 m. Four of the five GHPs immediately after sampling and giving a final concentration of
Frontiers in Marine Science | www.frontiersin.org 4 March 2021 | Volume 8 | Article 587748Melaniuk Cold Seep Foraminifera
TABLE 1 | Core numbers, location, coordinates, water depths, and dates of sampling.
Core number Location Coordinates Water depth (m) Sampling date
MC893A and MC893B Vestnesa Ridge 79.18N, 00.44E 1200 20 May 2015
(Lomvi pockmark)
MC886 Vestnesa Ridge 79.38N, 00.04E 1200 20 May 2015
(Lunde pockmark)
MC880A and MC880B Site 7808 78.44N, 00.50E 889 19 May 2015
(Control site)
MC884 Site 7808 78.30N, 00.82E 900 19 May 2015
(Control site)
MC902 Storfjordrenna 76.91N, 16.08E 377 22 June 2017
Active GHP1
MC917 Storfjordrenna 76.93N, 16.02E 377 23 June 2017
Active GHP1
MC919 Storfjordrenna 76.96N, 15.98E 378 23 June 2017
Active GHP1
MC920 Storfjordrenna 76.70N, 16.00E 379 23 June 2017
Inactive GHP5
MC921 Storfjordrenna 76.72N, 16.40E 380 23 June 2017
Inactive GHP5
MC922 Storfjordrenna 76.74N, 16.37E 386 23 June 2017
Inactive GHP5
GHP, gas hydrates pingo.
CTG of 1 µM in seawater (Bernhard et al., 2006). Samples least half of their chambers were picked and mounted on
were incubated in a temperature-controlled room at 4◦ C for micropaleontology slides (Figure 3). All collected foraminifera
approximately 12 h. Rose Bengal solution was made prior to were sorted by species and counted and identified to species level
sampling by dissolving Rose Bengal powder in distilled water (Tables 2, 3).
(2 g/L). The solution was added to the designated sediment The CHG labeled (i.e., fluorescently labeled) sediment samples
samples, agitated gently, and kept in plastic containers (250 ml). from GHPs were processed in the same manner as CTG labeled,
Sediment labeled with CTG and stained with Rose Bengal was except that individuals that did not show any green coloration
preserved with 36% formaldehyde (to final concentration 5.5%) were subsequently incubated in a Rose Bengal-ethanol solution
and kept at 4◦ C. (2 g/L). After approximately 24 h, samples were re-sieved over
The sediment collected from Storfjordrenna pingo area was a 63-µm sieve. Obtained Rose Bengal stained foraminifera were
treated differently when compared to samples from the Vestnesa wet picked (Figure 3). Unstained tests have been omitted and not
Ridge. Each 1-cm slice of sediment taken from GHP multicores counted in this study.
was directly transferred into a 125 ml HDPE bottle. The whole The density of foraminifera was normalized per unit volume
sediment was treated with the CHG solution. The CHG solution at the number of specimens per 10 cm3 . The Shannon index
was prepared beforehand (following the protocol for CTG). S(H) of diversity, Evenness index, and Chao1 index (Tables 2, 3)
Samples were incubated in CHG onboard in a dark, temperature- was calculated for each sample. The number of CTG labeled and
controlled room at 4◦ C for approximately 12 h. Hereafter, the Rose Bengal stained foraminifera, as well as the CHG labeled
samples were preserved in ethanol with final concentration 70%. and Rose Bengal stained foraminifera, were compared by chi-
square testing. Assuming that CHG foraminifera would have
Foraminiferal Fauna Analysis stained with Rose Bengal, the number of Rose Bengal stained
Rose Bengal stained and CTG labeled (i.e., fluorescently foraminifera was determined as a sum of CHG labeled (living)
labeled) samples from Vestnesa Ridge were washed over a and Rose Bengal stained (recently dead) individuals. For our chi-
63-µm sieve using filtered seawater (0.45 µm); the >63 µm square test, the Rose Bengal stained individuals were treated as
fraction was kept in filtered seawater and further analyzed. the expected values, whereas the CTG or CHG labeled individuals
The fluorescently labeled samples were examined using an were treated as the observed values; this approach is adapted from
epifluorescence-equipped stereomicroscope (Leica MZ FLIII; Bernhard et al. (2006). The percentage of CHG labeled (living)
485 nm excitation; 520 nm emission). All individuals that faunal assemblages from GHP sites were calculated relative to
fluoresced brightly in at least half of their chambers were total foraminiferal abundance (CHG labeled + Rose Bengal
considered as live (Figure 6). They were picked wet and placed stained, i.e., foraminifera containing cytoplasm; Figure 7). Due
on micropaleontology slides. The Rose Bengal stained samples to similar properties, further in the text CTG and CHG labeled
were examined with reflected-light microscopy using a Zeiss foraminifera are interchangeably referred to as “fluorescently
Stemi SV6. All foraminifera that stained dark magenta in at labeled.”
Frontiers in Marine Science | www.frontiersin.org 5 March 2021 | Volume 8 | Article 587748Melaniuk Cold Seep Foraminifera FIGURE 3 | On-board and laboratory processing of the sediment from Vestnesa Ridge (A) and from Storfjordrenna (B). Stable Isotopes Analyses Isotopic measurements were performed on a MAT 253 Isotope For carbon (δ13 C) stable isotope analyses of Vestnesa Ridge Ratio Mass Spectrometer (Department of Geosciences, UiT The samples, the most numerous individuals of species indicated Arctic University of Norway). Carbon isotopic compositions are as a metabolically active (CTG labeled; live) and individuals expressed in conventional δ notation against the Vienna Pee Dee “live + recently dead” (Rose Bengal stained) were selected. Due Belemnite (V-PDB) standard (1.96, −10.21, and −48.95h for to the small size of most specimens, between 8 and 10 specimens δ13 C) and reported in parts per thousand (per mil, h). Analytical of Melonis barleeanus and Cassidulina neoteretis (when present) precision was estimated to be better than 0.07h for δ13 C by and 10 unstained tests of the planktonic foraminiferal species measuring the certified standard NBS-19. Neogloboquadrina pachyderma were picked from each sample. In case of foraminifera from GHPs, δ13 C measurements were performed on metabolically active (CHG labeled) foraminifera RESULTS and recently dead (Rose Bengal stained) foraminifera of the two most numerous species M. barleeanus and Nonionellina Foraminiferal Assemblages labradorica (between eight and 10 specimens). Some “dead” Vestnesa Ridge (unstained tests) were picked for isotope analyses for comparison. Fluorescently labeled (living) individuals were present in the Whenever possible, replicates were processed and analyzed. sediment from core MC893A (Lomvi pockmark) at 0–1 cm and Frontiers in Marine Science | www.frontiersin.org 6 March 2021 | Volume 8 | Article 587748
Frontiers in Marine Science | www.frontiersin.org

                                                                                                                                                                                                                                            Melaniuk
                                                    TABLE 2 | Direct counts of CellTrackerTM Green labeled foraminifera from all samples.

                                                                                Control site                                                                              Vestnesa Ridge

                                                    Core number                   MC880A                           MC880B                         MC884                 MC886                    MC893A                MC893B

                                                    Depth (cm)                      0–1           1–2      2–3        0–1         1–2       2–3    0–1    1–2     2–3    0–1     1–2       2–3    0–1     1–2    2–3    0–1     1–2   2–3
                                                    Cassidulina laevigata             4                                                             1
                                                    Cassidulina neoteretis           22            1                   21          7                4      1                                       13      2
                                                    Cassidulina reniforme                                              3           1                4                                              2
                                                    Cibicides lobatulus                                                3                                                                           1       1
                                                    Melonis barleeanus                4            3                   6           7                8      7                                       10      9
7

                                                    Nonionellina labradorica                                                                               3                                       1
                                                    Pullenia bulloides                1                                4                            2      5                                       2
                                                    Total number/sample              31            4                   37         15               19      16                                      29     12
                                                    SD                              9,60         1,41                 7,7        3,46              2,68   2,584                                   5,26    4,35
                                                    Number/10 cm3                   11.9          1.5                 14.2        5.7              7.7     6.2                                    11.15    5
                                                    #Taxa                             4            2                   5           3                5      4                                       6       3
                                                    Shannon’s H index               0.88         0.56                 1.03       1.22              1.41   1.21                                    1.33    0.72
                                                    Evenness index                  0.60         0.87                 0.70       0.81              0.82   0.84                                    0.62    0.58
                                                    Chao1 index                       4            2                   5           3                5      4                                       6.3     3
March 2021 | Volume 8 | Article 587748

                                                                                                                                                                                                                                            Cold Seep Foraminifera
Frontiers in Marine Science | www.frontiersin.org
Melaniuk
TABLE 3 | Direct counts of Rose Bengal stained foraminifera from all samples.
Control site Vestnesa Ridge
Core number MC880A MC880B MC884 MC886 MC893A MC893B
Depth (cm) 0–1 1–2 2–3 0–1 1–2 2–3 0–1 1–2 2–3 0–1 1–2 2–3 0–1 1–2 2–3 0–1 1–2 2–3
Adercotryma glomeratum 3
Buccella frigida 7 5 1 14 6
Cassidulina laevigata 1 1 1 1
Cassidulina neoteretis 44 24 11 12 17 9 13 3 9 2
Cassidulina reniforme 3 1 1 3 1 8 1 1
Cibicides lobatulus 4 2 2 2
Elphidium excavatum 1 3
Fissurina sp. 2
Labrospira crassimargo 7
Lagena sp. 1 1 1
Lagena sp. 2 1 1 1
Melonis barleeanus 16 10 31 23 8 28 12 1 52 16 5 16 14 3
8
Nonionellina labradorica 1 3 1 1 1
Pullenia bulloides 4 3 2 2 2 8 3 1 1 1 2
Reophax guttifer 3 4 2 1
Reophax fusiformis 2 12
Reophax sp. 2 5 1 1 1 2 7
Stainforthia loeblichi 1 2 1
Spiroplectammina earlandi 1 4 1
Trifarina angulosa 1 2 2
Triloculina sp. 1 1 2
Total number/sample 70 46 35 52 46 29 62 27 15 102 29 6 28 14 3
SD 17.83 7.32 3.95 11.70 10.10 3.06 8.34 3.36 2.5 15 5.52 2.82 6.37 0 0
Number/10 cm3 13 >4
March 2021 | Volume 8 | Article 587748
27 18 20 17.6 11.2 23.8 10.4 5.8 39.2 11.2 2.3 10.7 5.4 1.2
#Taxa 6 9 9 6 5 8 11 10 6 11 7 2 4 1 1
Shannon’s H index 1.08 1.55 1.79 1.15 1.04 1.80 1.62 1.75 1.43 1.6 1.37 0.45 1.09 0 0
Evenness index 0.55 0.54 0.66 0.52 0.60 0.76 0.48 0.63 0.69 0.44 0.56 0.78 0.74 1 1
Chao1 index 5 12 9.75 6.5 5 8 14.33 13.33 12 16 8 2 4 1 1
Cold Seep ForaminiferaMelaniuk Cold Seep Foraminifera 1–2 cm core depths, but not in the 2–3 cm interval. None of and Student’s t-test (p = 0.44, α = 0.05) test show significant the individuals in cores MC886 and MC893B were metabolically differences between number of fluorescently labeled and Rose active. At the control site, fluorescently labeled foraminifera Bengal stained specimens, within any given sediment interval. In were found in all samples from 0–1 cm and 1–2 cm intervals, general, there was a lower number of foraminifera in the cold- while again no living foraminifera were observed in the 2–3 cm seep samples than in the control samples. Density of fluorescently interval (Figure 4 and Table 2). Rose Bengal stained aliquots labeled foraminifera at Vestnesa Ridge ranged from 0 to 11.1 indicated presence of foraminifera (live + recently dead) in individuals per 10 m3 in the 0–1 cm intervals, and from zero to cores MC893A, MC893B, MC884, MC880A, and MC880B in five individuals per 10 cm3 in the 1–2 cm intervals. Density of live all sampling intervals. No Rose Bengal stained individuals were foraminifera at control sites ranged from 7.7 to 14.2 individuals observed in the 1–2 cm and 2–3 cm samples at site MC886 per 10 cm3 in the 0–1 cm intervals, and from 1.5 to 6.1 in the (Figure 4 and Table 3). Both the chi-square (p = 1, α = 0.05) 1–2 cm intervals (Figure 4). The number of Rose Bengal stained FIGURE 4 | Plots presenting the number (per 10 cm3 ) of CellTrackerTM Green CMFDA labeled (live) and Rose Bengal stained (live + recently dead) foraminifera from aliquots of Vestnesa Ridge and the nearby control site. Numbers 0–1, 1–2, and 2–3 next to the core number refer to the depth: 0–1, 1–2, and 2-3 cm respectively. Frontiers in Marine Science | www.frontiersin.org 9 March 2021 | Volume 8 | Article 587748
Melaniuk                                                                                                                                       Cold Seep Foraminifera

  FIGURE 5 | Foraminiferal species composition at Lomvi pockmark (Vestnesa Ridge) and control site using CellTrackerTM Green (live) and Rose Bengal (live + recently
  dead). Plots are based on direct counts (Tables 2, 3).

foraminifera in samples from Vestnesa Ridge active sites ranged                       Buccella frigida (14% of the total fauna in the 0–1 cm interval
from 5.8 to 39.2 individuals per 10 cm3 in the 0–1 cm interval,                       and 6% in the 1–2 cm interval) (Table 3). No apparent endemic
from 0 to 11.2 in the 1–2 cm interval, and from 0 to 2.3 in the                       foraminiferal species were observed in the Vestnesa Ridge seep
2–3 cm interval (Figure 4). In the sediment from the control                          sediment samples (Tables 2, 3).
site, the abundance of Rose Bengal stained (live + recently dead)
foraminifera ranged from 11.3 to 27 specimens per 10 cm3 in the                       Storfjordrenna Pingos
0–1 cm interval, from 20 to 46 foraminifera in the 1–2 cm interval                    Metabolically active (fluorescently labeled) benthic foraminifera
and from 0 to 17.2 in the 2–3 cm interval (Figure 4).                                 were present in both the active GHP1 and the inactive GHP5,
    CTG and Rose Bengal show that dominant and most common                            except at site MC902 taken at the top of the active GHP1
species were the same in the assemblages from active seep sites                       (Table 4). In addition to live, metabolically active foraminifera,
at Vestnesa Ridge (Tables 2, 3 and Figure 5). The S(H) index in                       Rose Bengal staining shows presence of recently dead individuals,
CTG labeled samples from Vestnesa Ridge range from 0 (empty                           i.e., foraminiferal tests that still contain cytoplasm, but were not
samples) to 1.33, and from 0.56 to 1.41 in samples from the                           metabolically active at the time of collection, which could lead to
control site. The S(H) index in Rose Bengal stained samples from                      a significant overestimation of the number of live foraminifera
Vestnesa Ridge range from 0 (empty sample) to 1.33, and from                          (p = 0.01, α = 0.05; chi-square test) (Figure 7).
1.04 to 1.8 in control site. The Pielou evenness index in CTG                             The ratio between fluorescently labeled and Rose Bengal-
labeled samples from Vestnesa Ridge range from 0.58 to 0.88 and                       stained foraminifera differed between the active and inactive
from 0.60 to 0.87 in samples from the control site (Table 2). In                      GHP1 and GHP5. A higher proportion of live to recently dead
Rose Bengal stained samples the same index varies from 0.44 to                        individuals was found in the inactive GHP5, and in GHP1
0.78 for Vestnesa Ridge and from 0.48 to 0.76 for the control                         (except for the sample MC902, which appeared to be barren;
site (Table 3).                                                                       Figure 7). The ratio between live vs. recently dead foraminifera
    In the fluorescently labeled samples from Vestnesa Ridge the                      was approximately 2:3 in the active GHP1, and 3:2 in the inactive
foraminiferal faunas are dominated by M. barleeanus (34% of                           GHP5 (Figure 7).
total fauna in the 0–1 cm interval and 69% in the 1–2 cm                                  At GHP1, the density of live individuals increased along the
interval) and C. neoteretis (45% of total fauna in the 0–1 cm                         transect from 0 individuals at the top of GHP1 to 11.84 (per
interval and 15% in the 1–2 cm interval) (Table 2). Similarly,                        10 cm3 ) at the edge of the pingo. At GHP5 (the non-active site),
in Rose Bengal-stained samples the most abundant species were                         the foraminifera were relatively evenly distributed compared to
M. barleeanus (51% of total fauna in the 0–1 cm interval and                          the active GHP1. Similarly, to GHP1, the lowest density 3.43 (per
55% in the 1–2 cm interval), C. neoteretis (9% of total fauna                         10 cm3 ) of metabolically active foraminifera was observed in the
in the 0–1 cm interval and 7% in the 1–2 cm interval) and                             sediment from the summit of GHP5 (Table 4). The S(H) index

Frontiers in Marine Science | www.frontiersin.org                                10                                            March 2021 | Volume 8 | Article 587748
Frontiers in Marine Science | www.frontiersin.org
Melaniuk
TABLE 4 | Number per sample of CellHunt Green labeled (CHG) and Rose Bengal stained (RB) foraminifera (direct count), and Shannon diversity index from active GHP1 and inactive GHP5.
MC902 MC917 MC919 MC920 MC921 MC922
CHG RB CHG RB CHG RB CHG RB CHG RB CHG RB
Buccella frigida 4 6 14 2 2 3
Cassidulina laevigata 2 1 1 1 1
Cassidulina neoteretis 2 37 5 5 9
Cassidulina reniforme 4 1 6 3
Cibicides lobatulus 3 14 1 4 1 13 1 10
Elphidium excavatum 1 8 3 8
Globobulimina turgida 2 1 4 4 5 2 1 1 2
11
Melonis barleeanus 8 8 22 31 9 12 30 22 24 2
Nonionellina labradorica 6 3 18 18 10 5 1 3
Pullenia bulloides 2 5 1 1 3 2 3
Stainforthia loeblichi 1
Triloculina sp. 1 1
Uvigerina sp. 1 3 2 1
Total number/sample 24 36 62 122 27 43 39 42 42 20
#Taxa 6 9 9 10 6 8 6 6 7 6
Shannon index 1.53 1.75 1.3 1.08 1.26
Evenness index 0.83 0.65 0.59 0.63 0.71 0.70 0.40 0.61 0.54 0.77
Chao1 index 6 10 10.5 10 6.5 11 6.3 7 7.5 6
March 2021 | Volume 8 | Article 587748
Cold Seep ForaminiferaMelaniuk Cold Seep Foraminifera
FIGURE 6 | Reflected light (A–D) and corresponding epifluorescence (green coloration from CellTrackerTM Green) (E–H) micrographs of foraminifera collected at
Vestnesa Ridge (core 893A); (A,E) Nonionellina labradorica; (B,C,G,F) Melonis barleeanus; (D,H) Cassidulina neoteretis. Scales: panels (A–D) = 30 µm; panels
(B,C,F,G) = 25 µm.
in samples from GHP1 ranged from 0 closer to the center to 1.75 0.22h in samples from Vestnesa Ridge, whereas in samples from
at the edge, and in GHP5 from 1.08 to 1.26 (Table 4). The Pielou the control site the difference is 0.41 and 0.15h. The difference
evenness index in CHG labeled samples from GHP1 varies from between δ13 C measured in CTG labeled and empty tests is 0.29
0.59 to 0.83 and between 0.40 and 0.71 in GHP5 (Table 4). and 0.22h at Vestnesa Ridge, and between 0.04 and 0.27h at
Both the active and the post-active pingo were characterized the control site (Table 5).
by presence of the same dominant CHG labeled species: In contrast, in both GHP1 and GHP5 the δ13 C values
M. barleeanus (35% of total living fauna in GHP1, and 52% measured in CHG labeled pools are always considerably more
in GHP5), N. labradorica (28% in GHP1, and 11% in GHP5), depleted compared to values measured in Rose Bengal-stained
Elphidium excavatum (11% in GHP1, and 9% in GHP5) and, specimens (Figure 8). The difference in δ13 C values in CHG
to some extent, B. frigida (12% in GHP1; Figure 8). In the labeled foraminifera is 0.08h (at GHP1) and 0.20 and 0.49h (at
Rose Bengal-stained (i.e., recently dead) samples, the dominant GHP5; Table 5). The difference between δ13 C values measured in
species were M. barleeanus (25% of the total living fauna in CHG labeled foraminifera and unstained tests is 0.88 and 1.46h
GHP1, and 34% in GHP5), C. neoteretis (23% in GHP1, and at GHP1 and range between 0.14 and 0.58h at GHP5. The most
18% in GHP5), C. lobatulus (22% in GHP5), and to some extent pronounced difference is found in samples from the active GHP1
N. labradorica (13% in GHP1, and 6% in GHP5) (Figure 8). No (MC919), where the isotopic signature of live M. barleeanus is
endemic species were found in any of the samples from GHP1 or more depleted compared to the signature of dead individuals
GHP5 (Figure 8). (about 1.46h; Table 5 and Figure 8).
Isotopic Signatures
CellTrackerTM Green labeled foraminifera tend to have less DISCUSSION
negative δ13 C signatures compared to Rose Bengal stained pools
and empty tests of their conspecifics, both at Vestnesa Ridge Foraminiferal Fauna
(core MC893A) and at the control site (core MC880A and The study shows presence of living foraminifera in sediments
MC880B; Figure 9). The difference between δ13 C measured in from active methane emission sites from pockmarks at Vestnesa
CTG labeled individuals and Rose Bengal-stained specimens is Ridge and from hydrate mounds (“pingos”) in Storfjordrenna.
Frontiers in Marine Science | www.frontiersin.org 12 March 2021 | Volume 8 | Article 587748Melaniuk Cold Seep Foraminifera FIGURE 7 | Percentages of benthic foraminifera labeled with CellHunt Green (CHG) = live, and individuals subsequently stained with Rose Bengal (RB) = recently dead (direct count) from Storfjordrenna pingo. The number of foraminifera represents the sum of CHG (dark gray) and RB (light gray) individuals. Plot based on direct counts. Results imply that, despite the hostile conditions (e.g., low Niemann et al., 2006; Treude et al., 2007). For example, oxygen, high carbon dioxide concentrations and potentially also gray bacterial mats (Arcobacter spp., Thiomargarita spp.) are hydrogen sulfide), which are a result of anaerobic methane common in unstable environments, whereas white bacterial mats oxidation (Herguera et al., 2014), the benthic foraminifera (Beggiatoa spp.) and tubeworms fields indicate stable sulfide were metabolically active. Furthermore, the results confirmed a conditions (e.g., Sahling et al., 2002; Niemann et al., 2006; Treude previous observation that Rose Bengal staining overestimated et al., 2007). It has been previously observed that in response to a the number of live foraminifera (Bernhard et al., 2006). This heterogeneous distribution of methane-dependent microbial and is manifested for example by the presence of Rose Bengal macrofaunal biota, the foraminiferal species composition and stained foraminifera in samples with no fluorescently labeled absolute abundance (density) may show great variability within individuals, or by a higher number of Rose Bengal stained the same seep area (e.g., Rathburn et al., 2000; Wollenburg and foraminifera compared to fluorescently labeled individuals (see Mackensen, 2009; Dessandier et al., 2019). samples MC917 and MC919 from Storfjordrenna; Figure 7). In this study, CTG shows the lowest number or absence of Considering the sampling location and previously published metabolically active foraminifera in some of the assemblages studies from Vestnesa Ridge (e.g., Panieri et al., 2017; Sztybor from Vestnesa Ridge, which indeed can be interpreted as an and Rasmussen, 2017; Åström et al., 2018; Dessandier et al., environment being inhospitable for foraminifera. At the same 2019, 2020; Yao et al., 2019), the uneven distribution of time, in the samples from the MC886 site with no fluorescently foraminifera is most likely a result of the horizontal distribution labeled individuals, Rose Bengal stained foraminifera (mostly of geochemically diverse microhabitats within the Vestnesa agglutinated taxa) are still present. This observation suggests sediments. The TowCam imaging survey during the sampling that “inhospitable” conditions are temporary variations rather campaign revealed a patchy distribution of organisms, such than permanent constraints. Instability/variability of the as white and gray bacterial mats and tubeworms (Figure 2), environment can be related to the ephemeral nature of which correspond to geochemically different microhabitats (e.g., methane seeps, which are strongly dependent on methane Frontiers in Marine Science | www.frontiersin.org 13 March 2021 | Volume 8 | Article 587748
Melaniuk                                                                                                                                   Cold Seep Foraminifera

  FIGURE 8 | Foraminiferal species composition within the active GHP1 (MC917 and MC919) and post- active GHP5 (MC920, MC921, and MC922). CellHunt Green
  labeled samples (upper panel) and Rose Bengal stained (lower panel).

  FIGURE 9 | The δ13 C values measured in CellTrackerTM Green labeled (CTG), CellHunt Green labeled (CHG), Rose Bengal stained (RB), and empty tests of Melonis
  barleeanus.

flux (Levin, 2005; Åström et al., 2020). As shown by Yao et al.                     Lunde, respectively). Additionally, sulfate and methane profiles
(2019), the Lomvi (MC893) and Lunde (MC886) pockmarks                               within the MC886 core indicate non-steady-state conditions
are characterized by two different types of methane transport:                      (Yao et al., 2019). Those unstable conditions could explain
advective and dominated by methane diffusion (Lomvi and                             the lack of metabolically active foraminifera with a presence

Frontiers in Marine Science | www.frontiersin.org                              14                                          March 2021 | Volume 8 | Article 587748
Melaniuk                                                                                                                     Cold Seep Foraminifera

of Rose Bengal stained specimens in the samples from Lunde                 was found to be dominant in the top layers of the dysoxic
pockmark (MC886) at the time of sampling. Similar observations             (low oxygen) sediments of the Håkon Mosby Mud Volcano
were made by Dessandier et al. (2019): the authors suggested a             (Wollenburg and Mackensen, 2009) and was one of the most
correlation between low density of foraminifera and methane-               numerous species at Vestnesa Ridge (Dessandier et al., 2019).
diffusive areas due to high sulfide concentration, and decreased           As in other investigated methane seep sites, to date, there are
or lack of agglutinated foraminifera in cold seep assamblagdes             no endemic species found at Vestnesa Ridge and Storfjordrenna
as a result of an increase in organic matter content due to                pingos, but only well-known species represented in a wide range
methane related microbial mass, and stronger competition from              of environments (e.g., Rathburn et al., 2000; Bernhard et al., 2001;
calcareous species.                                                        Herguera et al., 2014; Dessandier et al., 2019).
   Similarly to Vestnesa Ridge, the benthic foraminiferal                      The combined use of CHG and Rose Bengal allows to
distribution pattern within the active GHP1 shows a greater                distinguish live and recently dead foraminifera from the
variability along the analyzed transect compared to the transect           Storfjordrenna area, which reveals major shifts in species
along the inactive GHP5. The highest density of foraminifera is            compositions in both the active GHP1 and the inactive GHP5.
observed at the edge of GHP1, where white and gray bacterial               In live foraminiferal assemblages, the most common species after
mats are present, with a small difference in density toward the            M. barleeanus are N. labradorica and E. excavatum, whereas
center of GHP1, and reaching zero individuals approximately                in Rose Bengal stained samples C. neoteretis and C. lobatulus
at the top, where most of the methane flares are located (Serov            are of high relative abundance. Because species which tolerate
et al., 2017; Carrier et al., 2020). The δ13 CDIC value at the top         high organic concentration and low oxygen conditions are
of the active GHP reached −24.2h, which can be linked to                   associated both with spring bloom and methane seepage, it is
methane-related microbial activity (Dessandier et al., 2019). The          challenging to distinguish precisely to what extent the switch
absence of foraminifera at the summit is thus most likely due              in population is due to methane availability. Particularly, the
to the combined effect of disturbance caused by gas bubbles                relatively high number of live N. labradorica both in the
passing though the sediment and geochemical constraints related            active GHP1 and inactive GHP5, as well as appearance of
to microbial activity (e.g., low oxygen or presence of hydrogen            E. excavatum, might indicate the influence of the seasonal algae
sulfide; Herguera et al., 2014; Carrier et al., 2020). The Shannon         bloom. E. excavatum is an opportunistic species, with the ability
index shows that the suite of samples from GHP 5 has less                  to respond rapidly to deposition of food (pulsed food supply;
variability compared to the samples from GHP1. The highest                 Corliss, 1991; Altenbach, 1992) and colonize harsh environments
density and diversity are observed at the edge of GHP1 (MC919),            (Korsun and Hald, 2000). It almost completely replaces other
in bacterial mats. Similarly to other methane cold seeps, the              species, such as C. lobatulus, which is an epifaunal species that
microbial community at the active GHP1 might serve as a                    prefers low food supply and high oxygen concentration (e.g.,
food source and support benthic foraminiferal growth (e.g.,                Hald and Steinsund, 1996; Klitgaard-Kristensen et al., 2002).
Rathburn et al., 2000; Panieri, 2006; Fontanier et al., 2014;              The significant number of N. labradorica and B. frigida in
Herguera et al., 2014).                                                    samples MC919 from GHP1 is puzzling. Although N. labradorica
   It is widely accepted that the distribution of benthic                  is known to feed on fresh phytodetritus, and is an indicator
foraminiferal faunas at cold seeps is mainly controlled by oxygen          species of high primary productivity as a result of the retreating
levels and organic content, and that species preferring organic-           summer sea-ice margin or Arctic Front (Cedhagen, 1991;
rich environments and reduced oxygen are well adapted to live              Corliss, 1991), this species also has a potential to thrive at
in the environmental conditions of seep sites (e.g., Akimoto               methane seepage sites. N. labradorica (Rose Bengal stained)
et al., 1994; Rathburn et al., 2000, 2003; Bernhard et al., 2001;          have been found previously in the sediment from the top of
Fontanier et al., 2014). In fact, the living foraminiferal fauna at        the GHP1 (Dessandier et al., 2020). Kleptoplasts present in cell
Vestnesa Ridge is dominated by M. barleeanus and C. neoteretis,            of N. labradorica might be involved in ammonium or sulfate
and by M. barleeanus and N. labradorica at the active GHP1.                assimilation pathways and might potentially support life under
M. barleeanus is described as an intermediate to deep infaunal             adverse conditions (Jauffrais et al., 2019). Alike N. labradorica,
species associated with high-nutrient conditions and resistant             the distribution of B. frigida is related to seasonal sea-ice retreat
to environmental stress due to organic matter degradation (e.g.,           and appearance of fresh algae (Seidenkrantz, 2013). From all
Wollenburg and Mackensen, 1998; Alve et al., 2016). Both                   investigated samples from Storfjordrenna, B. frigida occurs most
M. barleeanus and C. neoteretis have been previously observed              frequently in the MC919 samples, where bacterial mats are
as the most abundant species in methane-charged sediments at               present. In previous studies from Vestnesa Ridge, it was suggested
Vestnesa Ridge (Dessandier et al., 2019). Additionally, the TEM            that the species potentially can feed on microbial food sources,
(transmission electron microscopy) analyses of M. barleeanus               i.e., methane related bacterial mats (Dessandier et al., 2019).
from Lomvi pockmark (MC893) at Vestnesa Ridge revealed                     Interestingly, in this study B. frigida occur in CTG labeled
presence of methanotrophic-like bacteria located outside the test,         samples, but there were no Rose Bengal stained individuals.
but very close to their apertural region (Bernhard and Panieri,            This suggests that presence of live B. frigida might reflect a
2018). Although a possible symbiosis between M. barleeanus and             relatively recent appearance of bacterial mats associated with
methanotrophs remains unconfirmed, the potential influence                 methane seepage.
of seep-related bacteria on M. barleeanus cannot be excluded.                  Additionally, the use of both CHG and Rose Bengal reveals
Similarly, to M. barleeanus, C. neoteretis (Rose Bengal stained)           a difference in the percentage of living vs. recently dead

Frontiers in Marine Science | www.frontiersin.org                     15                                      March 2021 | Volume 8 | Article 587748
Frontiers in Marine Science | www.frontiersin.org

                                                                                                                                                                                                                                                                     Melaniuk
                                                    TABLE 5 | Carbon isotope values (δ13 C; h V-PDB) of Melonis barleeanus, Cassidulina neoteretis, and Neogloboquadrina pachyderma, and dissolved inorganic carbon (DIC; *Bernhard and Panieri, 2018) from
                                                    Vestnesa Ridge and control site; and Melonis barleeanus and Nonionellina labradorica from Storfjordrenna pingo from active GHP1 and inactive GHP5; CellTrackerTM Green CMFDA (CTG), CellHunt Green (CHG), Rose
                                                    Bengal (RB) individuals, and empty tests.

                                                                                                              M. barleeanus                               C. neoteretis                  N. pachyderma                    N. labradorica                   DIC*

                                                                       Core         Depth         CTG/CHG         RB δ      Empty δ 13 C     CTG δ 13 C     RB δ 13 C     Empty δ 13 C     Empty δ 13 C      CHG δ 13 C     RB δ 13 C      Empty δ 13 C    δ 13 C
                                                                      number         (cm)           δ 13 C        13 C

                                                    Vestnesa Ridge    MC893A          0–1           −1.73        −1.95          −2.02          −0.26                                          −0.63
                                                                                                                                −2.14                                                         −0.22
                                                                                      1–2           −2.06                       −2.28                                        −0.66
                                                                      MC893B          0–1                                       −2.24                                                                                                                      −3.34
                                                                                      1–2                                       −2.08                                                                                                                     −14.25
16

                                                    Control site      MC880A          0–1           −1.38        −1.79          −1.65                                                         −0.33
                                                                                      1–2           −1.57                       −1.72                                                                                                                      −0.79
                                                                      MC880B          0–1                        −1.70          −1.77          −0.38
                                                                                      1–2           −1.52        −1.67          −1.78          −0.35                                                                                                       −0.64
                                                                       MC884          0–1           −1.66                       −1.70                                                         −0.84
                                                                                      1–2           −1.54                       −1.70
                                                    GHP 1              MC917          0–1           −2.68                       −1.80
                                                                       MC919          0–1           −2.89        −2.81          −1.43                                                                           −4.34         −4.34
                                                    GHP5               MC920          0–1           −2.61        −2.41          −2.03                                                                           −4.21         −3.38
                                                                       MC921          0–1           −2.89        −2.92          −2.43                                                                           −3.38
                                                                       MC922          0–1           −2.51                       −2.37
March 2021 | Volume 8 | Article 587748

                                                                                                                                                                                                                                                                     Cold Seep Foraminifera
Melaniuk Cold Seep Foraminifera
foraminifera within each of the investigated GHP types. The is enriched in isotopically light carbon in the form of either
active GHP1 is characterized by a greater percentage of recently carbon dioxide (CO2 ) or bicarbonate (HCO3 − ) resulting from
dead (Rose Bengal stained) individuals, compared to living microbial activity. If foraminifera incorporate methane-derived
(CHG labeled) specimens, whereas in the inactive GHP5 pingo carbon from the ambient seawater during biomineralization,
this ratio is reversed with more live than dead foraminifera. we would expect to see more negative δ13 C values in their
This difference between the active GHP1 and inactive GHP5 tests compared to δ13 C values in tests of foraminifera from the
implies more unstable and variable environmental conditions non-seep sites. At Lomvi pockmark (Vestnesa Ridge), the δ13 C
at GHP1, potentially related to methane emissions, rather than measured on CTG labeled, Rose Bengal stained, and unstained
general seasonal environmental changes (Carrier et al., 2020). On tests of M. barleeanus have values within the same range as of its
average, CHG labeling showed that approximately 40% of the conspecifics in “normal” (non-seep) marine environments, i.e.,
benthic foraminifera in GHP1 and approximately 54% in GHP5 approximately −2h (e.g., Wollenburg et al., 2001; Dessandier
were alive at the time of collection. et al., 2020). Likewise, the δ13 C measured on live C. neoteretis
Interestingly, despite the highest number of living showed values within the expected range for specimens from
foraminifera in GHP5 the Pielou evenness index in CHG non-seep environments, i.e., approximately −0.3h to −1h
labeled samples shows fairly low values (from 0.40 to 0.71) (Wollenburg et al., 2001), and was not as depleted as previously
compared to samples from GHP1 (from 0.59 to 0.83) (Table 4). reported values (−7.5h δ13 C) measured on Rose Bengal stained
It indicates the presence of dominant, well-adapted species in C. neoteretis from Håkon Mosby Mud Volcano (Mackensen
the foraminiferal population within the post-active GHP, most et al., 2006). Therefore, the data provide no clear evidence that
likely due to the recent environmental changes. Because, the M. barleeanus and C. neoteretis from Vestnesa Ridge incorporate
Pielou evenness index is relatively low in the post-active GHP5 significant amounts of methane-derived carbon during test
compared to GHP1, we can exclude methane influence. It is formation that would markedly affect the isotopic signature of
possible the evenness index decreased due to the influence their carbonate tests. The difference between δ13 C signatures
of the spring bloom. In the literature methane cold seeps of M. barleeanus and C. neoteretis most likely reflects different
are described as a biological oasis in the high−Arctic deep microhabitat preferences of these species. Infaunal species, such
sea (Åström et al., 2018) due to the presence of microbial as M. barleeanus, tend to have more negative δ13 C compared
communities seeps provide enough food to sustain foraminiferal to, for example, epifaunal or shallow infaunal species, such
populations (e.g., Rathburn et al., 2000; Torres et al., 2003; as C. neoteretis (e.g., Grossman, 1984; McCorkle et al., 1985;
Heinz et al., 2005; Panieri, 2006; Panieri and Sen Gupta,2008). Fontanier et al., 2006).
In contrast, sediments outside the seeps are impoverished The δ13 C measured in both metabolically active (CHG
in organic substrates for most of the year and depend on labeled) and recently dead (Rose Bengal stained) foraminifera
benthic-pelagic coupling (Gooday, 1988). Thus, the benthic from Storfjordrenna pingos is not straightforward to interpret.
communities in the Arctic, which experience low food are likely Although the δ13 C in tests of fluorescently labeled foraminifera
more sensitive to food input from primary production (e.g., from the active GHP1 have values slightly more depleted than
Gooday, 1988, 1993; Sander and van der Zwaan, 2004; Nomaki the values exhibited by the same species in the post-active
et al., 2005; Schönfeld and Numberger, 2007; Braeckman et al., GHP5, still the δ13 C values measure in M. barleeanus from both
2018). After the episode of strong food pulses, a population GHPs are not much more depleted compared to Rose Bengal
of specific opportunistic species increased, which can quickly stained conspecific from near non-seep site (i.e., lower than
utilize large amounts of detritus (e.g., Gooday, 1988; Nomaki −2.1h; Dessandier et al., 2019). Overall, the δ13 C measured in
et al., 2005; Braeckman et al., 2018). In fact, samples from M. barleeanus from Storfjordrenna are not significantly depleted
GHP5 are dominated by M. barleeanus, an opportunistic species compared to isotopic signatures of other seep-site foraminifera,
well adapted to high organic content (e.g., Wollenburg and e.g., Uvigerina peregrina with measured δ13 C values down to
Mackensen, 1998; Alve et al., 2016) and shows a relatively −5.64h (Hill et al., 2004), or C. neoteretis with δ13 C values
high number of E. excavatum. A ” bloom-feeding” behavior of −7.5h (Mackensen et al., 2006). Storfjordrenna is at a
of E. excavatum was previously described by Schönfeld relatively shallow water depth (∼400 m) and the sediment
and Numberger (2007). In comparison, the foraminiferal samples were collected in June. Thus, the negative δ13 C signature
fauna from the active GHP consists mainly of species such in foraminiferal tests could originate from a greater flux of
as B. frigida and N. labradorica, species that thrive in cold particulate organic matter produced during the spring bloom
seeps and can feed on bacteria (e.g., Dessandier et al., 2019; and only potentially partly from methane seepage. A shift of
Jauffrais et al., 2019). approximately 0–4h toward a more negative δ13 C is shown to
have an origin in local organic matter degradation (e.g., Torres
The δ13 C Signature in Foraminiferal Tests et al., 2003; Martin et al., 2004).
Within methane cold seeps, the geochemistry of pore water It is generally believed that more negative δ13 C signatures
is influenced by aerobic and/or anaerobic methane oxidation in unstained and/or fossil foraminifera compared to those
(Treude et al., 2007). Because methane-derived carbon is of “living” (Rose Bengal stained) specimens result from an
characterized by very low carbon isotopic signatures (from −50 authigenic overgrowth layer covering the tests. Foraminiferal
to −20h for thermogenic methane, and from −110h to −60h tests deposited in methane-charged sediments might be coated
for microbial methane) (Whiticar, 1999), the ambient DIC pool by precipitates from highly 13 C-depleted pore water or
Frontiers in Marine Science | www.frontiersin.org 17 March 2021 | Volume 8 | Article 587748Melaniuk Cold Seep Foraminifera
bacterially mediated methane oxidation and associated carbonate the major part of the tests had a pre-seep or post-seep signatures
precipitation (e.g., Rathburn et al., 2003; Torres et al., 2003; (i.e., carbon isotopes incorporated before or after a seepage
Schneider et al., 2017; Sztybor and Rasmussen, 2017). A similar event). Methane is only one of the potential carbon sources
interpretation can be applied to explain the offset in δ13 C at cold seeps. In surface sediments, the biological degradation
values between Rose Bengal stained and fluorescently labeled of marine snow contributes to the local DIC pool and might
M. barleeanus from Vestnesa Ridge. Since Rose Bengal stained explain the negative signature of the δ13 CDIC (e.g„ Alldredge and
foraminifera represent both live and recently dead individuals, it Silver, 1988; Bauer and Druffel, 1998; Torres et al., 2003). As an
is possible that in some of the specimens the organic lining was example, a previous study of the δ13 CTOC values for Vestnesa
already partially decomposed, and that this surface of the tests Ridge showed presence of both classical marine δ13 CTOC and
had authigenic carbonate overgrowths (Mackensen et al., 2006). depleted δ13 CTOC related to methane seepage (Dessandier et al.,
Considering the fact that isotopic offset occurred both in samples 2019). Thus, if the foraminifera use carbon both from ambient
from Lomvi and the control site, and the isotopic variation is water and intracellular storage (i.e., resulting from respiration
relatively low (∼0.20h Vestnesa Ridge, 0.15 and 0.41h at the and diet; de Nooijer et al., 2009; Toyofuku et al., 2017), it seems
control site), the offset could be due to dissolution of biogenic unlikely that the isotopic signature of foraminifera only reflects
calcite and re-precipitation of inorganic calcite (overgrowth the methane-derived carbon; rather, it may be a result of both
and recrystallization) or other early diagenetic processes that non-seep and seep carbon. To obtain more accurate δ13 C values,
occur in normal non-seep sediments (Ravelo and Hillaire-Marcel, analysis of single specimens, or more advanced techniques, e.g.,
2007), and as such not necessarily the effect of Methane-Derived secondary-ion mass spectrometry (SIMS) is recommended.
Authigenic Carbonates (MDAC) overgrowth. Additionally, δ13 C
values recorded in unstained tests of the planktonic foraminifera
N. pachyderma from Vestnesa Ridge are close to the expected CONCLUSION
δ13 C values for normal “Holocene” marine environments (−0.5
to 0.5h; Zamelczyk et al., 2014; Werner et al., 2016). Because 1. Labeling with fluorescence probes showed that
planktic foraminifera live and calcify in the water column, metabolically active foraminifera were present in
significantly depleted δ13 C signature (−7h or higher; Torres methane-influenced sediments both at Vestnesa Ridge
et al., 2003) in their unstained tests results from diagenetic and Storfjordrenna. Both sites were characterized by
overgrowth by authigenic carbonates associated with aerobic comparable faunal patterns, with no endemic species,
methane oxidation (AOM; Torres et al., 2003; Uchida et al., 2004; and the observed species were similar to those from
Martin et al., 2010; Schneider et al., 2017). Values obtained for other non-seep locations within the Arctic Ocean. At
N. pachyderma from Vestnesa Ridge support the inference that Vestnesa Ridge, and at the non-seep control site off
benthic foraminiferal assemblages have not been significantly Vestnesa Ridge, the most abundant calcareous species
overprinted by MDAC. were M. barleeanus and C. neoteretis. In Storfjordrenna in
Unlike Vestnesa Ridge, in GHP1 and GPH 5 the δ13 C values both GHP environments, the foraminiferal faunas were
in the fluorescently labeled M. barleeanus are always more dominated by M. barleeanus and N. labradorica.
negative compared to the δ13 C in Rose Bengal stained and 2. Methane seepage did not markedly affect the isotopic
unstained tests. This could suggest that living foraminifera did signature (δ13 C) of primary calcite in metabolically active
incorporate methane-derived carbon during biomineralization. foraminifera. One exception was sample MC919, where a
Mackensen et al. (2006) suggested that more depleted isotopic more negative isotopic signature of M. barleeanus could
δ13 C signatures in living (Rose Bengal stained) foraminifera potentially reflect methane influence.
compared to unstained tests can be interpreted as a result of 3. The results of this study show the effectiveness of
methane influence. In sample MC919 the difference between fluorescent probes in ecological studies. At Vestnesa
δ13 C measured in live M. barleeanum compared to value in Ridge, Rose Bengal staining overestimated the number of
empty tests is pronounced (about 1.55h), whereas the difference living foraminifera, indicating a higher number of live
between δ13 C in live foraminifera and empty tests in the post- foraminifera compared to the CTG labeled specimens (23%
active GHP5 does not exceed 0.4h. Most likely, foraminifera of foraminifera were live at Vestnesa Ridge and 34% at
absorbed methane-derived carbon via the food web by feeding the control site).
on methanotrophic bacteria (see section “Foraminiferal Fauna”). 4. The is no significant difference between δ13 C measured in
Although the δ13 C signatures in tests of live foraminifera fluorescent labeled foraminifera and Rose Bengal stained.
from the study areas are not significantly depleted to determine 5. At Storfjordrenna, the combined use of CHG and
the influence of methane, it should be noted that the δ13 C Rose Bengal allowed to distinguish between living and
are measured on pools of specimens (N = ∼10). It is possible recently dead benthic foraminifera. This demonstrated
that at least some of the individuals had more negative a marked change in the foraminiferal population from
δ13 C signatures than others, or that some chambers indeed a C. neoteretis/Cibicides lobatulus dominated assemblage
incorporated methane-derived carbon, as suggested by Bernhard to an assemblage dominated by M. barleeanus and
et al. (2010). However, even if the foraminifera calcified during N. labradorica, which otherwise would have been
episodes of high methane flux, it is likely that only parts of the overlooked. Despite the more time-consuming protocol
tests were constructed under intense seepage conditions, while compared to Rose Bengal staining, the fluorescent viability
Frontiers in Marine Science | www.frontiersin.org 18 March 2021 | Volume 8 | Article 587748You can also read