The role of spatial dependence for large-scale flood risk estimation - GFZpublic
←
→
Page content transcription
If your browser does not render page correctly, please read the page content below
Nat. Hazards Earth Syst. Sci., 20, 967–979, 2020
https://doi.org/10.5194/nhess-20-967-2020
© Author(s) 2020. This work is distributed under
the Creative Commons Attribution 4.0 License.

The role of spatial dependence for large-scale flood risk estimation
Ayse Duha Metin1,2 , Nguyen Viet Dung1 , Kai Schröter1 , Sergiy Vorogushyn1 , Björn Guse1 , Heidi Kreibich1 , and
Bruno Merz1,2
1 Hydrology      Section, GFZ German Research Centre for Geosciences, 14473 Potsdam, Germany
2 Institute   of Environmental Science and Geography, University of Potsdam, 14476 Potsdam, Germany

Correspondence: Ayse Duha Metin (duhametin@gmail.com)

Received: 26 November 2019 – Discussion started: 5 December 2019
Revised: 9 March 2020 – Accepted: 16 March 2020 – Published: 9 April 2020

Abstract. Flood risk assessments are typically based on sce-     wide with overall damages of USD 662 billion (CRED and
narios which assume homogeneous return periods of flood          UNISDR, 2015). It is commonly stated that flood risk has
peaks throughout the catchment. This assumption is unre-         increased rapidly in the past and will continue to increase
alistic for real flood events and may bias risk estimates        in future due to the combined effects of climate change and
for specific return periods. We investigate how three as-        socio-economic development (e.g. Rojas et al., 2013). In or-
sumptions about the spatial dependence affect risk estimates:    der to mitigate the destructive impacts of floods, sound flood
(i) spatially homogeneous scenarios (complete dependence),       risk assessment and management are essential.
(ii) spatially heterogeneous scenarios (modelled dependence)        During the last decades, flood risk management has gained
and (iii) spatially heterogeneous but uncorrelated scenarios     considerable attention and has shifted from a hazard-focused
(complete independence). To this end, the model chain RFM        approach to the broader risk-based perspective covering both
(regional flood model) is applied to the Elbe catchment in       physical and societal processes (e.g. Merz et al., 2010, 2014a;
Germany, accounting for the spatio-temporal dynamics of all      Bubeck et al., 2016; Thieken et al., 2016). For instance, the
flood generation processes, from the rainfall through catch-     EU Flood Directive (EC, 2007) was adopted in October 2007
ment and river system processes to damage mechanisms. Dif-       to launch a flood risk assessment and management frame-
ferent assumptions about the spatial dependence do not in-       work in Europe considering all aspects of flood risk, includ-
fluence the expected annual damage (EAD); however, they          ing the impacts on society.
bias the risk curve, i.e. the cumulative distribution func-         Conceptually, flood risk is defined as the probability of the
tion of damage. The widespread assumption of complete            adverse consequences within a specified time period. It de-
dependence strongly overestimates flood damage of the or-        pends on three components: hazard, exposure and vulnerabil-
der of 100 % for return periods larger than approximately        ity (IPCC, 2012; UNISDR, 2013). Following this definition,
200 years. On the other hand, for small and medium floods        flood risk assessment starts with quantifying the hazard. By
with return periods smaller than approximately 50 years,         combining hazard and socio-economic information, such as
damage is underestimated. The overestimation aggravates          land use and asset values, exposure is assessed. Vulnerabil-
when risk is estimated for larger areas. This study demon-       ity is included by adding information on how flood-affected
strates the importance of representing the spatial dependence    objects would be damaged. Overall, flood risk assessment at-
of flood peaks and damage for risk assessments.                  tempts to estimate the characteristics, e.g. inundation depth
                                                                 and flood extent, of a range of potential flood events, the ex-
                                                                 ceedance probabilities of these events and their consequences
                                                                 (e.g. Winsemius et al., 2013; de Moel et al., 2015). The re-
1   Introduction                                                 sults of flood risk assessments are often presented in maps,
                                                                 which exist in many different forms depending on their pur-
Floods frequently occur as destructive events throughout         pose (Merz et al., 2007; de Moel et al., 2009). Flood hazard
the world. In the period 1995–2015, there were around            maps contain flood characteristics, e.g. inundation extent and
3100 flood events which affected 2.3 billion people world-

Published by Copernicus Publications on behalf of the European Geosciences Union.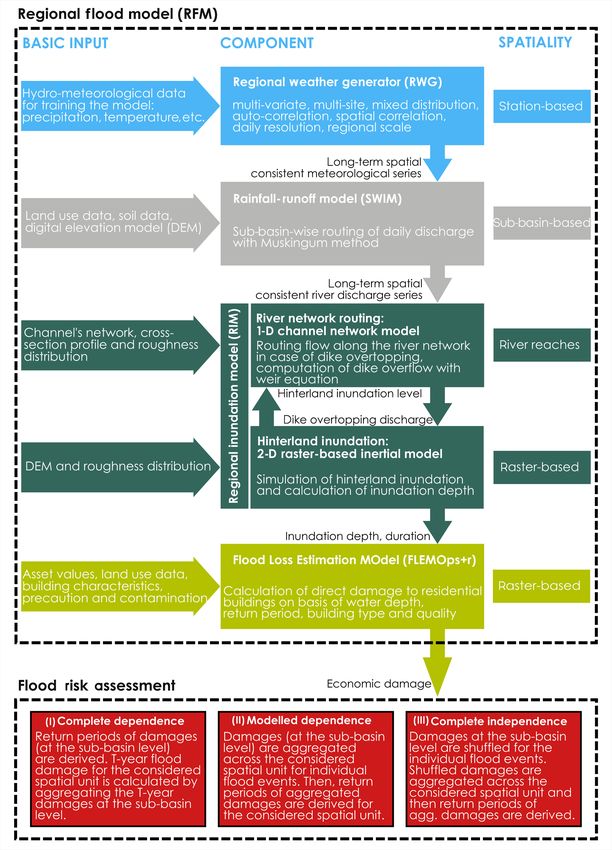
968                                                                        A. D. Metin et al.: The role of spatial dependence

water depth, for given return periods. Flood risk maps ad-         ther, an event-based simulation approach, where stochastic
ditionally consider the adverse consequences, e.g. economic        precipitation events are generated as input to a hydrological
damage and number of affected people.                              model, has been used (e.g. Rodda, 2001; Jankowfsky et al.,
   Flood mapping is typically based on a number of spa-            2016). The hydrological model simulates spatially dependent
tially uniform (or homogeneous) scenarios with given re-           discharge hydrographs, which are then used by the hydrody-
turn periods (e.g. Rhine Atlas; ICPR, 2015). The scenario          namic model to map inundated areas. A disadvantage of this
with a T -year return period is composed of all flooded ar-        approach is that the return period of discharge is assumed
eas within the study area, whereas each location shows the         to be equal to the return period of precipitation, an assump-
T -year flood. Hence, the T -year flood map is produced by         tion that does not necessarily hold. An alternative approach is
piecing together or mosaicking estimates of the local T -year      a continuous hydrological–hydrodynamic simulation driven
flood based on extreme value statistics at individual gauges,      by long-term synthetic climate time series (e.g. Falter et al.,
assuming complete dependence between different locations.          2015; Grimaldi et al., 2013). This approach is computation-
Based on this assumption, Ward et al. (2013) and Winsemius         ally expensive; however, it has a number of advantages, as
et al. (2013, 2015) estimated flood hazard and risk at the         discussed by Falter et al. (2015). Within the context of this
global scale, assuming homogeneous return period scenarios         paper, its most relevant advantage is that spatially consistent
within regions. At the European scale, flood hazard and risk       flood events can be modelled by considering the spatial de-
were assessed based on spatially homogeneous scenarios by          pendence of the precipitation and of the flood generation pro-
Feyen et al. (2012), Rojas et al. (2013), Alfieri et al. (2014)    cesses in the catchment and river network.
and Bubeck et al. (2019). At the national scale, Dumas et             According to our literature review, only a few studies con-
al. (2013) investigated future flood risk in France, and Hall      sider spatial dependence when assessing flood risk. The large
et al. (2005) assessed current and future flood risk in England    majority assume spatially homogeneous scenarios. This as-
and Wales by assuming uniform return periods for all flooded       sumption is also the basis for flood hazard mapping, for
areas. Similarly, te Linde et al. (2011) estimated current and     instance, in Europe (de Moel et al., 2009), in Iowa in the
future flood risk along the river Rhine. Real flood events are,    US (Gilles et al., 2012), in Bangladesh (Tingsanchali and
however, spatially heterogeneous, as the flood generation de-      Karim, 2005) and in Honduras (Mastin, 2002). The assump-
pends on a range of processes in the atmosphere, catchment         tion of complete dependence is appropriate for local risk es-
and river network, which vary strongly in space (e.g. Nied et      timates, but it may bias the risk estimates for larger areas.
al., 2017; Vorogushyn et al., 2018). The analysis of historical    The purpose of our paper is to investigate this bias. To under-
floods shows that return periods of peak discharges are typi-      stand the effect of spatial dependency on risk estimates, we
cally very heterogeneous for a given event (Lammersen et al.,      compare three assumptions of spatial dependence: (i) spa-
2002; Uhlemann et al., 2010; Merz et al., 2014b; Schröter et       tially dependent flood events with homogeneous return peri-
al., 2015).                                                        ods (complete dependence), (ii) spatially dependent events
   Some studies consider the spatial variability in return peri-   with heterogeneous return periods (modelled dependence)
ods of floods. One approach applies multi-variate distribution     and (iii) spatially independent events with heterogeneous, i.e.
functions to represent the dependence between flood peaks at       randomly selected, return periods (complete independence).
multiple sites (e.g. Keef et al., 2009; Lamb et al., 2010; Ghiz-   We explore the variation in the dependence effect with spa-
zoni et al., 2012; Thieken et al., 2015; Quinn et al., 2019).      tial scale and flood magnitude with respect to resulting flood
Based on a stochastic dependence model, spatially heteroge-        damage.
neous scenarios are generated and used for the risk assess-           To the best of our knowledge, our study is the first in-depth
ment. This approach provides, however, only flood peaks,           analysis of this bias at the scale of a large river basin. Lamb
whereas the transformation of peaks into inundation areas re-      et al. (2010) and Wyncoll and Gouldby (2015) compared
quires event hydrographs. Hence, synthetic hydrographs are         risk estimates for these three assumptions for smaller regions
associated with the peaks, which is an additional source of        in the UK only (Leeds, York: around 12 000 km2 ; northeast
uncertainties and errors (Grimaldi et al., 2013). These hydro-     England: around 15 000 km2 in the former; Eden catchment:
graphs are spatially inconsistent, i.e. not mass conservative,     approximately 2400 km2 in the latter); the effect of spatial
(though peaks are spatially consistent) and can be used for        dependence over large regions has not been studied. Further,
hydraulic calculations only for a limited river stretch. An-       they statistically generated spatially dependent peak flows
other approach, proposed by Alfieri et al. (2015, 2016, 2017),     and did not consider the spatial dependence of the flood gen-
combines inundation maps and resulting risk for heteroge-          eration processes, as it is possible with the continuous simu-
neous return periods piecewise by interpolating between pre-       lation approach of Falter et al. (2015). Jongman et al. (2014)
viously derived homogeneous return period maps. The spa-           assessed the effect of spatial dependence of flood peaks on
tially variable discharges are derived from a hydrological         flood damage in Europe but considered only modelled de-
model driven by observations or climate models. This ap-           pendence versus full independence. They did not analyse the
proach considers spatial dependence but still suffers from in-     widespread assumption of homogeneous return periods.
consistencies of inundation maps mosaicked piecewise. Fur-

Nat. Hazards Earth Syst. Sci., 20, 967–979, 2020                            www.nat-hazards-earth-syst-sci.net/20/967/2020/
A. D. Metin et al.: The role of spatial dependence 969
To realistically represent the spatial dependence of the dif-
ferent flood processes, we use the derived flood risk analy-
sis (DFRA) based on continuous spatially consistent mod-
elling of the entire flood process chain (Falter et al., 2015).
The model chain includes all processes from the precipita-
tion through the catchment and river system to the damage
mechanisms. The effect of spatial dependence is investigated
for the Elbe catchment in Germany.
This paper is organized into six sections. Section 2 intro-
duces the study area. Section 3 describes the model chain and
how the risk estimates are obtained for the three dependence
assumptions. Section 4 illustrates the risk estimation results
under three spatial dependence assumptions. Further, we dis-
cuss these results in Sect. 5 and draw conclusions in Sect. 6.
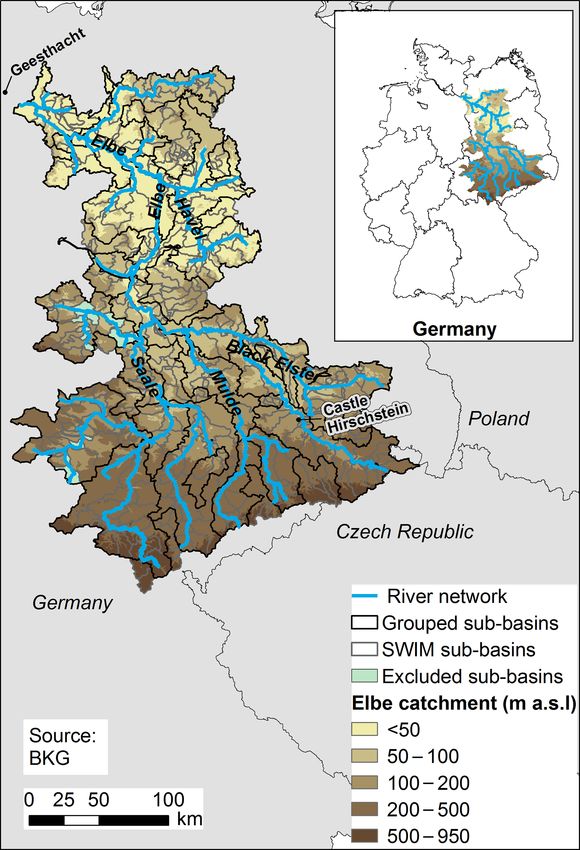
2 Study area: the Elbe catchment
The river Elbe is located in central Europe, with a length
of 1094 km and total catchment area of 148 268 km2 . It can
be subdivided into three parts: the upper Elbe, the middle
Elbe and the lower Elbe. The upper Elbe mainly belongs to
the Czech Republic and is dominated by mountains. In Ger-
many, the upper Elbe reaches the northern German lowlands
at Castle Hirschstein, followed by the middle Elbe reaching
the weir Geesthacht. The lower Elbe starts downstream of
Geesthacht and forms the Elbe estuary. Approximately two-
thirds of the catchment belongs to Germany, with the main
tributaries Black Elster, Mulde, Saale and Havel (Fig. 1).
In the present study, the analyses are presented for 29 sub-
basins located within Germany. The complete Elbe catch- Figure 1. Study area in the Elbe catchment, including the main trib-
ment receives 628 mm precipitation per year, and the char- utaries and sub-basins. The inset shows the location of the catch-
acteristic runoff regime is the rain–snow type (Nied et al., ment within Germany. Data sources of figure: BKG (2012).
2017).
Floods occur mainly in winter and spring, often as
snowmelt or rain-on-snow floods. However, the largest floods
next model (Fig. 2). All processes along the entire flood risk
tend to occur in summer. Heavy precipitation events associ-
chain are continuously simulated in a distributed manner.
ated with Vb cyclones have caused disastrous floods, such
Consequently, spatially coherent precipitation patterns and
as the events in August 2002 and June 2013. The 2002
flood preconditions of the catchment, including their influ-
(EUR 8.9 billion damage) and 2013 flood events (EUR 5.2
ence on discharge peaks, water levels, inundation areas and
billion) were the most severe flood events in the Elbe River
damages, are considered.
basin in Germany for the last few decades (IKSE, 2015). Be-
In this study, RFM is run for time series of 10 000 years
sides this, the river basin was affected by smaller floods in
(100 realization of 100 years) on a daily time step. Synthetic
2006, 2010 and 2011.
meteorological time series at multiple sites are provided by
a multi-variate weather generator. Further, continuous flood
3 Methods hydrographs at the sub-basin scale are calculated by a hydro-
logical model, where antecedent catchment conditions are
3.1 Regional flood model (RFM) for Germany implicitly considered. The flow hydrographs are used as a
boundary condition for the calculation of water levels in the
The regional flood model (RFM) has been developed for river channels and inundation depths with a coupled 1-D–2-
large-scale flood risk assessments, i.e. for areas of up to sev- D hydrodynamic model considering levee overtopping. Fi-
eral 100 000 km2 . RFM is composed of a weather genera- nally, damage time series using a multi-variate flood loss es-
tor, rainfall–runoff model, 1-D channel-routing model, 2-D timation model for residential buildings are simulated. In this
hinterland inundation model and flood damage estimation way, spatially consistent time series of flood damages at the
model. The output from one model is used as input for the SWIM sub-basin scale (196 sub-basins) are derived. The fi-
www.nat-hazards-earth-syst-sci.net/20/967/2020/ Nat. Hazards Earth Syst. Sci., 20, 967–979, 2020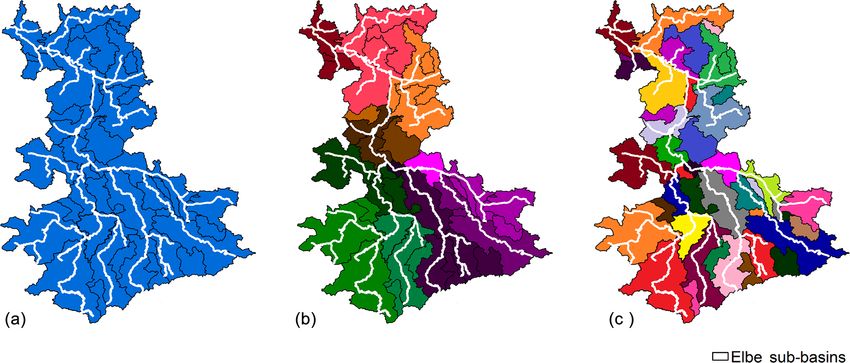
970                                                                       A. D. Metin et al.: The role of spatial dependence

nal risk results are represented at the grouped sub-basin scale   model shows a poor performance for a few small SWIM sub-
(29 sub-basins). The model components are briefly described       basins in the upstream part of the Saale catchment, likely due
in the following. Details about RFM and calibration and vali-     to not capturing reservoir effects. In addition, the poor per-
dation results of the model components can be found in Falter     formance at these mountainous sub-basins can occur due to
et al. (2015, 2016) and Metin et al. (2018).                      the consideration of flood processes on a daily basis. In fact,
                                                                  the travel time of flood peaks can be smaller than 1 d at these
3.1.1   Regional weather generator (RWG)                          sub-basins. Therefore, these areas are excluded in the present
                                                                  study (Fig. 1).
The regional weather generator (RWG), proposed by Hun-
decha et al. (2009) and further developed by Hundecha and         3.1.3   Regional inundation model (RIM)
Merz (2012), generates synthetic weather at the regional
scale. This multi-site, multi-variate auto-regressive model       The RIM simulates the water level along the river network
generates daily time series of meteorological variables, tak-     and hinterland inundation depths. RIM consists of two-way
ing into account the spatial correlation structure. First, it     coupled models: a 1-D hydrodynamic channel-routing model
generates daily precipitation series using the mixed gamma–       based on the diffusive wave equation and a raster-based 2-D
Pareto distribution fitted to the observed data. Further, the     hydrodynamic inundation model based on the inertia formu-
model generates daily maximum, minimum and mean tem-              lation (Metin et al., 2018). The overtopping flow is calcu-
perature and solar radiation using Gaussian distributions con-    lated by the 1-D model and is used as boundary condition
ditioned on precipitation. RWG was set up for the area cov-       for the 2-D model, which is back-coupled to the 1-D model.
ering the entire Elbe, Rhine, Danube and Ems rivers using         The overtopping is considered only at the main river net-
the observed climate data at 528 climate stations between         work and higher-order tributaries that have a drainage area
the year 1951 and 2003 and was shown to capture daily pre-        of 600 km2 or more. This river network is explicitly mod-
cipitation extremes and seasonal precipitation patterns well      elled with the 1-D diffusive wave hydrodynamic model. The
(Hundecha et al., 2009).                                          flood routing in smaller tributaries with drainage area below
                                                                  the above-mentioned threshold is done by the Muskingum
3.1.2   Rainfall–runoff model (SWIM)                              routing within the SWIM model. The river geometry is de-
                                                                  scribed by simplified cross sections which include the over-
Discharge time series on a daily basis are derived with the       bank river geometry and dike crest elevation derived from
semi-distributed hydrological model SWIM (Krysanova et            the 10 m DEM provided by the Federal Agency for Cartog-
al., 1998). The model has a three-level structure of spatial      raphy and Geodesy in Germany (BKG). Whenever the water
disaggregation: basins, sub-basins and hydrotopes. A hydro-       level overtops the dike crest elevation, the overtopping flow
tope is a set of disengaged elementary units within the sub-      is computed using the broad-crested weir equation.
basins, which are homogeneous in terms of land use and               The river profiles were manually extracted perpendicular
soil type. The hydrological processes, such as evapotran-         to the flow direction every 500 m. Due to the low resolution
spiration, infiltration and snowmelt, and different types of      of the 10 m DEM in relation to the dike geometry, the de-
runoff are computed at the hydrotope level. The outputs from      rived dike heights tend to be lower than in reality. Hence, a
hydrotopes are integrated (area-weighted average) for each        minimum dike height of 1.8 m was used for the river Elbe.
sub-basin. An average sub-basin area is in a range of 10 to       The constant Manning’s roughness of 0.03 m−1/3 s was as-
100 km2 . The runoff is routed by the Muskingum routing           sumed in the river network. For the 2-D raster-based model,
method between individual sub-basins and is aggregated at         the 10 m DEM was resampled to 100 m computational grid
the basin scale.                                                  found to represent the inundation characteristics with suit-
   The Elbe catchment was discretized into 2268 sub-basins        able computation time well (Falter et al., 2013).
in the watershed delineation of the SWIM model (SWIM                 The 1-D hydrodynamic channel-routing model was val-
sub-basins). A detailed soil map (BÜK 1000 N2.3, generated        idated with observed data for 1951–2003 at eight gauging
by the Bundesanstalt für Geowissenschaften und Rohstoffe,         stations in the Elbe catchment (Falter et al., 2015, 2016).
Hannover) and land use data (the CORINE land cover map)           The performance of the 1-D model is acceptable even though
were used. The model was calibrated using observed daily          there is a tendency to underestimate observed peak flows ex-
climate data for the period 1981–1989. It was validated with      ceeding the bankfull depth. The simulated inundation areas
observed discharge data on 20 gauging stations in the Elbe        were compared to the extreme flood in August 2002, the only
catchment for 1951–2003 (Falter et al., 2015; 2016; Metin et      event for which inundation depth and extent are available.
al., 2018). While discharge is simulated well in most parts       Although the model tends to underestimate inundation ex-
of the Elbe catchment, peak flows are over- and underesti-        tents, since it neglects dike breaches, it provides plausible
mated in the range of ±5 % throughout most of the catchment       inundation patterns.
(Falter et al., 2016). Discharge is mainly underestimated in
Mulde and Black Elster and is overestimated in Saale. The

Nat. Hazards Earth Syst. Sci., 20, 967–979, 2020                           www.nat-hazards-earth-syst-sci.net/20/967/2020/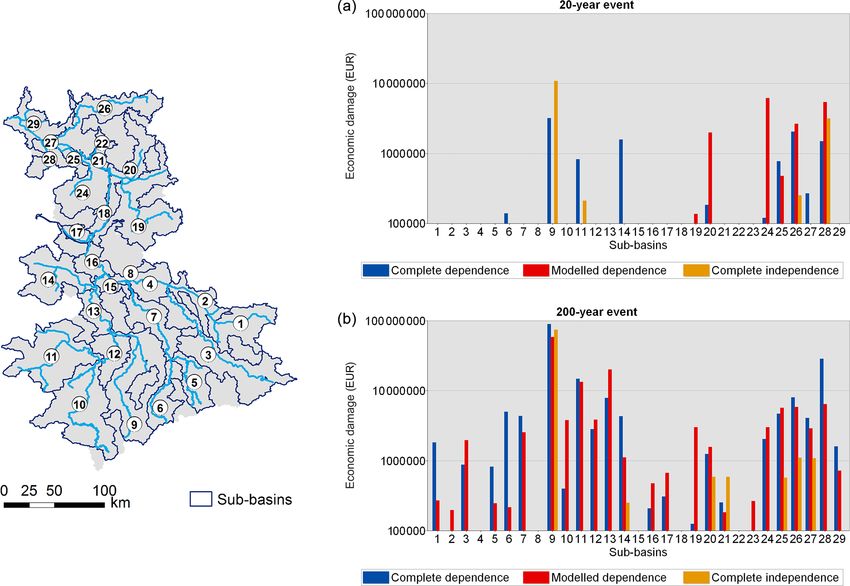
A. D. Metin et al.: The role of spatial dependence                                                                             971

Figure 2. Workflow for the derived flood risk assessment (DFRA) with the regional flood model (RFM).

3.1.4   Flood Loss Estimation MOdel (FLEMOps+r)                      multiplied with the asset values of the inundated residential
                                                                     buildings to obtain the monetary damage.
                                                                        Besides inundation depths and return periods, the model
                                                                     requires spatially detailed information on building quali-
The direct economic damage to residential buildings is es-           ties, building types and asset values. The mean building
timated by the Flood Loss Estimation MOdel for the pri-              quality and cluster of building type composition was esti-
vate sector (FLEMOps+r). The model considers five inun-              mated on the municipal level on basis of INFAS Geodaten
dation depth classes, two building quality classes (high qual-       GmbH (2009). The asset values were determined consid-
ity or medium–low quality), three building types (single-            ering the standard construction costs (BMVBW, 2005) and
family, semi-detached and detached, or multi-family houses)          were spatially disaggregated using the digital basic landscape
and three return period classes to estimate damage (Elmer            model ATKIS Basis DLM (BKG GEODATENZENTRUM,
et al., 2012). The model provides the damage ratio which is

www.nat-hazards-earth-syst-sci.net/20/967/2020/                                Nat. Hazards Earth Syst. Sci., 20, 967–979, 2020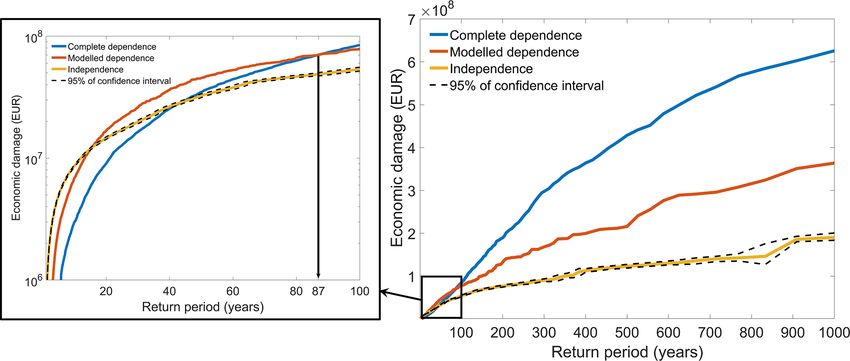
972 A. D. Metin et al.: The role of spatial dependence
2009). Municipal asset data were disaggregated by means of Under the assumption of complete dependence, all sub-
a dasymetric mapping approach (Wünsch et al., 2009). The basins within the considered spatial unit, e.g. the entire river
damage was estimated according to output from the hydro- basin, are assumed to experience a T -year flood damage at
dynamic model on a raster level by calculating the damage the same time. Hence, the T -year flood damage is calcu-
ratio according to the inundation depth and return period in lated by aggregating the T -year damage values of all sub-
the corresponding cell and the underlying information for basins estimated from individual (not necessarily concurrent)
building types and qualities per municipality (Thieken et al., events. In the following, we refer to a T -year flood event as
2008). an event resulting in the T -year damage. This definition of a
The model was validated on the micro- and meso-scale on T -year flood event is different when compared to the tradi-
basis of empirical damage data of the August 2002 flood in tional way based on the peak return period.
the state of Saxony in Germany (Elmer et al., 2010; Falter et Under the modelled dependence assumption, damages are
al., 2015). aggregated for individual flood events across the considered
spatial unit, and return periods of aggregated damages are
3.2 Flood risk assessment for different dependence derived directly for this spatial unit. This approach aims to
assumptions represent the true spatial and temporal dependencies of real-
world flood situations. For example, for a T -year flood loss
We compute flood risk for three spatial dependence assump- over the entire catchment, the return periods of damages in
tions (Fig. 3): (1) complete dependence or homogeneous re- individual sub-basins are expected to be different from sub-
turn periods across the river basin, (2) modelled dependence basin to sub-basin. Furthermore, these return periods are ex-
or heterogeneous return periods, and (3) complete indepen- pected to show a certain spatial pattern dictated by the spatial
dence, where flood peaks and associated return periods are correlation of the flood generation processes.
randomly sampled. In scenarios (1) and (3) the discharges, Under the assumption of complete independence, the spa-
inundation areas and damages are spatially inconsistent; i.e. tial correlations between damages of different sub-basins are
they are mosaicked from the continuous simulations by se- destroyed. Damages of individual flood events are shuffled at
lecting events and damages for corresponding return peri- the SWIM sub-basin level and aggregated for the considered
ods. The spatial variation in damages within the catchment spatial units. Return periods of these aggregated damages are
depends on the spatio-temporal patterns of meteorological, determined for the spatial unit considered. As the aggregated
hydrological and hydraulic processes. For instance, the flood damage and the risk curve depend on the specific realization
damage downstream of the confluence of two tributaries de- of the shuffling, this procedure is repeated 1000 times. From
pends on the superposition of the flood waves from these this sample, the median is used to construct the risk curve,
tributaries. The damage results of the modelled dependence and additionally the 95 % confidence range is computed.
should lie between the results of the two other assumptions, The risk curves and EAD are derived at the grouped sub-
as they span the whole range from complete dependence to basin level (29 sub-basins in total; see Fig. 1), as a higher
complete independence. Further, the modelled dependence resolution would lead to many instances where the number
results should be similar to those of the complete dependence of damaging floods would be too low to construct meaningful
for small areas and should move towards complete indepen- empirical risk curves.
dence as the spatial scale becomes large.
We characterize flood risk by the probability of damage
(risk curve) and by the expected annual damage (EAD) com-
4 Results
puted as the integral of the risk curve. Damage values are cal-
culated at the 100 m grid resolution for individual inundation 4.1 Damage estimations under three dependence
events of the 10 000-year continuous flood simulation with assumptions for the entire catchment
RFM. An event requires that flood defences are overtopped at
least at one location and that it affects residential assets, i.e. a The aggregated economic damages to residential buildings
non-zero damage occurs. If anywhere in the entire catchment for the Elbe catchment and their corresponding return peri-
overtopping occurs after at least 10 d of non-overtopping, this ods are illustrated in Fig. 4 for the three dependence assump-
is defined as the start of a new event. Empirical return pe- tions. While the economic damage of the 1000-year event is
riods for damages aggregated for specific spatial units (e.g. estimated at around EUR 620 million under the assumption
sub-catchments) are determined using Weibull plotting po- of complete dependence, it is around EUR 360 million for
sitions. Damage at the level of the sub-basins (SWIM sub- the modelled dependence scenario (70 % overestimation un-
basins) is then aggregated to larger spatial units (e.g. aggre- der the assumption of complete dependence). A strong over-
gation of sub-basins or the entire catchment) for individual estimation is also given for smaller return periods down to
flood events. These pairs, i.e. damage and associated return approximately 150 years. Moreover, the assumption of com-
period, are used to construct risk curves and to calculate the plete independence may underestimate damage by 50 %. The
EAD (Falter et al., 2015). extreme assumption of complete independence represents the
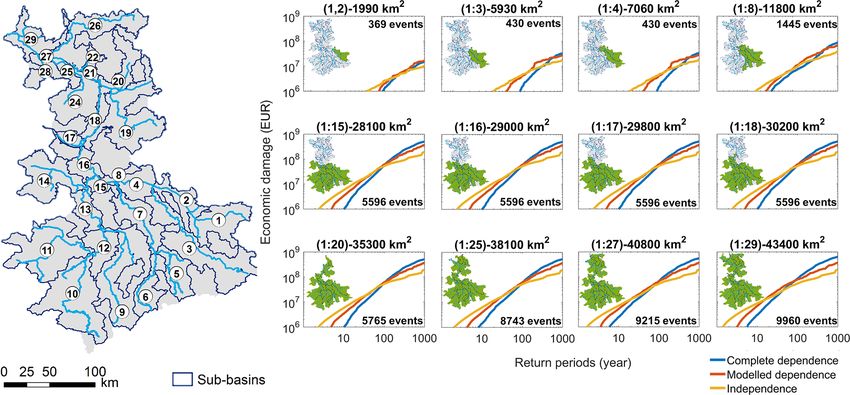
Nat. Hazards Earth Syst. Sci., 20, 967–979, 2020 www.nat-hazards-earth-syst-sci.net/20/967/2020/A. D. Metin et al.: The role of spatial dependence 973 Figure 3. Conceptual representation of the three assumptions on spatial dependence: (a) complete dependence, (b) modelled dependence and (c) complete independence. Return periods of damage are colour-coded at the sub-basin level. lower limit for large return periods. For smaller return peri- basins may experience large damage. These sub-basins are ods, however, we see the opposite effect. The damage is un- clustered, in this case in the northwest of the Elbe catch- derestimated under the assumption of complete dependence ment, illustrating the effect of spatial dependence. In con- for events with return periods smaller than 87 years. trast, the damages are not clustered under the complete de- The point where the risk curves of modelled dependence pendence and independence assumptions. For the 200-year and complete dependence intersect is called the “intersection event (Fig. 5b), almost all sub-basins indicate large damage point” in the following. For return periods up to this inter- under the complete dependence assumptions, resulting in the section point, the complete dependence assumption underes- overestimation under complete dependence assumption for timates the damage compared to modelled dependence; all the entire catchment. sub-basins show either no or small damages, as the flood peaks are mostly below the flood defences. However, for the 4.2 Variation in damage estimations with spatial scale assumption of modelled dependence, the return periods vary, under three dependence assumptions and a small to medium return period event at the scale of the entire Elbe catchment may be composed of many sub-basins To understand how the risk estimates for the three depen- without any damage but a few sub-basins with large dam- dence assumptions vary with spatial scale, the risk curves age because in these sub-basins the flood defences are over- for aggregations of sub-basins from upstream to the entire topped. A similar explanation holds for the situation beyond catchment are given in Fig. 6. As a general rule, smaller re- the intersection point: the complete dependence assumption gions should be characterized by stronger spatial dependence leads to events where all sub-basins tend to show large dam- of damage. This should lead to (1) an increasing difference ages, as flood defences are overtopped everywhere. In con- between the risk curves of the three dependence assumptions trast, under the modelled dependence assumption many sub- with increasing scale and (2) a shift of the modelled depen- basins show large damages as defences are overtopped; how- dence risk curve from the complete dependence towards in- ever there are also sub-basins without damage as a conse- dependence with increasing scale. Both effects are seen in quence of spatial variability. Fig. 6. The underestimation (overestimation) for small (large) re- The intersection point shifts from return periods of a few turn periods under the complete dependence assumption is hundred years for smaller aggregation areas, i.e. sub-basins a consequence of the strong link between the damages of 1 to 8 (up to 11 800 km2 ; upper panels in Fig. 6), to approxi- the different sub-basins. For better understanding, Fig. 5 il- mately 90 years for the larger areas. The intersection point is lustrates the spatial distribution of damages at the sub-basin mainly affected by the threshold where damage occurs, i.e. level for the three dependence assumptions that lead to the by the flood protection or elevated banks. This strong shift in 20- and 200-year event at the catchment scale. For the 20- the intersection point is, however, not a consequence of very year event, under the complete dependence assumption, all different flood defence standards in the up- and downstream sub-basins show either no damage or small to medium dam- parts of the Elbe catchment but rather results from data and age, leading to comparatively small damage at the scale of modelling errors. In particular, the small-scale variability in the entire basin (Fig. 5a). The 20-year event for the mod- precipitation extremes appeared to be insufficiently well cap- elled dependence assumption consists mainly of sub-basins tured by the weather generator in some sub-basins due to without any damage, but due to dike overtopping single sub- varying station density used for parameterization. Sub-basins www.nat-hazards-earth-syst-sci.net/20/967/2020/ Nat. Hazards Earth Syst. Sci., 20, 967–979, 2020
974                                                                              A. D. Metin et al.: The role of spatial dependence

Figure 4. Risk curves for the Elbe catchment for three dependence assumptions (complete dependence, complete independence and modelled
dependence). The left panel zooms in on the risk curves up to the 100-year return period of damage.

Figure 5. Distribution of damages at the sub-basin level for (a) the 20-year event and (b) 200-year event for three dependence assumptions.

1 to 8 (Mulde and Black Elster rivers) experience very small            4.3   Errors in expected annual damage (EAD) and in
damage even for high return periods, while the opposite is                    200-year damage under “false” assumptions of
true for sub-basins 9 to 14 (Saale River). This is explained                  spatial dependence
by the underestimation of damage for the Mulde and Black
Elster rivers and overestimation for the Saale River.                   Besides the risk curve, the EAD and the damage for a T -year
                                                                        return period are important risk measures. We assess here the
                                                                        200-year return period damage, which is particularly impor-
                                                                        tant for the insurance sector. Their percentage error under the
                                                                        complete dependence and independence assumptions, com-

Nat. Hazards Earth Syst. Sci., 20, 967–979, 2020                                  www.nat-hazards-earth-syst-sci.net/20/967/2020/
A. D. Metin et al.: The role of spatial dependence 975
Figure 6. Sub-basins in the Elbe catchment (left) and risk curves of aggregations of sub-basins (right) under complete dependence, modelled
dependence and independence. The aggregated sub-basins are ordered along increasing scale and are denoted by green within each risk curve
and the colon (:) between start and end sub-basin numbers.
5 Discussion
This study investigates the effects of spatial dependence of
flood generation processes on risk estimates. It compares the
“true” dependence scenario to the two endpoints, i.e. com-
plete dependence and complete independence. It is shown
that the assumption of complete spatial dependence, which
is often used in risk assessments, leads to under- and over-
estimation of flood risk for small and large return periods,
respectively.
Although several papers have suspected that the complete
Figure 7. Percentage error in expected annual damage (EAD) (a) dependence assumption may bias risk estimates, this bias has
and in economic damage for the 200-year event (b) under the as- been investigated by the two studies of Lamb et al. (2010)
sumptions of complete dependence and complete independence for and Wyncoll and Gouldby (2015) only. As these studies are
the entire Elbe catchment.
limited to small and medium study areas up to 15 000 km2 ,
our study is the first investigation for a large-scale river basin.
pared to the modelled dependence assumption, is given in In addition, our study uses a more elaborate set-up, as the
Fig. 7 for the entire Elbe catchment. The false assumptions spatial dependence of all processes along the flood risk chain,
about spatial dependence do not impact the EAD estimation. from the precipitation to the damage, is included. The larger
The EAD is the sum of 29 random variables, i.e. the damages study area allows us to investigate how the differences in
for the 29 sub-basins. As the mean value of a sum of random risk estimates change with increasing scale. The modelled
variables is not influenced by the correlation between the dependence estimate tends to be similar to the complete de-
variables, the spatial correlation can be neglected when one is pendence scenario for smaller areas and to shift towards the
only interested in the EAD. However, correlation influences independence scenario when the scale is increased. However,
the variance of a sum of random variables. Hence, for other this shift is not very prominent. We assume that the variety of
values, such as the 200-year event, it is crucial to include the processes that are involved in the generation of damage blurs
“true” spatial dependence pattern. In our case, the damage a clear signal when going from smaller to larger scales. The
for the 200-year event is overestimated (underestimated) un- spatio-temporal dynamics of flood damage events is influ-
der complete dependence (independence) by around 40 %. enced not only by the spatio-temporal dynamics of the trig-
gering rainfall event and antecedent catchment conditions but
also by the topology of the river network, flood wave super-
www.nat-hazards-earth-syst-sci.net/20/967/2020/ Nat. Hazards Earth Syst. Sci., 20, 967–979, 2020976 A. D. Metin et al.: The role of spatial dependence position, structural flood defences, and the spatial distribu- number of inundation events and damages may be underesti- tion of the asset values and their vulnerability. More work mated. This could affect the intersection point, i.e. the point is needed to better understand how the spatial dependencies where the underestimation of the complete dependence turns of different processes along the risk process chain influence into overestimation. Including dike breaches in the model the mismatch between modelled and complete dependence. might shift the intersection point to smaller return periods. If simple rules can be derived, they could be used to decide As expected from statistical reasoning, our study confirms whether the spatial dependence of the damage-generating that the EAD is not biased by false assumptions on spatial processes needs to be taken into account or whether a sim- dependence. If one is only interested in the EAD, spatial de- plified analysis neglecting spatial dependence would suffice. pendence can be neglected, which drastically simplifies the We are not aware of any study which discussed the inter- analysis. However, the EAD is a rather limited indicator of section point between modelled and complete dependence. risk, as discussed, for instance, by Merz et al. (2009). Fur- We show that the overestimation of risk by the complete ther, specific purposes demand assessments of certain risk dependence assumption that has been reported by Lamb et scenarios for which spatial dependence is crucial. According al. (2010) and Wyncoll and Gouldby (2015) applies to large to Article 101 of the European Solvency II Directive, insur- return periods only. For small return periods the complete ance companies are required to prove that they can cover at dependence assumption underestimates risk. This behaviour, least damage events with a return period of 200 years (EC, and the location of the intersection point, is mainly affected 2009). The spatial dependence in damage is also highly rel- by the damage threshold controlled by the flood defence level evant for disaster management or large-scale, strategic flood or elevated banks. planning. It is important, for instance, to understand the dis- Although each model in RFM has some limitations, RFM aster management resources that are needed for large-scale represents well the spatial patterns of the different flood gen- floods. eration processes (Falter et al., 2016; Metin et al., 2018). For this study, the model limitations of hydrologic, hydraulic and damage model accuracy are not seen as major concerns be- 6 Conclusions cause the different assumptions on spatial dependence are in- vestigated by using the same model chain. The spatial perfor- This paper analysed the impact of spatial dependence in flood mance of the weather generator with regards to precipitation, damage generation on risk estimates for the large-scale Elbe however, can have an effect on the final results. It is also more River basin in Germany. The “true” spatial dependence was challenging for the weather generator than capturing the local simulated with the continuous flood risk modelling approach statistics as previously discussed in the literature (e.g. Seri- proposed by Falter et al. (2015), where all processes, includ- naldi and Kilsby, 2014). The spatial dependence of high pre- ing their spatial dependence, from the flood-triggering rain- cipitation is often overestimated due to the use of isotropic fall to the damage processes, are considered. The bias be- covariance function (Serinaldi and Kilsby, 2014) as also ap- tween the widespread but false assumption of complete de- plied in our case. Although this limitation would presum- pendence and the modelled dependence was investigated as ably translate into the higher dependence of discharge peaks, a function of spatial scale. we believe, this is not critical for the presented study. The Our results show that for extreme events the economic results of modelled dependence are located between com- damage can be strongly overestimated when homogeneous plete dependence and complete independence for high re- return periods are assumed across the catchment. For the turn periods. With an ideal weather generator, they would be Elbe River basin, damage is overestimated by about 40 % closer to the complete independence. Thus, our estimates for for the 200-year event and by almost 100 % for the 500-year the difference between the assumption of complete depen- event. On the other hand, for events with small to medium dence and modelled dependence can be regarded as conser- return periods, the complete dependence assumption under- vative. Hence, the major conclusion challenging the assump- estimates damage. The intersection point where the underes- tion of homogeneous return periods (complete dependence) timation turns into an overestimation depends mainly on the still holds. Another limitation is the assumption that dikes damage threshold, i.e. on the flood defence level in protected can only be overtopped but do not breach. In reality, dike areas. breaches may lead to significant reductions of flood peaks The spatial scale, for which a risk estimate is sought, de- downstream of breach locations, and larger outflow volumes cides whether the modelled dependence assumption is closer can be observed in the inundated area compared to the no- to complete dependence or independence, respectively. The breach case. However, the modelling of dike breaching re- modelled dependence risk curve is closer to complete de- quires high computational time because the prediction of pendence for the upstream areas comprising the Mulde and breach locations is difficult, and hence a stochastic approach Black Elster rivers; with increasing scale it shifts towards the including multiple Monte Carlo runs would be needed. In independent case. Consequently, the overestimation under this study, the consideration of dike breaching would increase the complete dependence assumption increases with larger the computational time, which is already high. Hence, the areas. As a general rule, the true dependence might be Nat. Hazards Earth Syst. Sci., 20, 967–979, 2020 www.nat-hazards-earth-syst-sci.net/20/967/2020/
A. D. Metin et al.: The role of spatial dependence                                                                                         977

approximated by the complete dependence assumption for                   publication were covered by a Research
smaller regions, whereas for larger regions the independence             Centre of the Helmholtz Association.
assumption might serve as an approximation in a rough anal-
ysis when including the spatial dependence seems too costly
or demanding. However, our study does not allow specify-                 Review statement. This paper was edited by Maria-Carmen Llasat
ing in a generic way the scales at which a certain assumption            and reviewed by Attilio Castellarin and one anonymous referee.
might serve as approximation. More systematic analyses are
necessary to answer this question.
   If one is only interested in the expected annual damage               References
(EAD), then false assumptions on spatial dependence do not
bias its estimate. Although the EAD is an important risk indi-           Alfieri, L., Salamon, P., Bianchi, A., Neal, J., Bates, P., and
cator, for example for cost–benefit analyses of flood mitiga-              Feyen, L.: Advances in pan-European flood hazard mapping, Hy-
tion or in the insurance sector, we strongly advocate consid-              drol. Process., 28, 4067–4077, https://doi.org/10.1002/hyp.9947,
ering the complete risk curve, as it gives a much richer per-              2014.
spective on the risk and the effects of mitigation measures.             Alfieri, L., Feyen, L., Dottori, F., and Bianchi, A.: En-
                                                                           semble flood risk assessment in Europe under high end
Hence, we conclude that it is of highest relevance to realis-
                                                                           climate scenarios, Global Environ. Chang., 35, 199–212,
tically represent the spatial dependence of flood damage for               https://doi.org/10.1016/j.gloenvcha.2015.09.004, 2015.
large-scale risk estimates.                                              Alfieri, L., Feyen, L., and Di Baldassarre, G.: Increasing flood risk
                                                                           under climate change: a pan-European assessment of the bene-
                                                                           fits of four adaptation strategies, Clim. Change, 136, 507–521,
Data availability. The data used in this paper are not pub-                https://doi.org/10.1007/s10584-016-1641-1, 2016.
licly accessible; however, the authors can be contacted by               Alfieri, L., Bisselink, B., Dottori, F., Naumann, G., de Roo, A.,
email      (admetin@gfz-potsdam.de,     dung@gfz-potsdam.de,               Salamon, P., Wyser, K., and Feyen, L.: Global projections of
kai.schroeter@gfz-potsdam.de) for help in acquiring such                   river flood risk in a warmer world, Earth’s Futur., 5, 171–182,
data.                                                                      https://doi.org/10.1002/2016EF000485, 2017.
                                                                         BKG: Digitales Landbedeckungsmodell für Deutschland – DLM-
                                                                           DE2009, Stand der Dokumentation: 30.03.2012, available at:
Author contributions. BM conceived and supervised the study.               https://sg.geodatenzentrum.de/web_public/gdz/dokumentation/
BM, ADM, NVD and SV developed the concept. NVD, KS and                     deu/dlm-de2009.pdf (last access: 8 April 2020), 2012.
ADM performed simulations. ADM analysed the results. ADM pre-            BKG           GEODATENZENTRUM:                    ATKIS-Basis-DLM,
pared the paper, with contributions from all the co-authors. All au-       available           at:          https://gdz.bkg.bund.de/index.php/
thors made a substantial contribution to the interpretation of results     default/digitale-geodaten/digitale-landschaftsmodelle/
and provided important ideas to further improve the study.                 digitales-basis-landschaftsmodell-kompakt-basis-dlm-kompakt.
                                                                           html (last access: 8 April 2020), 2009.
                                                                         BMVBW: Normalherstellungskosten 2005, available at: http://
Competing interests. The authors declare that they have no conflict        www.bki.de/ (last access: 22 November 2019), 2005.
of interest.                                                             Bubeck, P., Aerts, J. C. J. H., de Moel, H., and Kreibich, H.: Preface:
                                                                           Flood-risk analysis and integrated management, Nat. Hazards
                                                                           Earth Syst. Sci., 16, 1005–1010, https://doi.org/10.5194/nhess-
Acknowledgements. We gratefully acknowledge funding from the               16-1005-2016, 2016.
European Union’s Horizon 2020 research and innovation pro-               Bubeck, P., Dillenardt, L., Alfieri, L., Feyen, L., Thieken,
gramme under the Marie Skłodowska-Curie grant agreement                    A. H., and Kellermann, P.: Global warming to increase
no. 676027 and from the German Research Foundation (DFG Re-                flood risk on European railways, Clim. Change, 155, 19–36,
search Group FOR 2416 SPATE). We thank the Federal Agency for              https://doi.org/10.1007/s10584-019-02434-5, 2019.
Cartography and Geodesy in Germany (BKG) for providing DEM               CRED and UNISDR: The Human Cost of Weather Related
data. We further thank Attilio Castellarin and one anonymous ref-          Disasters 1995-2015., available at: https://www.unisdr.org/
eree for their valuable input.                                             files/46796_cop21weatherdisastersreport2015.pdf (last access:
                                                                           22 November 2019), 2015.
                                                                         de Moel, H., van Alphen, J., and Aerts, J. C. J. H.: Flood
                                                                           maps in Europe – methods, availability and use, Nat. Hazards
Financial support. This research has been supported by the Euro-
                                                                           Earth Syst. Sci., 9, 289–301, https://doi.org/10.5194/nhess-9-
pean Union’s Horizon 2020 research and innovation programme
                                                                           289-2009, 2009.
under a Marie Skłodowska-Curie grant (grant no. 676027) and the
                                                                         de Moel, H., Jongman, B., Kreibich, H., Merz, B., Penning-
German Research Foundation (Deutsche Forschungsgemeinschaft
                                                                           Rowsell, E., and Ward, P. J.: Flood risk assessments at dif-
– DFG; grant no. FOR 2416).
                                                                           ferent spatial scales, Mitig. Adapt. Strateg. Gl., 20, 865–890,
                                                                           https://doi.org/10.1007/s11027-015-9654-z, 2015.
The article processing charges for this open-access
                                                                         Dumas, P., Hallegatte, S., Quintana-Seguì, P., and Martin, E.: The
                                                                           influence of climate change on flood risks in France – first es-

www.nat-hazards-earth-syst-sci.net/20/967/2020/                                    Nat. Hazards Earth Syst. Sci., 20, 967–979, 2020
978 A. D. Metin et al.: The role of spatial dependence
timates and uncertainty analysis, Nat. Hazards Earth Syst. Sci., butions to characterize the extremes, Water Resour. Res., 45,
13, 809–821, https://doi.org/10.5194/nhess-13-809-2013, 2013. W12412, https://doi.org/10.1029/2008WR007453, 2009.
EC: Directive 2007/60/EC of the European Parliament and of the Hundecha, Y. and Merz, B.: Exploring the relation-
Council of 23 October 2007 on the assessment and manage- ship between changes in climate and floods using a
ment of flood risks, European Parliament, Council, available model-based analysis, Water Resour. Res., 48, 1–21,
at: https://eur-lex.europa.eu/legal-content/EN/TXT/PDF/?uri= https://doi.org/10.1029/2011WR010527, 2012.
CELEX:32007L0060&from=EN (last access: 7 April 2020), ICPR: Rhine Atlas, available at: https://geoportal.bafg.de/mapapps/
2007. resources/apps/ICPR_DE/index.html?lang=de (last access:
EC: Directive 2009/138/EC of the European Parliament and of 8 April 2020), 2015.
the Council of 25 November 2009 on the taking-up and pur- IKSE: Internationaler Hochwasserrisikomanagementplan für
suit of the business of Insurance and Reinsurance (Solvency II), die Flussgebietseinheit Elbe, Teil A, Magdeburg, Germany,
available at: https://eur-lex.europa.eu/legal-content/EN/TXT/ available at: https://www.ikse-mkol.org/fileadmin/media/
PDF/?uri=CELEX:32009L0138&from=en (last access: 6 Au- user_upload/D/06_Publikationen/02_Hochwasserschutz/2015_
gust 2019), 2009. IKSE-IHWRMP.pdf (last access: 22 November 2019), 2015.
Elmer, F., Thieken, A. H., Pech, I., and Kreibich, H.: Influence INFAS Geodaten GmbH: Database Das DataWherehouse, Bonn,
of flood frequency on residential building losses, Nat. Hazards available at: https://infas360.de/infas-geodaten/ (last access:
Earth Syst. Sci., 10, 2145–2159, https://doi.org/10.5194/nhess- 8 April 2020), 2009.
10-2145-2010, 2010. IPCC: Managing the Risks of Extreme Events and Disasters to Ad-
Elmer, F., Hoymann, J., Düthmann, D., Vorogushyn, S., and vance Climate Change Adaptation, in: A Special Report of Work-
Kreibich, H.: Drivers of flood risk change in residen- ing Groups I and II of the Intergovernmental Panel on Climate
tial areas, Nat. Hazards Earth Syst. Sci., 12, 1641–1657, Change, edited by: Field, C. B., Barros, V., Stocker, T. F., Qin,
https://doi.org/10.5194/nhess-12-1641-2012, 2012. D., Dokken, D. J., Ebi, K. L., Mastrandrea, M. D., Mach, K. J.,
Falter, D., Vorogushyn, S., Lhomme, J., Apel, H., Gouldby, Plattner, G.-K., Allen, S. K., Tignor, M., and Midgley, P. M.,
B., and Merz, B.: Hydraulic model evaluation for large- Cambridge University Press, Cambridge, UK, and New York,
scale flood risk assessments, Hydrol. Process., 27, 1331–1340, NY, USA, 582 pp., 2012.
https://doi.org/10.1002/hyp.9553, 2013. Jankowfsky, S., Hilberts, A., Mortgat, C., Li, S., Xu, N.,
Falter, D., Schröter, K., Dung, N. V., Vorogushyn, S., Kreibich, Mei, Y., Tillmanns, S., Tian, Y., and Yang, Y.: The
H., Hundecha, Y., Apel, H., and Merz, B.: Spatially coherent RMS US inland flood model, E3S Web Conf., 7, 4–8,
flood risk assessment based on long-term continuous simula- https://doi.org/10.1051/e3sconf/20160704014, 2016.
tion with a coupled model chain, J. Hydrol., 524, 182–193, Jongman, B., Hochrainer-Stigler, S., Feyen, L., Aerts, J. C. J.
https://doi.org/10.1016/j.jhydrol.2015.02.021, 2015. H., Mechler, R., Botzen, W. J. W., Bouwer, L. M., Pflug, G.,
Falter, D., Dung, N. V., Vorogushyn, S., Schröter, K., Hundecha, Rojas, R., and Ward, P. J.: Increasing stress on disaster-risk
Y., Kreibich, H., Apel, H., Theisselmann, F. and Merz, B.: finance due to large floods, Nat. Clim. Chang., 4, 264–268,
Continuous, large-scale simulation model for flood risk as- https://doi.org/10.1038/nclimate2124, 2014.
sessments: Proof-of-concept, J. Flood Risk Manag., 9, 3–21, Jongman, B., Winsemius, H. C., Aerts, J. C. J. H., Coughlan de
https://doi.org/10.1111/jfr3.12105, 2016. Perez, E., van Aalst, M. K., Kron, W., and Ward, P. J.: De-
Feyen, L., Dankers, R., Bódis, K., Salamon, P., and Barredo, J. I.: clining vulnerability to river floods and the global benefits of
Fluvial flood risk in Europe in present and future climates, Clim. adaptation, Proc. Natl. Acad. Sci. USA, 112, E2271–E2280,
Change, 112, 47–62, https://doi.org/10.1007/s10584-011-0339- https://doi.org/10.1073/pnas.1414439112, 2015.
7, 2012. Keef, C., Svensson, C., and Tawn, J. A.: Spatial dependence in ex-
Ghizzoni, T., Roth, G., and Rudari, R.: Multisite flooding hazard treme river flows and precipitation for Great Britain, J. Hydrol.,
assessment in the Upper Mississippi River, J. Hydrol., 412–413, 378, 240–252, https://doi.org/10.1016/j.jhydrol.2009.09.026,
101–113, https://doi.org/10.1016/j.jhydrol.2011.06.004, 2012. 2009.
Gilles, D., Young, N., Schroeder, H., Piotrowski, J., and Chang, Krysanova, V., Müller-Wohlfeil, D. I., and Becker, A.: Develop-
Y. J.: Inundation mapping initiatives of the iowa flood center: ment and test of a spatially distributed hydrological/water quality
Statewide coverage and detailed urban flooding analysis, Wa- model for mesoscale watersheds, Ecol. Modell., 106, 261–289,
ter (Switzerland), 4, 85–106, https://doi.org/10.3390/w4010085, https://doi.org/10.1016/S0304-3800(97)00204-4, 1998.
2012. Lamb, R., Keef, C., Tawn, J., Laeger, S., Meadowcroft, I., Suren-
Grimaldi, S., Petroselli, A., Arcangeletti, E., and Nardi, F.: dran, S., Dunning, P., and Batstone, C.: A new method to assess
Flood mapping in ungauged basins using fully continu- the risk of local and widespread flooding on rivers and coasts, J.
ous hydrologic-hydraulic modeling, J. Hydrol., 487, 39–47, Flood Risk Manag., 3, 323–336, https://doi.org/10.1111/j.1753-
https://doi.org/10.1016/j.jhydrol.2013.02.023, 2013. 318X.2010.01081.x, 2010.
Hall, J. W., Sayers, P. B., and Dawson, R. J.: National-scale as- Lammersen, R., Engel, H., Van de Langemheen, W., and
sessment of current and future flood risk in England and Wales, Buiteveld, H.: Impact of river training and retention measures
Nat. Hazards, 36, 147–164, https://doi.org/10.1007/s11069-004- on flood peaks along the Rhine, J. Hydrol., 267, 115–124,
4546-7, 2005. https://doi.org/10.1016/S0022-1694(02)00144-0, 2002.
Hundecha, Y., Pahlow, M., and Schumann, A.: Modeling of daily Mastin, M. C.: Flood-Hazard Mapping in Honduras in Response to
precipitation at multiple locations using a mixture of distri- Hurricane Mitch, U.S. Geological Survey Water-Resources In-
vestigations Report 01-4277, Tacoma, Washington, 2002.
Nat. Hazards Earth Syst. Sci., 20, 967–979, 2020 www.nat-hazards-earth-syst-sci.net/20/967/2020/A. D. Metin et al.: The role of spatial dependence 979 Merz, B., Thieken, A. H., and Gocht, M.: Flood risk mapping at the Thieken, A. H., Olschewski, A., Kreibich, H., Kobsch, S., and Merz, local scale: Concepts and challenges, in Flood Risk Management B.: Development and evaluation of FLEMOps – A new Flood in Europe, Advances in Natural and Technological Hazards Re- Loss Estimation MOdel for the private sector, WIT Trans. Ecol. search, vol. 25, edited by: Begum, S., Stive, M. J. F., and Hall, J. Envir., 118, 315–324, https://doi.org/10.2495/FRIAR080301, W., 231–251, 2007. 2008. Merz, B., Elmer, F., and Thieken, A. H.: Significance of “high Thieken, A. H., Apel, H., and Merz, B.: Assessing the proba- probability/low damage” versus “low probability/high damage” bility of large-scale flood loss events: A case study for the flood events, Nat. Hazards Earth Syst. Sci., 9, 1033–1046, river Rhine, Germany, J. Flood Risk Manag., 8, 247–262, https://doi.org/10.5194/nhess-9-1033-2009, 2009. https://doi.org/10.1111/jfr3.12091, 2015. Merz, B., Hall, J., Disse, M., and Schumann, A.: Fluvial flood risk Thieken, A. H., Kienzler, S., Kreibich, H., Kuhlicke, C., Kunz, management in a changing world, Nat. Hazards Earth Syst. Sci., M., Mühr, B., Müller, M., Otto, A., Petrow, T., Pisi, S., and 10, 509–527, https://doi.org/10.5194/nhess-10-509-2010, 2010. Schröter, K.: Review of the flood risk management system in Merz, B., Aerts, J., Arnbjerg-Nielsen, K., Baldi, M., Becker, A., Germany after the major flood in 2013, Ecol. Soc., 21, 51, Bichet, A., Blöschl, G., Bouwer, L. M., Brauer, A., Cioffi, https://doi.org/10.5751/ES-08547-210251, 2016. F., Delgado, J. M., Gocht, M., Guzzetti, F., Harrigan, S., Tingsanchali, T. and Karim, M. F.: Flood hazard and risk analysis in Hirschboeck, K., Kilsby, C., Kron, W., Kwon, H.-H., Lall, U., the southwest region of Bangladesh, Hydrol. Process., 19, 2055– Merz, R., Nissen, K., Salvatti, P., Swierczynski, T., Ulbrich, U., 2069, https://doi.org/10.1002/hyp.5666, 2005. Viglione, A., Ward, P. J., Weiler, M., Wilhelm, B., and Nied, M.: Uhlemann, S., Thieken, A. H., and Merz, B.: A consistent set Floods and climate: emerging perspectives for flood risk assess- of trans-basin floods in Germany between 1952–2002, Hydrol. ment and management, Nat. Hazards Earth Syst. Sci., 14, 1921– Earth Syst. Sci., 14, 1277–1295, https://doi.org/10.5194/hess-14- 1942, https://doi.org/10.5194/nhess-14-1921-2014, 2014a. 1277-2010, 2010. Merz, B., Elmer, F., Kunz, M., Mühr, B., Schröter, UNISDR: Global Assessment Report 2013, UNISDR, Geneva, K., and Uhlemann-Elmer, S.: The extreme flood in available at: https://www.preventionweb.net/english/hyogo/gar/ June 2013 in Germany, Houille Blanche, 1, 5–10, 2015/en/gar-pdf/previousGAR/GAR2013_EN.pdf (last access: https://doi.org/10.1051/lhb/2014001, 2014b. 8 April 2020), 2013. Metin, A. D., Dung, N. V., Schröter, K., Guse, B., Apel, H., Vorogushyn, S., Bates, P. D., de Bruijn, K., Castellarin, A., Kreibich, H., Vorogushyn, S., and Merz, B.: How do changes Kreibich, H., Priest, S., Schröter, K., Bagli, S., Blöschl, G., along the risk chain affect flood risk?, Nat. Hazards Earth Domeneghetti, A., Gouldby, B., Klijn, F., Lammersen, R., Neal, Syst. Sci., 18, 3089–3108, https://doi.org/10.5194/nhess-18- J. C., Ridder, N., Terink, W., Viavattene, C., Viglione, A., Za- 3089-2018, 2018. nardo, S., and Merz, B.: Evolutionary leap in large-scale flood Nied, M., Schröter, K., Lüdtke, S., Nguyen, V. D., and risk assessment needed, Wiley Interdiscip, Rev. Water, 5, e1266, Merz, B.: What are the hydro-meteorological controls https://doi.org/10.1002/wat2.1266, 2018. on flood characteristics?, J. Hydrol., 545, 310–326, Ward, P. J., Jongman, B., Weiland, F. S., Bouwman, A., Van https://doi.org/10.1016/j.jhydrol.2016.12.003, 2017. Beek, R., Bierkens, M. F. P., Ligtvoet, W., and Winsemius, Quinn, N., Bates, P. D., Neal, J., Smith, A., Wing, O., Sampson, C., H. C.: Assessing flood risk at the global scale: Model Smith, J., and Heffernan, J.: The Spatial Dependence of Flood setup, results, and sensitivity, Environ. Res. Lett., 8, 044019, Hazard and Risk in the United States, Water Resour. Res., 55, https://doi.org/10.1088/1748-9326/8/4/044019, 2013. 1890–1911, https://doi.org/10.1029/2018WR024205, 2019. Winsemius, H. C., Van Beek, L. P. H., Jongman, B., Ward, P. Rodda, H. J. E.: The development of a stochastic rainfall model J., and Bouwman, A.: A framework for global river flood for UK flood modelling, in Generation of Hydrometeorological risk assessments, Hydrol. Earth Syst. Sci., 17, 1871–1892, Reference Conditions for Assessment of Flood Hazard in Large https://doi.org/10.5194/hess-17-1871-2013, 2013. River Basins, CHR-Report No. I-20, edited by: Krahe, P. and Winsemius, H. C., Aerts, J. C. J. H., van Beek, L. P. H., Bierkens, Herpetz, D., Koblenz, 2001. M. F. P., Bouwman, A., Jongman, B., Kwadijk, J. C. J., Ligtvoet, Rojas, R., Feyen, L., and Watkiss, P.: Climate change W., Lucas, P. L., van Vuuren, D. P., and Ward, P. J.: Global and river floods in the European Union: Socio- drivers of future river flood risk, Nat. Clim. Chang., 6, 1–5, economic consequences and the costs and benefits of https://doi.org/10.1038/nclimate2893, 2015. adaptation, Global Environ. Chang., 23, 1737–1751, Wünsch, A., Herrmann, U., Kreibich, H., and Thieken, A. H.: https://doi.org/10.1016/j.gloenvcha.2013.08.006, 2013. The role of disaggregation of asset values in flood loss es- Schröter, K., Kunz, M., Elmer, F., Mühr, B., and Merz, B.: What timation: A comparison of different modeling approaches at made the June 2013 flood in Germany an exceptional event? A the mulde river, Germany, Environ. Manage., 44, 524–541, hydro-meteorological evaluation, Hydrol. Earth Syst. Sci., 19, https://doi.org/10.1007/s00267-009-9335-3, 2009. 309–327, https://doi.org/10.5194/hess-19-309-2015, 2015. Wyncoll, D. and Gouldby, B.: Integrating a multivariate extreme Serinaldi F. and Kilsby C. G.: Simulating daily rainfall fields over value method within a system flood risk analysis model, J. Flood large areas for collective risk Estimation, J. Hydrol., 512, 285– Risk Manage., 8, 145–160, https://doi.org/10.1111/jfr3.12069, 302, https://doi.org/10.1016/j.jhydrol.2014.02.043, 2014. 2015. te Linde, A. H., Bubeck, P., Dekkers, J. E. C., de Moel, H., and Aerts, J. C. J. H.: Future flood risk estimates along the river Rhine, Nat. Hazards Earth Syst. Sci., 11, 459–473, https://doi.org/10.5194/nhess-11-459-2011, 2011. www.nat-hazards-earth-syst-sci.net/20/967/2020/ Nat. Hazards Earth Syst. Sci., 20, 967–979, 2020
You can also read


