Basel AML Index 2021: 10th Public Edition
Ranking money laundering and terrorist
financing risks around the world
←
→
Page content transcription
If your browser does not render page correctly, please read the page content below

Basel AML Index 2021: 10th Public Edition Ranking money laundering and terrorist financing risks around the world

B A S E L A M L I N D E X 10 T H P U B L I C E D I T I O N 2 0 21

                                                                               04
                                                                          1 INTRODUCTION

                                                                               07
                                              2 TREND 1: VIRTUAL ASSETS AND MONEY LAUNDERING

                                                                               11
                                                  3 TREND 2: EFFECTIVENESS OF AML / CFT SYSTEMS

                                                                               15
               4 TREND 3: BENEFICIAL OWNERSHIP AS A PILLAR OF EFFECTIVE AML / CFT SYSTEMS

                                                                               21
                             5 TREND 4: ML / TF VULNERABILITIES BEYOND THE FINANCIAL SECTOR

                                                                               24
                                                                       6 SCORES AND RANKING

                                                                               26
                                                                         7 REGIONAL FOCUS

                                                                               43
                                                        8 EXPERT EDITION AND EXPERT EDITION PLUS

                                                                               45
                                                                       9 ABOUT AND CONTACT

                                                                               46
                                                                      10 ANNEX I: METHODOLOGY

                                                                               50
                       11 ANNEX II: JURISDICTIONS NOT INCLUDED DUE TO A LACK OF 4TH-ROUND
                                                                          FATF EVALUATION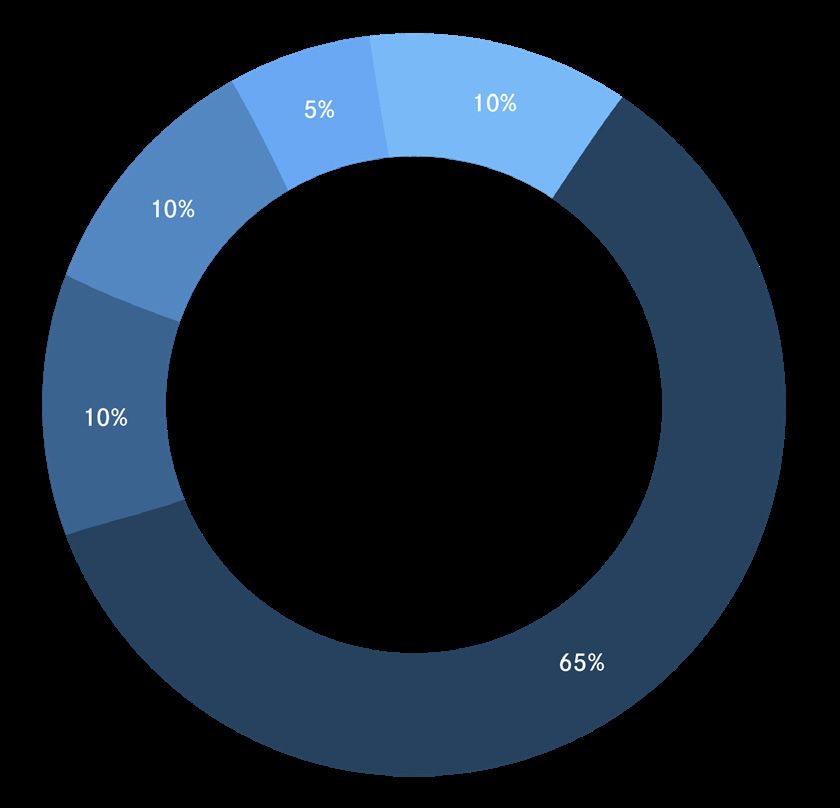
B A S E L A M L I N D E X 10 T H P U B L I C E D I T I O N 2 0 21

                    Acronyms and abbreviations
AML			Anti-Money Laundering

AMLD			                                          Anti-Money Laundering Directive (EU)

CDD			                                           Customer Due Diligence

CFT			                                           Counter Financing of Terrorism

DNFBP			                                         Designated Non-Financial Businesses and Professionals

EU			European Union

FATF			                                          Financial Action Task Force

IO			                                            Immediate Outcome (FATF effectiveness measure)

ML / TF			                                       Money Laundering and Terrorist Financing

R.			                                            Recommendation (FATF standard)

TCSP			                                          Trust and Company Service Provider

UAE			                                           United Arab Emirates

US			United States

VASP			                                          Virtual Asset Service Provider

WEF			                                           World Economic Forum

About this report

The Basel AML Index is developed and maintained by the International Centre for Asset Recovery at the Basel Institute
on Governance.

This report is licensed under a Creative Commons Attribution-NonCommercial-NoDerivatives 4.0 International License
(CC BY-NC-ND 4.0).

Suggested citation: Basel Institute on Governance, 2021. Basel AML Index 2021: 10th Public Edition – Ranking money
laundering and terrorist financing risks around the world. Available at: https://index.baselgovernance.org.

While we have made reasonable efforts to ensure the accuracy and completeness of information provided in this report,
neither the authors nor the Basel Institute on Governance nor our donors and collaborators assume any responsibility
or liability for any errors or omissions, or for your use of the information and opinions contained in the report. Please
send any feedback to: index@baselgovernance.org.

                                                                          3
B A S E L A M L I N D E X 10 T H P U B L I C E D I T I O N 2 0 21
1 Introduction
This report accompanies the 10th Public Edition of the Basel AML Index, released in September 2021.
The Basel AML Index measures the risk of money laundering and terrorist financing (ML / TF) in
jurisdictions around the world. Risk, as measured by the Basel AML Index, is defined as a jurisdiction’s
vulnerability to ML / TF and its capacities to counter it; it is not intended as a measure of the actual
amount of ML / TF activity in a given jurisdiction.
Published annually since 2012, the Basel AML Index remains the only independent, research-based
index by a non-profit organisation ranking jurisdictions according to their risk of ML / TF.
1.1 Calculating and interpreting risk scores
Risk scores are based on data from publicly available sources such as the Financial Action Task Force
(FATF), Transparency International, the World Bank and the World Economic Forum. They cover 17
indicators in five domains relevant to assessing ML / TF risk at the jurisdiction level:
1. Quality of AML / CFT Framework
2. Bribery and Corruption
3. Financial Transparency and Standards
4. Public Transparency and Accountability
5. Legal and Political Risks
The Public Edition of the Basel AML Index reflects the overall score of jurisdictions in terms of their risk
exposure to ML / TF. However, and while the Basel AML Index does provide a ranking in accordance
with this score, we strongly advise against a superficial comparison of countries in accordance with
their ranking.
Instead, we encourage users to look at regional and global trends, and developments over time, and
at what the Basel AML Index says about remaining weaknesses in the global response to ML / TF. We
also encourage users to conduct a more in-depth analysis of individual countries or regions or risk
factors by using the more comprehensive data that is available in the Expert Edition.
4B A S E L A M L I N D E X 10 T H P U B L I C E D I T I O N 2 0 21 1 INTRODUCTION
1.2 AML risk trends in 2021
Crunching data on money laundering risks for the Basel AML Index reveals interesting – and often
concerning – trends. This year, we look at the data behind four topics that are hitting headlines:
Beneficial ownership
Virtual assets
How slow and ineffective implementation of
The latest data on how jurisdictions are
beneficial ownership registries continues to
responding to money laundering threats related
provide safe havens for dirty money.
to virtual assets.
This is damaging for individual jurisdictions, but
The answer: not well at all.
more importantly undermines all global efforts to
combat money laundering.
Effective AML systems Non-financial professions
Are jurisdictions more effective at prevention Lawyers, accountants, real estate agents and
of money laundering or at enforcement? other non-financial businesses and professions
continue to underperform on compliance with
Ineffective systems are the general rule, but AML / CFT standards.
jurisdictions consistently score worse for
prevention than for enforcement. More supervision is urgently needed to close that gap.
These concerns are described in the following sections, followed by an analysis of regional risk trends
and insights.
1.3 Methodology and expert review
The methodology is described in detail in Annex I, with more information on the underlying indicators
available on our website. It is essential to familiarise yourself well with the methodology to ensure that
you fully understand what the Basel AML Index can and cannot show. This will ensure that you interpret
the results properly and that any action you may take in response to the ranking is well founded.
The method employed by the Basel AML Index to calculate the risk scores is reviewed every year by an
independent panel of experts to ensure that the method continues to meet best practice standards, and
that the ranking is accurate, plausible and continues to capture the latest developments in ML / TF risks.
View the Basel AML Index interactive
map and ranking on our new website at
index.baselgovernance.org
5B A S E L A M L I N D E X 10 T H P U B L I C E D I T I O N 2 0 21 1 INTRODUCTION
1.4 Public, Expert and Expert Plus editions
Public Edition
The Public Edition of the Basel AML Index 2021, and the analysis in this report, covers 110 jurisdictions. This year,
we are including only jurisdictions that have been evaluated using the FATF’s fourth-round methodology, in order
to provide a reliable basis for comparison. A separate list in Annex II also includes 45 jurisdictions with older FATF
evaluations but otherwise sufficient data to calculate a risk score.
Expert Edition
The Expert Edition, which includes a customisable interactive ranking, jurisdiction profiles and data downloads, covers
203 jurisdictions. Companies and financial institutions use the Expert Edition for compliance and risk assessment
purposes. In the public sector and academia, the Expert Edition supports AML / CFT research and policymaking.
Expert Edition Plus
Expert Edition Plus subscribers benefit from an in-depth quantitative and written analysis of FATF reports, plus special
reports on money laundering risks in Jersey, Guernsey, Isle of Man, Gibraltar and the Cayman Islands.
6B A S E L A M L I N D E X 10 T H P U B L I C E D I T I O N 2 0 21
2 Trend 1: Virtual assets and
money laundering
The latest data on how jurisdictions are responding to money
laundering threats related to virtual assets. The answer: not well at all.
2.1 Money laundering threats from cryptocurrencies
The use of virtual assets such as cryptocurrencies is exploding – for legitimate as well as illicit purposes.
In January 2021, there were an estimated 106 million cryptocurrency users globally. Data on how any
of these may be using cryptocurrencies for criminal purposes, including to launder stolen money, is
however scarce. According to a 2021 report by blockchain analysis firm Chainalysis, of the estimated
USD 21.4 billion in cryptocurrency transactions in 2019, criminal activity represented around 2.1
percent (USD 450 million).
Cryptocurrencies have unique characteristics, many of which are very positive, including for example
the potential to improve financial inclusion. Yet their borderless nature and existence outside the formal
financial system also make them a tempting option for criminals to conceal proceeds of corruption and
other crimes, evade tax or fund terrorism.
Box 1: Mitigating ML / TF threats from virtual assets – FATF Recommendation 15
In 2018, in an effort to motivate jurisdictions to take action to prevent virtual assets
becoming a threat to global financial stability, the FATF revised its Recommendation 15 on
virtual assets and virtual asset service providers (VASPs). Finalised amendments, an
Interpretive Note and accompanying Guidance for a Risk-Based Approach to Virtual Assets
and Virtual Asset Service Providers followed in 2019. In essence, the revised Recommendation
requires among other things:
• Jurisdiction must apply a risk-based approach to AML / CFT risks associated with
virtual assets.
• VASPs should be licensed/registered, and subject to adequate regulation and
supervision.
• VASPS must conduct customer due diligence on one-off transactions over USD/
EUR 1,000, and submit suspicious activity reports where needed.
7B A S E L A M L I N D E X 10 T H P U B L I C E D I T I O N 2 0 21 2 T R E N D 1: V I R T U A L A S S E T S A N D M O N E Y L A U N D E R I N G
• VASPs should obtain information about the originator and beneficiary of transfers
and make it available to competent authorities (the so-called travel rule).
The FATF defines the term “virtual asset” as any “digital representation of value that can be
digitally traded, or transferred, and can be used for payment or investment purposes”. This
does not include digital representations of fiat currencies or other financial assets included
elsewhere in its Recommendations.
VASPs include natural or legal persons that offer services such as exchanging between virtual
assets and fiat currencies, exchanging between different forms of virtual assets, transferring
virtual assets, safekeeping or administering virtual assets, or providing other financial services
relating to virtual assets.
In July 2020 and July 2021, the FATF issued the first and second reports on the results of 12-month
reviews on the revised standard.
2.2 How are jurisdictions doing at mitigating their risks of money
laundering using virtual assets?
It is still early days, as the final version of the revised Recommendation 15 was only issued in June
2019. However, initial signs are not encouraging.
• Of the 27 jurisdictions assessed or reassessed1 for technical compliance with the new R.15
from June 2020 to June 2021, 19 downgraded their scores. Five jurisdictions retained the
same scores and only three managed to improve.
• The average compliance score for R.15 across all jurisdictions assessed with the latest (fourth-
round) FATF methodology decreased from 70% to 60%.
• Of the 10 jurisdictions assessed with Mutual Evaluation Reports, none was rated as being
compliant. Two jurisdictions were non-compliant (score of 0), 5 were partially compliant (score
of 1 out of 3) and 3 were largely compliant (score of 2 out of 3).
70% 19% 11%
19 decreased 5 stayed the same 3 increased
1 Ten jurisdictions were assessed with Mutual Evaluation Reports. Seventeen jurisdictions were re-assessed with Follow-Up Reports. All reports
are available on the FATF website.
8B A S E L A M L I N D E X 10 T H P U B L I C E D I T I O N 2 0 21 2 T R E N D 1: V I R T U A L A S S E T S A N D M O N E Y L A U N D E R I N G
2.3 Is there a risk of “regulator shopping” in the virtual assets sector?
Yes. The consequences of individual failings by jurisdictions in implementing effective AML / CFT
requirements on VASPs could be serious.
The reason is simple and visible in regular money laundering schemes too: criminals wishing to abuse
virtual assets for illicit purposes can simply switch from jurisdictions with a strong regulatory framework
to one in which regulations are weak and not enforced. This risk is exacerbated by the hyper-global
nature of virtual assets.
A lack of coordinated and concerted global action may therefore result in some jurisdictions becoming
safe havens for illicit activity using virtual assets.
This challenge has been recognised by the European Commission’s June 2021 package of proposals
to tackle ML / TF, which includes an ambitious plan to harmonise AML / CFT legislation, in relation
to VASPs, across all EU jurisdictions. This is a positive move, but without similar efforts among other
jurisdictions and regional bodies, it is likely that the illicit activity will simply move to locations with
fewer or no controls.
2.4 What are the biggest issues to fix, and how can jurisdictions
with upcoming FATF assessments obtain a better evaluation?
The FATF’s second review of trends with regard to the implementation of the revised R.15 indicated
progress in certain areas, including with respect to transposing the new requirements into domestic
legislation, submitting suspicious activity reports and establishing supervisory regimes.
Significant gaps however remain, in particular in the following areas:
• Weak implementation of the “travel rule” (see Box 1), meaning that information on the
originators and beneficiaries of cryptocurrency transactions is not being obtained or made
available to competent authorities.
• Sluggish action by jurisdictions in implementing AML / CFT obligations in the virtual assets
sector, with infrequent examinations or sanctioning.
• Generally, a lack of knowledge and expertise among supervisory/regulatory bodies in the
field of virtual assets, reducing their ability to oversee and guide VASPs.
9B A S E L A M L I N D E X 10 T H P U B L I C E D I T I O N 2 0 21 2 T R E N D 1: V I R T U A L A S S E T S A N D M O N E Y L A U N D E R I N G
2.5 What data is available to assess ML / TF risks relating to virtual
assets?
The new and fast-evolving nature of the virtual assets sector means that reliable data relevant to
evaluating money laundering risks is not widely available.
Regular market data on virtual assets, such as the use of cryptocurrencies and the location of
cryptocurrency mining centres, are largely collected and analysed by blockchain analytic companies
such as Chainalysis, CipherTrace, Coinfirm, Elliptic, Merkle Science, Scorechain, TRM Labs.2
However, the differences in methodologies, analytical techniques and tools, along with the proprietary
nature of the data, mean that comparability is difficult. The data also tend to focus on a select few
cryptocurrencies only and are therefore not sufficiently comprehensive for this purpose.
A prerequisite for evaluating risks of ML / TF relating to virtual assets is understanding geographical
trends in their use and regulation.
• Chainalysis issued a helpful analysis of such geographic trends in September 2020, although
it does not provide data on the risk of misuse of cryptocurrencies.
• Statistica published a list of jurisdictions with the highest cryptocurrency use per capita in March
2021. There is however no evidence as yet that a lack of regulation or intensive usage of virtual
currencies in a population correlates with an increased risk of ML / TF using virtual assets.
We therefore suggest that the FATF assessment of jurisdictions’ compliance with R.15 remains the
most reliable source of data on ML / TF risks relating to virtual assets. It also has the virtue of enabling
comparisons across jurisdictions and measurement of progress over time.
2 These companies were selected by the FATF to develop market metrics on virtual assets.
10B A S E L A M L I N D E X 10 T H P U B L I C E D I T I O N 2 0 21
3 Trend 2: Effectiveness of
AML / CFT systems
Are jurisdictions more effective at prevention of money laundering or at
enforcement? Ineffective systems are the general rule, but jurisdictions
consistently score worse for prevention than for enforcement.
3.1 Assessing the effectiveness of AML / CFT systems
Last year’s Basel AML Index lamented jurisdictions’ consistently poor results in terms of the
effectiveness of their AML / CFT systems. It is all too common for jurisdictions to have laws and
institutions in place that are largely compliant with FATF Recommendations yet ineffective in practice.
The Wolfsberg Group, a Collective Action initiative of 13 global banks that develops frameworks and
guidance on financial crime risks, reinforced our concerns in a June 2021 statement on Demonstrating
Effectiveness:
“[L]argely in response to supervisory expectations, AML / CFT risk assessments are focused
on technical compliance with requirements rather than the effectiveness of the [financial
institution’s] efforts to prevent and detect financial crime”.
Data on the effectiveness of AML / CFT systems is drawn from the FATF Mutual Evaluation Reports.
The FATF’s fourth-round methodology uses 11 “Immediate Outcomes” (IOs) to assess the effectiveness
of AML / CFT systems according to its 40 Recommendations.
The 11 IOs and the assessment methodology are detailed on the FATF website.
3.2 Is there any sign of improvement in the figures for 2021?
Not really. Based on the latest FATF data, the average score for effectiveness across all assessed
jurisdictions is only 30%. That is two times lower than the average score for technical compliance
with FATF Recommendations, which stands at 64%.
Technical compliance 64%
Effectiveness 30%
11B A S E L A M L I N D E X 10 T H P U B L I C E D I T I O N 2 0 21 3 TREND 2: EFFECTIVENESS OF AML / CF T SYSTEMS
Weak spots vary between jurisdictions, but overall they are as follows:
Average effectiveness across all assessed jurisdictions
IO3 IO4 IO5 IO7 IO11
WHAT IT MEASURES
Supervisors Financial Legal persons and Money laundering Persons and
appropriately institutions, arrangements are offences and entities involved in
supervise, monitor DNFBPs and prevented from activities are the proliferation of
and regulate VASPs adequately misuse for money investigated and weapons of mass
financial apply AML/CFT laundering or offenders are destruction are
institutions, preventive terrorist financing, prosecuted and prevented from
DNFBPs and measures and information on subject to raising, moving and
VASPs for commensurate their beneficial effective, using funds,
compliance with with their risks, ownership is proportionate and consistent with the
AML/CFT and report available to dissuasive relevant UNSCRs.
requirements suspicious competent sanctions.
commensurate transactions. authorities without
with their risks. impediments.
26% 24% 22% 21% 25%
3.3 Are jurisdictions doing better at prevention or enforcement?
Ideally, AML / CFT systems need to be particularly effective at preventing money laundering from
occurring. Enforcement remains of course important, and it must be effective. But relying too heavily
on catching the criminals post factum presents an unreasonable risk and also means that some
damage invariably will remain.
So we should be asking if jurisdictions doing enough on the prevention side, or if they are too heavily
focused on enforcement. To explore this question, we divided FATF data on effectiveness criteria
(IOs, see chart above) into two categories: 3
3 IO2 is not included as it refers to elements of both prevention and enforcement, while IO11 is not relevant to the topic.
12B A S E L A M L I N D E X 10 T H P U B L I C E D I T I O N 2 0 21 3 TREND 2: EFFECTIVENESS OF AML / CF T SYSTEMS
Prevention Enforcement
IO1: Risk, policy and coordination IO7: Money laundering investigation and
prosecution
IO3: Supervision IO8: Confiscation
IO4: Preventive measures IO9: Terrorist financing investigation and
prosecution
IO5: Legal persons and arrangements IO6: Financial intelligence (mainly
enforcement)
IO10: Terrorist financing preventive
measures (mainly prevention)
Based on an analysis of 112 jurisdictions assessed with the fourth-round methodology by 15 July 2021,
the data shows that jurisdictions are less effective at preventing ML / TF than at enforcing AML / CFT
measures. And this is in a context where performance for enforcement is unsatisfactory already.
• Globally, average effectiveness for prevention was 27%, compared to 31% for enforcement.
• Nineteen jurisdictions (17%) scored zero for the effectiveness of their preventive measures,
compared to 12 jurisdictions (11%) for enforcement.
• Nine jurisdictions demonstrated zero effectiveness in both prevention and enforcement
criteria. These are: Cape Verde, Democratic Republic of the Congo, Haiti, Mali, Mauritania,
Mozambique, Pakistan, Uganda and Vanuatu.
• The UK and Spain are the only jurisdictions assessed so far to achieve scores of 67% or
above for both prevention and effectiveness criteria.
A regional perspective shows some variation, but the same overall story: When it comes to money
laundering, jurisdictions seem to be more effective at enforcement than prevention. That being said,
it is a well known fact that measuring effectiveness in prevention is considerably more difficult than
measuring effectiveness at enforcement, for which data and statistics are often available from law
enforcement and judicial actions.
13B A S E L A M L I N D E X 10 T H P U B L I C E D I T I O N 2 0 21 3 TREND 2: EFFECTIVENESS OF AML / CF T SYSTEMS
Region Prevention average Enforcement average
East Asia and Pacific 26% 32%
Eastern Europe and Central Asia 37% 38%
Latin America and Caribbean 25% 26%
Middle East and Northern Africa 32% 40%
North America 53% 56%
South Asia 7% 13%
Sub-Saharan Africa 5% 8%
Western Europe and EU 37% 43%
These findings should ring an alarm bell for policy makers. Jurisdictions should invest more resources
in the prevention of ML / TF, because a fire contained is always better than an arsonist caught when
the house has burnt down, while of course the arsonists must be caught and punished.
That being said, we are far from arguing that such an increase of resources for prevention should
come at the detriment of enforcement. On the contrary, both sides clearly need a serious boost,
except perhaps the boost for prevention needs to be even more serious than that for enforcement.
14B A S E L A M L I N D E X 10 T H P U B L I C E D I T I O N 2 0 21
4 Trend 3: Beneficial ownership
as a pillar of effective
AML / CFT systems
How slow and ineffective implementation of beneficial ownership registries
continues to provide safe havens for dirty money. This is damaging for
individual jurisdictions, but more importantly undermines all global efforts
to combat money laundering.
4 .1 Beneficial ownership and resilience to ML / TF threats
Beneficial ownership transparency is directly related to the effectiveness of a jurisdiction’s AML
systems and the essential role of these systems in preventing, detecting, prosecuting and sanctioning
financial crimes. It is therefore crucial to a jurisdiction’s resilience against ML / TF threats.
Both public authorities (law enforcement, Financial Intelligence Units) and private actors (financial
institutions and Designated Non-Financial Businesses and Professions, or DNFBPs) are responsible
for maintaining this resilience.
For public authorities, low transparency of beneficial ownership and anonymity of some legal
arrangements hamper ML / TF investigations and attempts to trace and freeze illicit assets.
This is because of the very nature of money laundering, which is to disguise the criminal origins of
money and take a number of actions to introduce it into the financial system and make it appear legal.
Criminals often use complex “layers” of legal corporate structures spanning multiple jurisdictions to
hide the illicit origin of their money. If such layering activities remain undetected, the money is more
easily integrated into the financial system. It then becomes much more difficult for law enforcement
authorities to identify and prosecute the crimes and to recover whatever is left of the money.
This is especially the case where the trail of the money passes through multiple jurisdictions with very
different methods for recording and sharing beneficial ownership information. This problem of opaque
beneficial ownership arrangements also applies to terrorist financing crimes, where criminals aim not
only to stay undetected but to circumvent sanctions lists.
For the private sector, the information contained in beneficial ownership registers is also essential
to effective AML / CFT compliance processes.
15B A S E L A M L I N D E X 10 T H P U B L I C E D I T I O N 2 0 21 4 T R EN D 3: B EN EFI C I A L OW N ERSH I P AS A P I L L A R O F EFFECT I V E...
Financial institutions and DNFBPs effectively play a gate-keeping role to prevent illicit money from
entering the financial system. Without proper access to reliable information on beneficial ownership,
private actors have a limited ability to understand who is behind the legal entities and legal arrangements
– i.e. a limited ability to fulfil their customer due diligence requirements. They are therefore not able
to perform their role of preventing financial crimes and of protecting their own businesses to their
full capacity.
The financial institutions and DNFBPs themselves also suffer as a result of a jurisdiction’s dysfunctional
or nonexistent beneficial ownership transparency: poor AML compliance increases their exposure
to legal, reputational and financial (fines) risks.
4.2 Beneficial ownership transparency has risen up the global agenda
The FATF published the first international standards on beneficial ownership transparency in 2003.
190 jurisdictions committed to implementing legal requirements for:
• financial institutions and other gatekeepers to collect and verify information on the ownership
of legal persons and arrangements;
• measures to ensure that this information is available competent authorities.
The standards were revised in 2014 to provide more clarity, close loopholes and better distinguish
between basic ownership information (about the immediate legal owners of a company or trust) and
beneficial ownership information (about the persons who ultimately own or control it). In 2019, FATF
published best practices on beneficial ownership for legal persons.
There is now widespread consensus that beneficial ownership registers are needed not only to combat
ML / TF but also tax evasion and other forms of financial crime, to assist in tracing and recovering stolen
assets, and – especially for publicly available registers – for their deterrent effect.
This concern has been picked up by a multitude of policy and advocacy bodies from all sectors. The
G20, B20 and C20, the OECD and its Global Forum on Transparency and Exchange of Information for
Tax Purposes, the Extractive Industries Transparency Initiative (EITI), the Open Government Partnership
through its Beneficial Ownership Leadership Group, and Transparency International are just a few of
those calling actively for the establishment of effective beneficial ownership registers globally. Open
Ownership, an NGO, has developed Principles for Effective Beneficial Ownership Disclosure, which
provide a framework for implementing beneficial ownership transform reforms and assessing the
adequacy of existing measures.
Far from being a purely technical issue, beneficial ownership is also increasingly a public demand
following scandals such as the Panama and Paradise Papers. These have revealed how anonymous shell
16B A S E L A M L I N D E X 10 T H P U B L I C E D I T I O N 2 0 21 4 T R EN D 3: B EN EFI C I A L OW N ERSH I P AS A P I L L A R O F EFFECT I V E...
companies have been misused (and in many cases intentionally set up for that purpose) to assist
criminals and professional money launderers in hiding the proceeds of corruption and other crimes.
Box 2: Further reading on beneficial ownership and money laundering
• Atkinson, P., 2020. Quick Guide to Offshore Structures and Beneficial Ownership.
Basel Institute on Governance
• Van Der Merwe, 2020. Beneficial Ownership Registers: Progress to Date.
U4 Anti-Corruption Helpdesk
• FATF, 2019. Best Practices on Beneficial Ownership for Legal Persons
• FATF, 2016. Report to the G20 on Beneficial Ownership
• Global Coalition to Fight Financial Crime. 2021. Position Paper on Beneficial
Ownership Transparency.
4.3 Implementation and effectiveness of beneficial ownership
registers
Despite the fact that the importance of beneficial ownership transparency is increasingly recognised,
implementation remains uneven and more clarity and granularity are necessary. To gain a greater
understanding of the main weaknesses, and perhaps draw first conclusions of the underlying reasons,
we examined what the FATF data reveals on this question.
For this, we looked at the following FATF Recommendations and effectiveness indicators (IO5) for
beneficial ownership:
Box 3: FATF indicators on beneficial ownership
Technical compliance Effectiveness
R.24: Transparency and beneficial IO5: Legal persons and arrangements are
ownership of legal persons. Jurisdictions prevented from misuse for money
should take measures to prevent the laundering or terrorist financing, and
misuse of legal persons for money information on their beneficial ownership
laundering or terrorist financing. is available to competent authorities
without impediments.
17B A S E L A M L I N D E X 10 T H P U B L I C E D I T I O N 2 0 21 4 T R EN D 3: B EN EFI C I A L OW N ERSH I P AS A P I L L A R O F EFFECT I V E...
R.25: Transparency and beneficial
ownership of legal arrangements.
Jurisdictions should take measures to
prevent the misuse of legal arrangements
for money laundering or terrorist financing.
The data covers the 112 jurisdictions assessed under the FATF’s fourth-round methodology in the
period from 2018 to July 2021.4
The analysis reveals poor performance across the board.
• Technical compliance with R.24 and R.25 across all 112 assessed jurisdictions lies at only 47%
on average.
• Almost half of the jurisdictions (44%) score zero for the effectiveness of their beneficial
ownership transparency measures under IO5 – 49 jurisdictions out of the 112 assessed.
• No jurisdiction has an effective system, where IO5 is achieved to a very large extent.
• Only 11 jurisdictions out of the 112 score 66% for effectiveness. A further 52 jurisdictions
demonstrate just 33% effectiveness.
• The average effectiveness score across all assessed jurisdictions is only 22%.
As explained above and emphasised repeatedly by the FATF, this lack of effective collection and
verification of information on the beneficial owner of a corporate vehicle hinders the efforts of law
enforcement and financial institutions to prevent or investigate abuse of the financial system.
The data also seem to indicate that the non-binding nature of the FATF Recommendations on beneficial
ownership leaves a great deal of flexibility in the way that jurisdictions implement them in their
national legislation. Is this the reason for the uneven and tardy implementation?
The FATF has conducted a public consultation this year on possible amendments to R.24 on the transparency
and beneficial ownership of legal persons, the outcomes of which are pending at the time of writing this
report. It is hoped that this process will shed more light on the causes of the current weakness of existing
beneficial ownership frameworks and the lack of such frameworks in far too many jurisdictions still.
Based on our analysis of jurisdictions in the Basel AML Index, we predict that average performance will
decrease if the FATF strengthens its requirements under R.24.
4 The data therefore does not reflect the recent changes with regard to beneficial ownership in the US and Canada, as these jurisdictions have
not undergone an FATF evaluation since the changes came into effect.
18B A S E L A M L I N D E X 10 T H P U B L I C E D I T I O N 2 0 21 4 T R EN D 3: B EN EFI C I A L OW N ERSH I P AS A P I L L A R O F EFFECT I V E...
4.4 Beneficial ownership transparency in the EU
The case of the European Union illustrates that implementing effective beneficial ownership registers
remains challenging even in a region with substantial resources at its disposal, a relatively low risk
of ML / TF (see regional profile, page 27) and, importantly when comparing to the global standard,
very clearly defined mandatory rules.
These rules for EU Member States are set out in the so-called EU AML Directives (AMLD).
• The 4th AMLD signed in 2015 required Member States to ensure that the beneficial owners
of legal persons and some trusts should be known and registered with an authority.
• The 5th AMLD required that beneficial ownership registers for companies and legal persons should
be publicly accessible, and that beneficial ownership information on trusts should be accessible
to competent authorities, financial institutions and designated non-financial business and
professions (DNFBPs), as well as anyone who can demonstrate a legitimate interest. By January
2020, Member States were supposed to have transposed the 5th AMLD into domestic law.
Although the 5AMLD set out the necessary framework for establishing transparent beneficial ownership
across EU jurisdictions, there remain gaps in implementation of these standards in national legislation
as well as weaknesses in supervision at the EU level.
As pointed out by Transparency International, three jurisdictions (Italy, Hungary, Lithuania) still have
not established any form of beneficial ownership register. A further six (Cyprus, Czech Republic,
Finland, Greece, Romania and Spain) have failed to make their registers public, as required in the
5AMLD. Others restrict access in different ways.
So the problem seems to be going further than “just” the question of how specific the rules are. In
July 2021 the EU passed what it calls an “ambitious package of legislative proposals” to strengthen
and harmonise AML / CFT rules across Member States, including beneficial ownership transparency
requirements. It can be hoped that with this, combined with the ongoing revisions of relevant FATF
standards, at least the high-risk countries will start understanding the critical role of beneficial
ownership registers in both ML / TF prevention and enforcement, and act on it.
4.5 Are compliant systems more effective?
Actually, no. Interestingly, the data reveals no strong correlation between technical compliance and
effectiveness.
19B A S E L A M L I N D E X 10 T H P U B L I C E D I T I O N 2 0 21 4 T R EN D 3: B EN EFI C I A L OW N ERSH I P AS A P I L L A R O F EFFECT I V E...
• Only nine jurisdictions demonstrate a high performance (above 50%) in both technical
compliance and effectiveness ratings: Armenia, Bermuda, Cuba, Cook Islands, Italy, Israel,
Macao, Spain and the UK.
• Some jurisdictions, such as Latvia and Iceland, score highly on technical compliance criteria
(67% and 83% respectively) but zero in terms of effectiveness.
The US and Canada are among those jurisdictions that have been – at least until now – let down by
their ineffective beneficial ownership transparency measures. Though falling into the medium-risk
category in the Basel AML Index,5 both jurisdictions suffer from beneficial ownership transparency
systems rated by the most recent FATF evaluation as 0% effective.
4.6 What can we learn from analysing FATF data on beneficial
ownership?
The analysis shows, among other things, that:
• There is still an unacceptably poor level of compliance in establishing beneficial ownership
registers (or other mechanisms), even when this is required not only by FATF standards but
by law. In some jurisdictions, this is a major aspect letting down their otherwise acceptable
performance in AML / CFT.
• The majority of beneficial ownership registers that do exist are either mostly or completely
ineffective at doing even the minimum that they are supposed to do – provide reliable
information to the competent authorities on the ultimate beneficial owners of companies or
trusts incorporated in the jurisdiction.
Increasing the transparency of information on beneficial ownership is both an obvious and an essential
measure to improve the general level of AML / CFT compliance and to help prevent or investigate
ML / TF offences.
This applies both domestically (since no jurisdiction has a fully functioning beneficial ownership
system) and internationally (due to the cross-border nature of financial crimes).
Strong government action to improve beneficial ownership transparency will support not only the
competent authorities responsible for investigating and prosecuting financial crimes, but also financial
institutions and other reporting entities with their customer due diligence obligations.
5 Canada: 4.67, US: 4.60 out of a maximum ML/TF risk score of 10. See the ranking table in Section 6.
20B A S E L A M L I N D E X 10 T H P U B L I C E D I T I O N 2 0 21
5 Trend 4: ML / TF vulnerabilities
beyond the financial sector
Lawyers, accountants, real estate agents and other non-financial businesses
and professions continue to underperform on compliance with AML / CFT
standards. More supervision is urgently needed to close that gap.
5.1 Growing attention to non-financial entities exposed to
ML / TF risks
A significant issue highlighted by the Basel AML Index data analysis is the generally weak application
of AML / CFT preventive measures by non-financial entities – so-called designated non-financial
businesses and professions (DNFBPs). A related weakness lies in their supervision.
Box 4: What are DNFBPs?
DNFBPs are non-financial entities or individuals with a particular exposure to ML / TF risks due
to the nature of their business. According to the FATF definition, DNFBPs include casinos; real
estate agents; dealers in precious metals and precious stones; lawyers, notaries, other independent
legal professionals and accountants; and trust and company service providers.6
Traditionally, national AML / CFT policies, standards and financial supervisory bodies have focused
more on financial institutions than DNFBPs. However, the latter are important players in financial and
economic sectors and have clear exposure to ML / TF risks arising from tax evasion, corruption and
bribery, fraud schemes, insider trading or other crimes.
To take a simple example, money launderers can buy and sell properties or precious metals to help
obscure the illicit origins of their money, as one “layer” in the laundering scheme. Using corporate
vehicles allows them to disguise the true ownership and control of the funds and assets – especially
where, as explained in Section 4, beneficial ownership registers do not exist or are poorly implemented.
Moreover, there is increasing concern among regulators that some lawyers, accountants and TCSPs
are advising and assisting criminal clients with hiding and laundering illicit funds, or that an accountant
is used as an intermediary to avoid scrutiny from the financial institution.
6 In an effort to support the various DNFBPs in applying a risk-based approach to AML/CFT, the FATF has issued sector-specific guidance
documents for legal professionals, TCSPs, casinos and accounting professions.
21B A S E L A M L I N D E X 10 T H P U B L I C E D I T I O N 2 0 21 5 T R E N D 4: M L / T F V U L N E R A B I L I T I E S B E Y O N D T H E F I N A N C I A L S E C T O R
Several structural factors emerge from the data that make DNFBPs particularly vulnerable to ML / TF
risks, including the top three:
• A limited understanding of ML / TF risks and AML / CFT obligations
• Poor implementation of AML / CFT measures
• Weak monitoring and supervision
These are substantial problems that will need addressing to prevent DNFBPs acting as a dangerous
loophole in AML / CFT systems.
5.2 Customer due diligence and AML / CFT
Customer due diligence (CDD) – knowing the identity of your customers and verifying that they really
are who they say they are – is an essential aspect of identifying potential ML / TF risks. The relevant
FATF requirements are R.10 on CDD, R.22 on DNFPB CDD, and IO4 on a risk-based approach to
ML/FT prevention and reporting of suspicious transactions.
Box 5: What are the requirements for customer due diligence?
CDD obligations apply to financial institutions and DNFBPs alike, for example when
establishing a new business relationship, when they carry out certain transactions, and
where there are doubts about previously obtained customer identification data or a direct
suspicion of ML / TF.
The measures cover various aspects including:
• identifying and verifying the customer;
• identifying and verifying the beneficial owner;
• understanding the purpose and intended nature of the business relationship;
• conducting ongoing due diligence and/or scrutinising transactions for consistency
with the apparent customer profile.
CDD is also an important aspect of a risk-based approach to AML / CFT: where a risk assessment
reveals a high risk of ML / TF, enhanced CDD should be applied to gather more information about
the customer, the sources of the funds, the nature of the business relationship and the purpose of
the transaction. Additional monitoring can then be applied where needed.
22B A S E L A M L I N D E X 10 T H P U B L I C E D I T I O N 2 0 21 5 T R E N D 4: M L / T F V U L N E R A B I L I T I E S B E Y O N D T H E F I N A N C I A L S E C T O R
According to an analysis of FATF data relating to the relevant indicators (see above), DNFBPs have
a much lower level of technical compliance with CDD requirements than financial institutions:
• 12 jurisdictions out of the 112 evaluated are rated as non-compliant in R.22 (CDD for DNFBPs).
This compares with just 2 jurisdictions that are rated as non-compliant in R.10 (CDD for
financial institutions).
• At the other end of the scale, only 8 jurisdictions are fully compliant with R.22, compared
to 17 jurisdictions that are fully compliant with R.10.
This means that lawyers, accountants, casinos, precious metal dealers, real estate agents and other
DNFBPs are significantly less protected against ML / TF risks and do less to contribute to AML / CFT
efforts. They should be considered a serious vulnerability in most jurisdictions’ AML / CFT framework.
Does that mean they require greater attention and support from supervisory authorities?
5.3 Regulation and supervision of DNFBPs
In last year’s report, the Basel AML Index provided a deep dive into the quality of AML / CFT supervision.
We found that supervision was generally a very weak spot in countries’ AML / CFT regime, and
supervision of DNFBPs in particular.
Reviewing 2021 data on jurisdictions’ performance in FATF R.28, which sets standards for the
regulation and supervision of DNFBPs, reveals that far too little has changed:
• Compliance with R.28 remains very low at 45% on average.
• 15 jurisdictions still score a radical 0% for compliance with R.28.
• Only 8 jurisdictions are fully compliant with R.28.
These figures illustrate that supervision remains one of the weakest fields in AML / CFT prevention.
A 3% improvement across the board is far from the quantum shift that we would need to see.
When regulators continue to pressure financial institutions (and hopefully increasingly also DNFBPs)
to do better – pressure that indeed needs to be maintained – it needs to be matched with significantly
more efforts to supervise these institutions. Or else, it is highly likely that the pressure will fall short
of delivering real results.
23B A S E L A M L I N D E X 10 T H P U B L I C E D I T I O N 2 0 21
6 Scores and ranking
Only jurisdictions with sufficient data to calculate a reliable ML/TF risk score and that have been
evaluated using the FAFT fourth-round methodology are included in the Public Edition of the Basel AML
Index. See the methodology description in Annex I for more information. The Expert Edition contains
a detailed overview of 203 jurisdictions and their risk scores based on available data.
low risk high risk
Ranking Country Score
1 Haiti 8.49 24 Thailand 6.15
2 Dem. Rep. of the Congo 8.35 25 Kyrgyzstan 6.09
3 Mauritania 8.13 26 Mongolia 6.09
4 Myanmar 7.83 27 Zambia 6.03
5 Mozambique 7.71 28 Pakistan 6.00
6 Cayman Islands 7.66 29 Panama 6.00
7 Madagascar 7.40 30 Tajikistan 5.97
8 Mali 7.37 31 Macao, China 5.93
9 Senegal 7.25 32 United Arab Emirates 5.91
10 Uganda 7.18 33 Bangladesh 5.84
11 Cambodia 7.13 34 Barbados 5.82
12 Zimbabwe 6.79 35 Malawi 5.78
13 Burkina Faso 6.77 36 Jamaica 5.77
14 Ethiopia 6.77 37 Philippines 5.76
15 Nicaragua 6.75 38 Cuba 5.75
16 Solomon Islands 6.74 39 Albania 5.72
17 China 6.70 40 Turkey 5.70
18 Sri Lanka 6.51 41 Jordan 5.60
19 Cape Verde 6.49 42 Fiji 5.56
20 Bahamas 6.46 43 Honduras 5.52
21 Bhutan 6.24 44 Russia 5.49
22 Tanzania 6.22 45 Malaysia 5.47
23 Palau 6.17 46 Serbia 5.47
24B A S E L A M L I N D E X 10 T H P U B L I C E D I T I O N 2 0 21 6 SCORES AND RANKING
Ranking Country Score
47 Malta 5.45 79 Colombia 4.64
48 Turks and Caicos 5.35 80 Armenia 4.63
49 Vanuatu 5.33 81 South Korea 4.63
50 Mauritius 5.32 82 Latvia 4.61
51 Morocco 5.32 83 United States 4.60
52 Samoa 5.32 84 Italy 4.57
53 Seychelles 5.29 85 Bahrain 4.50
54 Saint Lucia 5.21 86 Peru 4.50
55 Ukraine 5.21 87 Ireland 4.45
56 Hong Kong, China 5.20 88 Austria 4.42
57 Tunisia 5.20 89 Taiwan 4.39
58 Egypt 5.19 90 Slovakia 4.37
59 Guatemala 5.12 91 Czech Republic 4.28
60 Saudi Arabia 5.12 92 Iceland 4.16
61 Mexico 5.09 93 United Kingdom 4.05
62 Belarus 5.04 94 Uruguay 3.98
63 Hungary 5.04 95 Belgium 3.94
64 Japan 4.99 96 Portugal 3.85
65 Moldova 4.98 97 Israel 3.83
66 Antigua and Barbuda 4.95 98 Australia 3.75
67 Cyprus 4.95 99 Greece 3.67
68 Switzerland 4.89 100 Spain 3.59
69 Ghana 4.88 101 New Zealand 3.53
70 Botswana 4.87 102 Lithuania 3.51
71 Trinidad and Tobago 4.85 103 Denmark 3.46
72 Georgia 4.82 104 San Marino 3.42
73 Bermuda 4.75 105 Sweden 3.36
74 Costa Rica 4.74 106 Norway 3.35
75 Dominican Republic 4.72 107 Slovenia 3.30
76 Indonesia 4.68 108 Cook Island 3.13
77 Canada 4.67 109 Finland 3.06
78 Singapore 4.65 110 Andorra 2.73
25B A S E L A M L I N D E X 10 T H P U B L I C E D I T I O N 2 0 21
7 Regional focus
The Basel AML Index follows the World Bank classification of jurisdictions, with an additional separation
of Europe and Central Asia into two regions:
• European Union and Western Europe
• Europe and Central Asia
• East Asia and Pacific
• Latin America and Caribbean
• Middle East and North Africa
• North America
• South Asia
• Sub-Saharan Africa
While each jurisdiction has different risks, we do see particular trends and problem zones in each
region that help to highlight weak links and areas to address.
26B A S E L A M L I N D E X 10 T H P U B L I C E D I T I O N 2 0 21 7 REGIONAL FOCUS
7.1 European Union and Western Europe
Despite having a generally lower risk than the global average, the region continues to be
let down by the overall quality of AML / CFT systems. There are major variations in both
compliance with FATF Recommendations and the effectiveness of their implementation.
1 Andorra 2.73
2 Finland 3.06
3 Slovenia 3.30
4 Norway 3.35
5 5 Sweden 3.36
6 San Marino 3.42
2 7 Denmark 3.46
14 8 Lithuania 3.51
4 9 Spain 3.59
10 Greece 3.67
11 Portugal 3.85
12 Belgium 3.94
20
7
13 United Kingdom 4.05
8 14 Iceland 4.16
15 Czech Republic 4.28
18
13 16 Slovakia 4.37
17 Austria 4.42
12
15 18 Ireland 4.45
16
19 Italy 4.57
17
21 23 20 Latvia 4.61
3
21 Switzerland 4.89
19
6 22 Cyprus 4.95
1
23 Hungary 5.04
24 Malta 5.45
9
11 10
22
24
Low risk High risk
27B A S E L A M L I N D E X 10 T H P U B L I C E D I T I O N 2 0 21 7 REG IONAL FOCUS: EU ROPE AN U NION AND W ESTERN EU ROPE
The EU’s July 2021 package of legislative reforms on AML / CFT attempts to address
this variability, but more coordinated efforts are needed, including with jurisdictions
outside the EU.
Overall risk score
Weakest area:
4.02 5.3 Quality of AML / CFT
frameworks
Quality of AML / CFT framework
4.59 5.76
Belgium, Cyprus, the
Netherlands, Spain
and the UK are listed
Bribery and corruption by the US as major
money laundering
destinations. Malta is
2.95 4.70
grey-listed by the FATF
as a jurisdiction with
strategic deficiencies
Financial transparency and standards
in its AML / CFT
framework.
3.49 4.72
Public transparency and accountability Since 2020, around
half of jurisdictions
have increased their
2.48 3.86
risk scores due to
changes in risk data
relating to human
Legal and political risk
trafficking (Cyprus,
Norway, Portugal, and
2.69 4.15
Switzerland), bribery/
corruption (Hungary)
3 4 5 6 7 8 and public transparency
(Hungary, Finland).
Region Global average
28B A S E L A M L I N D E X 10 T H P U B L I C E D I T I O N 2 0 21 7 REGIONAL FOCUS
7.2 Europe and Central Asia
The region has slightly higher ML / TF risks than the global average, although there has
been a general improvement since 2020. There are no significant outliers: risk scores are
gradually distributed between 4.63 and 6.09, with the Kyrgyz Republic and Tajikistan
demonstrating the highest risks.
1 Armenia 4.63
2 Georgia 4.82
3 Moldova 4.98
4 Belarus 5.04
5 Ukraine 5.21
6 Serbia 5.47
7 Russia 5.49
8 Turkey 5.70
9 Albania 5.72
10 Tajikistan 5.97
11 Kyrgyzstan 6.09
7
4
5
3
6
2 11
9 1
8
10
Low risk High risk
29B A S E L A M L I N D E X 10 T H P U B L I C E D I T I O N 2 0 21 7 REG IONAL FOCUS: EU ROPE AND CENTR AL ASIA
Governments across the region must take strong steps to address corruption and bribery
in the first instance. However, issues with media freedom, independence of the judiciary,
and political and civil rights in general appear likely to continue to hold the region back.
Overall risk score
5.3 5.37
Weakest areas:
Corruption and bribery
Quality of AML / CFT framework
5.49 5.76
Bribery and corruption 8 of the 11 assessed
jurisdictions are listed
by the US as major
4.70 5.75 money laundering
destinations; the
exceptions are Moldova,
Financial transparency and standards Belarus and Serbia.
4.72 5.17
Public transparency and accountability Armenia saw the
greatest improvement
due to decreases
3.18 3.86
in risk scores for
human trafficking and
corruption/bribery.
Legal and political risk
4.15 5.53
3 4 5 6 7 8
Region Global average
30B A S E L A M L I N D E X 10 T H P U B L I C E D I T I O N 2 0 21 7 REGIONAL FOCUS
7.3 East Asia and Pacific
Risk scores in the East Asia and Pacific region are slightly higher than the global average,
and many jurisdictions have increased their risks in the last year. There is significant
variation in overall risk scores, as well as in risks relating to corruption/bribery, human
trafficking, public and financial transparency, and political/legal systems.
1 Cook Islands 3.13
2 New Zealand 3.53
3 Australia 3.75
4 Taiwan 4.39
5 South Korea 4.63
6 Singapore 4.65
16
7 Indonesia 4.68
8 Japan 4.99
9 Hong Kong, China 5.20
10 Samoa 5.32
5 8
11 Vanuatu 5.33
19
12 Malaysia 5.47
13 Fiji 5.56
14 Philippines 5.76
4
15 Macau, China 5.93
22 9
15 16 Mongolia 6.09
17 Palau 6.17
18 14
18 Thailand 6.15
21
19 China 6.70
17
20 Solomon Islands 6.74
12 21 Cambodia 7.13
6
7 22 Myanmar 7.83
20
10
11
13 1
3
Low risk High risk
2
31B A S E L A M L I N D E X 10 T H P U B L I C E D I T I O N 2 0 21 7 R EG I O N A L F O C U S: E A ST A S I A A N D PAC I F I C
This may reflect the region’s economic and political diversity, ranging from developing
(cash-based) economies with few resources to address financial crimes risks, to stable,
developed states with relatively strong institutions and low levels of corruption. Stronger
regional coordination could be key to helping weaker jurisdictions to raise their
standards and to strengthening enforcement.
Overall risk score
5.3 5.52
Quality of AML / CFT framework Weakest area:
Quality of AML / CFT
frameworks
5.76 6.17
Bribery and corruption
New Zealand retains
4.52 4.70 top place as the lowest-
risk country, despite
an increased risk score
Financial transparency and standards following a new FATF
evaluation.
4.72 4.93
Public transparency and accountability
High risks of human
3.86 4.24 trafficking in China,
Malaysia and Myanmar.
Legal and political risk
3.53 4.15
3 4 5 6 7 8
Region Global average
32B A S E L A M L I N D E X 10 T H P U B L I C E D I T I O N 2 0 21 7 REGIONAL FOCUS
7.4 Latin America and Caribbean
The region’s higher than average overall risk score is in part due to high risks related to
financial secrecy in the Bahamas, Panama and the Cayman Islands. The average risk score
for financial transparency and standards is also high.
17
13
8 11
4
19 7
20
14
9 12 10
18 15
6
1 Uruguay 3.98 5
16
2 Peru 4.50
3 Colombia 4.64
4 Dominican Republic 4.72 3
5 Costa Rica 4.74
6 Trinidad and Tobago 4.85
7 Antigua and Barbuda 4.95
8 Mexico 5.09
9 Guatemala 5.12
10 Saint Lucia 5.21
11 Turks and Caicos 5.35 2
12 Honduras 5.52
13 Cuba 5.75
14 Jamaica 5.77
15 Barbados 5.82
16 Panama 6.00
17 Bahamas 6.46
18 Nicaragua 6.75
19 Cayman Islands 7.66
20 Haiti 8.49
Low risk High risk 1
33B A S E L A M L I N D E X 10 T H P U B L I C E D I T I O N 2 0 21 7 R E G I O N A L F O C U S : L AT I N A M E R I C A A N D C A R I B B E A N
There is significant variation across the region, demonstrating different institutional
capacities to mitigate the risks. Political and legal instability in Cuba and Haiti may
undermine efforts to strengthen AML / CFT measures.
Overall risk score Weakest area:
Quality of
AML frameworks
5.3 5.57
Quality of AML / CFT framework
90% of assessed
5.74 5.76
jurisdictions are listed as
“major money laundering
jurisdictions” by the US
Bribery and corruption (all except Turks and
Caicos and Uruguay).
4.70 5.50
Financial transparency and standards
Since 2020, Antigua
and Barbuda, Barbados,
4.72 5.40
Dominican Republic,
Jamaica and Mexico have
improved their ratings.
Public transparency and accountability
3.86 4.34
Haiti and Trinidad and
Legal and political risk Tobago received a
higher risk score due to
increased risks of human
4.15 4.79
trafficking. Santa Lucia
3 4 5 6 7 8 dropped by nearly a full
point due to a poor FATF
evaluation.
Region Global average
34B A S E L A M L I N D E X 10 T H P U B L I C E D I T I O N 2 0 21 7 REGIONAL FOCUS
7.5 Middle East and North Africa
There is significant variation in risk levels across the region, but the main weaknesses
relate to public transparency and accountability and to legal/political risks.
4
5
6 1
7
4 2
3
8
1 Israel 3.83
2 Bahrain 4.50
3 Saudi Arabia 5.12
4 Egypt 5.19
5 Tunisia 5.20
6 Morocco 5.32
7 Jordan 5.60
8 United Arab Emirates 5.91
Low risk High risk
35B A S E L A M L I N D E X 10 T H P U B L I C E D I T I O N 2 0 21 7 REG IONAL FOCUS: MIDDLE E AST AND NORTH AFRICA
The importance of Saudi Arabia and the UAE as fast-developing financial centres means
that these jurisdictions need to dedicate additional AML / CFT resources commensurate
with their risks.
Overall risk score
Weakest area:
5.08 5.3
Quality of AML / CFT
frameworks
Quality of AML / CFT framework
5.56 5.76
Specific weaknesses in
prevention of ML / TF;
Bribery and corruption Israel and Saudi Arabia
are nearly two times
worse at prevention than
4.73 4.70 enforcement.
Financial transparency and standards
3.36 4.72
Improved scores for
Saudi Arabia, Tunisia,
Morocco and Jordan are
Public transparency and accountability due to reduced risks
across several categories.
3.86 4.12
Legal and political risk Although Israel
remains the lowest-risk
jurisdiction, its score
4.15 4.44
worsened due to an
3 4 5 6 7 8 increased risk score for
human trafficking.
Region Global average
36B A S E L A M L I N D E X 10 T H P U B L I C E D I T I O N 2 0 21 7 REGIONAL FOCUS
7.6 North America
Though containing only three jurisdictions, this region is highly significant in the global
financial sector. It scores better than the global average in all categories, yet both Canada
and the US could dedicate a lot more human and technological resources to countering
ML / TF risks, especially since a recent increase in suspicious transaction reports is
putting competent authorities
4 under additional pressure.
2
1
3
1 United States 4.60
2 Canada 4.67
3 Bermuda 4.75
Low risk High risk
37B A S E L A M L I N D E X 10 T H P U B L I C E D I T I O N 2 0 21
It is hoped that recent regulatory and legislative reforms in both jurisdictions, dealing
with beneficial ownership and whistleblower protections (not yet reflected in the Basel
AML Index data), will help strengthen the region’s main weakness – the quality of its
AML / CFT frameworks.
Overall risk score
Weakest area:
Quality of AML / CFT
4.67 5.3
frameworks
Quality of AML / CFT framework
5.50 5.76
Canada and the US
are remain listed by
Bribery and corruption the US as major money
laundering jurisdictions.
2.52 4.70
Financial transparency and standards
No significant changes
in risk score for Canada
2.72 4.72
and the US since 2020;
Bermuda lacks data on
ML / TF risks.
Public transparency and accountability
1.33 3.86
Legal and political risk The US is significantly
more effective at
enforcement than
2.25 4.15 prevention.
3 4 5 6 7 8
Region Global average
38You can also read