Future Mobility Calculator: An electric mobility infrastructure assessment tool technical note - Coalition for Urban Transitions
←
→
Page content transcription
If your browser does not render page correctly, please read the page content below
Future Mobility Calculator:
An electric mobility infrastructure assessment
tool technical note

Vishant Kothari, Ryan Sclar, Eleanor Jackson, Emmett Werthmann and Jone
Orbea

1
Contents
1 Introduction................................................................................................................................................................... 5
 1.1 Background ........................................................................................................................................................... 5
 1.2 Tool Overview ...................................................................................................................................................... 5
 1.3 Tool Structure ...................................................................................................................................................... 6
2 Tool Methodology & Configuration .................................................................................................................. 12
 2.1 Tool Configuration .......................................................................................................................................... 12
 2.2 Data Input and Calculation Sheets ........................................................................................................... 14
 2.2 Results .................................................................................................................................................................. 49
3 Conclusion ................................................................................................................................................................... 52
Annex................................................................................................................................................................................. 53
 Annex 1 ........................................................................................................................................................................ 53
 Annex 2 ........................................................................................................................................................................ 56
Bibliography ................................................................................................................................................................... 59
Acknowledgements ..................................................................................................................................................... 63
About the authors ........................................................................................................................................................ 63

Figures and tables
Figure 1. General view of the FMC structure and informational flow ..................................................... 7
Figure 2. Screenshot of the Initial Data Entry tab, where users input basic city information and
define a city typology. ................................................................................................................................................... 8
Figure 3. Visual breakdown of the inputs included in the Data Input tabs ........................................ 10
Figure 4. Visual breakdown of the results included in the FMC .............................................................. 10
Figure 5. Screenshot of the City Data tab, where users input general city information ............... 14
Figure 6. Screenshot of the Mobility Data tab, where users input general city information...... 16
Figure 7. Mobility calculations use information from the City Input and Mobility Input tabs .. 20
Figure 8. Screenshot of the Charging Infrastructure Data tab, where users input general city
information. .................................................................................................................................................................... 25
Figure 9. Electric Infrastructure Calculations use input data from City Input and Electric
Infrastructure Input sheets and outputs from the Mobility Calculations sheet............................... 28
Figure 10. Screenshot of the Cost Data tab, where users input cost information for the city.... 31

2
Figure 11. Cost Calculations use input data from Mobility Input, Electric Infrastructure Input,
and Cost Input. .............................................................................................................................................................. 34
Figure 12. Emissions Calculations use input data from City Input and Mobility Input. ............... 42
Figure 13: Benefit Data sheet, showing the emission social cost factors used in the tool. .......... 46
Figure 14. Benefits Calculations use input data from City Input, Mobility Input and Benefits
Input sheets. ................................................................................................................................................................... 47
Figure 15. Screenshot of the Infrastructure & Emissions Results tab, showing demonstration
results. Source: WRI.................................................................................................................................................... 50
Table 1. A breakdown of all tabs included in the FMC.................................................................................... 8
Table 2. The percentage of low or zero carbon electricity generation associated with each
electricity mix type included in the FMC. .......................................................................................................... 16

Table 3 – Battery size ranges allow users to input costs that vary by battery size and vehicle
modes. ............................................................................................................................................................................... 32
Table A1.-Intervals of the main city type variables. Source: Elaborated by WRI with data from
UN Habitat and World bank Data. ........................................................................................................................ 53
Table A2.- Urban population density and GDP per capita of selected cities Source: World Bank
national accounts data, and OECD National Accounts data files. ............................................................ 55
Table A3. Vehicle pollutant emission Source: Victoria Transport Policy Institute (2018) ......... 56

3
Abstract
Mass electrification within the transport sector presents an opportunity to simultaneously
reduce tailpipe emissions by switching propulsion technologies and to improve the electrical
grid. Fully realizing the potential that electric vehicles (EV) offer requires a robust roadmap for
infrastructure development and investment to ensure deployment is cost effective and
resource efficient. To help quantify the infrastructure and investment needed for EV adoption
for urban passenger mobility and its associated benefits, this paper introduces the Future
Mobility Calculator (FMC). Developed by WRI and Siemens in collaboration with the Coalition
for Urban Transitions, the FMC is an Excel-based tool that—for a given range of city-specific
inputs and a projected rate of transport electrification—identifies the quantity and cost of
infrastructure required for EV adoption through 2050. The tool also estimates the potential
social benefits associated with a reduction in emissions that would result from electrification
and modal shifts. The FMC does not provide a comparative cost-benefit analysis between
scenarios but is rather designed to estimate impacts of a designated EV uptake scenario
developed by the user given a set of inputs and assumptions. The FMC is intended to be used by
modelers to support city planners, transit agencies, city policy makers, utilities, and charge
point operators. The FMC aims to help cities make informed decisions and plan accordingly for
the future of their mobility and energy systems. This technical note details the structure,
methodology and assumptions (listed separately under each section) of the FMC.

Abbreviations and Acronyms
 EV = Battery electric vehicle
 PHEV = Plug-in hybrid electric vehicle
 ICE = Internal combustion engine
 VKT = Vehicle kilometers traveled
 LDV = Light duty vehicle
 HDV = Heavy duty vehicle

4
1 Introduction
1.1 Background
As urban centers continue to grow, so will the share of global emissions they produce linked to
an expanding transport sector and increased electricity consumption. In 2019, transportation
accounted for 24 percent of global CO2 emissions (IEA 2020) and is the fastest growing
emissions sector (Wang and Ge 2019), with road vehicles accounting for nearly three-quarters
of all transport CO2 emissions. Electrification within the transport sector presents a solution to
help mitigate potential emissions associated with the growth of cities by reducing tailpipe
emissions and improving grid functionality and sustainability through smart charging.

While the promise of EVs for emissions reductions and reduced operational costs are attractive,
uptake of the technology at scale will require the development of a robust vehicle adoption
pathway and charging infrastructure network. To help facilitate planning, this paper introduces
the Future Mobility Calculator (FMC). Developed by WRI and Siemens in collaboration with the
Coalition for Urban Transitions, the FMC focuses on the urban infrastructure needed for
successful EV and charging station rollout and the costs and social benefits associated with that
investment. Understanding the appropriate quantity and type of charging stations to install, the
increased electricity demand from EVs, and the cost (and social benefits) of vehicle and
infrastructure deployment are crucial for effective resource management, decision making, and
building political support for electrification. The FMC aims to help cities make informed
decisions and plan accordingly for the future of their mobility and energy systems.

The term "EVs" can refer to few different vehicle technologies including battery EVs (fully
electric), plug-in hybrid EVs (battery and petrol), and fuel cell vehicles (hydrogen fuel). While
plug-in hybrid and fuel cell vehicles are an important part of the shift to sustainable transport,
the FMC considers the adoption of battery EVs only, any reference to "EV" or "EVs" in this paper
refers exclusively to fully electric battery EVs.

1.2 Tool Overview
The FMC is an Excel-based tool that, for a given range of city-specific inputs (general city data,
mobility data, charging infrastructure data, and cost data) and a projected electric transport
uptake scenario for 2035 and 2050, identifies the quantity and cost of infrastructure required.
It also quantifies some of emissions benefits that would result from an investment in electric
transport infrastructure, based on input data and listed assumptions. The FMC is not intended
to provide a direct comparative cost-benefit analysis against other propulsion technologies
such as diesel, hydrogen or CNG. These types of comparisons are addressed in other literature
and tools (UChicago Argonne, LLC 2019; Cooper et al. 2019a). Instead, the main purpose of the
tool is to estimate the costs, requirements, and some of the key benefits of defined
electrification scenarios, which are needed to effectively plan for future EV use.

The FMC is designed to provide a city-specific analysis, informed by the city-specific inputs
entered by the user. When user inputs are not available, the tool provides defaults. These
defaults vary based on the typology of the city, but they represent broad and generic
estimations. The less default inputs that are needed, the more the calculator outputs will reflect
the reality of the city. Likewise, the user should take care to match the geographic scope of all

5
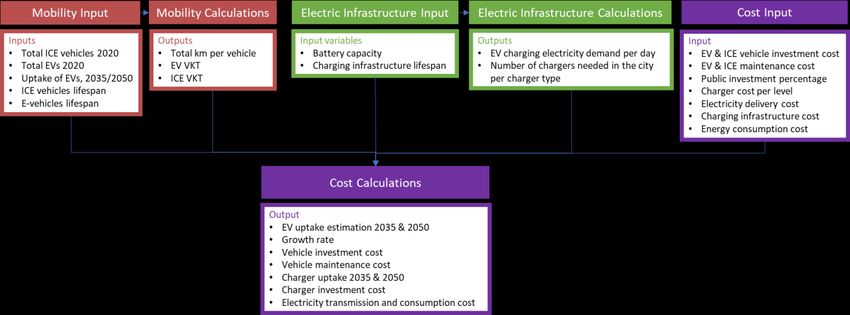
data. Users are encouraged to manually enter as many city-specific inputs as they are able and
to avoid mixing with regional data to the extent possible.
The FMC is designed to accommodate inputs for four modes of motorized transit: private car,
private two-wheeler, public bus, and shared fleet vehicle. This tool is designed for fully battery
electric vehicles and not for plug-in hybrid electric vehicles (PHEVs) or hydrogen fuel cell
vehicles. Users may include PHEVs in their total EV count, but the vehicle specifications
included in the tool are tailored to the attributes of battery electric vehicles. Since the tool is
designed specifically to plan for electric vehicles (and not to provide guidance on other topics
related to general mobility planning), the tool does not analyze non-motorized transportation.
The user designates a desired future transport electrification scenario for the years 2035 and
2050.
The FMC incorporates a transparent interface allowing the user to view inputs and calculations
as well as integrate their own data, allowing complete customization for the city in question.
The tool is open-sourced, and users can change any desired default assumptions, in addition to
the suggested city-specific inputs. For example, the user can change the default emission
factors, default assumption for battery efficiency loss in hot or cold climates, or any other
default assumption in the tool.
When city-specific data is not available, the tool is programmed with over 500 default data
points, which help fill gaps in the user’s data. These default inputs are sourced from work done
by a range of institutions including the IPCC, World Bank, C40, IEA, IRENA, US EPA, UNEP, and
ICCT among others. Inputs are based on present day and projected values as well as
assumptions inferred based on trends. Based on the city’s population density and economy,
these default inputs are sourced from four pre-loaded city typologies: (1) emerging economy –
high density, (2) developed economy – low density, (3) developed economy – high density, and
(4) emerging economy – low density. While no planning tool can provide complete scenarios
with absolute certainty, the FMC uses these different city typologies to source specific default
inputs which are intended to be most applicable to the city in question.

The FMC is specifically designed to conduct city-level analysis, but the geographic extent of the
city’s analysis can be modified depending on how the user defines a city’s limits in the inputs.
Using the city-specific inputs entered by the user in conjunction with default inputs, the tool
estimates the emission reductions, number of necessary EV purchases, electricity consumption,
and required number and type of EV charging stations.

1.3 Tool Structure
The FMC is an excel-based tool developed around three primary operational sections:

 Data input tabs: Initial Data Input, city, mobility, charging, and cost.
 Calculation tabs: Mobility, charging, cost, emissions, and benefits.
 Results tabs: Results and Yearly Selected Costs-Benefits

The general informational flow within the tab is broken down visually in Figure 1. Building on
basic city information from Initial Data Input, user inputs in the remaining data input tabs
combined with default data are used in Calculation tabs to produce outcomes in the Results. A
complete list of the tabs included in the FMC is shown in Table 1.

6
Figure 1. General view of the FMC structure and informational flow

 Note: Figure 1 depicts each of the different tool sections: Data Input, Calculation and Results. Starting with basic city
 information collected in Initial Data Entry, user inputs from Data Input tabs combined with Default Data feed into
 Calculation tabs. The calculated outcomes are displayed in Results tabs. This figure does not depict every tab included
 in the FMC, please see Table 1 for a complete list. Source: WRI

Tab Type Tab Name
 Start
Information Overview
tabs Glossary
 Sources
Tool
 Initial Data Entry
configuration
 User Typology Selection
tabs
 Tool Section
 City Mobility Charging Cost Emissions Benefits
 City Mobility Charging
Data input tabs Cost Data
 Data Data Data

Default input City Mobility Charging
 Cost Default Benefits Default
tabs Default Default Default

 Mobility Charging Cost Calc Emissions Benefits Calc
 Calc Calc Cost Calc 1-Vehicle Calc Benefits Calc 1-
 Uptake Emissions
Calculation
 Cost Calc 2-Vehicle
tabs
 Investment
 Cost Calc 3-Vehcile
 Maintenance

 7
Cost Calc 4-Charger
 Uptake
 Cost Calc 5-Charger
 Monetization
 Cost Calc 6-Electricity

 Results
Results tabs
 Yearly Selected Costs and Benefits
 Table 1. A breakdown of all tabs included in the FMC

 Note: Tabs are divided by Tab Type and Tab Name. Data input, Default input, and Calculation
 tabs are further separated by the Tool Section they are associated with. Note that some sections
 of the tool such as Emissions, only have a Calculation tab, where inputs for those calculations
 are sourced from other sections of the tool. Similarly, the City section does not have a
 calculation tab, where City inputs feed into other calculation sheets, but the City section does
 not have a calculation tab of its own. Source: WRI

 1.3.1 Main Configuration
 Figure 2. Screenshot of the Initial Data Entry tab, where users input basic city information and define a city typology.

 Source: WRI

 The Initial Data Entry tab gathers basic city attributes and establishes the City Typology
 associated with the city under analysis. For information on how these typologies were chosen,
 see Annex 1. The selected City Typology will inform the Default Inputs used throughout the tool.
 Inputs for Initial Data Entry can be seen in Figure 2. Current and future electricity generation is
 designated as moderate, low-carbon, or dirty, depending on the mix of electricity generation
 sources input by the user. The ranges for these three categories are defined in Table 2. This tab
 also includes an option to indicate if your city experiences temperature extremes, which can
 impact battery performance.

 1.3.2 Data Input and Calculation
 Data Input tabs are where the user enters the bulk of the city’s data used in the tool. Associated
 with each Data Input tab is a Default Data tab, which houses the City Typology default
 information. The inputs for each of the Data Input tabs are listed visually in Figure 3. Given that
 the FMC is a long-term planning tool, the inputs for the default data tab should reference overall

 8
trends over the long-term. Short- and medium-term influences, such as the impact of COVID-19
or other topical issues, are not intended to be reflected by this tool.
Calculation tabs utilize the values from Data Input tabs to draw out relationships in the data
and produce tool outputs. Outputs from one Calculation tab are often utilized in another
Calculation tab to help produce results.

9
Figure 3. Visual breakdown of the inputs included in the Data Input tabs

Note: Input definitions and their utility within the tool are detailed in the Methodology. Source:
WRI

1.3.3 Results Tabs
Results tabs display the outputs produced with in the Calculation tabs. The outputs for each of
the Results tabs are listed visually in Figure 4.
Figure 4. Visual breakdown of the results included in the FMC

Note: Results and associated calculations are described in the Methodology section. Source: WRI

10
1.3.4 Limitations

Although the FMC provides a robust calculation framework, it faces some limitations:

 • Accuracy of the outputs will significantly depend on the degree and accuracy of city-
 specific inputs from the user. Default data is provided to help fill out potential gaps in
 the user’s data input and is based on comparative assumptions from existing literature.
 • Some data inputs have more weight than others. The FMC analysis is built around
 several key inputs including, population growth rate, 2020 vehicle population, modal
 split, average vehicle occupancy rate, trip length, charger power, and monetary input
 values included in the Cost Data. Users should pay particular attention to the accuracy
 of these key central inputs.

 • The term “EVs” can refer to few different vehicle technologies including battery EVs
 (fully electric), plug-in hybrid EVs (battery and petrol), and fuel cell vehicles (hydrogen
 fuel). While plug-in hybrid and fuel cell vehicles are an important part of the shift to
 sustainable transport, the FMC considers the adoption of battery EVs only, any
 reference to “EV” or “EVs” in this paper refers exclusively to fully electric battery EVs.
 • The FMC uses 2020 as a baseline year for analysis. Short- and medium-term influences,
 such as the impact of COVID-19 or other topical issues, are not intended to be reflected
 by this tool.
 • The FMC produces estimates of the quantity and cost of infrastructure associated with
 EV uptake scenarios built by the user. These estimates can be used to compare different
 EV uptake scenarios. The outcomes produced in different scenarios are not intended to
 show which outcomes are more or less likely to occur.
 • In all annual ridership calculations, the authors assume the default number of days as
 365.
 • The tool is not intended to help cities decide which propulsion systems would be best
 for their fleets. These types of comparisons are addressed in other literature and tools,
 including recent work produced by WRI (Cooper et al. 2019a). Rather, this tool
 is designed to provide estimates of the energy and infrastructure needs for a given
 electrification scenario and an analysis of the associated costs and some social benefits.
 • The emission factors estimations in this tool are related only to tailpipe and electricity
 generation, as the ones coming from suspended material due to vehicle operation, such
 as vehicle braking and tire friction, are not considered in this version of the FMC.
 • In its analysis the FMC focuses on a limited number of transport modes including
 private cars, private two-wheelers, shared fleets (cars), and public buses and rail.
 • In terms of electricity generation, when users define their future electricity generation
 mix, the FMC does not account for the infrastructure requirements and costs associated
 with increasing the share of renewable generation on the grid. When calculating the
 daily electricity load the grid will experience from EV adoption, the tool it is assumed
 the charging load will be distributed equally over the course of the day (24 hours). The
 location and duration of EV charging occurring during the day is a major determinant
 of the upgrades which will be required (or could be offset) to power distribution and
 generation infrastructure. The tool also does not consider smart charging or any
 vehicle-to-grid integration, which will likely impact the use of charging ports.

11
• The social benefits included in the tool do not measure or account for the value of time
 of residents in the city.
 • While the costs associated with health impacts are incorporated into the social cost
 values linked to pollutants in the tool, there are several health and social impacts
 associated with air pollution (such as organ damage and lower reproductive rates) that
 the tool does not currently capture.
 • This tool does not include scenarios for electrifying trucks and urban goods
 transportation.
 • The tool also does not consider how new technologies such as autonomous vehicles
 would impact the electrification process.
 • When the authors refer to ‘modal split’, they refer only the split between motorised
 options only.

2 Tool Methodology & Configuration
2.1 Tool Configuration
Tool configuration and establishing the City Type occur within the Initial Data Entry tab. This
section will describe the different city typologies and other parameters that calibrate the FMC
to determine which default inputs will be used to fill in unknown data. For information on how
these typologies were chosen, see Annex 1. For more reliable results, it is highly recommended
that users input city-specific information (cells in yellow) about the city being analyzed instead
of relying on default data.

2.1.1 City Configuration (Input sheet—Initial Data Entry tab)
This is the main configuration tab where users define and determine key attributes of the city
under analysis. User inputs and selections in this tab will impact assumptions and calculations
throughout the tool, to best reflect the city under analysis. There are four key selections that
are impacted by this:
 City Typology Selection – Based on inputs for population density and income per
 capita, the tool will determine the most appropriate City Type and associated default
 inputs for the city (see Annex 1 for definition of City Types). The City Type can also be
 manually selected by the user.
 Projected electricity generation mix – This informs the user whether the electricity
 generation in their city will be considered dirty, moderate, or low-carbon based on user
 assumptions made for the city’s projected low-carbon electricity generation. Please
 refer to City Section (below) for benchmarking default data assumptions. For reliable
 results, it is preferred to have city-specific inputs from the user based on the city being
 analyzed. This information will likely be made available by local utility companies or at
 the system operator level (regional or national, especially for future projections).
 Island State – This determines whether the city is on an isolated island or not. We have
 defined an isolated island as one which needs to import most of its electricity. This
 impacts electricity infrastructure and transmission costs.
 Environmental Factor – Determines if a city’s climate will have an impact on EV
 performance. Users may select if their city is considered hot (summer monthly average
 above 35C during the hottest month of the summer) and/or cold (monthly average

12
below -6C during the coldest month of the winter) (Motoaki, Yi, and Salisbury 2018;
 Hawkins 2019). If these attributes are present in a city, the tool will account for its
 impacts on additional battery use for climate control within the vehicle and impacts on
 battery performance.

13
2.2 Data Input and Calculation Sheets
2.2.1 City
This section comprises of the variables that depend on the physical, social and economic
characteristics of the city. While the City Data tab does not correspond to “City Calculations,” as
is the case with other tabs, these inputs are used throughout all of the calculations and are key
inputs for the emissions and benefits calculations. It is dedicated to a range of city attributes
and variables related to population and land use, electricity consumption mix, health
information, electricity generation, and mobility emissions factors. While default inputs are
present in the tool (based on assumptions listed below), as shown in Figure 5, city-specific
inputs entered in the yellow cells for each attribute are preferred.
Figure 5. Screenshot of the City Data tab, where users input general city information

Note: The data sheet includes cells for both city-specific user input (preferred) and pre-loaded
default inputs based on the previously designated city typology. Source: WRI

14
Input (Data input sheet - ‘City Data’)

 Population (number of people): This contains the population of the city in 2020.
 Average annual population growth rate, today-2050 (percentage): The average rate
 at which the population grows every year. This percentage is sensitive, and the user
 input will have a significant impact on results.
 Population Density (residents/km2): The density is based on the number of residents
 within the defined municipal area of the city. This is an input from the “Initial Data
 Input.”
 Emissions per capita (MTCO2/year): The annual regional median per capita
 emissions, BASIC, GHG emissions from stationary electricity, transportation and waste
 (“C40 : Greenhouse Gas Protocol for Cities Interactive Dashboard” n.d.)
 Electricity mix (percentage of electricity generated in MWh from each source): The
 electricity mix of the grid currently available in the selected city and expected or desired
 mix in the future. The final results will vary depending on whether the user inputs
 expected or desired mix.
 Electricity generation emissions (kg/MWh per each generation source): List of
 emission factors for electricity generation pollutants - CO2, PM10, and NOx emissions
 based on fuel type.
 ICE vehicles emission factors; (kg/km): List of emission factors for ICE combustion
 engine pollutants - CO2 PM10, and NOx emissions based on vehicle mode.

City General Default Input Assumptions (Default input – ‘City Default’)

 Population: The default average annual population growth rate from 2020-2050 is
 2.3% for emerging economies and 0.5% for developed economies based on (United
 Nations, Department of Economic and Social Affairs, and Population Division 2019)
 Average annual population growth rate, today-2050 (percentage): The average rate
 at which the population grows every year. These rates are based on the World
 Urbanization Prospects 2018 projections that incorporate data from 1950 and project
 out to 2050 (United Nations 2019).
 Population Density (residents/km2): The density is based on the number of residents
 within the defined municipal area of the city. This is an input from the “Initial Data
 Input.”
 Climate information: By default, “Hot” is considered above 35C (95F) while “Cold” is
 considered below -6C (20F).
 Emission per capita: Based on the city location, the default regional median per capita
 emissions per year is sourced from (“C40 : Greenhouse Gas Protocol for Cities
 Interactive Dashboard” n.d.)
 Electricity mix: The city is categorized as Dirty, Moderate, or Low-Carbon based on
 current and projected electricity mix data input from the user. It is assumed that the
 electricity on the grid will get cleaner with time. The tool provides analysis of different
 potential future scenarios, not business as usual projections.

15
Table 2. The percentage of low or zero carbon electricity generation associated with each electricity mix type included
in the FMC.

 Electricity Mix 2020 2035 2050
 Dirty 12% 29% 55%
 Moderate 25% 55% 85%
 Low-Carbon 65% 95% 100%

Source: Authors assumption, estimated based on (Kennedy, Stewart, and Westphal 2019)

 Electricity generation emissions: The default Emission factors for coal, natural gas,
 and oil are sourced from IPCC 2006 Emission Factors, (Mawdsley et al., n.d.) and
 (Comission for Environmental Cooperation 2015). These are global averages. By
 default, the electricity generation emission factors only consider in-site generation and
 not life-cycle value. It is assumed that the following electricity generation types have
 zero pollutant emission factors: Solar, Wind, Hydro and Nuclear.
 ICE vehicles emission factors: The default emission factors by pollutant and vehicle
 type are sourced from (Yang and Bandivadekar, n.d.), (UNEP 2018), (Song 2017),
 (Victoria Transport Policy Institute 2018), and (Cooper et al. 2019b). All shared fleet
 vehicles are assumed to have the same emission factors as private cars.

2.2.2 Mobility
In this section the user is provided with the ability to explore different future scenarios by
defining future modal split and EV uptake into 2035 and 2050. For the year 2020, tool users
input the total number of vehicles (ICE and EV) operating in the city; these inputs used to define
the city’s average daily VKT and the projected vehicle populations in the city for 2035 and 2050.

Within the tool there are five vehicle modes considered:

 Private cars: owned and used by private residents or households.
 Private two-wheelers: privately owned and operated motorized two-wheeled
 vehicles, does not include human-powered bicycles.
 Shared fleets: owned by businesses or cities (public) and used for taxi services, on-
 demand rides, ridesharing, or car rentals. In the FMC, shared fleets are classified as cars.
 Generally, they are the same size as private cars, but with higher utilization rates.
 Public buses: part of the city public transit system
 Rail: includes subway, light rail, tram, cable-car, regional train, etc.
Figure 6. Screenshot of the Mobility Data tab, where users input general city information.

The data sheet includes cells for both city-specific user input (preferred) and pre-loaded default
inputs based on the previously designated city typology. Source: WRI

16
Mobility Input (Data input sheet - ‘Mobility Data’; Default information – ‘Mobility Default’)

 Modal split, 2035 and 2050 (% motorized vehicle utilization by mode): The
 breakdown of travel between different modes including private cars, public buses,
 shared fleets, and rail. While modal split can be measured in a variety of ways (such as
 vehicle distance traveled, passenger distance traveled, or number of trips for the years
 2035 and 2050), in this tool we calculate modal split by the percentage breakdown of
 commuters’ predominant (i.e., longest distance) mode. For 2020, the modal split is
 calculated based on the total number of vehicles input by the user, and by the ridership
 information provided by the user for public transportation. User input can have a
 significant impact on the vehicle numbers in the future. Users should keep modal split
 measurements the same across all sources.
 Total ICE vehicles 2020 (no. of vehicles): For each mode, the total number of
 registered ICE vehicles operating within a city for 2020. If possible, this input should be
 sourced from vehicle registrations. This is NOT the total number of vehicles in a city. If
 using a value that is the total number of vehicles in a city, please subtract out the
 number of EVs in the city. Additionally, please ensure shared vehicles, taxis and
 transportation network company (TNC) vehicles, are counted separately from the total
 number of total private vehicles. As with EVs, TNCs will likely need to be subtracted
 from the total number of registered vehicles given that they are not registered
 separately. Despite the fact that many TNC drivers operate on multiple platforms, all
 TNC vehicle numbers should be counted as individual drivers because it is not public
 knowledge which drivers have dual-registrations. Almost all calculations are based off
 registered vehicle numbers in some way, so users should be careful when inputting
 these numbers. For private vehicles, if available, user can input only the number of ICE
 vehicles which are used on a daily basis (not all of the registered vehicles), if they (1)
 also input this information for EVs, and (2) use an average occupancy per vehicle (see
 below) which only includes vehicles used daily.

17
Total EVs 2020 (no. of vehicles): For each mode, the total number of registered EVs
 (fully battery electric vehicles) operating in a city for 2020. This input should be sourced
 from vehicle registrations. This tool is designed for fully battery electric vehicles and
 not for plug-in hybrid electric vehicles (PHEVs). For private vehicles, if available, user
 can input only the number of EVs which are used on a daily basis (not all of the
 registered vehicles), if they (1) also input this information for ICE vehicles, and (2) use
 an average occupancy per vehicle (see below) which only includes vehicles used daily.
 Uptake of EVs, 2035 and 2050 (% EVs): For each mode, the percentage of total
 vehicles targeted to be electric in a city for the years 2035 and 2050. These numbers
 are based on the goals put forward by the city. For 2020, this value is already calculated
 from the values input for “Total ICE vehicles 2020” and “Total EVs 2020.”
 Average trip length (km/trip): For all modes excluding public bus and rail, the average
 distance traveled per trip taken by a vehicle. For buses, this is average trip length. The
 average trip length will have a significant impact on the charging infrastructure outputs.
 Average number of trips per day per vehicle (trips/day): For all modes excluding
 public bus and rail, the average quantity of trips taken per day per vehicle. These data
 are commonly collected in household travel surveys.
 Average occupancy per registered vehicle (passengers/vehicle): For all modes
 excluding public bus and rail, the average number of users in a vehicle. This number
 includes the average across all registered vehicles, including those which are not used
 daily. This number is a standard metric of shared mobility vehicles. For private cars and
 two-wheelers, this number can be estimated by taking the average occupancy for a
 vehicle on the road (a metric commonly kept by cities) and reducing it by the percentage
 of vehicles which are not used for everyday travel (this can be estimated based on the
 percentage of households with 3 or more vehicles, which is a common metric recorded
 in household travel surveys). Alternatively, users can also input the average occupancy
 per vehicle on the road, if they input the number of vehicles used daily above (as
 opposed to inputting the total number of registered vehicles above). This number is
 highly sensitive. Changing occupancy from 1 passenger to 2 passengers can cut the
 number of total vehicles in half.
 Average lifespan of ICE vehicles (years): For all modes excluding rail, the average
 vehicle lifespan of an ICE vehicle.
 Average lifespan of e-vehicles (years): For all modes excluding rail, the average
 vehicle lifespan of an EV.
 Public bus annual vehicle revenue kilometers, 2020 (km): For public buses only.
 This information is typically provided in annual reports from the local transit agency. If
 a region has several agencies, use information from an aggregated source (preferred,
 such as from a regional planning entity) or from the largest agency in the region (if
 necessary). Ideally, this information would represent just revenue miles traveled, but
 total VKT will suffice. This information may be given on a per-bus basis; if so, use that
 information to calculate the total annual VKT for all buses together.
 Public bus and rail annual ridership, 2020 (no. of riders): For both public buses and
 rail, the annual ridership numbers on that transit system. This information is typically
 provided in annual reports from the local transit agency. If a region has several agencies,
 use information from an aggregated source (preferred, such as from a regional planning

18
entity) or from the largest agency in the region (if necessary). Ideally this information
 will include linked trips as one rider, but unlinked trip data will suffice as well.
 Average annual population growth rate, today-2050 (%): From City Input.

Mobility Default Input Assumptions

 Modal split, 2035 and 2050: The default modal split for 2035 and 2050 is
 automatically filled in with the same modal split that is calculated in 2020 based on the
 vehicle numbers. If users want to change their modal split, they will need to manually
 input their own projections. If mode split is manually entered, it should be broken down
 by the predominant mode (i.e., the mode used for the longest distance) for each user of
 multimodal trips.
 Uptake of EVs, 2035 and 2050: The default uptake of EVs is based on U.S. market share
 indications from the Edison Electric Institute’s EV Sales 2019 report and mode share
 projections from the IEA’s 2018 Global EV Outlook report (Edison Electric Institute
 2019; IEA 2018)
 Average trip length: By default, EVs and ICE vehicles have the same unit distance
 traveled, and they are the only two types of engines (for simplification purposes). While
 EV drivers have been found to travel less miles than ICE drivers, it assumed that ICE
 vehicles and EVs have the same average trip length and number of trips per day and the
 same VKT for each mode (Boston and Werthman 2016). For shared fleets, the default
 trip length only accounts for distance traveled with a passenger in the vehicle.
 Deadheading, drivers traveling without passengers, is not taken into account.
 Average number of trips per day per vehicle: The average number of trips per day is
 calculated based on the CURB database from (The World Bank 2016). Private cars and
 private two-wheelers are assumed to have the same number of trips per day. Literature
 reveals that the number of trips taken by an individual correlates with economic activity
 (Blumenberg et al. 2012; Litman 2020). Therefore, the number of trips is assumed
 higher in developed economies than in emerging economies. Determining the
 difference between high-income and low-income trips per day is an imperfect science,
 and a simple binary variable is used between these two income levels, based on author’s
 assumptions. Literature is inconsistent on whether future trends will dictate more or
 less trips per person. Therefore, the average number of trips are expected to remain
 constant between the different years.
 Average occupancy per registered vehicle: In general, shared fleets have higher
 occupancy rates than private vehicles (UNEP 2018; Schaller 2018). Private cars are
 assumed to have lower occupancy than other modes (UNEP 2018; Schaller 2018).
 Private vehicle occupancy is based on national data in the US, which is then reduced by
 24% to account for all registered vehicles (not just occupancy of vehicles on the road.
 The 24% reduction is based on the 24% of US households that have three or more
 vehicles (Center for Sustainable Systems 2019). The default inputs do not change
 overtime.
 Average lifespan of ICE vehicles: The default average lifespan for all modes does not
 change over time or by economy type. The average lifespans come from the following
 reports: IAEE Report 2014, Nationwide Insurance 2017, US DoT.

19
Average lifespan of e-vehicles: The default average lifespan for all modes does not
 change over time. The average lifespans come from the following reports: (US DOE n.d.),
 BYD Warranty, UNEP 2018.
 Public bus annual vehicle revenue kilometers, 2020: No default alternative listed in the
 tool.
 Public bus and rail annual ridership, 2020: No default alternative listed in the tool.
Figure 7. Mobility calculations use information from the City Input and Mobility Input tabs

Note: Outputs produced in the Mobility Calculations sheet are used in all other FMC calculation
sheets.

20
Mobility Calculations (Calculation sheet - ‘Mobility Calc’)

 1. Number of vehicles per mode (V)

Number of vehicles per mode will be a required input for each mode for 2020, but the tool will
calculate these figures for 2035 and 2050. Also, not all private cars and private two-wheelers
are expected to be used every day, so a utilization factor will be applied to these modes to
calculate their use in 2020.

 a. Number of vehicles per mode in 2020
 a. For all modes: These data are required inputs.
 b. Number of vehicles per mode in 2035 and 2050
 a. For private cars, private two-wheelers, and shared fleets:

 =
 ℎ

 b. For public bus and rail:

 =

Variables:

 o m = vehicle mode (private car, private two-wheeler, shared fleet, public bus,
 rail)
 o Users = people traveling daily per mode (calculations provided below)
 o UTV = Users per transit vehicle (calculations provided below)

 2. Number of EVs and Number of ICE vehicles (EVm, ICEm)
 •
 a. For 2020: These values are input by the user.
 b. For 2035 and 2050:
 c. Number EVs:

 % =

 d. Number ICE vehicles:
 − =

Variables

 o m = vehicle mode (private car, private two-wheeler, shared fleet, public bus,
 rail)
 o V = Number of vehicles per mode

 3. Number of users per mode (Users)

Users for each transportation mode is used to calculate and/or incorporate mode-split
information.

21
a. Numbers of users per mode for 2020:
 a. Total:

 ∑ =

 b. For private cars, private two-wheelers, and shared fleets:
 ⦁ ℎ =

 c. For public bus and rail:
 ℎ
 =
 365 ⦁ 2

 d. Number of riders per mode for 2035 and 2050:
 i. Total:

 ,2020 ⦁ (1 + ℎ )^ =

 ii. For each mode:

 ⦁ =

Variables:

 o m = vehicle mode (private car, private two-wheeler, shared fleet, public bus,
 rail)
 o V = Number of active vehicles per mode

 4. Number of users per transit vehicle (UTV)
The number of riders per transit vehicle is used to calculate the number of transit vehicles in in
2035 and 2050. These numbers are calculated based on 2020 input data.
 a. Numbers of users per transit vehicle (applies only for bus and rail):
 ℎ
 • =
 ⦁ 365 ⦁ 2

Variables:

 o m = vehicle mode (only applies here to bus, rail)
 o V = Number of active vehicles per mode

 5. Vehicle Kilometers Traveled per Day (VKT)
 •
 a. Total:

22
∑ =

 b. For private cars, private two-wheelers, and shared fleets:

 ⦁ ⦁ ℎ =

 c. For public bus (VKT for rail is not calculated):
 ⦁ =

 =
 365 ⦁ ,2020

Variables:
 o m = vehicle mode (private car, private two-wheeler, shared fleet, public bus,
 rail)
 o V = Number of vehicles per mode
 o KPV = Kilometers per bus per day
 o VKT = Daily Vehicle Kilometers Traveled
Mobility Outputs

 Total ICE vehicles per mode 2035 and 2050.
 Total EVs per mode 2035 and 2050.
 Total distance travelled by ICE and EVs per vehicle mode all years.
 Growth rate required of vehicle electrification per mode to achieve the designated EV
 uptake percentage.

23
2.2.3 Charging Infrastructure
Electricity consumption calculation and estimation are an important component for calculating
a city’s charging infrastructure requirements and the emissions associated with vehicle
electricity use. For electricity usage, two main variables are considered: 1) VKT and 2) an
environmental factor which adjusts that estimate by considering average temperatures of the
city, which can impact battery efficiency.

The FMC assumes that EV operators can charge at four different location types:

 Home: residential charging setting
 Work: charging located at a place of employment
 Public: charging locations accessible for public use
 Depot: charging locations for fleets, most commonly not accessible to the public
The FMC assumes that there are six different charger types that EVs can use to charge. This is
broken down between LDVs and HDVs, each vehicle class is associated with three charger types.
Charger power values (kW) listed below should be used as reference values, the terminology
used to describe different kW ranges can vary by geography (International Energy Agency
2019).

LDV Charging
 Level 1: Most commonly found in home charging settings and facilitated by a wall outlet,
 either 120V or 240V depending on geography. Charging power is less than 3.7 kW.
 Level 2: Most commonly found in public, private, and work charging settings. Charging
 power can range between 3.7 kW and 22 kW.
 Level 3: Almost exclusively found in public or depot charging settings. Charging power
 is above 50 kW, but no greater than 400 kW.
HDV Charging

 Slow chargers: Most commonly found in depot settings. Charging power capabilities can
 range between 22 kW and 60 kW
 Fast chargers: Most commonly found in depot settings. Charging power capabilities
 range between 125 kW and 400 kW.

24
Figure 8. Screenshot of the Charging Infrastructure Data tab, where users input general city information.

Note: The data sheet includes cells for both city-specific user input (preferred) and pre-loaded
default inputs based on the previously designated city typology. Source: WRI

Charging Infrastructure Input (Data input sheet - ‘Charging Data’)
 Battery capacity (kWh): Average battery capacity available in the city for each vehicle
 mode in the years 2020, 2035, and 2050.
 Battery range (km): Maximum distance each vehicle mode can travel with the battery
 size defined in the battery capacity input.
 Charger power (kW): The average power flow (kW) each EV charger type can supply
 to a vehicle in your city under normal circumstances. This input is sensitive and has an
 impact on charger numbers.
 Charging infrastructure lifespan (years): Number of years each charger type will
 continue to function properly assuming regular maintenance and usage habits.
 Charger user behavior (by mode, % charging location): Percentage of time during a
 given day (out of 24 hours) that each mode will utilize each location to charge the
 vehicle battery. For each vehicle mode, the user behavior at each associated charging
 setting should add to 100%. Current, expected, or desired charging behavior of EV
 owners when charging their vehicles can be applied to this variable by the user.
 Charger utilization rate (% charging location): Percentage in a given day (out of 24
 hours) that a charger will be operating and plugged into a vehicle per charging location
 (home, work, public, depot charging).
 Distribution of charging type (by location, % charger type): The distribution of
 charging speeds type that exists within a defined charging location type. For each
 charging setting, the percent of each charging speed present should collectively add to

25
100 percent. Current, expected or desired available charging infrastructure type/level
 by location in your city.
 Environmental factor (percent): Percentage of operational loss and impact to vehicle
 battery efficiencies due to presence of extreme temperatures. This is determined by the
 selection made within the tool’s “Initial Data Entry” tab.
Charging Infrastructure Default Input Assumptions (Default information – ‘Charging Default’)

 Battery range (km): By default, the battery range is projected to increase over time
 based on current trends (IEA 2020). Battery range and battery capacity are assumed to
 increase at similar rates in the default settings.
 Charger power (kW): This default input data considers various levels of charging for
 both light duty vehicles (Level1; Level 2; Level 3) and heavy-duty vehicles (Slow
 charging; Fast charging) (Nicholas, Lutsey, and Hall 2019; Proterra 2019). Future
 projections are based on the rationale that charging capacity is projected to increase
 over time. Therefore, it is assumed that there is a desire to access to faster chargers, so
 charging power increases over time.
 Charging infrastructure lifespan (years): The default input data considers multiple
 charger settings and for relevant charging levels available within each setting (Smith
 and Castellano 2015; Chang et al. 2012).
 Charger user behavior (by mode, % charging location): The default input data is based
 on IRENA smart charging projections and trends observed by the US DOE and ICCT (Hall
 and Lutsey 2020; US DOE n.d.; IRENA 2019). It assumes that vehicles are charged to
 100% each time they are plugged in for charging. It also assumes that, through time,
 home charging for private vehicles will decrease, while work and public charging
 increase. For shared fleets, home charging is assumed to decrease through time as depot
 charging increases. For public buses, charging is assumed to always take place in a
 depot given that opportunity charging is a nascent technology.
 Charger utilization rate (% charging location): Based on research done on public
 charging trends and the speed of chargers, utilization rate is assumed to start at 30% of
 the day in places that serve private vehicles (home and work). 30% is roughly 8 hours
 which corresponds to an average workday or an average night (IRENA 2019). The
 author assumes this percentage will decrease slightly through time (20% by 2050) for
 home charging based on (1) an increase in charger speed and (2) an increase in public
 and depot charging, especially for shared fleets (Wolbertus, Van den Hoed, and Maase
 2016; Wolbertus et al. 2018). Electricity consumption is also assumed to continue to
 increase with time (IEA 2019).
 Distribution of charging type (by location, % charger type): The default percentages
 are based on the percentages of each level of charger currently available globally (IEA
 2020). Future trends are based on the following:
 o Home charging for both level 1 and 2 chargers are assumed to grow in the model
 at the same rate as private vehicles (electric cars and two-wheelers) initially,
 however home charging is expected to decrease as the utilization of charging
 infrastructure in the workplace and public spaces increases (Engel et al. 2018).
 We are not assuming that buying an EV means you purchased a home charger,
 so the number of level 1 chargers will likely be lower than the number of private
 vehicles.

26
o In the case of workplace chargers, level 2 chargers are expected to grow more
 rapidly at the beginning due to government incentive programs and then grow
 steadily. In parallel, level 3 chargers will grow steadily as it is primarily
 deployed in the public space due to higher installation and operational cost but
 faster charging speed. As volumes and infrastructure increase, the costs will
 reduce and make level 3 viable for workplace charging as well.
 o Public charging may vary depending on the city type. In cities associated with
 developed economies, as public investment increases, level 2 chargers will be
 replaced with level 3 chargers. In emerging economies, we can expect both
 chargers to be in place simultaneously.
 Environmental factor (percent): By default, this factor is assumed to be 1%, meaning
 that in “hot” or “cold” climates batteries consume 1% more energy (Motoaki, Yi, and
 Salisbury 2018; Hawkins 2019).

27
Figure 9. Electric Infrastructure Calculations use input data from City Input and Electric Infrastructure Input sheets and
outputs from the Mobility Calculations sheet.

28
Charging Infrastructure Calculations (Calculation sheet - ‘Charging Calc’)

 1. Total daily electricity demand per transit mode.
 a. Electricity used per km by vehicle mode (m): each mode’s kWh of fuel used per km.
 ℎ
 = ( / )

 b. Adjusted electricity used per km by vehicle mode (m), accounting for the
 Environmental factor.

 + ( ⦁ )
 = ( / )
 c. Daily electricity demand, per transit mode (m).

Total kWh needed for each mode to drive the defined daily km (Mobility Calculation) based on
the calculated electricity used per km (Charging Infrastructure Calculation).
 ⦁ = ( / )

Variables:

 o m = vehicle mode (private car, private two-wheeler, shared fleet, public bus)
 o eVKT = VKT of electric vehicles (Average Daily VKT from Mobility calculations)

 2. Chargers needed in the city.
The quantity of chargers by type (k) needed to support each transit mode’s calculated daily
electricity consumption (Charging Infrastructure Calculation). The following calculation is run
for each transit mode (m).
 a. Daily electricity demand (kWh) per transit mode (m) by charging location (j)

 ⦁ ℎ ℎ (% )
 = / ( / )

 b. Electricity required (kWh) per charging setting (j).

 ∑ ( ℎ/ ) =

 c. Quantity of chargers needed by type (k), per charging location (j).
This equation assumes that for each charger type at each charging location, those sochargers
will be used uniformly throughout the day. The number of chargers needed is a function of the
electricity required at charging location (j) and the total power flow (kW) each charger type (k)
present at that location can facilitate given its associated charger utilization rate, which is a
percentage of 24 hours.

29
 ⦁ ℎ (% )
 ℎ ⦁ 24 ℎ ⦁ ℎ (% )
 = ⁄

Variables:

 o m = vehicle mode (private car, private two-wheeler, shared fleet, public bus)
 o j = location (home, work, public, depot)
 o k = charger type (LDV [Level 1, Level 2, Level 3], HDV [Slow, Fast, Overhead])

Charging Infrastructure Output

 1. Total electricity demand for all vehicle modes (m)

 ∑

 2. Number of chargers per charger type (k)

 ∑ ℎ

30
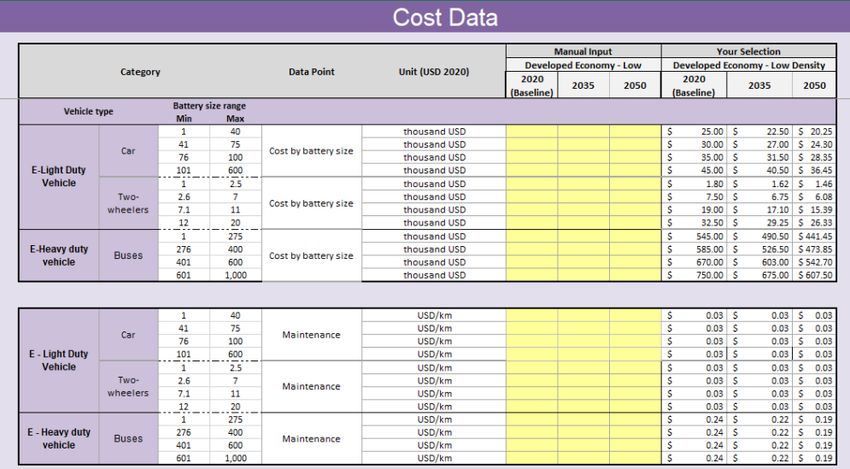
2.2.3 Cost
This section is focused on estimating cost information of vehicles and chargers, the public
investment required for vehicle adoption and infrastructure, the cost of electricity transmission
to the charging station and consumption. It does not include potential grid reinforcement or
upgrade costs.
Figure 10. Screenshot of the Cost Data tab, where users input cost information for the city.

Note: The data sheet includes cells for both city-specific user input (preferred) and pre-loaded
default inputs based on the previously designated city typology. Source: WRI

Cost Input (Data input sheet - ‘Cost Data’)

All cost numbers should be entered without tax.
 Average E-Vehicle investment cost by battery size (thousand USD 2020): Average
 cost of vehicle split by vehicle mode and battery size with ranges to customize input
 from the selected city.

31
Table 3 – Battery size ranges allow users to input costs that vary by battery size and vehicle modes.

 Vehicle mode Battery size range (kWh)
 Min Max
 E-Light Duty Vehicle Car 1 40
 41 75
 76 100
 101 600
 Two-wheelers 1 2.5
 2.6 7
 7.1 11
 12 20
 E-Heavy Duty Vehicle Public buses - 1 275
 depot 276 400
 401 600
 601 1,000

 Average cost of vehicle investment for ICE vehicles (thousand USD 2020): Average cost
 of vehicle, by vehicle mode.
 Average E-Vehicle maintenance cost per vehicle mode per battery size (USD 2020 Cost
 per km): The average maintenance cost of each vehicle mode per battery size (same as
 Table 3).
 Average cost of vehicle maintenance for ICE vehicles (USD 2020, Cost per km): Average
 maintenance cost of vehicle, by vehicle mode.
 Public investment by investment asset (percentage): Public sector investment in
 the purchase of different vehicles and infrastructure as a percentage of the total cost to
 consumers. This number has a significant impact on cost results.
 o LDV – Car
 o LDV – Shared vehicle
 o LDV – Two-wheelers
 o HDV – Public bus depot
 o Charging infrastructure
 o Electricity consumption cost
 o Electricity transmission cost
 Electricity transmission (USD 2020 per charger): Average total cost of electricity
 transmitted to the charging infrastructure.
 o Greenfield (thousand USD 2020 per charger)
 o Greenfield (island state) (thousand USD 2020 per charger)
 o Operation and maintenance (USD 2020 per charger)
 Charging infrastructure cost (thousand USD 2020): Cost of each charger type
 including installation costs.
 Electricity consumption cost (USD 2020 per kWh): Cost of electricity consumption.
 This number has a significant impact on the final cost of electricity per vehicle class.
 Doubling the consumption will roughly double the final electricity cost for all vehicles.

Cost Default Input Assumptions (Default information – ‘Cost Default’)

32
You can also read