Estuarine, Coastal and Shelf Science - Horizon IRD
←
→
Page content transcription
If your browser does not render page correctly, please read the page content below
Estuarine, Coastal and Shelf Science 259 (2021) 107471
Contents lists available at ScienceDirect
Estuarine, Coastal and Shelf Science
journal homepage: www.elsevier.com/locate/ecss
Comparison of the spatiotemporal distribution of three flatfish species in
the Seine estuary nursery grounds
Thibault Cariou a, b, *, Laurent Dubroca a, Camille Vogel a, Nicolas Bez b
a
IFREMER, Ctr Manche Mer-du-Nord, Laboratoire de Ressources Halieutiques, F-14520 Port en Bessin, France
b
MARBEC, IRD, Univ Montpellier, CNRS, Ifremer, 34200 Sète, France
A R T I C L E I N F O A B S T R A C T
Keywords: Nurseries are crucial habitats that play an important role for many marine fish species; which rely on them to
Seine nursery complete their life cycle. Juvenile stages of dab (Limanda limanda), plaice (Pleuronectes platessa) and sole (Solea
Flatfish solea) present in the English Channel are common in the Seine estuary nursery grounds. To further explore the
Geostatistics
estuary’s nursery function, we investigated the heterogeneity in spatial distribution patterns of these three
Spatial distribution
flatfish at their juvenile stage, between 1996 and 2019. We used geostatistical indices and multivariate analyses
to demonstrate species specific spatiotemporal dynamic. Sole favoured the most upstream part of the nursery,
dab was found in the most marine areas, and plaice preferred the southern coast. We then performed clusters
analysis based on spatial indices and spatial patterns extracted from a Minimum/Maximum Autocorrelation
Factor (MAF). We showed that the average positions of the three flatfish species were stable across time. Each
flatfish appeared to have its own spatial preference inside the nursery. No temporal variability in the spatial
pattern nor trend was found that would correspond to the major stress imposed on the community by harbour
development within the 2000–2005 period. We conclude that segregation of the juveniles of the three species
within the nursery may reflect different ecological needs and underlying mechanisms to minimise interspecific
competition.
1. Introduction estuaries favourable.
Most flatfishes found along the French coasts are of commercial
In addition to the natural variability of environmental conditions, value (Hermant et al., 2010) or can be used as indicators of habitat
coastal ecosystems undergo constant modifications and disturbances as quality (Amara et al., 2009). The Seine estuary, located in the eastern
human activities keep increasing (Cloern et al., 2016). A thorough un English Channel, is a nursery for at least ten species, including the three
derstanding of the functioning of these ecosystems is needed to ensure species of flatfish in this study (Duval, 1985). This area is also considered
the sustainable coexistence of human activities and of the valuable as one of the most polluted estuaries in France, recording one of the
ecological services they provide (Costanza et al., 2014). Estuaries are highest concentrations of PCBs in mussels for 2006, compared to other
particularly exposed to human pressure often leading to detrimental regions of the globe (Minier et al., 2006). It has been the site for several
consequences on the ecosystem’s functioning (Courrat et al., 2009). A harbour developments during the 20th century, with the most recent –
function of estuaries is as nursery grounds for many fish species (Vinagre Port 2000, le Havre – ending in 2005 (Dauvin et al., 2010). These de
et al., 2008). They are characterised by larger biomasses of juvenile velopments led to the loss of nursery function effectiveness (Le Pape
individuals in comparison to other habitats (Beck et al., 2001) and are et al., 2007), which for sole (Solea solea) was evaluated to a 42%
key habitat for benthic invertebrates (Etherington and Eggleston, 2000) decrease of its capacity (Rochette et al., 2010).
which provide abundant food resources to sustain juvenile fish growth Understanding the impact of human development on the estuary
(Seitz et al., 2005). Trophic resources combined with protection against nursery function for flatfishes has generated abundant literature (Riou
predation from shallow depth (Gibson et al., 2002), large fluvial et al., 2001; Amara et al., 2007; Rochette et al., 2010; Archambault
discharge increasing food availability and growth (Le Pape et al., 2003), et al., 2018). Most of the cited literature did not address spatial het
and high productivity strengthening recruitment (Correll, 1978) make erogeneity although fine-scale differences in trophic functioning have
* Corresponding author. IFREMER, Ctr Manche Mer-du-Nord, Laboratoire de Ressources Halieutiques, F-14520 Port en Bessin, France.
E-mail address: thibault.cariou@gmail.com (T. Cariou).
https://doi.org/10.1016/j.ecss.2021.107471
Received 11 December 2020; Received in revised form 26 May 2021; Accepted 9 June 2021
Available online 13 June 2021
0272-7714/© 2021 The Authors. Published by Elsevier Ltd. This is an open access article under the CC BY license (http://creativecommons.org/licenses/by/4.0/).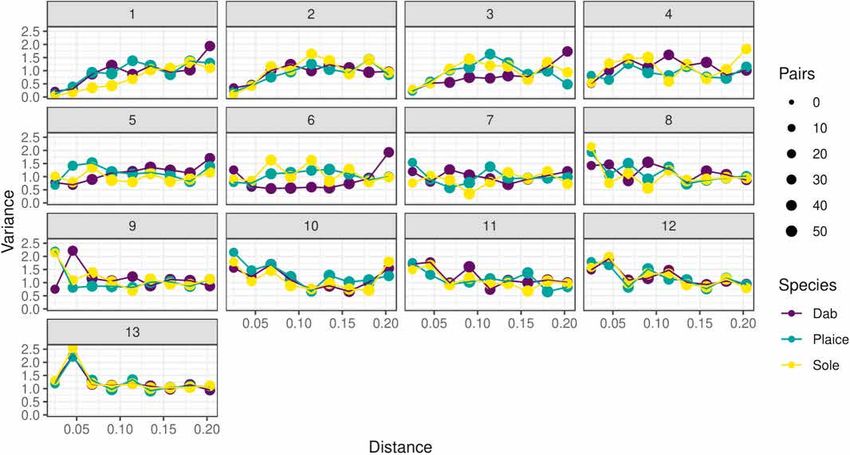
T. Cariou et al. Estuarine, Coastal and Shelf Science 259 (2021) 107471
been described (Tecchio et al., 2015). By modelling food webs in six relationships (Ciannelli et al., 2008). Observed spatial patterns are the
spatial compartments, they found functional distinctions in the different manifestations of underlying ecological relationships. This property of
habitats and pointed out that the estuary was spatially more complex ecological spatial patterns allows us to focus on the spatial processes
than previously thought. Moreover, it is demonstrated in another alone, leaving aside the environmental parameters.
temperate estuary that competition for specific food resources is one of The present study focused on the quantification of the spatial pro
the main drivers of juveniles’ distribution (Tableau et al., 2016). These cesses at work in the Seine nursery for juveniles of three flatfish species,
findings motivate further work on small scale nursery usage and po dab (Limanda limanda), plaice (Pleuronectes platessa) and sole, over
tential biotic interactions between different flatfish species (Amara thirteen non-consecutive years. Using MAFs and geostatistical indices,
et al., 2001; Rooper et al., 2006). we studied these species distributions in the nursery and if they changed
Previously, general additive models (GAMs) were applied to build following harbour development. Restoring the quality of the nursery
habitat suitability models of flatfish in the Baltic sea (Florin et al., 2009) would require a better comprehension of the ecosystem and the different
and for sole in the Seine estuary (Rochette et al., 2010). However, pressures that weigh on it. We discussed our results on the key charac
geostatistical methods are increasingly being considered in spatial teristics of both spatial patterns and temporal variability of juveniles’
ecology as a tool to improve the management of marine resources distributions in the Seine estuary in relation to biological traits of the
(Ciannelli et al., 2008) and account explicitly for autocorrelation be species and to ecological processes.
tween observations. Spatial eigenfunctions were applied to analyse
spatiotemporal processes. These spatial eigenfunctions proposed by 2. Material and methods
Griffith and Peres-Neto (2006) include methods that use eigenvectors of
spatial matrices. A geostatistical version of spatial eigenfunctions is the 2.1. Data collection
Minimum/Maximum Autocorrelation Factors (MAFs) and was devel
oped by Switzer and Green (1984). It was previously applied to fisheries The analyses focused on the NOURSEINE scientific surveys dataset
to analyse spatiotemporal data on sardine eggs in the Bay of Biscay (Cariou et al., 2020a). The surveys aimed at describing the juvenile fish
(Petitgas et al., 2020). Although geostatistics address spatial autocor populations and exploring the Seine estuary’s ecosystem functioning.
relation in the data, they may not explain species-environment They took place over 13 non-continuous years (1995–2002, 2008–2010
Fig. 1. Study area of the NOURSEINE survey displaying the mean position of hauls that have been performed each year. Sectors were originally established with the
distance to the estuary and the bathymetry. Rivers are in bold font, cities and locations named in the article are shown. Coordinates are in decimal degree (DD).
2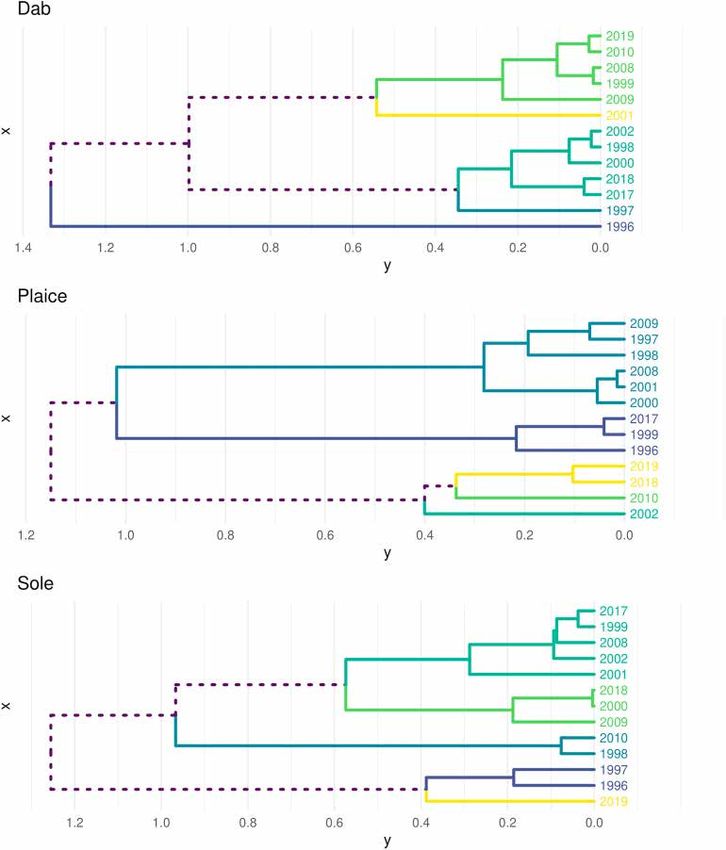
T. Cariou et al. Estuarine, Coastal and Shelf Science 259 (2021) 107471
and 2017–2019). The sampling area extended from Ouistreham (WGS84 distributions were the same. Instead, it meant that the mean positions
49◦ 17′ N, 0◦ 16′ W) to Antifer (49◦ 40′ 20′′ N, 0◦ 11′ 21′′ E) and from the Pont were very close despite their inertia. Therefore, GIC quantified global
de Normandie (49◦ 26′ 09′′ N, 0◦ 16′ 28′′ E) to roughly a 20 m-depth changes of spatial distributions between two selected years for a given
offshore to the west (Fig. 1). This 20 m-depth limit defines the area species.
considered as the nursery grounds. The sampling protocol is described in The LIC complements the GIC with station-by-station pairwise
Cariou et al. (2020b) and the data supporting this study are freely comparisons. Denoting z1i and z2i the fish densities observed at sample i
available on the Zenodo repository 10.18142/244 (Cariou et al., 2020a). in two different years respectively, it was estimated as:
Dab, plaice and sole were selected for this study due to their eco ∑
si z1i z2i
nomic importance and the availability of data to ensure robust analyses. ∑ i 2 √̅̅̅̅̅̅̅̅̅̅̅̅̅̅̅̅
LIC = √̅̅̅̅̅̅̅̅̅̅̅̅̅̅̅̅ ∑ (5)
s z 2
Only records of the G0 (young-of-the-year) age group were kept, cor i i 1i i si z2i
responding to dab of 10 cm or less, plaice of 17 cm or less and sole of 14 A LIC equal to 0 indicated that the two populations never occur at the
cm or less. These limits were defined using the size distribution of G0 same sampling locations, while a LIC equal to 1 meant that the rank of
juveniles, with further age determination obtained from otolith readings the densities in both years are similarly distributed. In between these
on a sub-sample of each species. We assumed that the G0’s movement is limits, the LIC was used to evaluate the similarity of the densities
limited. This ensures that the patterns examined reflect their distribu (observed at the same station) for a given species between two different
tion of the nursery. years (not necessarily consecutive ones).
Sample locations that were close together among years were aver Calculation of GIC/LIC indices for all pairs of surveys generated
aged to get a spatially consistent time series of observations (Table A1). square similarity matrices, opening the possibility to analyse them as
This eventually led to 32 points that were sampled systematically over networks of years. For each species, the choice was made to consider
the study periods (Fig. 1). The 1995 survey was removed as its sampling multiplex networks (Mucha et al., 2010) based on their GIC and LIC
area was reduced and would only have 21 sampling sites. values. Whereas simple network links nodes according to their relation
from a given variable, a multiplex network is a multivariate version,
accounting for the relation given by more than one variable. Both GIC
2.2. Geostatistical indices
and LIC indices were then combined to cluster years. Years (nodes) were
clustered using the Louvain algorithm (Blondel et al., 2008) that
Summary spatial statistics were used to describe the temporal
searches for the partition that maximises the modularity of the parti
changes in spatial distributions. Four commonly used indices were
tioned graph. The modularity (Newman and Girvan, 2004) is based on
applied in this study: the centre of gravity, the inertia, the global index of
the difference between the fraction of connections that effectively con
collocation and the local index of collocation (Bez and Rivoirard, 2001;
nect groups and the fraction expected under random connexions be
Woillez, 2007).
tween groups. To emphasise the information in the networks, only the
The centre of gravity (CG) is the mean position of a population and
50% most values edges are displayed on each layer of the multiplex
the inertia describes the spreading of the population around it. These
network, values being given by the GIC and LIC indices.
statistics were estimated by discrete summations over sampling loca
tions with areas of influences used as a weighting factor. The area of
influence of each sample was defined by all the pixels that were closer to 2.3. Spatio-temporal decompositions (Minimum/Maximum
them than to other samples. For the sample i, let si be the area of in Autocorrelation Factor - MAF)
fluence, xi its geographical coordinates and zi its fish density. The centre
of gravity and the inertia were estimated by: Principal component analyses (PCA) generally produce uncorrelated
∑
xi si zi variables (also called factors) by the linear combination of the input
CG = ∑i (1) variables and then select a reduced number of factors that explain as
i si zi
much as possible of the initial variability. In spatial statistics, MAFs
∑ (Switzer and Green, 1984) proceed similarly but work on spatial dis
− CG)2 si zi
i (xi
I= ∑ (2) tributions rather than variables. A MAF procedure aims thus to explain a
i si zi
time series of spatial distributions by a small number of uncorrelated
The inertia was then decomposed into two principal axes orthogonal spatial distributions (also called factors produced by linear combina
to each other, one for the maximum inertia (Imax) and the other for the tions of the input spatial distributions). Each one of the uncorrelated
minimum (Imin). It was graphically represented by an ellipse centred on factors is a linear combination of the input spatial distributions. As in
the centre of gravity with axes equal to the principal axes of inertia. The PCA, there are as many factors as input spatial distributions, with
isotropy index ranged between 0 (anisotropy) and 1 (isotropy) and was decreasing contribution to the overall spatial pattern. For a given spe
calculated by: cies, this led to the following framework:
√̅̅̅̅̅̅̅̅
Imin ∑
13
Isotropy = (3) zi,t = mt + ck,t χ k,i , ∀ t = 1, …, 13, ∀ i = 1, …, 32 (6)
Imax k=1
For each species, the global (GIC) and the local (LIC) index of
collocation (Bez and Rivoirard, 2001) measured the similarities in the zi,t denotes the fish density at sample i and year t, for i = 1, …, 32 and t =
spatial distributions between pairs of years. The GIC measures how two 1,…,13. χ k,i , k = 1, …, 13 are the factors of the MAF decomposition, i.e.
distributions were spatially close to each other by considering the dis spatial distributions that are mutually uncorrelated (at least at short
tance between their CG relatively to their associated inertia: distance). mt represents the mean density of tth survey and ck,t represents
the score of the kth MAF in the t th survey. Each MAF being a spatial
ΔCG2
GIC = 1 − (4) factor, it is possible to build the variogram associated with the structure.
ΔCG2 + I1 + I2
The second step of the MAF decomposition allowed selecting only the
When the GIC equalled 0, populations are both concentrated in a most important factors to remove those associated with pure noise.
single point (I1 = I2 = 0) at different locations (ΔCG2>0). When CG were Structures of the variograms were investigated only to keep those dis
located at the same location, the GIC equalled 1. Between those two playing the most explicit spatial structure. This led to the selection of the
extremes, the GIC measured the overlap between ellipses, summarising first three MAFs for each species (see ‘result’ section) so that the MAF
the two distributions. However, a GIC closer to 1 did not mean that the decomposition was finally defined as:
3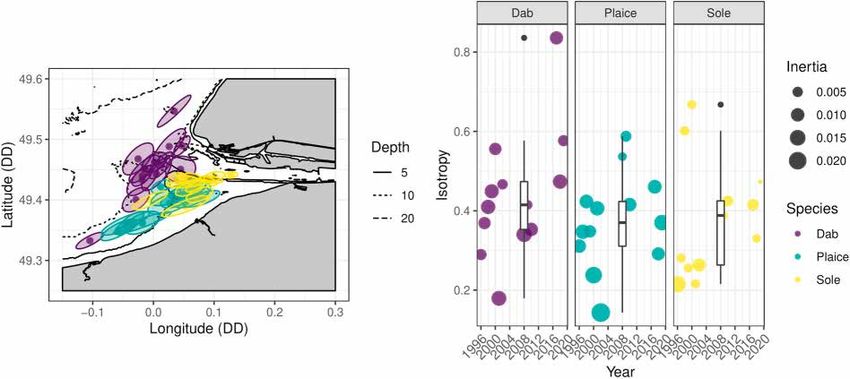
T. Cariou et al. Estuarine, Coastal and Shelf Science 259 (2021) 107471
∑
3 All species displayed an average isotropy index of around 0.4, indi
zi,t = mt + ck,t χ k,i + εi,t , ∀ t = 1, …, 13, ∀ i = 1, …, 32 (7) cating anisotropy. The inertia ellipsis showed that the direction of this
anisotropy was species specific, and similar across years for a given
k=1
where εi,t represents an uncorrelated random variable with 0 mean (pure species. The coastline affected the inertia along the southern coast
noise). (mainly for plaice). The main axis of inertia for dab was aligned with the
The inference of such a model was described in details in the liter isobaths in most cases. No temporal pattern emerged from the inertia or
ature (Switzer and Green, 1984; Desbarats and Dimitrakopoulos, 2000; isotropy results. However, the inertia seemed to increase when the
Woillez et al., 2009; Petitgas et al., 2020). isotropy index decreased for plaice (Pearson’s r: t = -4.78, df = 11, p-
Each survey could then be positioned in 3-dimensional space; with value = 0.00057, cor = -0.82. Normality checked with Shapiro-Wilk
“coordinates” equal to their scores in the MAF decomposition. Yearly normality test). The inertia of plaice and dab were similar, while those
distributions’ scores on the selected MAFs were used to cluster surveys of sole were significantly smaller as reflected by the small ellipsis,
with similar spatial patterns. Clustering was based on Ward’s algorithm. showing a smaller spread of the distribution around the centres of
Simple Structure Index (SSI) was used afterwards to optimise clusters gravity (Fig. 3). The mean GIC for the three species were large (above
definition with regards to their intra and inter-cluster variances. 0.8, Fig. 4 and A.1), indicating reasonable temporal stability of the mean
All analyses were performed using the R software, version 3.5.3 (R location for these species in the Seine estuary, relative to their spreads.
Core Team, 2020). Geostatistical analysis were made in RGeostats For the three species, GIC values were higher than the LIC index. Hence,
version 12.0.1 (MINES ParisTech/ARMINES, 2020); figures were made each flatfish population was on average observed at the same places in
with ggplot2 version 3.3.0 (Wickham, 2016); graphs were built with the Seine estuary. However, the distribution of individuals is mostly
ggraph version 2.0.2 (Pedersen, 2020a), igraph version 1.2.5 (Csardi different in time. Sole had the highest contrast between high GIC and
and Nepusz, 2006) and tidygraph version 1.2.0 (Pedersen, 2020b); low LIC values. Although the centres of gravity were very close to one
clustering used the ggdendro package version 0.1.22 (Vries and Ripley, another (except for 2019), the densities distribution between the years
2020) and the SSI index was extracted from vegan version 2.5–6 was very different, with varying hotspots’ locations through time.
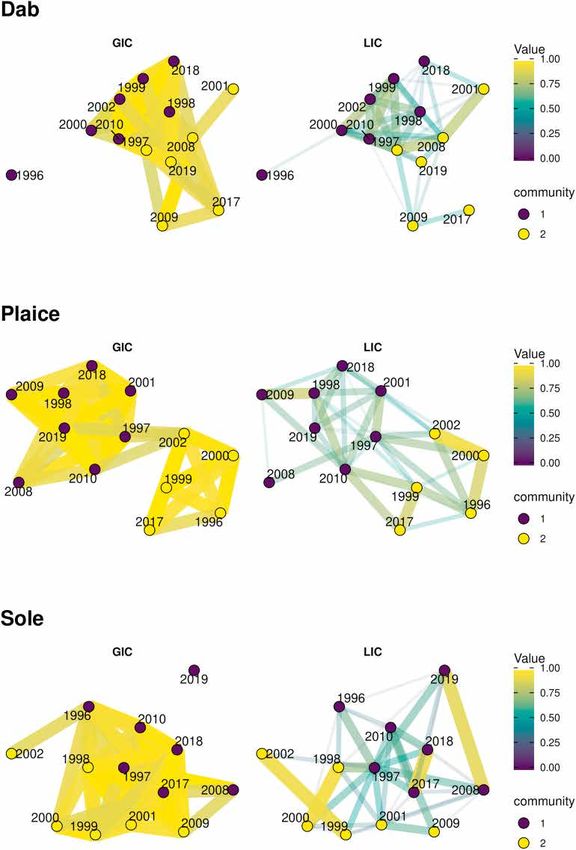
(Oksanen et al., 2019). Clustering with hclust used the “ward.D2” The Louvain clustering detected two main clusters for each species.
method to use the ward criterion (Murtagh and Legendre, 2014). All Dab and sole have highly connected GIC nodes, and clusters were more
codes are available on a GitHub repository (https://github.com/Thibau distinct on the LIC layer of their respective networks. Conversely, the
ltCariou/CG_MAF_FlatfishSeine). two clusters were easily identifiable on the plaice GIC layer. No temporal
similarity was found between the three clustering results in each
network. The distributions of dab in 1996, 2001, 2009 and 2017 had low
3. Results
values of LIC, and 1996 and 2001 also having low GIC values. The lack of
edge connecting these years to the others indicated that they displayed a
3.1. Mean statistics and distribution
distinct distribution. The LIC layer showed that sole exhibited a few
different yet repeating patterns despite the overall LIC values being low.
The G0 juveniles of each species within the flatfish assemblage had
Four pairs of years had very high LIC values (above 0.8) showing high
different distributions patterns and abundance (Table 1). Dab and plaice
spatial correlations in the densities these years. However, the global
were found across more than half of the total hauls. While occurring in a
signal of the LIC layer shows that the densities distributions were quite
little more than a third of the hauls (35%), sole had the highest mean
variable, with only 1997 being well connected. It is notable as well that
density. Map of mean distributions (Fig. 2) showed species-specific
2019 is isolated in the GIC network.
patterns. Dab was found at least once in every station, while plaice
The two clusters on the plaice network were distinguishable on both
and sole were absent in some areas during the entire sampling period.
the GIC and the LIC layers. They represent the two patches of centres of
gravity described in Fig. 3 and A.4. The 1996/1999/2000/2002/2017
3.2. Spatial variation cluster matches the centres of gravity closer to the Orne estuary, while
the other contains the centres of gravity near the mouth of the Seine
Over the last 25 years, the mean position of the G0 juveniles changed river.
for each species while remaining distinct between species (Fig. 3). The
centres of gravity for dab distributions spread in the north-western part 3.3. Spatial structures
of the estuary relative to plaice and sole, except for the 1996 centre of
gravity, which was located in the southernmost part of the estuary. The Based on the eigenvalues and the shape of each MAF variogram, only
centres of gravity of plaice spread along the southern coast. However, the first three MAFs were considered (Fig. 5). The variograms indicated
two groups of ellipsis were identified at a closer look at their distribu clear structure until the third MAF, where they started to present a large
tion. One coincided with the centres of gravity of sole while the other nugget component. After the third MAF, the orthogonality at short dis
was closer to the Orne estuary (Years of each CG noted in figure A4). tances was also not verified anymore. These three MAFs displayed
Sole was mostly concentrated at the mouth of the Seine estuary and had spatial patterns at the estuary scale, as shown by the MAF scores shown
the smallest inertia on average across species. In most cases, the on the map in figure A2.
dispersion of individuals around the centres of gravity is not isotropic, as The SSI index discerned 5 clusters for each species (Fig. 6). The
shown by the low isotropy index. clusters of each species did not display clear temporal continuity. Dab’s
clusters displayed three singletons (1996/1997/2001) whereas most
Table 1 sole’s clusters had group membership of two or three years. As seen in
Mean frequency of occurrence and density of three flatfish populations surveyed the GIC/LIC clustering, the temporal dynamics for each flatfish was
in the Seine estuary during the 13 years of sampling. C.V is the coefficient of different. However, for dab and plaice, the most recent years tended to
variation. be grouped together (2017/2018 for dab and 2018/2019 for plaice).
Species Occurrence in all hauls (%) Density (individuals per hectare) when
excluding absence 4. Discussion
Mean (ind/ha) C.V. (%)
Dab 56.2 36.7 158 4.1. Methods
Plaice 53.6 25.1 160
Sole 35.4 43.6 176
In this study, spatial indices and multivariate analyses were used to
4T. Cariou et al. Estuarine, Coastal and Shelf Science 259 (2021) 107471
Fig. 2. Mean density of dab, plaice and soles across all surveys and hauls, between 1995 and 2017. Density is expressed in individuals per hectares. Coordinates are
in decimal degree (DD).
Fig. 3. (Left) Position of the centres of gravity across years for dab (violet), plaice (turquoise) and sole (yellow). The ellipsis represent inertia associated with the
centre of gravity. (Right) Boxplot and annual isotropy index for the three species of flatfishes. The size of the symbol for the annual isotropy is proportional to the
inertia. Coordinates are in decimal degree (DD). (For interpretation of the references to colour in this figure legend, the reader is referred to the Web version of
this article.)
describe quantitative spatial patterns and to evaluate their temporal patterns (Petitgas et al., 2020). Temporal variations in flatfishes’ dis
variation. Both methods were well suited to deal with the temporal tribution in the Seine estuary existed but may be too faint to be rendered
discontinuity existing in the dataset. The spatial indices provided in correctly by spatial indices. CG, inertia and indices of collocation were
formation on how a population was distributed or how the distributions global statistics, which smoothed the temporal aspect of the distribution.
of the two populations looked alike. A missing year would only result in In this study, they tracked major changes but were less able to render
not having the information on the distribution and not introduce any short term variations. Only the LIC layer of the multiplex network gave
bias. MAFs were a k-table analysis, a table being the densities of the an insight into annual variability, based on the Louvain clustering al
three flatfishes for one survey. These tables could be switched in the gorithm. This algorithm was selected because of its widespread use and
analysis without changing the results as the PCAs were not affected by appropriate properties (Traag et al., 2019), which were considered
the relative order of the values. Therefore, thirteen years of surveys sufficient for the objective of this study: interspecific comparison of
provided a non-continuous yet informative dataset on G0 juvenile flat spatiotemporal distribution. Strictly speaking, LIC is not a spatial sta
fish distributions in the Seine estuary. However, the temporal disconti tistic as it is unchanged by a geographical permutation of the observa
nuity may have altered our ability to detect any dynamic trend in spatial tion. Clusters of years based on the GIC/LIC, and the clusters extracted
patterns. from the spatial analysis based on the MAF decompositions were not
Here, the combination of spatial methods and the comparison of similar. For instance, the year 1996 for dab would instinctively be iso
their results allowed us to better read the spatial patterns existing in the lated from the clusters detected when based on the LIC, but this was not
estuary. On one hand, the considered spatial indices acted as indicators, the case with the Louvain clustering. It was considered that MAFs were
numerically summarising distributions. On the other hand, MAFs were better suited to track temporal changes in spatial distributions: spatial
closer to a model of the actual distribution, removing noise in the spatial indices summarised the spatiotemporal variations in a single value,
5T. Cariou et al. Estuarine, Coastal and Shelf Science 259 (2021) 107471
Fig. 4. Global index of collocation (GIC) and
Local Index of collocation (LIC) calculated
for any pair of years for the three flatfish
species. A community is a synonym for a
cluster. Node clusters are obtained through
the Louvain algorithm, optimising the
modularity of the multilevel network. The
edges’ thickness of the network is propor
tional to the value of the GIC or LIC index.
On each layer, only the edges whose weight
are greater than the median of all values are
shown (50% of edges are removed from each
layer).
while scores of the orthogonal factors for each year could group them focused on sole population (Amara et al., 2007; Rochette et al., 2010),
according to coherent spatial structure. Tableau et al. (2016) used part and to a lesser extent on flounder (Platichthys flesus) and dab as in
of the analytical tools of this study (GIC and variogram) to link the dicators of pollution levels (Amara et al., 2009; Dévier et al., 2013).
distributions of preys and fishes in an estuary without describing the Plaice was studied in the Seine estuary in Riou et al. (2001) and most
spatial use of the environment at the species level. recently in Day et al. (2020) who analysed the feeding habitat of plaice
and sole juveniles. Our study was, to our best knowledge, the first
4.2. Distinct usage of the nursery in spatial patterns attempt to look for different spatial patterns in the Seine estuary’s flat
fish assemblage. Although only three species were considered in this
The Seine nursery is a key habitat in the life cycle of the three flatfish study, the spatial indices and the MAF all pointed out segregation of the
species. It is under pressure from human activities that undermine its distribution of the juvenile flatfish. It showed a distinct species-specific
role as a nursery (Le Pape et al., 2007). So far, associated studies mostly usage of the nursery area. Similar results were obtained by Piet et al.
6T. Cariou et al. Estuarine, Coastal and Shelf Science 259 (2021) 107471
Fig. 5. Empirical variograms of each MAF for the three species of flatfish.
(1998), who worked not only on juveniles but on all size classes. They river flow and benthic productivity. The “Banc du Ratier” is a pile of
found a difference in spatial distribution between dab, plaice and sole rocks and rubbles that was landscaped as a small artificial island during
that were significantly more distinct for the smallest size class than the Le Havre harbour development of Le Havre in 2002–2005; it created
largest ones found in the southern North Sea. They linked this segre new intertidal beaches potentially favourable to plaice settlement.
gation to several hypotheses revolving around trophic resources. Several Autumn, when sampling took place, corresponds to the migration of
studies conducted on flatfishes in the Seine estuary showed a resource juvenile plaice from the intertidal area to deeper waters of around 5 m
partitioning in their diets (Amara et al., 2001; Dauvin et al., 2012; Day depth, increasing their catchability (Gibson et al. 2002, 2011). Although
et al., 2020). They tended to indicate that trophic competition between the intertidal area was not surveyed and the use of this part of the
dab, sole and plaice was minimal. A comparison of the gut contents nursery was not be evaluated, we believe that our sampling scheme
between sole and plaice in 2017 demonstrates a high site fidelity within provided a fair representation of the distribution of juvenile plaice.
nursery habitats for both species (Day et al., 2020), which is consistent Sole is the species for which literature on nurseries was the most
with our results on the relative stability of distributions’ mean position abundant, whether in the Seine (Rochette et al., 2010; Archambault
across the years. As each species has environmental preferences, the et al., 2018), in the Channel (Eastwood et al., 2003) or on the French
spatial pattern we highlighted in the estuary may be related to different coast (Le Pape et al., 2003; Nicolas et al., 2007; Kostecki et al., 2010).
nursery environments (Peterson et al., 2011). Juveniles of sole were constantly found at the Seine estuary. However,
Dab juveniles in the Seine estuary are recurrently found in the the very low LIC index indicates that high densities were rarely seen at
furthest western and northern parts (Fig. 2). The literature on this spe the same location, showing a high local heterogeneity in their distri
cies in other ecosystems and the English Channel showed that dab ju bution patterns. Depth and temperature affected the juvenile sole’s
veniles did not just use the shallow and estuarine areas as nursery distribution which is true for the juveniles of most flatfishes (Eastwood
grounds but may use deeper waters as well (Bolle et al., 1994; Hen et al., 2003). However, some literature shows that river flow and salinity
derson, 1998; Martin et al., 2010). This was consistent with our results affected sole more than dab or plaice, perhaps because these factors have
showing the mean distribution location in deeper water compared to been studied more often with sole (Le Pape et al., 2003; Kostecki et al.,
plaice and sole. This behaviour might help reduce interspecific compe 2010). River input brings essential nutrients to the ecosystem that enter
tition. The bathymetry on the French side of the eastern English Channel the trophic chain and affect food availability for the juveniles. As it has
dropped off steeply past 20 m deep, except for the Seine and Somme been seen in other estuaries, sole tolerates a wider range of salinity
estuaries. Hence, optimal habitat (suitable and free of competition) for (Power et al., 2000) compared to plaice and dab. Sole could then access
dab may be limited in other locations on the French coast as other resources not exploited by the two other species.
flatfish occupied the coastal fringe.
The juveniles of plaice had a wide distribution along the southern
coastline, up to the Seine estuary’s mouth, and two clusters could be 4.3. Temporal variation of spatial pattern
drawn from the centres of gravity. These clusters could also be seen
highlighted on the first MAF (Figure A2). The G0 juveniles of plaice tend Juveniles’ abundance was linked to habitat availability for their
to distribute and feed in intertidal areas (Beyst et al., 2002). Coastal development (Parsons et al., 2014). Low densities may be the source of
influence is central to their distribution, as described by Duval (1982). highly variable patterns. When abundance was low, it was expected that
Clusters identified in our analysis may distinguish years when the Seine the pattern might vary from year to year as the habitable area is pro
had a larger influence on their distribution potentially linked with the portionally large. Hotspots of density were then expected to occur at
different locations over the years and within the nursery area. Following
7T. Cariou et al. Estuarine, Coastal and Shelf Science 259 (2021) 107471
Fig. 6. Dendrograms built using Ward’s criteria for each species based on scores of the first three MAF and displaying the number of groups indicated on simple
structure index. The coloured set of branches indicates the clustering results for each species (a clustering is performed for each species, so cluster 4 of one species is
not the same as cluster 4 of the other two species). Dashed lines are branches not related to a single cluster.
the decrease in flatfish abundance by harbour development in the area was impacted by anthropogenic disturbances, as observed by Gilliers
(Rochette et al., 2010), spatial patterns were expected to be highly et al. (2006). One clear example is the trend in juveniles’ density (See
variable (Figure A.3). Changes in the benthic communities in the Seine figure A.3). Although the dataset seems to show changes in abundance,
estuary were observed before and after the harbour development the dynamic described in spatial patterns did not correlate with the
(Dauvin et al., 2010; Dauvin and Pezy, 2013). However, our results did disturbances. Hence, a distinction can be made between the pop
not point to harbour development being the source of major changes in ulation’s response in spatial distributions and demography to distur
juveniles repartition in the nursery area. Instead, mean spatial distri bances. However, the standardisation was necessary due to the variance
butions were stable despite known and extensive degradation (Le Pape in the data. The low densities induced a high variability on spatial
et al., 2007). Two hypotheses could explain our results. First, it could be patterns that may have masked an anthropogenic signal. These low
that there is no room for heterogeneity. Spatial patterns were restricted densities coupled with the high heterogeneity of benthic assemblage at
because the area available to settlement within the nursery has been the mouth of the estuary (Ghertsos et al., 2001) may explain the high
reduced and biotic pressures were exerted by the co-occurrence of other variability in juveniles’ distribution.
flatfish species at the same time. These pressures constrained the dis Some singletons detected by the MAF clustering could however be
tribution patterns of each population and the temporal variability explained by particular hydrodynamic conditions. River flow is an
observed. Second, the geostatistical methods used in this study did not environmental driver often essential in flatfish nursery as it controls
directly take into consideration the raw densities but their standardised habitat availability through salinity (Bos and Thiel, 2006) or benthic
version, i.e. densities relative to their standard deviation. This method production (Le Pape et al., 2003). As pointed out in Dauvin and Pezy
may have hidden larger differences in patterns before and after the (2013), 2001 was the year with the maximum mean flow for the period
harbour development. The state of juvenile flatfish in the Seine estuary of 1990–2012. This was highlighted in the dab clusterings where 2001 is
8T. Cariou et al. Estuarine, Coastal and Shelf Science 259 (2021) 107471
one of the singletons on the MAF dendrogram and on the GIC network Appendix A. Supplementary data
being only connected to 2008 by one edge. This potentially reflected a
higher influence of freshwater input on this species distribution than on Supplementary data to this article can be found online at https://doi.
sole or plaice. org/10.1016/j.ecss.2021.107471.
Seasonal movements cannot be evaluated in the current study
because of the yearly survey. However, Brind’Amour et al. (2018) pre References
viously identified that all three species’ juveniles displayed an identical
seasonal migration pattern, moving out of the estuary in summer and Amara, R., Laffargue, P., Dewarumez, J.M., Maryniak, C., Lagardère, F., Luzac, C., 2001.
Feeding ecology and growth of O-group flatfish (sole, dab and plaice) on a nursery
coming back in autumn. If all three species globally had the same ground (Southern Bight of the North Sea). J. Fish. Biol. 58, 788–803.
movement, it is possible that segregation, as it was observed here in Amara, R., Méziane, T., Gilliers, C., Hermel, G., Laffargue, P., 2007. Growth and
autumn, may be constant in time. condition indices in juvenile sole Solea solea measured to assess the quality of
essential fish habitat. Mar. Ecol. Prog. Ser. 351, 201–208.
Amara, R., Selleslagh, J., Billon, G., Minier, C., 2009. Growth and condition of 0-group
European flounder, Platichthys flesus as indicator of estuarine habitat quality.
4.4. Conclusion and perspectives
Hydrobiologia 627, 87.
Archambault, B., Rivot, E., Savina, M., Le Pape, O., 2018. Using a spatially structured life
The investigation of spatial patterns in the nursery showed that even cycle model to assess the influence of multiple stressors on an exploited coastal-
though relatively small areas are used for a single species, the whole nursery-dependent population. Estuar. Coast Shelf Sci. 201, 95–104.
Beck, M.W., Heck, K.L., Able, K.W., Childers, D.L., Eggleston, D.B., Gillanders, B.M.,
space considered as a nursery was used due to ecological constraints. Halpern, B., Hays, C.G., Hoshino, K., Minello, T.J., 2001. The identification,
Segregation in the spatial distribution was recurrent, but spatial patterns conservation, and management of estuarine and marine nurseries for fish and
themselves are unstable, partly because of the nursery degradation. invertebrates: a better understanding of the habitats that serve as nurseries for
marine species and the factors that create site-specific variability in nursery quality
Further studies should emphasise the characteristics of the eastern Bay will improve conservation and management of these areas. Bioscience 51, 633–641.
of the Seine ecosystem to understand how environmental variables can Beyst, B., Vanaverbeke, J., Vincx, M., Mees, J., 2002. Tidal and diurnal periodicity in
affect the spatial distribution of communities during the juvenile phase. macrocrustaceans and demersal fish of an exposed sandy beach, with special
emphasis on juvenile plaice Pleuronectes platessa. Mar. Ecol. Prog. Ser. 225, 263–274.
Putting together the spatial knowledge of this study and abiotic pa Bez, N., Rivoirard, J., 2001. Transitive geostatistics to characterise spatial aggregations
rameters will give a better understanding of species/environment rela with diffuse limits: an application on mackerel ichtyoplankton. Fish. Res. 50, 41–58.
tionship in a disturbed nursery (Peterson, 2003). The use of spatial Blondel, V.D., Guillaume, J.-L., Lambiotte, R., Lefebvre, E., 2008. Fast Unfolding of
Communities in Large Networks. Journal of Statistical Mechanics: Theory and
indices has been reviewed and encouraged in Rufino et al. (2018) to Experiment 2008, P10008.
create the most efficient management for a given species. These man Bolle, L.J., Dapper, R., Witte, J.I., Van Der Veer, H.W., 1994. Nursery grounds of dab
agement methods need to integrate as much as possible the ecological (Limanda limanda L.) in the southern North Sea. Neth. J. Sea Res. 32, 299–307.
Bos, A.R., Thiel, R., 2006. Influence of salinity on the migration of postlarval and juvenile
knowledge to maximise survival during the juvenile phase that is crucial
flounder Pleuronectes flesus L. in a gradient experiment. J. Fish. Biol. 68, 1411–1420.
to exploited populations. Brind-Amour, A., Chaalali, A., Tableau, A., Pinsivy, V., 2018. Projet MODHANOUR:
Modélisation des Habitats de Nourricerie en Baie de Seine.
Cariou, T., Dubroca, L., Vogel, C., 2020a. Dataset of Biodiversity of the Seine Nursery
Acknowledgements over 20 Years in a Highly Disturbed Environment.
Cariou, T., Dubroca, L., Vogel, C., 2020b. Long term survey of the fish community and
This work took place during the NOURSEINE project (2017–2019), associated benthic fauna of the Seine estuary nursery grounds. Sci. Data 7, 229.
Ciannelli, L., Fauchald, P., Chan, K.-S., Agostini, V.N., Dingsør, G.E., 2008. Spatial
funded by the European Maritime and Fisheries Fund (EMFF) and
fisheries ecology: recent progress and future prospects. J. Mar. Syst. 71, 223–236.
France Filière Pêche (FFP), France. Data collection was carried out Cloern, J.E., Abreu, P.C., Carstensen, J., Chauvaud, L., Elmgren, R., Grall, J.,
through different scientific programs, financed by the Région de Haute- Greening, H., Johansson, J.O.R., Kahru, M., Sherwood, E.T., 2016. Human activities
Normandie prefecture (1995,1996,1997), Autonomous Harbour of Le and climate variability drive fast-paced change across the world’s estuarine–coastal
ecosystems. Global Change Biol. 22, 513–529.
Havre (1995,1996,1997), the LITEAU program (1999,2000), the Seine- Correll, D.L., 1978. Estuarine productivity. Bioscience 28, 646–650.
Aval program (2001,2002), GIP Seine-Aval (2008,2009,2010) and Costanza, R., De Groot, R., Sutton, P., Van der Ploeg, S., Anderson, S.J., Kubiszewski, I.,
IFREMER (1995–2010). We thank the two anonymous reviewers for Farber, S., Turner, R.K., 2014. Changes in the global value of ecosystem services.
Global Environ. Change 26, 152–158.
their comments that greatly helped the article. We thank all participants Courrat, A., Lobry, J., Nicolas, D., Laffargue, P., Amara, R., Lepage, M., Girardin, M., Le
of the scientific cruises for their work in collecting the data, and namely Pape, O., 2009. Anthropogenic disturbance on nursery function of estuarine areas for
Jocelyne Morin who was the scientific chief of the survey from 1995 to marine species. Estuar. Coast Shelf Sci. 81, 179–190.
Csardi, G., Nepusz, T., 2006. The igraph software package for complex network research.
2010, Sophie Parrad from Ifremer who took charge of the technical Inter J. Compl. Syst. 1695.
organisation of the survey from 2017 to 2019, Catherine Paul, Lucile Dauvin, J.-C., Alizier, S., Vallet, C., Ruellet, T., 2010. Does the Port 2000 harbour
Aumont, Benoit Duval, Elodie Morvan and Xavier Tétard from the construction have an effect on the Seine estuary suprabenthic community?
Estuarine. Coast. Shelf Sci. 86, 42–50.
Comité Régional des Pêches de Normandie who assisted in collecting Dauvin, J.C., Brind-Amour, A., Cuvilliez, A., Dancie, C., Desroy, N., Le Hir, P.,
data during the NOURSEINE project (2017–2019). We thank Carine Lesourd, S., Mear, Y., Morin, J., 2012. Projet COLMATAGE: Couplage bio-morpho-
Sauger for proof-reading the article. sédimentaires et dynamique à long terme des habitats et peuplements benthiques et
ichtyologiques en Seine aval.
Dauvin, J.-C., Pezy, J.-P., 2013. Long-term changes of the Seine estuary suprabenthos
CRediT authorship contribution statement (1996–2012). J. Exp. Mar. Biol. Ecol. 448, 93–103.
Day, L., Brind’Amour, A., Cresson, P., Chouquet, B., Le Bris, H., 2020. Contribution of
estuarine and coastal habitats within nursery to the diets of juvenile fish in spring
Thibault Cariou: Formal analysis, Investigation, Data curation, and autumn. Estuar. Coast 1–18.
Writing – original draft, Visualization. Laurent Dubroca: Conceptuali Desbarats, A.J., Dimitrakopoulos, R., 2000. Geostatistical simulation of regionalized
zation, Investigation, Writing – original draft, Supervision. Camille pore-size distributions using min/max autocorrelation factors. Math. Geol. 32,
919–942.
Vogel: Conceptualization, Investigation, Writing – original draft, Su
Dévier, M.-H., Le Dû-Lacoste, M., Akcha, F., Morin, B., Peluhet, L., Le Menach, K.,
pervision, Project administration, Funding acquisition. Nicolas Bez: Burgeot, T., Budzinski, H., 2013. Biliary PAH metabolites, EROD activity and DNA
Conceptualization, Investigation, Writing – original draft, Supervision. damage in dab (Limanda limanda) from Seine Estuary (France). Environ. Sci. Pollut.
Control Ser. 20, 708–722.
Duval, P., 1982. Etude des nurseries littorales de l’estuaire de la Seine. ISTPM/GRPCM
Declaration of competing interest report (Groupement régional des pêches et cultures manies).
Duval, P., 1985. Impact du milieu sur les nourricieres de Poissons plats de la Baie de
Seine. In: La Baie de Seine. Colloque National du CNRS, pp. 24–26 avril 1985.
The authors declare that they have no known competing financial Eastwood, P.D., Meaden, G.J., Carpentier, A., Rogers, S.I., 2003. Estimating limits to the
interests or personal relationships that could have appeared to influence spatial extent and suitability of sole (Solea solea) nursery grounds in the Dover Strait.
J. Sea Res. 50, 151–165.
the work reported in this paper.
9T. Cariou et al. Estuarine, Coastal and Shelf Science 259 (2021) 107471
Etherington, L.L., Eggleston, D.B., 2000. Large-scale blue crab recruitment: linking Parsons, D.M., Middleton, C., Smith, M.D., Cole, R.G., 2014. The influence of habitat
postlarval transport, post-settlement planktonic dispersal, and multiple nursery availability on juvenile fish abundance in a northeastern New Zealand estuary. N. Z.
habitats. Mar. Ecol. Prog. Ser. 204, 179–198. J. Mar. Freshw. Res. 48, 216–228.
Florin, A.-B., Sundblad, G., Bergström, U., 2009. Characterisation of juvenile flatfish Pedersen, T.L., 2020a. Ggraph: an Implementation of Grammar of Graphics for Graphs
habitats in the Baltic Sea. Estuarine. Coast. Shelf Sci. 82, 294–300. and Networks.
Ghertsos, K., Luczak, C., Dauvin, J.-C., 2001. Identification of global and local Pedersen, T.L., 2020b. Tidygraph: A Tidy API for Graph Manipulation.
components of spatial structure of marine benthic communities: example from the Peterson, A.T., Soberón, J., Pearson, R.G., Anderson, R.P., Martínez-Meyer, E.,
Bay of Seine (Eastern English Channel). J. Sea Res. 45, 63–77. Nakamura, M., Araújo, M.B., 2011. Ecological Niches and Geographic Distributions
Gibson, R.N., Burrows, M.T., Robb, L., 2011. Field experiments on depth selection by (MPB-49). Princeton University Press.
juvenile plaice Pleuronectes platessa. Mar. Ecol. Prog. Ser. 430, 197–205. Peterson, M.S., 2003. A conceptual view of environment-habitat-production linkages in
Gibson, R.N., Robb, L., Wennhage, H., Burrows, M.T., 2002. Ontogenetic changes in tidal river estuaries. Rev. Fish. Sci. 11, 291–313.
depth distribution of juvenile flatfishes in relation to predation risk and temperature Petitgas, P., Renard, D., Desassis, N., Huret, M., Romagnan, J.-B., Doray, M., Woillez, M.,
on a shallow-water nursery ground. Mar. Ecol. Prog. Ser. 229, 233–244. Rivoirard, J., 2020. Analysing temporal variability in spatial distributions using
Gilliers, C., Le Pape, O., Desaunay, Y., Morin, J., Guérault, D., Amara, R., 2006. Are min–max autocorrelation factors: sardine eggs in the Bay of Biscay. Math. Geosci.
growth and density quantitative indicators of essential fish habitat quality? An 1–18.
application to the common sole Solea solea nursery grounds. Estuarine. Coast. Shelf Piet, G.J., Pfisterer, A.B., Rijnsdorp, A.D., 1998. On factors structuring the flatfish
Sci. 69, 96–106. assemblage in the southern North Sea. J. Sea Res. 40, 143–152.
Griffith, D.A., Peres-Neto, P.R., 2006. Spatial modeling in ecology: the flexibility of Power, M., Attrill, M.J., Thomas, R.M., 2000. Environmental factors and interactions
eigenfunction spatial analyses. Ecology 87, 2603–2613. affecting the temporal abundance of juvenile flatfish in the Thames Estuary. J. Sea
Henderson, P.A., 1998. On the variation in dab Limanda limanda recruitment: a Res. 43, 135–149.
zoogeographic study. J. Sea Res. 40, 131–142. R Core Team, 2020. R: A Language and Environment for Statistical Computing. R
Hermant, M., Lobry, J., Bonhommeau, S., Poulard, J.-C., Le Pape, O., 2010. Impact of Foundation for Statistical Computing, Vienna, Austria.
warming on abundance and occurrence of flatfish populations in the Bay of Biscay Riou, P., Le Pape, O., Rogers, S.I., 2001. Relative contributions of different sole and
(France). J. Sea Res. 64, 45–53. plaice nurseries to the adult population in the Eastern Channel: application of a
Kostecki, C., Le Loc’h, F., Roussel, J.-M., Desroy, N., Huteau, D., Riera, P., Le Bris, H., Le combined method using generalized linear models and a geographic information
Pape, O., 2010. Dynamics of an estuarine nursery ground: the spatio-temporal system. Aquat. Living Resour. 14, 125–135.
relationship between the river flow and the food web of the juvenile common sole Rochette, S., Rivot, E., Morin, J., Mackinson, S., Riou, P., Le Pape, O., 2010. Effect of
(Solea solea, L.) as revealed by stable isotopes analysis. J. Sea Res. 64, 54–60. nursery habitat degradation on flatfish population: application to Solea solea in the
Le Pape, O., Chauvet, F., Désaunay, Y., Guérault, D., 2003. Relationship between Eastern Channel (western Europe). J. Sea Res. 64, 34–44.
interannual variations of the river plume and the extent of nursery grounds for the Rooper, C.N., Gunderson, D.R., Armstrong, D.A., 2006. Evidence for resource
common sole (Solea solea, L.) in Vilaine Bay. Effects on recruitment variability. J. Sea partitioning and competition in nursery estuaries by juvenile flatfish in Oregon and
Res. 50, 177–185. Washington. Fish. Bull. 104, 616.
Le Pape, O., Gilliers, C., Riou, P., Morin, J., Amara, R., Désaunay, Y., 2007. Convergent Rufino, M.M., Bez, N., Brind’Amour, A., 2018. Integrating spatial indicators in the
signs of degradation in both the capacity and the quality of an essential fish habitat: surveillance of exploited marine ecosystems. PloS One 13.
state of the Seine estuary (France) flatfish nurseries. Hydrobiologia 588, 225–229. Seitz, R.D., Lipcius, R.N., Seebo, M.S., 2005. Food availability and growth of the blue
Martin, C.S., Vaz, S., Koubbi, P., Meaden, G.J., Engelhard, G.H., Lauria, V., Gardel, L., crab in seagrass and unvegetated nurseries of Chesapeake Bay. J. Exp. Mar. Biol.
Coppin, F., Delavenne, J., Dupuis, L., 2010. A digital atlas to link ontogenic shifts in Ecol. 319, 57–68.
fish spatial distribution to the environment of the eastern English Channel. Dab, Switzer, P., Green, A.A., 1984. Min/Max Autocorrelation Factors for Multivariate Spatial
Limanda limanda as a case-study. Cybium 34, 59–71. Imagery. Stanford University, Stanford, CA.
MINES ParisTech/ARMINES, 2020. RGeostats: the Geostatistical R Package. MINES Tableau, A., Brind’Amour, A., Woillez, M., Le Bris, H., 2016. Influence of food
ParisTech/ARMINES, Fontainebleau, France. availability on the spatial distribution of juvenile fish within soft sediment nursery
Minier, C., Abarnou, A., Jaouen-Madoulet, A., Le Guellec, A.-M., Tutundjian, R., habitats. J. Sea Res. 111, 76–87.
Bocquené, G., Leboulenger, F., 2006. A pollution-monitoring pilot study involving Tecchio, S., Rius, A.T., Dauvin, J.-C., Lobry, J., Lassalle, G., Morin, J., Bacq, N.,
contaminant and biomarker measurements in the Seine Estuary, France, using zebra Cachera, M., Chaalali, A., Villanueva, M.C., 2015. The mosaic of habitats of the Seine
mussels (Dreissena polymorpha). Environ. Toxicol. Chem.: Int. J. 25, 112–119. estuary: insights from food-web modelling and network analysis. Ecol. Model. 312,
Mucha, P.J., Richardson, T., Macon, K., Porter, M.A., Onnela, J.-P., 2010. Community 91–101.
structure in time-dependent, multiscale, and multiplex networks. Science 328, Traag, V.A., Waltman, L., van Eck, N.J., 2019. From Louvain to Leiden: guaranteeing
876–878. well-connected communities. Sci. Rep. 9, 1–12.
Murtagh, F., Legendre, P., 2014. Ward’s hierarchical agglomerative clustering method: Vinagre, C., Salgado, J., Costa, M.J., Cabral, H.N., 2008. Nursery fidelity, food web
which algorithms implement Ward’s criterion? J. Classif. 31, 274–295. interactions and primary sources of nutrition of the juveniles of Solea solea and
Newman, M.E., Girvan, M., 2004. Finding and Evaluating Community Structure in S. senegalensis in the Tagus estuary (Portugal): a stable isotope approach. Estuar.
Networks. Physical review E 69 (2), 026113. Coast Shelf Sci. 76, 255–264.
Nicolas, D., Le Loc’h, F., Désaunay, Y., Hamon, D., Blanchet, A., Le Pape, O., 2007. Vries, A de, Ripley, B.D., 2020. Ggdendro: create dendrograms and tree Diagrams using
Relationships between benthic macrofauna and habitat suitability for juvenile “ggplot2.
common sole (Solea solea, L.) in the Vilaine estuary (Bay of Biscay, France) nursery Wickham, H., 2016. Ggplot2: Elegant Graphics for Data Analysis. Springer-Verlag, New
ground. Estuarine. Coast. Shelf Sci. 73, 639–650. York.
Oksanen, J., Blanchet, F.G., Friendly, M., Kindt, R., Legendre, P., McGlinn, D., Woillez, M., 2007. Contributions géostatistiques à la biologie halieutique. PhD Thesis.
Minchin, P.R., O’Hara, R.B., Simpson, G.L., Solymos, P., Stevens, M.H.H., Szoecs, E., École Nationale Supérieure des Mines de Paris.
Wagner, H., 2019. Vegan: community ecology package. Woillez, M., Rivoirard, J., Petitgas, P., 2009. Using min/max autocorrelation factors of
survey-based indicators to follow the evolution of fish stocks in time. Aquat. Living
Resour. 22, 193–200.
10You can also read