Multifractal characterization of the Coniacian-Santonian OAE3 in lacustrine and marine deposits based on spectral gamma ray logs - Nature
←
→
Page content transcription
If your browser does not render page correctly, please read the page content below
www.nature.com/scientificreports
OPEN Multifractal characterization
of the Coniacian–Santonian OAE3
in lacustrine and marine deposits
based on spectral gamma ray logs
Kouamelan Serge Kouamelan1,2, Changchun Zou1,2*, Chengshan Wang4,
Konan Roger Assie3, Cheng Peng1,2, Ohouo Rebecca Mondah4, Koffi Alexis N’dri4 &
Eric Thompson Brantson5
Limited to the Atlantic and its surrounding basins, the expression of the Coniacian–Santonian
oceanic anoxic event (OAE3) was discovered in the non-marine Cretaceous Songliao Basin, Eastern
Asia not long ago. In this study, based on spectral gamma ray logs data recorded in three basins, the
self-similarity of the OAE3 was studied through the analysis of the scaling properties of thorium–
potassium and thorium–uranium distributions both in marine and terrestrial environments using the
multifractal detrending fluctuation analysis. The results indicate that, in both marine and terrestrial
systems, the OAE3 intervals are characterized by their multifractal nature due to long-range
correlation. However, the multifractal features of the studied OAE3 intervals are different in the three
basins, although some common trends were observed. By comparing the degree of multifractality of
the OAE3 deposits with the clay minerals and the redox conditions, it appears that the changes of the
multifractal features are controlled by local changes such as clay mineralogy and redox conditions in
both milieus under different sedimentation patterns. At all sites, the left side shortened spectrum of
the thorium–potassium distribution suggests the presence of local fluctuations with minor amplitudes
during the OAE3. Furthermore, the shortened singularity spectrum of the thorium–uranium
distribution reflects the existence of small-scale fluctuations with large amplitudes at marine sites
while in the non-marine Songliao Basin, the thorium–uranium distribution suggests the presence
of local fluctuations with small amplitudes during the OAE3. Therefore, a more local behavior of the
event is considered although the regional character is not neglected.
The Cretaceous is the last and longest period of the Mesozoic Era where the Earth experienced some major
geological events such as oceanic anoxic events (OAEs)1–5, large-scale volcanic a ctivities5–8 whose footprints
are concealed in both marine and continental environments. OAEs have been documented in the geological
sedimentary record, particularly in Cretaceous marine sediments, as complex paleoenvironmental phenomena
and climatically influenced major geological perturbations of the Earth system, especially the Earth’s carbon
cycle4,9,10. These complex geological events are characterized by global deposits of organic shales associated with
major carbon isotope excursions (CIEs)4,11–13. Intensive investigations revealed that the Upper Cretaceous period
recorded two important OAEs: (1) OAE2 (Cenomanian–Turonian) known as one of the severest and widespread
oceanic anoxic events, and (2) OAE3 (late Coniacian–early Santonian) which represents the youngest Cretaceous
oceanic anoxic event and potentially a regional rather than a global phenomenon, but which lasted much longer
than OAE214–16. Dissimilar to OAE2, the geographical distribution of the OAE3 suggests that the Coniacian–San-
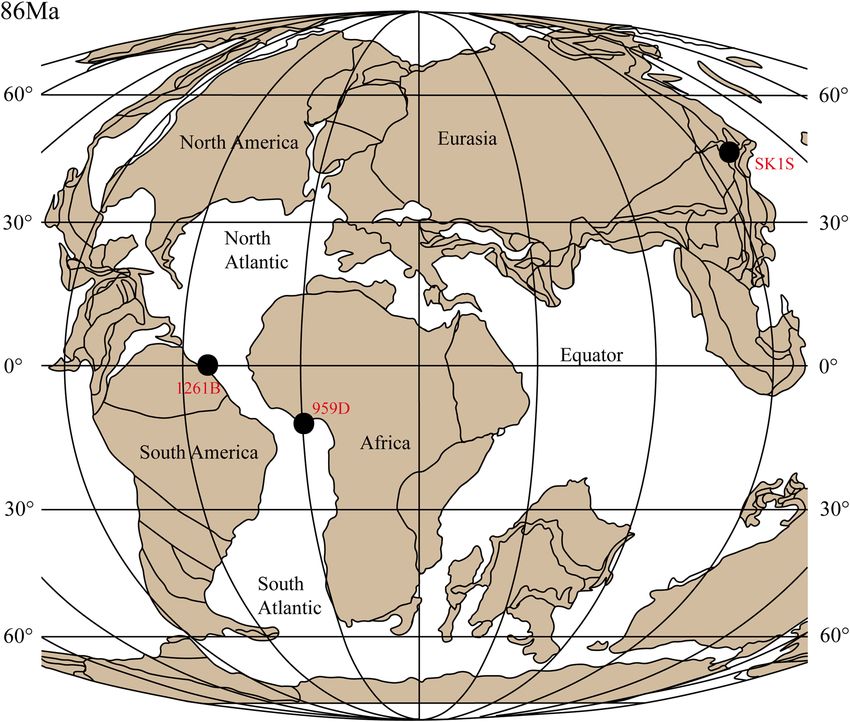
tonian oceanic anoxic events are restricted to the Atlantic and proximate basins10 (Fig. 1). Although this event
1
Key Laboratory of Geo-Detection (China University of Geosciences, Beijing), Ministry of Education,
Beijing 100083, China. 2School of Geophysics and Information Technology, China University of Geosciences,
Beijing 100083, China. 3Institute of Earth Sciences, China University of Geosciences, Beijing 100083, China. 4School
of Earth Science and Resources, China University of Geosciences, Beijing 100083, China. 5Petroleum Engineering
Department, Faculty of Mineral Resources Technology, University of Mines and Technology, Tarkwa,
Ghana. *email: zoucc@cugb.edu.cn
Scientific Reports | (2020) 10:14363 | https://doi.org/10.1038/s41598-020-71327-w 1
Vol.:(0123456789)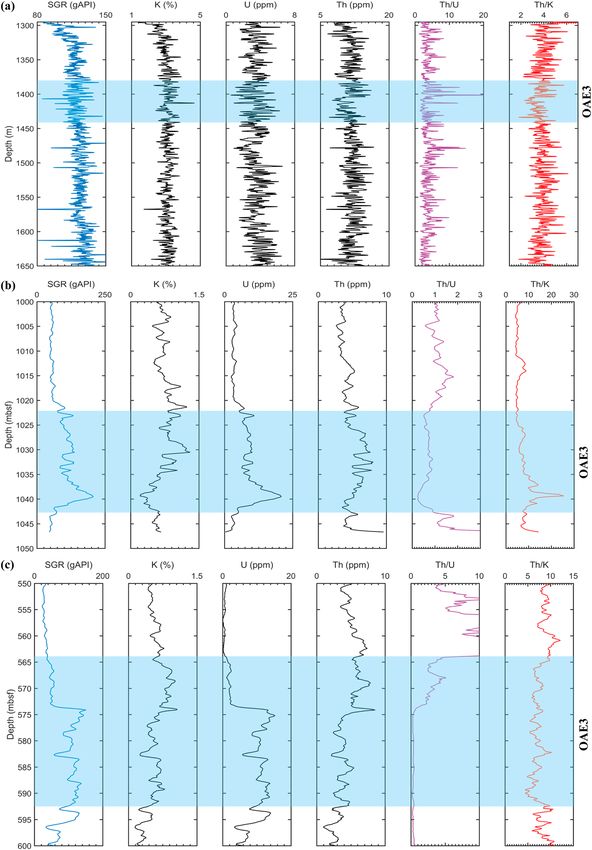
www.nature.com/scientificreports/
Figure 1. Site locations for the studied Coniacian–Santonian OAE in northeastern Asia, northwestern Africa
agreich56).
and off south America (plate tectonic map of the Late Cretaceous for 86 Ma modified from W
Location of sites 959D (Deep Ivorian Basin) and 1261B (Demerara Rise) are from W agreich56; location of SK1S
(Songliao Basin) is from Wang et al.26.
is characterized by significant burial of organic-rich shale, its exact paleo-ecological extent, spatial distribution
and development are not well established3,17–20. However, most of these previous studies are one-sided i.e.,
firstly, they are focused on marine environments although the influence of OAEs in lacustrine environments
has been d escribed4. Secondly, a complete terrestrial-marine correlation of the last Upper Cretaceous OAE is
not documented in the literature, mostly due to the fact that the terrestrial expression of the OAE3 (TEOAE3)
is scarce. For instance, focusing on the equatorial Atlantic, Ocean Drilling Program (ODP) sites alongside the
Deep Ivorian Basin (DIB) and the Demerara Rise (DR) precisely ODP Leg 15921,22 and ODP Leg 20719,20, which
record this event. Although comparatively rare in lacustrine environments, the recent finding of the TEOAE3
in the upper Qingshankou in the non-marine Songliao Basin, northeastern China, suggests that paleo-lakes are
proven suitable for testing hypotheses about the OAE3 triggering mechanisms in terrestrial e nvironment23, thus
opening a door for a possible terrestrial-marine OAE3 correlation. This is furthermore motivated by the work of
Chamberlain et al.24 who found a synchronous response of OAE2 in the lower Qingshankou Formation in the
Songliao Basin. So far, the Songliao Basin represents one of the nearly complete Cretaceous terrestrial records in
the world25, making this area an optimal site to infer global, local or zonal paleoenvironmental changes.
Therefore, the question of whether there are similarities in the development of OAE3 in marine and ter-
restrial environments arises. Thus, carrying out a joint study of the Coniacian–Santonian oceanic anoxic event
in both marine and lacustrine environments in different basins can help present a better understanding of the
controlling mechanisms and its regional/local environmental responses in both marine and terrestrial systems.
Moreover, previous studies mostly focused on organic proxies (biomarkers) and inorganic compounds includ-
ing stable isotope c ompositions26,27. However, studies of the self-similarity of OAE3 based on petrophysical data
have not been conducted.
Scientific Reports | (2020) 10:14363 | https://doi.org/10.1038/s41598-020-71327-w 2
Vol:.(1234567890)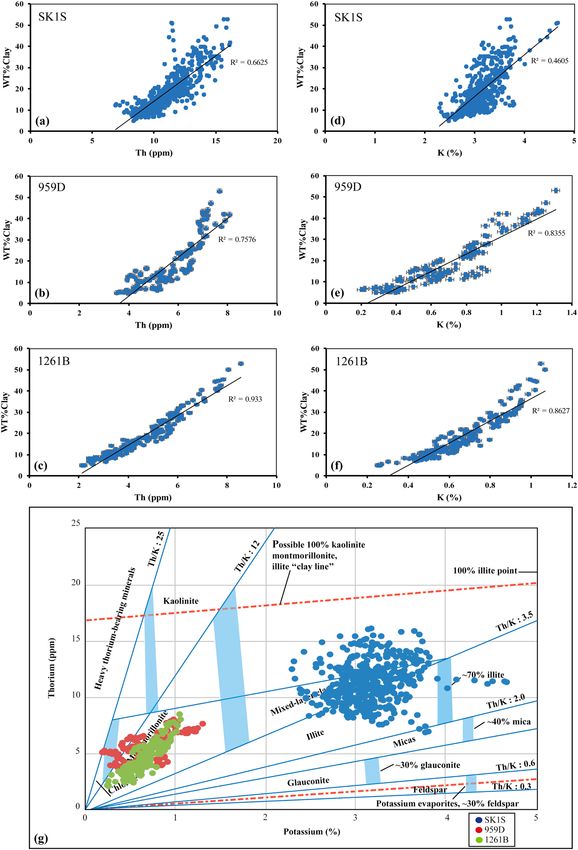
www.nature.com/scientificreports/
In the geosciences, fractal and multifractal features have been increasingly used to describe geological events,
geological processes and geological o bjects28,29. The principal advantage of fractal/multifractal theory concerns
its capacity to characterize irregular and complex phenomena or processes that display similarity over a broad
sequence of scales (self-similarity)30 that the traditional Euclidean geometry method (integral dimension) fails to
analyze31. The fractal concept originates from geometric self-similarity which was first proposed by M andelbrot30.
Self-similar fractals evaluate the presence of an arrangement that is similar to itself on any scale. Since, the
concept has been widely applied in medicine, geology, g eophysics28,31,32. Many occurring natural processes like
OAEs are complex phenomena with their development controlled by complicated processes, and thus do not
follow normal distributions. Consequently, ordinary linear dataset analysis techniques are not sufficient for a
comprehensive analysis of these events. The fractal method is one of the useful concepts to be applied to ana-
lyze complex s ystems33–36. Among numerous fractal methodologies developed since Mandelbrot’s findings, the
concept based on the detrended fluctuation analysis (DFA) which was devised by P eng37 is the most frequently
38
utilized. By expanding the concept of DFA, Kantelhardt et al. initiated the notion of multifractal detrended
fluctuation analysis (MFDFA), which works similarly to the DFA. MFDFA is useful to reveal the multifractal
behavior in any non-stationary data series. This method also allows to detect the causes of multifractality by
comparing the estimated shuffled and surrogate data series derived from the original data series to the original
data series39–42. Multifractality helps to describe more carefully and comprehensively the dynamic properties of
systems, and characterize their behaviors both locally and g lobally43. MFDFA has been used by some scholars
to study geophysical well log d ata44,45, which are governed by complex spatio-temporal dynamics of which non-
linearity and scaling are the dominant p rocesses46.
Using core samples from boreholes, previous studies have greatly improved our understanding of major Cre-
taceous marine and terrestrial c hanges2,4–6,47. However, integrated studies of marine and terrestrial Cretaceous
deposits are r are26, and the multifractal correlation based on spectral gamma ray by means of well log data have
not been conducted.
Compared to the core samples analysis, well logging has several advantages48,49. First, for executing high-
precision continuous sampling (spectral gamma ray, nuclear magnetic resonance, etc.), and measurement of
in-situ formation conditions. Second, for investigating a volume of sediment that is often greater than the one
represented by a core or plug, and consequently than a cutting and so more representative of the mean properties
of the rock, especially in heterogeneous rocks. Third, the human factors have little effects on the measurement
processes. Among the well log data, the spectral gamma ray has proved particularly useful for understanding
paleoenvironmental changes50–53.
To understand the multifractal behavior of the Coniacian–Santonian OAE, marine sedimentary records must
be integrated with terrestrial deposits. Based on data from scientific drilling projects, this work can be achieved
by correlating the non-marine Cretaceous Songliao Basin in eastern Asia with the marine Deep Ivorian Basin in
western Africa and Demerara Rise off the coast of South America where a well preserved response of the OAE3
has been d escribed10,17,20,54–57.
This paper is the first work integrating the multifractal nature of a marine and terrestrial OAE. The aim
is to highlight and compare the multifractal properties of a rare and complex geological event such as OAE3
recorded in marine and terrestrial systems as well as analyze the causes of the multifractality and the possible
factors affecting the multifractal features in both environments, which can help to understand the regional or
local nature of the last Late Cretaceous OAE.
Geological Setting of the drilling sites
Songliao Basin (SLB). The SLB is an elongated large non-marine Cretaceous basin located in northeastern
China (Fig. 1). It represents a Mesozoic–Cenozoic intracratonic basin with the thickness of Cretaceous strata
reaching up to 6,000 m 58,59, making the SLB one of the largest and longest-lasting Cretaceous non-marine basins
on the Earth25. A fluvio-deltaic and lacustrine sedimentary succession ranging from the Turonian to Campanian
has been recorded through two scientific drilling sites (SK1S and SK1N). The Late Cretaceous formations at site
SK1S consists of the older to the younger strata, of six formations namely the Quantou (K2 q ), Qingshankou
(K2 qn), Yaojia (K2 y ), Nenjiang (K2 n), Sifangtai (K2 s), and Mingshui (K2 m) formations controlled by local tec-
tonic motions and climatic variations60,61. K2 qn is subdivided into lower K2 qn (Member 1) composed mainly
of organic-rich laminated mudstone and upper K2 qn (Members 2 and 3) essentially formed of undifferentiated
grey shales62,63, with presences of thin layers of colored marl in the lower s ection58,59. Members 2 and 3 of K2 qn
in hole SK1S are semi-deep lacustrine sediments, and mainly late Turonian to late Coniacian in a ge25 (Fig. 2).
The basin experienced a general shallowing trend from deep lacustrine deposits in Member 1 of K2 qn 62, to fairly
deep and shallow lake in Members 2 and 3 of K2 qn 63.
Deep Ivorian Basin (DIB). The DIB belongs to that of Togo-Benin-Nigeria, to a vast sedimentary complex
whose subsidence began in the Cretaceous. It is a quasi-covered basin, and situated off equatorial West Africa
(Fig. 1); whose formation is related to the expansion of the opening Equatorial Atlantic G ateway57. During ODP
Leg 159, intended to highlight the process of sedimentation and deformation alongside the Cote d’Ivoire-Ghana
Transform Margin, Cretaceous strata were recovered at specific locations 959, 960, 961 and 962 with about
200 m of Upper Cretaceous recovered at site 959D64. From bottom to top formations, five lithostratigraphic units
subdivide hole 9 59D65 namely Unit V, Unit IV, Unit III, Unit II and Unit I. Relatively well-preserved black shale
and siltstones from the Upper Cretaceous to Lower Paleocene (lithologic Unit III) overlie mixed siliceous and
carbonate clastics (lithologic unit IV) of the early Coniacian through to the late Albian65 (Fig. 2). Deposition of
black shales started during the Turonian when the margin differentiation commenced and continuous subsid-
ence generated a semi-enclosed sub-basin57, and was controlled by the climate changes in equatorial Africa.
Scientific Reports | (2020) 10:14363 | https://doi.org/10.1038/s41598-020-71327-w 3
Vol.:(0123456789)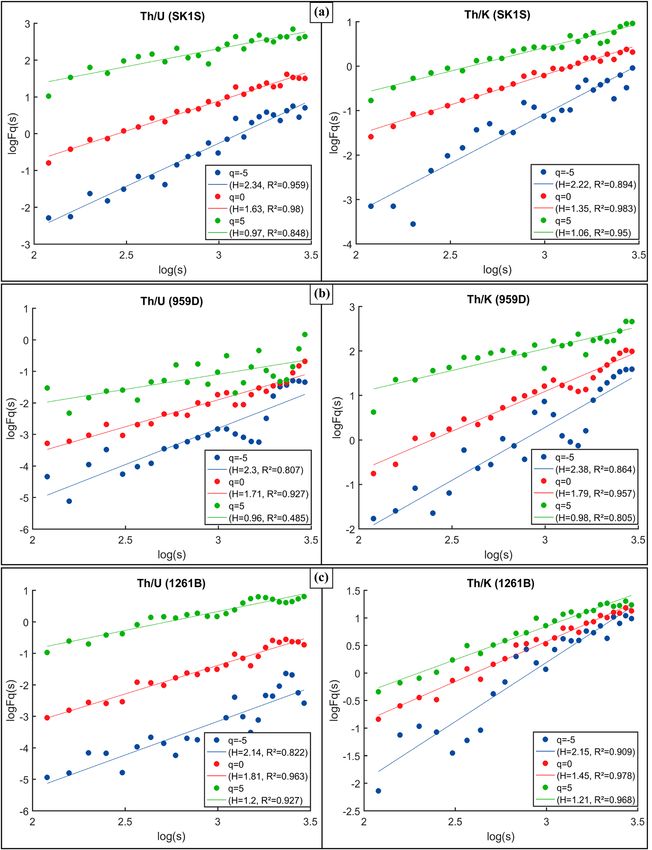
www.nature.com/scientificreports/
Figure 2. Geology of the studied Coniacian–Santonian OAE interval. The age and the location of the two Late
Cretaceous OAEs are from J enkyns4; the stratigraphy at sites SK1S, 959D and 1261B are modified from Wang
et al.63, Beckmann et al.57 and Flögel et al.89, respectively.
Demerara rise (DR). The DR is a submarine plateau off the coast of Suriname and French Guyana on the
northern slope of South America66 (Fig. 1). Built on rifted continental crust of Precambrian and Mesozoic era,
an important part of the submarine plateau is covered by 2–3 km of Cretaceous to Holocene shallow-marine to
pelagic sediments. Five key locations were drilled at DR during ODP Leg 207. Site 1261 is located on the north-
west flank of the DR approximately 350 km north of Suriname67. Five lithostratigraphic units summarize the
stratigraphic background at site 1261 whose 89 m of Upper Cenomanian to Lower Santonian sediments repre-
sent the lithostratigraphic unit IV, with 650.21–563.3 mbsf sediments recovered at site 1 261B68. These sediments
are mainly constituted of calcareous claystone with organic matter combined with clayey chalk with nannofossils
and clayey limestones (Fig. 2). DR experienced a consistent deepening trend during the accumulation of the
organic-rich sediments from Cenomanian to early Campanian69.
Results. The multifractal characteristics of the Th/U and Th/K ratios of the OAE3 and non-OAE sections
at SLB, DIB and DR were studied by the MFDFA. Prior to the MFDFA application, the datasets were first seg-
mented and integrated random walk time series into non-overlapping segments with different scaling (except
DIB before the OAE3 due to the logging depth). By using Eq. (5) and for − 5 < q < 5, the fluctuation function
(Fq(s) versus s) of the Th–K and Th–U distributions have been computed. The scaling behavior obtained by the
log–log plots of the fluctuation function of the Th/U and Th/K ratios of the OAE3 and non-OAE units in dif-
ferent boreholes at SLB (SK1S), DIB (959D) and DR (1261B) are shown in Figs. 3 and 4, respectively. All the
generalized Hurts exponents (Hq) of the Th–K and Th–U distributions in each OAE3 and non-OAE segments
are q dependent (decrease with the increasing of q). The slope of all the fluctuation functions at different scale
decrease with the increase of q, implying that the Th–U and Th–K distributions of the studied OAE3 and non-
OAE intervals have a multifractal p roperty34,70,71. By analyzing the slopes, it appears that the scaling properties of
the Th–K and Th–U distributions at SLB, DIB and DR are closer in the OAE3 interval than the non-OAE3 inter-
vals (Figs. 3, 4; Table 1). Moreover, the scaling behavior of the Th/U ratio in SK1S and 959D are nearly uniform
for all q values which may infer some similarities in the thorium and uranium distributions in the OAE3 units in
both boreholes (Fig. 3). Also considering the Th/K ratio, some similarities in the scaling properties of the Th/K
ratio recorded in the studied OAE3 intervals in SK1S and 1261B can be noticed (Fig. 3).
Scientific Reports | (2020) 10:14363 | https://doi.org/10.1038/s41598-020-71327-w 4
Vol:.(1234567890)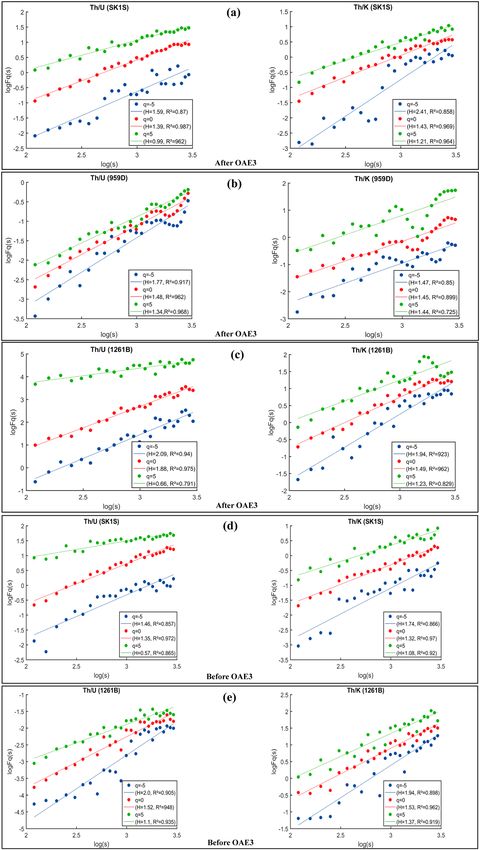
www.nature.com/scientificreports/

                            Figure 3.  Scaling properties of log–log plots of the fluctuation function (Fq(s) versus q) of Th/U and Th/K
                            ratios in the studied OAE3 units recorded in: (a) SLB (borehole south of the Chinese Continental Scientific
                            Drilling Project: SK1S), (b) DIB (hole 959D of ODP Leg 159) and (c) DR (hole 1261B of leg 207); and their
                            associated regression lines.

                               Besides the fluctuation function, the multifractal properties of the studied OAE3 (Fig. 5) and non-OAE3
                            (Fig. 6) segments in SLB, DIB and DR were verified by determining the generalized Hurst exponent h(q), the
                            mass exponent τ(q) and the multifractal spectrum D(α) using Eqs. (7), (8) and (9), respectively. The generalized

Scientific Reports |   (2020) 10:14363 |              https://doi.org/10.1038/s41598-020-71327-w                                            5

                                                                                                                                       Vol.:(0123456789)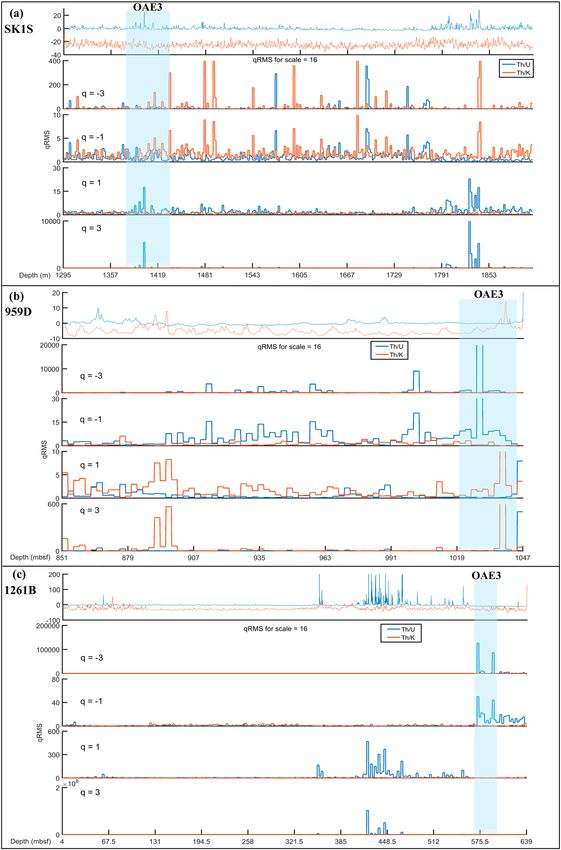
www.nature.com/scientificreports/

                                      Figure 4.  Scaling properties of log–log plots of the fluctuation function (Fq(s) versus q) of Th/U and Th/K
                                      ratios before and after the OAE3 interval in: (a,d) SLB (borehole south of the Chinese Continental Scientific
                                      Drilling Project: SK1S), (b) DIB (hole 959D of ODP Leg 159) and (c,e) DR (hole 1261B of leg 207); and their
                                      associated regression lines.

                                      Hurst exponents h(q) vary with q of the Th/U and Th/K ratios in the three different boreholes (Figs. 5a,d, 6a,c,f,h),
                                      implying the multifractal behavior (except Th–K distribution at DIB after the OAE3) as described by the scal-
                                      ing properties. In the OAE3 segment, the q-dependence of h(q) of the Th/U ratio in SK1S and that of 959D are

          Scientific Reports |   (2020) 10:14363 |               https://doi.org/10.1038/s41598-020-71327-w                                              6

Vol:.(1234567890)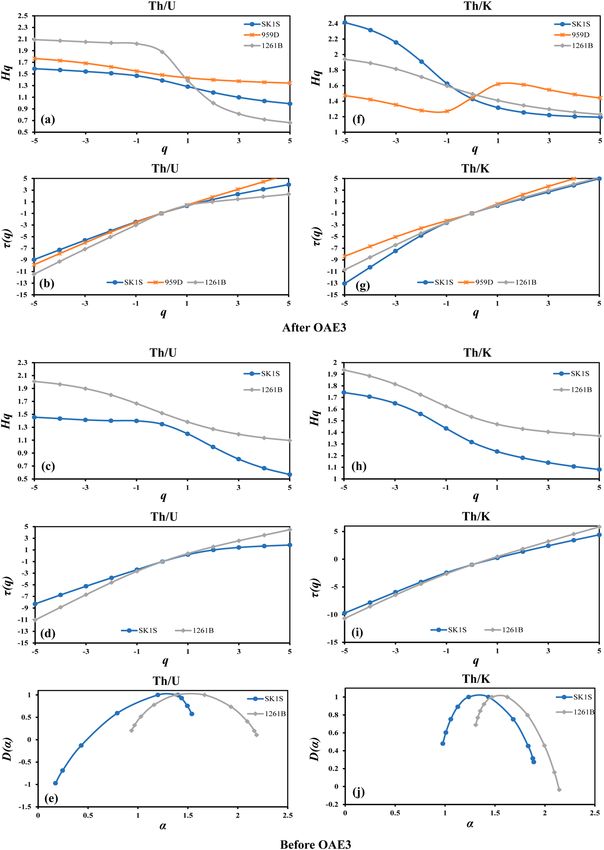
www.nature.com/scientificreports/
Th/U Th/K
|�H Fq (s)| SK1S-959D SK1S-1261B 959D-1261B SK1S-959D SK1S-1261B 959D-1261B
After OAE3
q=− 5 0.18 0.5 0.32 0.94 0.47 0.47
q=0 0.09 0.49 0.4 0.02 0.06 0.04
q=5 0.35 0.33 0.68 0.23 0.02 0.21
OAE3
q=− 5 0.04 0.2 0.16 0.16 0.07 0.23
q=0 0.08 0.18 0.1 0.44 0.1 0.34
q=5 0.01 0.23 0.24 0.08 0.15 0.23
Before OAE3
q=− 5 – 0.54 – – – 0.2
q=0 – 0.17 – – – 0.21
q=5 – 0.53 – – – 0.29
Table 1. Slope difference of the fluctuation functions of the thorium–uranium and thorium–potassium
distributions between localities before, within and after the OAE3 intervals. SK1S (Songliao Basin), 959D
(Deep Ivorian Basin), and 1261B (Demerara Rise).
quasi-similar, but such similarity was not observed in the non-OAE units. Furthermore, by considering the mass
exponent derived from the fluctuation function (Figs. 5b,e, 6b,d,i,g), the Th/U and Th/K ratios of all the studied
OAE3 and non-OAE3 units are multifractal in nature (except Th–K distribution at DIB after the OAE3) since
the mass exponent plots show a nonlinear τ(q) dependence on q72. The degree of multifractality can be evaluated
by the degree of the nonlinearity of the mass exponent for q < 0 and q > 042,72. Table 2 shows that on average, the
highest slope differences of the mass exponent τ(q) between the negative (q < 0) and positive (q > 0) q-order of
Th/U and Th/K ratios are found in the OAE3 interval, indicating that the Th–U and Th–K distributions in this
depositional interval possess a higher degree of multifractality in their scaling properties. In addition, the slope
difference of Th/U and Th/K ratios in SK1S and 959D are close within this unit, which may infer some similari-
ties in their degree of multifractality.
The singularity spectrum D(α) and the singularity exponent α describing the multifractal spectrum of the
Th/U and Th/K ratios of the different formations in the OAE3 and non-OAE3 units are displayed in Figs. 5c,f
and 6,e,j, respectively. The curves described by all the multifractal spectrums are asymmetric unimodal with
different singularity spectrum widths, implying that under fluctuating environmental settings, the Th–K and
Th–U distributions in the studied OAE3 and non-OAE3 intervals present varying multifractal characteristics.
Furthermore, the singularity spectrum widths defined by Δα = αmax − αmin, which reflect the degree of multi-
fractality/complexity were calculated using Eq. (11) (Table 3). When Δα is low, the whole system is described to
possess low heterogeneity in its local scaling and vice v ersa73. Thus, the results show that on average, the OAE3
interval has the larger multifractal spectrum widths of both Th/U and Th/K ratios, which may indicate that the
temporal fluctuation of both Th–U and Th–K distributions in this unit display a high degree of multifractality/
complexity, with a more complex trend in SK1S for Th–U distribution and a more complex trend in 959D for
Th–K distribution.
Discussion
Sources of multifractality. In general, the multifractality observed in time or spatial series have two main
c auses38,42,43,73: (1) the multifractality originating from a wideness of the probability density function (PDF), and
(2) the multifractality caused by long-range correlation for small and large fluctuations in the pattern arrange-
ment. To highlight the dominant one between these two types of multifractality in the Th–K and Th–U distri-
butions in the studied OAE3 and non-OAE3 intervals, we analyzed the corresponding randomly shuffled and
surrogate datasets generated using the original Th–K and Th–U datasets based on Kimiagar et al.41, Movahed
et al.39 and Niu et al.40. Indeed, the shuffled process removes the multifractality due to long-range correlation
while retaining the multifractality caused by the broad PDF signal. Thus, the shuffled dataset will exhibit non-
multifractal behavior, with h(2) = 0.5 if the multifractality properties are solely controlled by the long-range
correlation. In case the multifractality of the analyzed Th–K and Th–U datasets originates from both types of
multifractality, the shuffled series will show weaker multifractality than the original series39. By considering the
surrogate method, the generalized Hurst exponents h(q) generated have the capability to be q-independent if the
multifractality observed in the Th–K and Th–U distributions is mainly from the wideness of PDF. However, if
the multifractality properties are triggered by both sources, then weaker multifractality would be found in both
shuffled and surrogate data of the Th–K and Th–U datasets39,42.
Hence, to explore the origins of multifractality in boreholes SK1S, 959D and 1261B, firstly, the shuffled and
surrogate procedure were applied to the original Th–K and Th–U datasets of the OAE3 interval, and the results
are shown in Fig. 7. Afterwards, the same procedure was applied to the non-OAE3 units (Table 3).
From Fig. 7, it is observed that the generalized Hurst exponents h(q) of the shuffled data set are slightly q
dependent for all Th/U and Th/K ratios with monotonically decreasing curves. Also, the analysis of the general-
ized Hurst exponents indicates that for q = 2, h(q) slightly converge to 0.5. This trend shows that the multifractal
Scientific Reports | (2020) 10:14363 | https://doi.org/10.1038/s41598-020-71327-w 7
Vol.:(0123456789)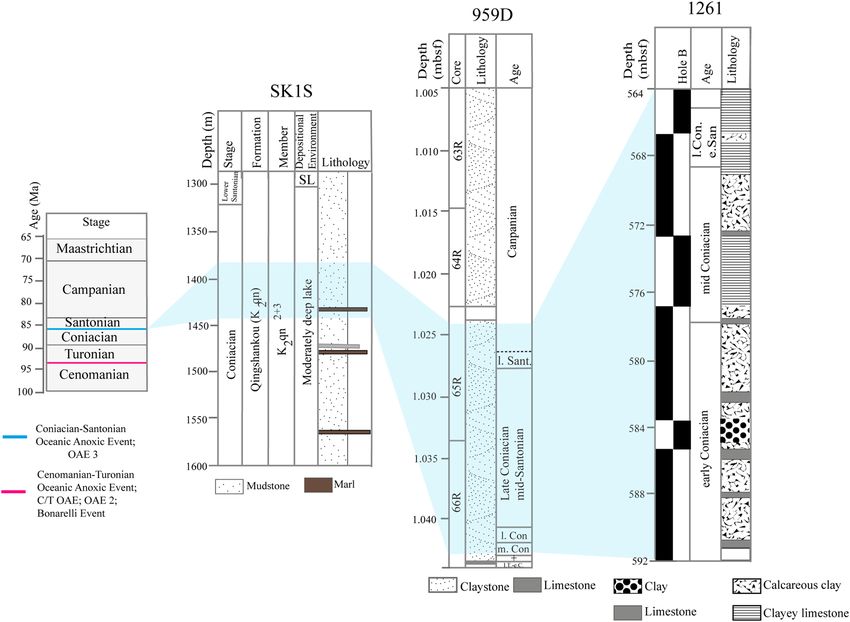
www.nature.com/scientificreports/
Figure 5. The Multifractal properties of the thorium–potassium and thorium–uranium distributions in the
studied OAE3 intervals recorded in Songliao Basin (SK1S), Deep Ivorian Basin (959D) and Demerara Rise
(1261B). (a) The generalized Hurst exponents of the Th/U ratio. (b) The mass exponents of the Th/U ratio. (c)
The multifractal spectrum of the Th/U ratio. (d) The generalized Hurst exponents of the Th/K ratio. (e) The
mass exponent of the Th/K ratio. (f) The multifractal spectrum of the Th/K ratio.
behavior described in the Th/U and Th/K ratios is due to the broad PDF and the long-range correlation. However,
by analyzing the surrogate curves, we observe that the generalized Hurst exponents h(q) of the surrogate series
are all quasi q-dependent, suggesting that the multifractality due to long-range correlation is dominant in the
Th–K and Th–U distributions in the OAE3 intervals. Tanna and Pathak74, and Wu et al.42 described a similar trend
where both the broad PDF and the long-range correlation were the cause of the multifractality when studying an
ionospheric scintillation time series and hydrological data, respectively. To identify the influence of the broadness
of the PDF and the long-range correlation in their dataset, the dimension of the multifractal spectrum width
of the original time series was correlated to the estimated dimensions of the multifractal spectrum width of the
shuffled and surrogate time series. Their results indicated a narrow multifractal spectrum width of the shuffled
time series compared to that of the surrogate time series, which also had a narrow multifractal spectrum width
compared to that of the initial dataset. Subsequently, they concluded that the contribution of the broad PDF on
the multifractal behavior observed in their dataset was weaker than the long-range correlation.
Scientific Reports | (2020) 10:14363 | https://doi.org/10.1038/s41598-020-71327-w 8
Vol:.(1234567890)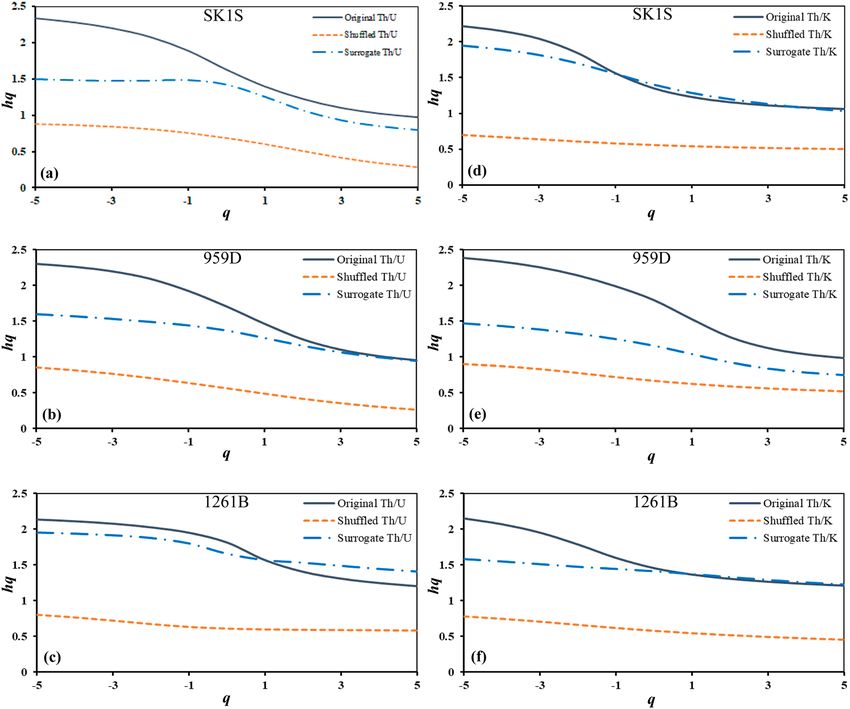
www.nature.com/scientificreports/
Figure 6. The Multifractal properties of the thorium–potassium and thorium–uranium distributions before
and after the OAE3 intervals recorded in Songliao Basin (SK1S), Deep Ivorian Basin (959D) and Demerara Rise
(1261B). Hq, the generalized Hurst exponents. τ(q) the mass exponents, D(α) the multifractal spectrum.
Following the same procedure, the multifractal spectrum widths of the original, shuffled and surrogate series
of the Th–U and Th–K distributions were examined for the OAE3 interval as well as the non-OAE3 units
(Table 3). Through Table 3, it is obvious that the multifractality triggered by the long-range correlation is domi-
nant in the OAE3 intervals in all the boreholes, while it is not the case in the non-OAE3 units. In SK1S, the
�αSurrogate of Th–U distribution is stronger than �αOriginal before and after the OAE3 interval, indicating that
the PDF dominates the m ultifractality75. Th–K distribution exhibits similar behavior before the OAE3 interval at
Scientific Reports | (2020) 10:14363 | https://doi.org/10.1038/s41598-020-71327-w 9
Vol.:(0123456789)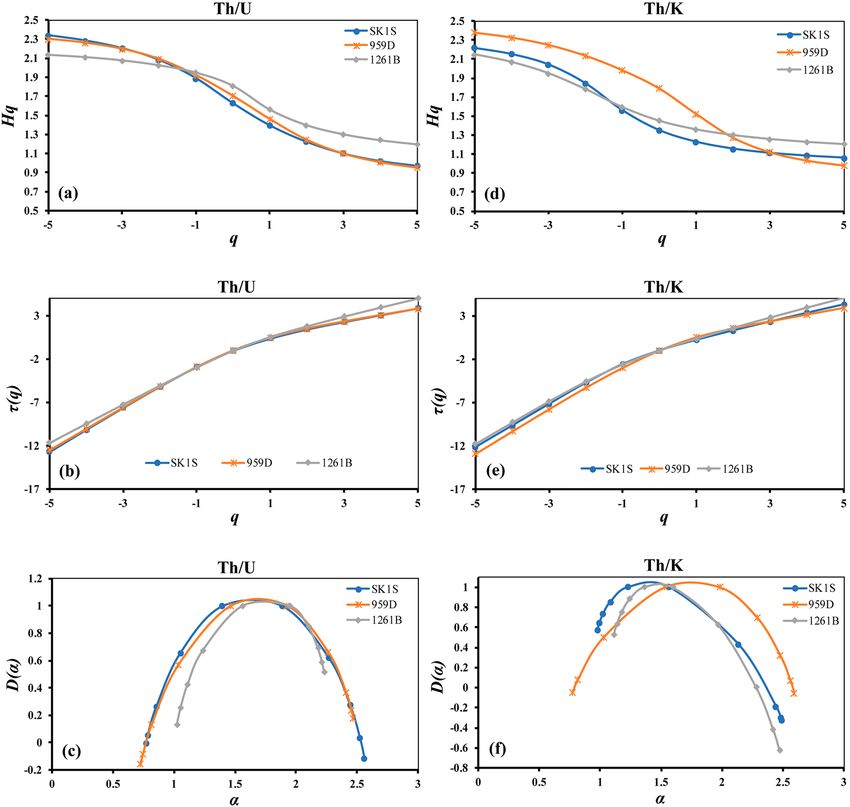
www.nature.com/scientificreports/
Th/U Th/K
Sites SK1S 959D 1261B SK1S 959D 1261B
After OAE3
q∈[−5;0[ 1.62 1.82 2.11 2.63 1.53 2.04
q∈]0;5] 0.91 1.32 0.47 1.16 1.39 1.18
OAE3
q∈[−5;0[ 2.46 2.41 2.19 2.4 2.49 2.3
q∈]0;5] 0.86 0.82 1.1 1.02 0.84 1.17
Before OAE3
q∈[−5;0[ 1.47 – 2.1 1.83 – 2.02
q∈]0;5] 0.4 – 1.02 1.04 – 1.34
Table 2. Slope values of mass exponent τ(q) for thorium–uranium and thorium–potassium distributions
before, within and the OAE3 intervals at Songliao Basin (SK1S), Deep Ivorian Basin (959D) and Demerara
Rise (1261B).
Th/U Th/K
Δα = α max − α min SK1S 959D 1261B SK1S 959D 1261B
After OAE3
Original data 0.88 0.62 1.73 1.65 0.42 1.03
Shuffled 0.72 0.18 1.76 0.39 0.52 0.4
Surrogate 1.9 0.24 1.45 1.11 0.39 0.98
OAE3
Original data 1.79 1.74 1.21 1.51 1.82 1.37
Shuffled 0.87 0.91 0.37 0.34 0.56 0.52
Surrogate 0.95 0.97 0.75 1.3 1.01 0.61
Before OAE3
Original data 1.37 – 1.25 0.91 – 0.84
Shuffled 0.69 – 0.53 0.29 – 0.75
Surrogate 1.95 – 0.98 0.81 – 0.88
Table 3. The multifractal spectrum widths of the thorium–uranium and thorium–potassium distributions
before, within and after the OAE3 intervals at Songliao Basin (SK1S), Deep Ivorian Basin (959D) and
Demerara Rise (1261B).
site 1261B. Moreover the multifractal behavior of the Th–U and Th–K distributions after the OAE3 intervals at
sites 1261B and 959D, respectively is dominated by the PDF since �αShuffled is stronger than �αSurrogate42. Thus,
the main cause of the multifractal behavior of the Th–U and Th–K distributions in the non-OAE3 intervals is
non-homogeneous, however, it is homogeneous in the OAE3 interval (Table 3). Consequently, is there a common
factor controlling the multifractality in the OAE3 intervals in the three basins?
Possible factors affecting the multifractal properties of Th–U and Th–K distributions in the
OAE3 interval. The Th/U and Th/K ratios in sediments fluctuate under a number of different controls such
as clay mineral content, paleo-redox conditions and paleoclimate53,76.
Th/K ratio is for the most part a function of clay mineral content in shale formations77. Previous studies have
shown that the presence of shale and variations in the sub-surface sedimentation pattern largely influence the
multifractal behavior of the gamma ray log r esponse44,45.
Based on the thorium and potassium distributions, we analyzed the likely relationship between clay minerals
and studied OAE3 intervals multifractality (complexity) in each borehole through a Th–K cross-plot (Fig. 8g) and
singularity spectrum width correlation (Table 2). However, since thorium and potassium can also be associated
with non-clay minerals, we first evaluated the correlation between Th and K, and the estimated weight percent
of clay (WT% clay) based on the empirical expression developed by Bhuyan and P assey78 (Fig. 8a–f). WT% clay
represents the total clay obtained from the total GR. Meanwhile, the dispersions between the total GR and Th,
K and U elements are useful to investigate the likely sources of these e lements79. Therefore following Ito et al.79,
a strong correlation between WT% clay, and Th and K suggests that clay is the main contributor of Th and K
responses, while weak correlation suggests that the main source of Th and K may not be the clay minerals. From
Fig. 8a–f, a good positive correlation appears between the weight percent of clay, and Th and K variations at sites
959D and 1261B, while in SK1S, the correlation is moderate for K. The analysis of the correlation coefficients
supposes that clay minerals are the predominant contributors of Th and K responses, and therefore led to clay
Scientific Reports | (2020) 10:14363 | https://doi.org/10.1038/s41598-020-71327-w 10
Vol:.(1234567890)www.nature.com/scientificreports/
Figure 7. The generalized Hurst exponent of shuffled and surrogate data series computed based on the original
thorium–potassium and thorium–uranium distributions in the studied OAE3 intervals recorded in Songliao
Basin (SK1S): (a,d); Deep Ivorian Basin (959D): (b,e); Demerara Rise (1261B): (c,f).
type evaluation by a Th–K cross-plot (Fig. 8g). The results show that in the three boreholes, the nature of domi-
nating clay minerals are different just as it differs from the singularity spectrum widths Δα. In 1261B, the OAE3
segment is dominated by a single type of clay mineral mainly montmorillonite (smectite) and the estimated
dimension of the singularity spectrum width is the lowest (Δα = 1.37). In borehole 959D, three types of clay
minerals (montmorillonite, chlorite heavy thorium bearing minerals) dominate the OAE3 unit and the estimated
dimension of the singularity spectrum width is the highest (Δα = 1.82) (Table 3). At SK1S, although the TEOAE3
interval is dominated by three categories of clay minerals i.e. mixed layer clays (illite-montmorillonite mainly),
illite and micas (Fig. 8g), the estimated dimension of the spectrum width is less than that of 959D (Δα = 1.51)
(Table 3). This partially falls in line with the findings of Gao et al.80, where similar clay distribution results with
illite, illite–smectite and chlorite were found by studying SK1S clay minerals distribution.
These results suggest that the multifractal behavior of the Th–K distribution in the studied OAE3 intervals
is influenced by the nature and diversity of clay minerals, and changes in the deposit environment. This result
is consistent with the work of Dashtian44. Looking at the above differences of thorium and potassium distribu-
tions in these three OAE3 intervals, it suggests that the main factors controlling their scaling behavior during the
development of the Coniacian–Santonian OAE are different. Therefore, the long-term persistence of the Th–K
distribution might be related to the persistence in the deposition of clay minerals and/or Th–K rich minerals
under different sedimentation patterns. Furthermore, the change in the shape of the singularity spectrum for
Th/K and Th/U ratios may indicate some variations in the thorium–potassium and thorium–uranium distri-
butions. When the multifractality is sensitive to the local fluctuations with small amplitudes, the singularity
spectrum will be found with left side s hortness74. In all boreholes, the left side shortened spectrum of the Th/K
ratio of the studied OAE3 intervals (Fig. 5f) suggests the presence of local changes with small amplitudes in
Scientific Reports | (2020) 10:14363 | https://doi.org/10.1038/s41598-020-71327-w 11
Vol.:(0123456789)www.nature.com/scientificreports/
Figure 8. Correlation between the weight percent of clay, Th and K contents; and Clay minerals evaluation in
the OAE3 sections recorded in Songliao Basin, Deep Ivorian Basin and Demerara Rise based on Schlumberger
reference thorium–potassium cross-plot (log interpretation charts 2013).
the depositing of the clay minerals. Sedimentary clay minerals derive from the rock weathering in the source
area, and are influenced by provenance lithology, paleoclimate, depositional environments and rocks formation
(diagenesis)81–83.
In borehole 959D of the DIB, Kennedy and W agner84 linked the clay mineral properties change observed in
the Coniacian–Santonian black shales to the faint precession-driven fluctuations of continental climate. They
Scientific Reports | (2020) 10:14363 | https://doi.org/10.1038/s41598-020-71327-w 12
Vol:.(1234567890)www.nature.com/scientificreports/
theorized that periodical shift of the intertropical convergence zone controlled by minor orbital-driven changes
triggered an increasing rainfall and weathering leading to the genesis of smectite-rich clay84. This climatic control
is supported by the works of C hamley81, who correlated the kaolinite abundance found in the equatorial Eastern
Atlantic Ocean to a strong climatic control regulated by the intensity of the continental hydrolysis. Furthermore,
the left-side truncated spectrum of Th/K ratio (Fig. 5f) indicates the existence of local intermittency in the tho-
rium and potassium deposition, which may suggest the existence of local fluctuations in the climate evolution.
Previous studies based on climate tracers at site 959 showed the presence of highly fluctuating climate modulated
at different timescales during the Upper C retaceous54. Thus, since the Th/K ratio depends on the nature of the
clay mineral assemblage, which are controlled by climatic fluctuations, we correlate the change in the multifractal
features of the Th–K distribution to the change in the climate dynamics during the Coniacian–Santonian OAE3
in the DIB, since several scholars have shown that the multifractality properties of geological data change with
the changes in the climatic p rocesses73,85–87.
At DR (borehole 1261B), the Late Cretaceous clastic sediments derive from weathered granitoid basement
rocks of the Guyana S hield67,88. These sediments afterwards were accumulated under seasonal and long-term
(mainly eccentricity and obliquity) bands89. The existence of smectite (montmorillonite) as the predominant
type of clay mineral in the Coniacian–Santonian OAE3 interval (Fig. 8g) suggests an increase in chemical
weathering81 under small seasonal climate fluctuation during its depositional time, because smectite is known as
a product derived from a seasonal climate, minor changes in continental climate84. Based on carbonate analysis
recorded alongside DR, Nederbragt et al.90 also reported a tropical seasonality on DR throughout the Turonian
to Santonian. The local intermittency in the thorium and potassium deposition revealed by the multifractal
spectrum width of the Th/K ratio may also be due to this seasonal change. Therefore, the abundance of one type
of clay mineral implies that the seasonal fluctuation is far from the main factor controlling the thorium–potas-
sium ratio. Consequently, the multifractal nature of the thorium–potassium distribution observed in the OAE3
segment in borehole 1261B may be due to persistence in Al-rich weathered granitoid basement rocks from the
Guyana Shield resulting from minor seasonal climate fluctuations chiefly controlled by eccentricity and obliquity.
Figure 8g shows that illite, mixed layer clays (illite–montmorillonite) and micas dominate the TEOAE3 unit
in SK1S without smectite. This trend was described by Gao et al.80 as a consequence of burial diagenesis due to
the fact that illite persists during burial diagenesis, while smectite is transformed in illitic layers—associated with
geochemical changes involving K and Al dissolved from proximate feldspars and m ica91. Since SLB is enclosed
by crystalline igneous o utcrops92, their weathering would have released Al and K which get integrated in the
smectite layers to form illitic clays. This is consistent with the medium correlation between the weight percent
of clay and K in SK1S (Fig. 8d) indicating that a substantial part of K may derive from non-clay minerals. Fur-
thermore, based on climatically sensitive proxies, Wang et al.26 found that SLB did not undergo large climatic
variations throughout the Late Cretaceous but experienced abundant rainfall inferring that local fluctuations
were common phenomena in the paleo-basin. This seems consistent with the left-side truncated spectrum of
Th/K ratio (Fig. 5f) indicating the existence of local intermittency in the thorium and potassium deposition,
which may suggest the existence of local fluctuations during the OAE3. Since, the burial diagenesis is the main
process controlling the clay mineralogical change below 1,100 m in SK1S80, and the basin did not experience
large climatic s hifts26, and as the TEOAE3 interval in SLB ranges from 1,380 to 1,440 m (Fig. 9a), we therefore
correlate the multifractality of the lacustrine OAE3 Th/K ratio to a long-term persistence of the local burial
diagenesis during the basin subsidence under the control of local tectonic and climatic variations80,93, which
played an important role during the basin structuration.
Similar to the Th/K ratio, the probable factors affecting the multifractal properties of the thorium–uranium
distribution in the studied OAE3 intervals were analyzed in all boreholes by correlating the thorium–uranium
cross-plot (Fig. 10) and the singularity spectrum results. Th/U ratio is a useful proxy to track the paleo-redox
conditions of the original sedimentary environment and/or subsequent diagenetic p rocesses94 since it is often
95
strongly connected with the changes in the depositional e nvironment . The depositional environment is probably
described as reducing when Th/U < 2 (commonly marine), or oxidizing when Th/U > 7 (possibly terrestrial)95,96.
Based on Fig. 10, the three OAE3 intervals were deposited in different paleo-redox conditions. In boreholes 959D
and 1261B, the Th/U ratio shows that the OAE3 unit is mainly characterized by reducing environment while in
SK1S it is characterized by a period ranging from oxidation to reduction sedimentation.
According to San José Martínez et al.97 and Liu et al.34, the shape features of the multifractal spectrum defined
by ΔD = D(αmax ) − D(αmin ) can estimate the probability of the dominate subset in time series. When ΔD < 0, a
small probability subset dominates, while a large probability subset dominates when ΔD > 0. Therefore, a period
of strong and long-term reducing environment dominates in the OAE3 interval at sites 959D and 1261B and
correlates well with ΔD > 0 (Table 4). This is supported by the computed average of Th/U ratio in both boreholes
((Th/U)mean = 0.66 and (Th/U)mean = 1.3, respectively). Previous studies based on geochemical data analysis found
a similar result at both s ites17,57,67,89. Furthermore, the analysis of the singularity spectrum of the Th/U ratio
indicates a right-side shortness of the multifractal spectrum (Fig. 5c), reflecting the existence of small-scale
intermittency in the thorium–uranium distribution at both sites74, which may reveal some shifts in the redox
conditions during the deposition of the OAE3 interval. This result is consistent with the works of März et al.17 and
Hofmann and W agner67 who described periodic changes between anoxic and euxinic bottom water condition
under periodic shifts of the Intertropical Convergence Zone during the deposition of the Coniacian–Santonian
OAE3 intervals at DR and DIB. Hence, the multifractal nature of the thorium–uranium distribution in the
OAE3 intervals may be due to long-term persistence of reducing conditions at sites 9 59D98 and 1 261B55, which
contributed to the deposition of black shale at DR and DIB.
In SK1S, ΔD < 0 (Table 4) suggesting that there is a small probability that neither the oxidizing nor reduc-
ing environment dominates during the OAE3. This result is consistent with the computed mean of Th/U ratio
((Th/U)mean = 4.04) in the TEOAE3 interval, indicating that the OAE3 occurred during a transitional period
Scientific Reports | (2020) 10:14363 | https://doi.org/10.1038/s41598-020-71327-w 13
Vol.:(0123456789)www.nature.com/scientificreports/
Figure 9. Spectral gamma ray, the computed Th/U and Th/K ratios, and the studied Coniacian–Santonian OAE
intervals in SK1S (a), 959D (b) and 1261B (c). The OAE3 intervals in SK1S, DIB and DR are from Jones et al.23,
Wegner et al.98 and Beckmann et al.20, respectively.
between reducing and oxidizing sedimentation as also revealed by Jones et al.23. As mentioned before, the mul-
tifractal singularity spectrum displays left-side shortness when the dataset has a multifractality that is sensitive
to the local fluctuations with minor amplitudes. In the case of SK1S, the thorium–uranium distribution suggests
Scientific Reports | (2020) 10:14363 | https://doi.org/10.1038/s41598-020-71327-w 14
Vol:.(1234567890)www.nature.com/scientificreports/
Figure 10. OAE3 paleo-redox conditions characterization in Songliao Basin, Deep Ivorian Basin and Demerara
Rise based on thorium–uranium cross-plot. Th/U < 2 represents a reducing environment; Th/U > 7 represents
an oxidizing environment; 2 < Th/U < 7 represents a transitional period between oxidizing and reducing
environment.
Th/U
Multifractal spectrum shape SK1S 959D 1261B
ΔD =D(αmax ) − D(αmin ) − 0.108 0.336 0.384
Table 4. The multifractal spectrum shape features of the thorium–uranium distribution in the studied OAE3
intervals.
Locations Box dimension Higuchi dimension
SK1S 1.64 1.89
959D 1.58 1.54
1261B 1.46 1.31
Table 5. Estimated fractal dimensions of thorium–uranium distribution in the studied OAE3 intervals.
the presence of local fluctuations under minor changes since the multifractal spectrum of the Th/U ratio exhibits
left-side shortness (Fig. 5c). The multifractal behavior of the thorium–uranium distribution may be a conse-
quence of long-term persistence of local changes like increased seasonality, freshening of bottom-water, and/or
lake depth reducing which likely contributed to the reoxygenation of the water column and consequently, the
demise of the reducing c ondition23.
The computed multifractal spectrum widths of Th/U ratio differ from OAE3 segment to OAE3 segment
indicating distinct redox-potential strength (Table 3). The expression of the OAE3 unit recorded in SK1S dis-
plays the highest singularity spectrum width of Th/U ratio implying that this interval was deposited in more
complex paleo-redox environment compared to those in boreholes 959D and 1261B, as also revealed by the
thorium–uranium cross-plot (Fig. 10) and by the fractal dimensions (Table 5) estimated using the commonly
used box dimension ( DB)99 and Higuchi dimension ( DH)100 defined by:
log Nδ d ln (L(k))
DB = lim and DH = − (1)
δ→0 − log δ d ln (k)
where N is the number of thorium–uranium data series and δ the scale; L(k) the normalized length of the data
series.
We hypothesize that the changes in the paleo-redox conditions influenced the multifractal properties of the
thorium–uranium distribution in the studied OAE3 intervals.
Furthermore, the similarities of the paleo-redox conditions during the OAE3 were explored through the
root-mean-square (RMS) variation which helps to study the average variation of time series. Indeed, the RMS
can be used to segregate the fluctuation function between the amplitudes of the local c hanges71 based on the
q-order variation. The scaling properties of RMS quantifies the variation of the fluctuation function over the
interval with large and minor changes. In marine environment (959D and 1261B), the fluctuation function of
Scientific Reports | (2020) 10:14363 | https://doi.org/10.1038/s41598-020-71327-w 15
Vol.:(0123456789)www.nature.com/scientificreports/
thorium–uranium distribution is characterized by a period with small variation for negative scaling (q < 0) during
the OAE3 (Fig. 11a,b), while in the non-marine SLB (SK1S), the fluctuation function of thorium–uranium distri-
bution displays a period with large variation over positive scaling (q > 0) during the OAE3 (Fig. 11c). Therefore,
the paleo-redox condition in SK1S differ significantly from that of 959D and 1261B.
Since the OAE3 is known as associated with a period of long-term significant change in the Earth’s climate
dynamism with a major cooling trend spanning from the mid-Cretaceous mega-greenhouse to the normal green-
house state10, this transition likely triggered changes in the depositional systems. Furthermore, astronomical forc-
ing seems to control the black shale deposition in the OAE3 interval at D IB21,54, DR101 as well as the depositional
25
processes in S K1S . Thus, in light of the aforementioned detailed discussion, we surmise that the climatic and
environmental disturbances during the OAE3 (probably due to an orbital forcing) induced changes in both the
weathering mechanism and the deep-water sediments supply which in turn influenced the clay mineralogy and
the bottom water redox conditions in marine and continental basins—and consequently the scaling behavior
of Th–K and Th–U distributions.
Conclusions. Based on spectral gamma ray log data recorded in the non-marine Cretaceous Songliao Basin
and the marines Deep Ivorian Basin and Demerara Rise, for the first time, the multifractality of the Coniacian–
Santonian oceanic anoxic event was explored through analysis of the multifractal behavior of thorium–potas-
sium and thorium–uranium distributions both in marine and terrestrial environments using the MFDFA. The
following conclusions can be drawn:
1. The q-dependence of the generalized Hurst exponents h(q), classical scaling exponents and multispectral
spectrum indicate that the thorium–potassium and thorium–uranium distribution in the OAE3 interval
from both marine and terrestrial records exhibit a multifractal nature. The results of the estimated shuffled
and surrogate data series show that the multifractality due to long-range correlation is dominant in the
Coniacian–Santonian OAE interval in both marine and terrestrial environments.
2. The multifractal behavior of the studied OAE3 intervals is associated with the presence of clay minerals and
change in the paleo-redox conditions. At all sites the left side shortened spectrum of the Th/K ratio estimated
based on the spectral gamma ray indicate the presence of local changes with small amplitudes in the deposi-
tion of clay minerals during the OAE3. Moreover, the shortened singularity spectrum of thorium–uranium
distribution reflects the existence of small-scale fluctuation with large amplitudes in the redox conditions
at the marine sites (DIB and DR). Whereas in the Songliao Basin, the singularity spectrum indicates the
presence of local fluctuations with small amplitudes during the OAE3.
3. The multifractal features, the fractal dimensions and the RMS of the described Coniacian–Santonian oceanic
anoxic events based on the spectral gamma ray differ from each other and correlate with the changes in the
sedimentation pattern under different paleoenvironmental conditions in both marine and terrestrial environ-
ments, suggesting a more local behavior of the event even though the regional character is not neglected.
Data and analysis method
Data. The log gamma records the total natural gamma radiation while the spectral gamma ray log not only
indicates the whole intensity of radioactivity, but also estimates quantitively the content of the main radioactive
constituents (Th, U and K) in the formation. Because the concentration of natural radioactive elements is mainly
a function of the depositional environment and d iagenesis102, the spectral gamma ray log have been widely used
for paleoenvironmental research51–53.
The data used in this work are chiefly the spectral gamma ray logs data (Fig. 9) originating from downhole
logging using the gamma ray spectrometry tool during the first stage of the Continental Scientific Drilling Project
of Cretaceous Songliao Basin (SK1), Ocean Drilling Program (ODP) Leg 159 and ODP leg 207. The Th/K and
Th/U ratios were subsequently computed prior to the multifractal analysis due to the fact that these two proxies
are sensitive to paleoenvironmental changes.
Analysis method. The approach applied for the analysis of the spectral gamma ray data in the present paper
is the MFDFA. MFDFA has been widely employed to explore the self-similarity nature of nonstationary time
series42,45,73,103,104. The analysis procedure can be found as follows38:
• Determine the fluctuation profile Y(t) of the Th–K and Th–U distributions considering xt the data of Th–K
and Th–U ratios of length N
N
Y (t) = (xt − x); t = 1, 2, . . . , N (2)
i=1
where x is the mean of the data series xt.
• Segregate the N-length Y(t) of the Th–K and Th–U distributions obtained from Eq. (2) into uniform non-
overlapping intervals Ns = int(N/s) of length s. Mostly, because N is not a common multiple of s, a short
part of the fluctuation profile may be left at the end of the division. To have a complete sampling of the whole
segment, the segmentation is repeated backwards i.e. starting from the opposite end of the data series. This
process provides 2Ns non-overlapping segments of Th–K and Th–U distributions at the end.
• Estimate the variance of the 2Ns segments of the Th–K and Th–U distributions by statistical approach:
Scientific Reports | (2020) 10:14363 | https://doi.org/10.1038/s41598-020-71327-w 16
Vol:.(1234567890)www.nature.com/scientificreports/
Figure 11. The q-order RMS of the thorium–uranium and thorium–potassium distribution in the studied
OAE3 intervals.
Scientific Reports | (2020) 10:14363 | https://doi.org/10.1038/s41598-020-71327-w 17
Vol.:(0123456789)www.nature.com/scientificreports/
s
1
2
F 2 (s, v) = Y [(v − 1)s + i] − yv (i) , v = 1, 2, . . . , Ns (3)
s
i=1
s
1
2
F 2 (s, v) = Y [(N − (v − Ns )s + i] − yv (i) , v = Ns + 1, . . . , 2Ns (4)
s
i=1
with yv (i) the fitting polynomial in segment v.
• Determine the qth order fluctuation function Fq (s) of the overall segmented intervals v of the 2Ns non-
overlapping segments of the Th–K and Th–U distributions:
2N
q1
1
s
2
q
Fq (s) = F (s, v) 2 (5)
2Ns
v=1
where generally, q ∈ R\{0} and s ≥ m + 2. For q = 0, Fq (s) is formulated by:
2N
1
s
2
(6)
F0 (s) = exp ln F (s, v)
4Ns
v=1
When q = 2, the process downgrades to DFA. Generally, the variation of Fq (s) helps to understand the scal-
ing behavior of the data series. Therefore, for different values of q, the segregation into 2Ns intervals, F 2 (s, v)
estimation and Fq (s) determination steps are executed many times for several scale s as we want to highlight
the scaling behavior of the fluctuation functions Fs of the Th–K and Th–U distributions in the studied OAE3
and non-OAE3 intervals at any scale s for different values of q .
• Analyze the scaling properties of the fluctuation functions of the Th–K and Th–U distributions through the
log–log plots of Fq (s) versus s evaluation. If the fluctuation functions Fq (s) and the scaling s are positively
correlated as a power law defined by Eq. (7), the data series xt of Th–K and Th–U ratios are described as
long-range power law correlated.
Fq (s) ∼ sh(q) (7)
In Eq. (7), h(q) defined as the slope of the log(Fs) versus log(s) plot represents the generalized Hurst
exponent38. Analyzing h(q) helps determine the fractality in the Th–K and Th–U distributions in the studied
OAE3 and non-OAE3 intervals. The non-dependence of h(q) on q implies a monofractal nature of the data series
while in the case of multifractal dataset, h(q) is mostly q dependence. Furthermore, the h(q) characterizes the
scaling features of the intervals with large variations for positive q order (q > 0). On the other hand (for negative
q order, q < 0), h(q) describes the scaling features of the intervals with minor variations. Besides, the generalized
Hurst exponent and the mass exponent τ(q) define a first-order equation expressed by:
(8)
τ q = qh q − 1
To characterize the multifractality in the studied OAE3 and non-OAE3 intervals, the singularity spectrum or
multifractal spectrum D(α) of the Th–K and Th–U distributions can be determined via the first-order Legendre
transformation
(9)
α = (dτ )/ dq and D q = qα − τ q
where α is the multifractal singularity exponent. By using Eq. (9), a relationship exists between the multifractal
spectrum D(α) and the multifractal singularity exponent α:
α = h q + qh′ q and D(α) = q α − h q + 1 (10)
The degree of multifractality or complexity (also known as the width of the multifractal spectrum) of the
data series is related to the dependence of h(q) on q42 and is expressed by Eq. (11). Therefore, the degree of
multifractality of the Th–K and Th–U distributions in the studied OAE3 and non-OAE3 intervals was explored
based on Eq. (11).
�α = αmax − αmin (11)
The width of the spectra helps to quantify the strength of the multifractality in the Th–K and Th–U distribu-
tions. A narrow spectra width implies weak multifractality in the Th–K and Th–U distributions and vice versa.
Data availability
The data used in the present article are available in the Supplementary Information files.
Received: 19 August 2019; Accepted: 14 August 2020
Scientific Reports | (2020) 10:14363 | https://doi.org/10.1038/s41598-020-71327-w 18
Vol:.(1234567890)You can also read