A multiparametric extraction method for Vn96 isolated plasma extracellular vesicles and cell free DNA that enables multi omic profiling
←
→
Page content transcription
If your browser does not render page correctly, please read the page content below
www.nature.com/scientificreports
OPEN A multiparametric extraction
method for Vn96‑isolated plasma
extracellular vesicles and cell‑free
DNA that enables multi‑omic
profiling
Jeremy W. Roy1, Catherine A. Taylor1, Annie P. Beauregard1,4, Surendar R. Dhadi1,
D. Craig Ayre1,5, Sheena Fry1,6, Simi Chacko1, Gabriel Wajnberg1, Andrew P. Joy1,
Ngoc‑Nu Mai‑Thi1, Nicolas Crapoulet1, David A. Barnett1, Anirban Ghosh1,2,
Stephen M. Lewis1,2,3 & Rodney J. Ouellette1,2*
Extracellular vesicles (EVs) have been recognized as a rich material for the analysis of DNA, RNA, and
protein biomarkers. A remaining challenge for the deployment of EV-based diagnostic and prognostic
assays in liquid biopsy testing is the development of an EV isolation method that is amenable to a
clinical diagnostic lab setting and is compatible with multiple types of biomarker analyses. We have
previously designed a synthetic peptide, known as Vn96 (ME kit), which efficiently isolates EVs from
multiple biofluids in a short timeframe without the use of specialized lab equipment. Moreover, it
has recently been shown that Vn96 also facilitates the co-isolation of cell-free DNA (cfDNA) along
with EVs. Herein we describe an optimized method for Vn96 affinity-based EV and cfDNA isolation
from plasma samples and have developed a multiparametric extraction protocol for the sequential
isolation of DNA, RNA, and protein from the same plasma EV and cfDNA sample. We are able
to isolate sufficient material by the multiparametric extraction protocol for use in downstream
analyses, including ddPCR (DNA) and ‘omic profiling by both small RNA sequencing (RNA) and mass
spectrometry (protein), from a minimum volume (4 mL) of plasma. This multiparametric extraction
protocol should improve the ability to analyse multiple biomarker materials (DNA, RNA and protein)
from the same limited starting material, which may improve the sensitivity and specificity of liquid
biopsy tests that exploit EV-based and cfDNA biomarkers for disease detection and monitoring.
Biomarkers have been applied to the diagnosis and management of a wide variety of diseases, including cancer,
cardiovascular disease, neurodegenerative diseases, immunological diseases and many others. Currently bio-
markers for diseases such as cancer are detected by utilizing tissue biopsies; however, tissue biopsies are invasive
and suffer from limitations such as sampling bias, failure to capture tumour heterogeneity, inability to perform
screening or early detection, cost, and the inability to monitor changes as the disease progresses once the primary
tumor has been removed or t reated1. Furthermore, tissue biopsy comes with inherent drawbacks and risks to the
patient, such as pain, the potential for complications, or the need for anesthesia2. In many instances, tissue biopsy
is not feasible due to inaccessibility of the tumor or due to the patient’s inability to withstand the procedure.
Liquid biopsy refers to the collection of a biofluid and the subsequent analysis of disease biomarkers that are
present in the biofluid for disease detection and/or monitoring. In contrast to tissue biopsy, liquid biopsies are
minimally-invasive, proposed to allow a comprehensive sampling of tumour heterogeneity, more readily permit
longitudinal sampling, are cost-effective, and require only moderate training3,4. Liquid biopsy typically makes
1
Atlantic Cancer Research Institute, 35 Providence St., Moncton, NB E1C 8X3, Canada. 2Department of Chemistry
and Biochemistry, Université de Moncton, Moncton, NB, Canada. 3Beatrice Hunter Cancer Research Institute,
Halifax, NS, Canada. 4Present address: Fisheries and Oceans Canada, Aquatic Animal Health, Moncton, NB,
Canada. 5Present address: Immunology, Genetics and Molecular Sciences, University of Medicine and Health
Sciences, Basseterre, St. Kitts and Nevis. 6Present address: Specialized Health Services Directorate, Health
Canada, Ottawa, ON, Canada. *email: rodneyo@canceratl.ca
Scientific Reports | (2021) 11:8085 | https://doi.org/10.1038/s41598-021-87526-y 1
Vol.:(0123456789)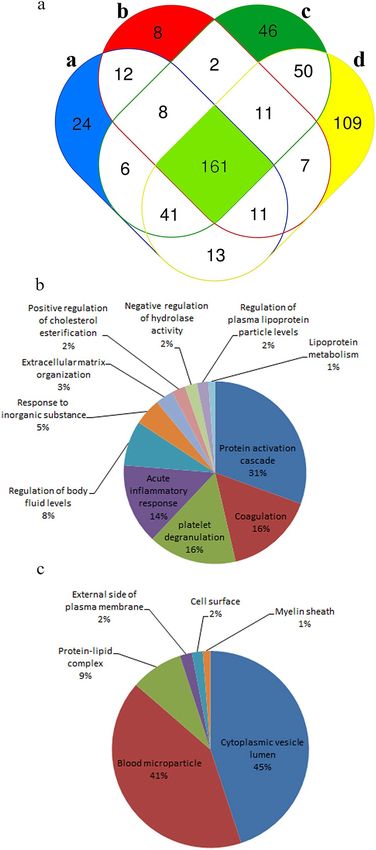
www.nature.com/scientificreports/
Donor Gender Age Ethnicity
a F 32 Hispanic
b M 48 Caucasian
c M 27 Black
d F 24 Hispanic
Table 1. Donor plasma.
use of blood samples; however, other biofluids can be used, such as urine, saliva, breast milk, and cerebrospinal
fluid. Certain types of liquid biopsies (such as urine) typically yield substantial volumes of fluid, whereas others
(such as blood and cerebrospinal fluid) may only provide a few milliliters of biofluid for downstream analyses.
Similarly, biobanks that collect and curate patient biofluids, such as plasma, are frequently only able to provide
a limited volume of sample to researchers in order to maximize the number of researchers and research projects
that can access the samples. Therefore, it is important to devise liquid biopsy protocols that extract the most
information from a limited sample volume.
Beyond the collection and analysis methods employed, evaluating clinically-relevant biomarkers relies on
the comprehensive analysis of information obtained from the molecular profiling of DNA, RNA and protein.
Several approaches are currently being used to isolate material from biofluids for liquid biopsy testing, including
the capture and analysis of cell-free DNA (cfDNA), circulating tumour cells, and extracellular vesicles (EVs).
A drawback of using cfDNA for a liquid biopsy test is that only DNA mutations can be analyzed. In contrast,
circulating tumour cells provide material for DNA, RNA, and protein analyses, but their limited numbers and
difficult isolation5,6 are hurdles for widespread use in liquid biopsy testing. Since circulating EVs contain DNA,
RNA, and protein derived from the site of disease7–10 and since EVs are often present in high abundance in the
biofluids of affected patients11, EVs represent an excellent starting material for liquid biopsy-based molecular
testing. Moreover, the ability to assay multiple biomarker materials (i.e. a multiparametric extraction of DNA,
RNA, and/or protein and subsequent multi-omic analyses) from the same sample should provide a compre-
hensive analysis of the molecular profile of a particular patient’s disease. To our knowledge several articles have
discussed the potential use of a multi-omic approach to discover novel circulating b iomarkers12,13; however, there
is a lack of reports demonstrating the development of protocols that combine EV isolation with multiparametric
extraction methods to enable this multi-omic approach.
Herein we describe a multiparametric extraction protocol that can isolate DNA, RNA and protein from EVs
and cfDNA isolated from the same starting material: in this case, human plasma. Our approach for the isolation
of biomarker-containing material from plasma for multiparametric extraction and analyses relies on the Vn96
synthetic peptide, which has been shown to isolate both EVs14 and cfDNA15 from biofluids. We show that we
can perform diagnostically-relevant tests and multi-omic profiling on the extracted material, including droplet
digital PCR (ddPCR) for DNA, small-RNA sequencing for analysis of miRNA, and mass spectrometry for char-
acterization of EV-associated proteins.
Methods
Plasma samples. Human plasma derived from whole blood collected in EDTA-tubes was purchased from
Innovative Research Inc. (Novi, MI, USA). Whole blood was processed within 1 h of collection by centrifugation
at 5000× g for 15 min at 4 °C in order to separate the plasma fraction.
All methods were carried out in accordance with the Canadian Research Tri-Council policy on ethical con-
duct for research involving humans (https://e thics.g c.c a/e ng/p
olicy-p
oliti que_t cps2-e ptc2_2 018.h
tml). Approval
for this study was obtained from the Research Ethics Board of Vitalité Health Network and written informed
consent was obtained from the patients. Donors were not fasted. See Table 1 for donor information.
Ultracentrifugation (UCF) and sucrose‑cushion UCF (scUCF). Plasma (1 mL) was diluted to ~ 10 mL
with 0.1 µm filtered 1 × PBS and either directly transferred to an ultracentrifuge tube (UCF) or overlayed on top
of 0.5 mL 30% sucrose solution (scUCF; ρ = 1.127) and subjected to ultracentrifugation at 100,000 × g for 2 h at
4 °C using a Beckman Coulter Ultracentrifuge equipped with a SW40Ti rotor (k-factor = 277.5). The UCF EV
pellet was washed once with PBS followed by a second ultracentrifugation at 100,000 × g for 2 h and the resulting
pellet resuspended in 2 M NaCl overnight at 4 °C for nanoparticle tracking analysis (NTA), or protein lysis buffer
[0.125 mM Tris–HCl; pH 6.8, 2% SDS, 1 × Protease Inhibitor Cocktail Set III (PICIII)] for Western blot analyses.
For scUCF, the sucrose layer was collected (~ 1 mL) and diluted 1:10 with PBS and subjected to ultracentrifuga-
tion at 100,000 × g for 2 h and the resulting pellet solubilized in 2 M NaCl overnight at 4 °C for nanoparticle
tracking analysis (NTA), or protein lysis buffer for Western blot analyses.
Vn96‑mediated EV isolation and characterization. EVs were extracted using the ME kit for EV isola-
tion (New England Peptide, Gardner, MA, USA), which uses the synthetic peptide Vn96 for an affinity capture
method14 for the isolation of EVs, EV-associated nucleic acid, and EV proteins from a variety of biofluids. Fig-
ure 1a presents our simplified protocol used for isolating EVs from plasma collected in EDTA tubes. Plasma
(1–4 mL) from each donor was diluted 1:1 with RNAase-free PBS (1 ×) pre-filtered at 0.1 µm (Fig. 1a, Step 1).
Protease Inhibitor Cocktail Set III (1:400; MilliporeSigma) was added to each diluted donor plasma (Fig. 1a, Step
2). Vn96 (100 µg per mL of undiluted plasma), which was suspended at a stock concentration of 2.5 mg/mL in
Scientific Reports | (2021) 11:8085 | https://doi.org/10.1038/s41598-021-87526-y 2
Vol:.(1234567890)
www.nature.com/scientificreports/

                                  Figure 1.  Schematic representation of the simplified protocol for the use of (a) Vn96 in plasma and (b)
                                  subsequent multiparametric extraction of DNA, RNA and Protein.

                                  ME buffer, was added to the samples (Fig. 1a, Step 3) and incubated for 1 h with end-over-end rotation at room
                                  temperature (Fig. 1a, Step 4). Samples were centrifuged at 17,000 × g (k-factor = 743) for 15 min at 4 °C (Fig. 1a,
                                  Step 5). Supernatant was discarded and Vn96-EV pellets were washed 3 times with 2 mL of 1 × PBS pre-filtered
                                  at 0.1 µm followed by centrifugation at 17,000 × g for 10 min at 4 °C (Fig. 1a, Step 6). The resulting Vn96-EV and
                                  cfDNA pellet was solubilized in either (1) miRVana lysis buffer for single-parametric RNA extraction (proto-
                                  col provided in miRVana miRNA extraction kit) or multiparametric extraction (see below), (2) 2 M NaCl and
                                  incubated overnight at 4 °C for nanoparticle tracking analysis (NTA), or (3) protein lysis buffer for Western blot
                                  analyses. A scrambled peptide (Scr; New England Peptide) and ME buffer (without peptide) were included as
                                  negative controls.

                                  Multiparametric extraction. Disruption and lysis of the Vn96-EV and cfDNA pellet (from Fig. 1a, Step
                                  6i) for multiparametric (MP) extraction was performed at room temperature in 300 µL miRVana lysis buffer

Scientific Reports |   (2021) 11:8085 |                https://doi.org/10.1038/s41598-021-87526-y                                                  3

                                                                                                                                              Vol.:(0123456789)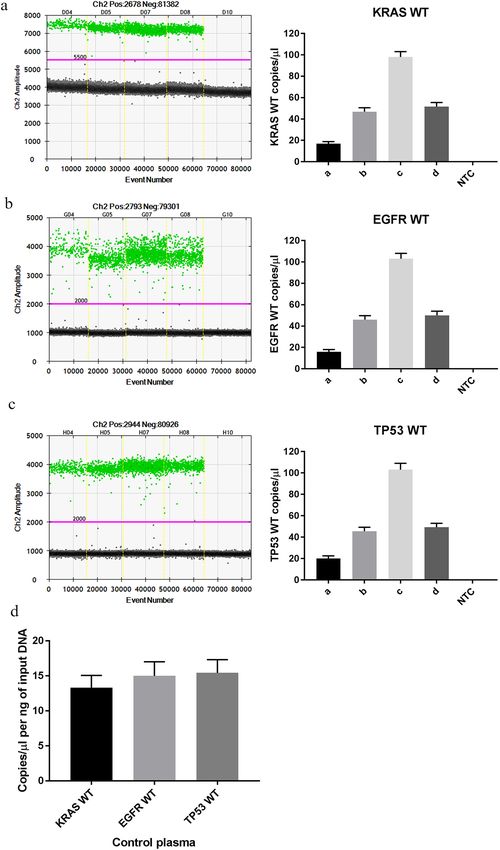
www.nature.com/scientificreports/
(Fig. 1b, Step 7) in the presence of 0.5% RNAase-free SDS, while vortexing vigorously for 30 s making sure the
pellet was completely dissolved (Fig. 1b, Step 9). The resulting lysate was then added to a DNA-specific column
designed to capture small fragments of circulating DNA. In this case, we chose DNA columns from the Plasma/
Serum Cell-Free Circulating DNA purification kit (Norgen Biotek). After centrifugation at 3300× g for 30 s the
flow-through from the DNA column was collected for recovery of RNA and protein, whereas the Vn96-EV DNA
retained on the column was further processed following the manufacturer’s protocol (Fig. 1b, Step 10). The flow-
through from the DNA column was then used to isolate RNA and protein. RNA was isolated following the acid
phenol/chloroform extraction protocol described for Total RNA in the miRVana kit (Fig. 1b, Steps 11–13). The
organic fraction from the acid phenol/chloroform extraction was used to extract protein using an acetone pre-
cipitation method (16; Fig. 1b, Step 14). Briefly, the organic fraction was stored at − 20 °C in 2.5 times the volume
of ice-cold acetone overnight to precipitate proteins, followed by centrifugation for 10 min at 14,000 × g and the
supernatant was discarded. Protein pellets were washed once in ice-cold acetone and solubilized in a solution
containing 8 M Urea, 1% SDS, and 100 mM Tris–HCl (pH 8) at a ratio of 50 µL per mL of starting plasma and
then brief sonication at 50 °C. Since the added Vn96 peptide would contribute to the total amount of captured
protein (data not shown) we depleted the Vn96 peptide from the isolated protein samples by passing the sample
through a 3 kDa cut-off filter (MilliporeSigma) and buffer exchanged with 100 mM ammonium bicarbonate four
times (Fig. 1b, Step 15).
Quantification of DNA, RNA and protein. The amount of DNA isolated per mL of plasma was deter-
mined using the Taqman Copy Number RNase P Detection kit (ThermoFisher Scientific) adapted for use with
ddPCR and using a standard curve prepared from human genomic DNA to extrapolate sample DNA concentra-
tion. The amount of RNA isolated per mL of plasma was determined using Qubit microRNA assay kit (Ther-
moFisher Scientific). The resulting protein concentration was determined using a BCA Protein assay (Fisher
Scientific).
Nanoparticle tracking analysis (NTA). The size distribution and concentration of EVs purified from
plasma by UCF, scUCF, Vn96, ME buffer and Scr peptide (from Fig. 1a, Step 6ii) were measured using a
NanoSight NS300 equipped with a 405 nm laser (Malvern Panalytical Ltd.,United Kingdom) and analyzed using
Nanosight software (v3.2, https://www.malvernpanalytical.com/en/support/product-support/software/NanoS
ight-NTA-software-update-v3-2, accessed on 28/01/2021). Samples were prepared for NTA analysis by diluting
the stock material in particle-free water until the concentration was between 1 × 10⁸ and 1 × 10⁹ particles/mL and
six videos of 30 s were captured, analyzed with Gain = 512 and shutter at 1300, and averaged. At least two differ-
ent dilutions resulting in good correlation of the stock concentration (% coefficient of variance (%CV) < 25%)
were included in the analysis for each sample. Size distribution data was analyzed by normalizing the concentra-
tion of particles of different diameters with bin widths of 1 nm to the highest concentration observed within a
1 nm bin and then taking the average of each measurement. The average of each technical replicate (n = 2) was
averaged with each biological replicate (n = 3) and expressed as particles per mL of plasma ± standard error of
the mean (SEM).
Western blotting. Protein lysates obtained from EVs isolated by UCF, scUCF, Vn96, ME buffer and Scr
peptide (from Fig. 1a, Step 6ii) were separated by sodium dodecylsulfate polyacrylamide gel electrophoresis
(SDS-PAGE) and analyzed by Western blotting using the BioRad mini-gel system for canonical EV protein
markers as well as calnexin, an endoplasmic reticulum protein that is not localized in EVs. All antibodies were
supplied by Santa Cruz Biotechnology (Dallas, TX) except for antibodies to Flotillin-1 (Cell Signaling Technolo-
gies; cat # 18634S) and Calnexin (Abcam, cat # 22,595). Santa Cruz antibodies included CD63 (sc-5275), CD9
(sc-59140), and HSC70 (sc-7298). All primary antibodies were incubated overnight at 4 °C in 5% milk/PBS at
a dilution of 1:1,000, with the exception of HSC70 which was used at a dilution of 1:500. Goat anti-rabbit and
goat anti-mouse secondary antibodies were purchased from Jackson ImmunoResearch Inc. and used at 1:10,000.
Clarity Western ECL blotting substrate (Bio-Rad, Hercules, CA) was used for Western blot detection.
Transmission electron microscopy. Transmission electron microscopy (TEM) for the characterization
of EVs isolated from plasma was performed according to Ghosh et al. (2014). EVs were eluted from Vn96-EV
pellets by the addition of 100 µL of 2 M NaCl, followed by vigorous vortexing for 1 min and incubation on a
shaker plate at room temperature for 1 h. The tube was centrifuged at 17,000 × g for 15 min and the supernatant
containing the EVs was collected. Proteinase K (100 µg; Life Technologies) treatment was performed by adding
5 µL and incubating the tubes at 50 °C for 2 h and 24 h to remove residual Vn96. NaCl and Proteinase K were
removed by buffer exchange using 3 kDa spin-filters (Amicon Ultracel columns from Millipore). The desalted
EVs (in water) were deposited onto formvar/silicone monoxide-coated 200 mesh copper grids (Electron micros-
copy Sciences) for 10 min, followed by 2–3 washes with water. EVs were fixed with 3.7% formalin followed by
2 washes with water. The samples were contrasted with 2% Uranyl Acetate (w/v) to visualize. UCF EVs were
suspended in water and deposited onto grids as described above. All solutions were 0.1 µm filtered to avoid par-
ticulate deposits on the grids. The dried grids were viewed using JEOL 6400 electron microscope.
ddPCR: KRAS, EGFR, TP53. EV DNA (5.5 µL) was used to detect KRAS, EGFR and TP53 wildtype (WT)
genes using ddPCR. A probe for KRAS WT was developed in-house using lock-nucleic acid technology (For-
ward Primer: 5′-AACCTTATGTGTGACATGTTCT-3′; Reverse Primer: 5′-GATTCTGAATTAGCTGTATCG
TCAAG-3′; Probe: HEX-5′-AGCT + G + G + TG + GC-3′-IABkFQ). EGFR WT (assay Id: dHsaCP2000020) and
Scientific Reports | (2021) 11:8085 | https://doi.org/10.1038/s41598-021-87526-y 4
Vol:.(1234567890)www.nature.com/scientificreports/
TP53 WT (assay Id: dHsaCP2506903) assays were purchased from Bio-Rad. Resulting amplicon copies were
normalized to the amount of DNA (ng) input for each reaction.
Next‑generation small RNA sequencing (sRNAseq). RNA quality was assayed on Agilent Tape Sta-
tion 2200 using RNA HS screen tape assay. RNA (25 ng) was used to prepare a small RNA library using Clean Tag
Small RNA library kit (TriLink biotech) following manufacturer recommended conditions. Adapter ligated RNA
was reverse transcribed using Ion Torrent specific primer. cDNA was then amplified using Ion convert barcode
primers containing a unique index to allow libraries to be pooled during Ion Torrent sequencing (Life Technolo-
gies). Library quality control (QC) was assayed on Agilent Tape Station using D1000 screen tape. Equally-pooled
libraries (pmol) were clonally amplified onto Ion Sphere Particles (ISPs) supplied by Ion Pi HiQ OT2 kit. ISPs
were then loaded onto Ion PI chip and sequenced using Ion Torrent Proton Sequencer.
Bioinformatic analysis of sRNAseq. Raw reads from sRNAseq were processed with the Torrent Suite
Software (v5.4.0, https://www.thermofisher.com/ca/en/home/life-science/sequencing/next-generation-seque
ncing/ion-torrent-next-generation-sequencing-workfl ow/ion-torrent-next-generation-sequencing-data-analy
sis-workfl ow/ion-torrent-suite-software.html, accessed on 28/01/2021), which runs the Torrent Mapping Align-
ment Program (TMAP) using the human reference genome version GRCh37/hg19. The RNASeqAnalysis plugin
from the Torrent Suite Software (v5.4.0.2) was subsequently used to map the data with human miRBase 2017 and
generate read counts for each miRNA. Removal of adapter sequences and triage of reads 15 to 30 bp in length
were also performed using Cutadapt (v1.8.1)18 and Picard tools (release 1.113)19. Mapping was conducted with
Bowtie 2 (v2.2.5)20 and read counts were obtained with featureCounts (v1.4.6-p4)21. R statistical environment
(v3.4.1) was used to calculate the variance between the normalized read counts of miRNA with trimmed mean of
M-values (TMM) normalization m ethod22 of Bioconductor package edgeR (v3.18.1)23. The sRNAseq data have
been deposited in the NCBI Gene Expression Omnibus (GEO) under the accession number GSE133991 (https://
www.ncbi.nlm.nih.gov/geo/query/acc.cgi?acc=GSE133991).
Mass spectrometry (MS) analysis. The protein fraction (Fig. 1b, Step 15) was prepared for SDS-PAGE
fractionation by re-solubilizing samples in SDS-PAGE loading buffer [2% SDS (w/v), 50 mM Tris–HCl, 0.1%
bromophenol blue (w/v), 10% glycerol (v/v) and 100 mM dithiothreitol (DTT) (w/v)]. Samples (25 µg) were
processed on 4–20% pre-cast electrophoresis gels (Cedarlane, Burlington, ON), run for 2 h at 100 V, fixed with
50% methanol containing 5% acetic acid, stained with EZ-blue gel staining reagent (Sigma-Aldrich, Oakville,
ON) and de-stained overnight in deionized water. Each gel lane was excised into twelve equal sized bands which
were then treated with 10 mM DTT for reduction of disulfide bonds, followed by alkylation of cysteine residues
with 25 mM iodoacetic acid. Sequencing-grade trypsin (Promega, Madison, WI) was added (1 ug) to each gel
band to carry out protein digestion at 37 °C for 16 h. Following tryptic digestion, the supernatant was collected
and remaining gel-bound peptides were extracted three times using 50 µL aliquots of 50% acetonitrile con-
taining 5% acetic acid and pooled with the initial collection. The combined extract was then concentrated by
vacuum centrifuge and further processed using mini-spin filter cartridges (Canadian Life Sciences, Mississauga,
ON) containing C-18 resin for clean-up by solid-phase extraction. Upon completion of the sample loading and
wash steps on the C18 cartridge, peptides were eluted with 70% acetonitrile and concentrated again in a vacuum
centrifuge. The samples were then reconstituted to a volume of 50 µL containing 1% aqueous acetic acid and
stored at − 80 °C. Analyses of tryptic digests for bottom-up protein identification were performed by nanoLC-
MS/MS using a Proxeon Easy Nano-LC II interfaced to a Quadrupole Orbitrap (Q-Exactive, Thermo-Fisher
Scientific, San Jose, CA) mass spectrometer. A volume of 5 µL of each sample was injected onto a narrow bore
(100 µm inner diameter (i.d.) × 20 mm long) C-18 pre-column packed with 5 µm Reprosil-Pur resin (Thermo-
Fisher Scientific, San Jose, CA). Chromatographic separation was achieved on a Thermo-Scientific Easy C18
analytical column with dimensions of 75 µm i.d. and 100 mm long. The gradient LC elution began with 95%
solvent A (0.1% aqueous formic acid) 5% solvent B (0.1% formic acid, 10% water and 90% acetonitrile) which
was increased linearly to 35% solvent B over 60 min followed by 90% solvent B for 10 min and re-equilibrated
to 95% solvent A for 10 min. The LC flow rate was held at a constant value of 300 nL/min. All solvents were of
LC–MS grade from VWR (Mississauga, ON). The 15 µm i.d. electrospray (ESI) emitter of the Q-Exactive was
biased between 1.6 and 1.9 kV and was positioned approximately 2 mm from the heated (250 °C) ion transfer
capillary. The S-lens of the mass spectrometer was maintained at 100 V. The Orbitrap mass analyzer was cali-
brated in positive ion mode at 70 k resolution every three days using Thermo LTQ-VELOS positive calibration
solution (Thermo-Fisher). Mass spectrometric data was acquired in “data dependent acquisition” (DDA) mode
whereby a full mass scan from 400 to 1200 Thomsons (Th) was followed by the acquisition of fragmentation
spectra of the ten most abundant precursor ions with full-scan intensities greater than a threshold of 60,000.
Precursor ion spectra (i.e., full scan) were collected at a resolution of 70 k (@ 200 amu) and a target value of 1 E6.
Peptide fragmentation was performed at 27 eV within the high energy collision induced dissociation (HCD)
collision cell. The subsequent MS/MS spectra were collected in the Orbitrap analyzer at a resolution setting of
17.5 k and target value of 1 E5. The m/z values of the selected peptide precursor ions were placed on a dynamic
exclusion list for a period of 40 s to maximize the number of fragmentation spectra collected for unique peptides.
Each excised band (12) was analyzed by MS in triplicate (MS experimental replicate) for each donor (4) sample
to yield a total of 144 raw data files.
Raw data files from the mass spectrometer were searched against the Swissprot Homo sapiens database (ver-
sion July 2017, 13,081 entries) accessed from ‘The Universal Protein Resource’ (www.uniprot.org). The searches
were completed by using Proteome Discoverer 2.0 (Thermo-Fisher Scientific, San Jose, CA) employing the
Sequest HT algorithm. Searches were performed using the following settings: 2 allowed missed cleavage sites,
Scientific Reports | (2021) 11:8085 | https://doi.org/10.1038/s41598-021-87526-y 5
Vol.:(0123456789)www.nature.com/scientificreports/
10 ppm precursor mass tolerance and 0.8 Da fragment mass tolerance, dynamic modifications of methionine
oxidation (+ 15.99 Da) and N-terminal acetylation (+ 42.01 Da) as well as a static modification of cysteine car-
boxymethylation (+ 58.005 Da). Proteome discoverer used the Percolator algorithm to calculate a false discovery
rate (FDR) of 0.1% based on the results of a decoy (reversed) database search. The common set of proteins from
the three MS experimental replicates were prepared for each donor sample and used for analysis. REVIGO was
used for gene ontology and a web-based tool (http://bioinformatics.psb.ugent.be/webtools/Venn/, accessed on
28/01/2021) was used to prepare Venn d iagrams24. All raw data files, search files and database files have been
uploaded and made publicly available on the Mass Spectrometry Interactive Virtual Environment (MassIVE,
www.massive.ucsd.edu) and assigned a ProteomeXchange ID of PXD015204.
Statistical analysis. Statistical significance was determined by t-test analysis for particle numbers from
NTA data. A p-value less than 0.05 is considered statistically significant. Single-parametric (SP) and multipara-
metric (MP) miRNA abundance were compared and analyzed by a linear regression model.
Results
Optimization of Vn96‑mediated isolation from plasma samples. The utility of the Vn96 synthetic
peptide to isolate EVs from numerous biological fluids has been previously demonstrated14; moreover, Vn96 has
recently been shown to co-isolate cfDNA along with EVs from biofluids15. We now describe the development of
a multiparametric extraction protocol for use with EVs and cfDNA isolated from healthy donor plasma using
the Vn96 peptide.
We first characterized the EVs isolated from plasma using the Vn96 peptide and compared them to EVs
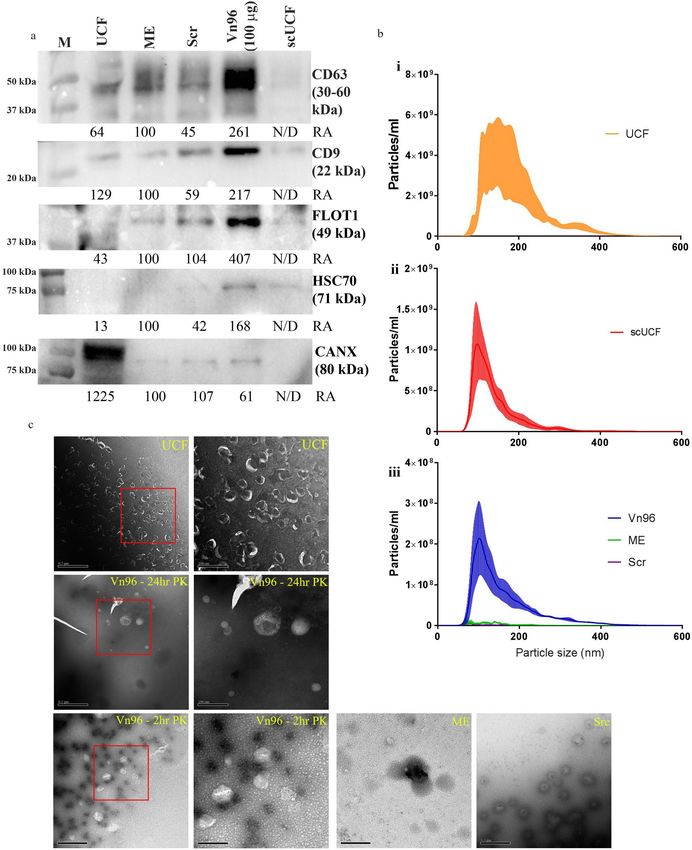
isolated using ultracentrifugation methods. Figure 2a shows a representative Western blot (n = 3) in which EVs
isolated from healthy human plasma were examined for the presence of canonical EV markers (CD63, CD9,
Flotillin1, and HSC70). UCF, Vn96 (100 µg), Scr (scrambled control peptide, 100 µg) and ME (buffer control for
peptide-mediated capture) were used to isolate EVs from 1 mL of plasma; 2 mL of plasma was used for scUCF
isolation of EVs. The same healthy human plasma was used for each isolation method in order to reduce biologi-
cal variability and to enable direct comparison of EVs markers. Calnexin (CANX), which is not found in EVs, but
ebris25, was included as a control for non-EV material. CD63, CD9 and Flotillin-1 (FLOT1)
in cells and cellular d
were detected for all EV isolation methods (UCF, Vn96, and scUCF), albeit at a much lower amount in scUCF.
The Vn96 synthetic peptide isolated more of these three canonical EV protein markers when compared to UCF,
scUCF, Scr, and ME buffer, suggesting a better yield of EVs from plasma using Vn96-based isolation than either
UCF or scUCF isolation methods. HSC70 was only significantly detected in Vn96- and scUCF -isolated EVs,
consistent with the affinity of Vn96 for heat-shock proteins and heat-shock protein-associated E Vs14. Surprisingly,
CANX was detected in all samples except scUCF, indicating the potential co-isolation of large EVs, apoptotic
bodies, or aggregated protein complexes26 by the 100,000 × g UCF and the 17,000 × g centrifugation steps required
for Vn96-mediated isolation. The presence of co-precipitating protein is likely due to the lack of a plasma pre-
clearing step to remove co-sedimenting material prior to EV isolation. Since CD63, CD9, FLOT1 and HSC70 are
enriched in Vn96 samples compared to ME and Scr samples, these findings suggest that Vn96 does not merely
sediment circulating proteins at 17,000 × g under these conditions, but rather enriches for these EV-specific
proteins. Recent publications have also demonstrated co-isolation of lipoproteins (ApoB and ApoA1) with both
UCF and Vn9615,27, suggesting that the proteomic profile of material isolated by Vn96 may be similar to UCF.
We further characterized the concentration and size distribution (Table 2 and Fig. 2b) of particles isolated
by UCF, scUCF and Vn96 using nanoparticle tracking analysis (NTA). There were no statistically significant
differences between the isolation methods (UCF, scUCF and Vn96); however, there were statistically significant
differences among Vn96 and the ME buffer and Scr controls (*P < 0.05, n = 3). As shown in Fig. 2b there were
differences observed in the size distribution of particles for each isolation method. UCF isolated a heterogene-
ous population of particles, with the majority of particles ranging between ~ 100 and 300 nm, whereas scUCF
isolated a more homogeneous population of particles with a peak size of ~ 100 nm. Vn96 isolated a homogene-
ous population of particles with a peak size of ~ 100 nm that was similar to scUCF, but with a slightly wider size
distribution that includes a population of particles slightly larger than those isolated by scUCF.
Lastly, we performed transmission electron microscopy (TEM) on the EVs captured by UCF, Vn96, ME buffer
and Scr peptide. In order to visualize EVs captured by Vn96, isolated EVs were treated with proteinase K for 2 h
and 24 h to digest residual Vn96, as we have previously shown that visualizing EVs isolated with Vn96 by TEM
is not possible without proteinase K t reatment14. As shown in Fig. 2c, the typical double membrane structure of
EVs is found in the material isolated by UCF and Vn96; however, no discernable EVs were identified in the ME
buffer and Scr peptide samples.
Together, these results suggest that Vn96 isolates a population of EVs with a size distribution that reflects the
presence of EVs and is enriched for canonical EV protein markers such as CD63, CD9, Flotillin1, and HSC70.
We have therefore re-confirmed that the Vn96 peptide efficiently isolates EVs and that it can be reliably used
with samples of human plasma, which can be used for downstream liquid biopsy tests. Since the ultracentrifuga-
tion methods for EV isolation are not amenable to a clinical setting due to the time and specialized equipment
required, we further investigated yields of potential biomarker material for clinical diagnostics that are obtained
by Vn96-mediated EV isolation.
Development of a multiparametric extraction method for Vn96‑isolated EVs and cfDNA. The
majority of liquid biopsy tests rely on a single parameter; however, the same disease may have tests that assay
multiple parameters. For example, liquid biopsy tests for colorectal cancer have been developed for DNA (evalu-
ating Sept9 methylation) and protein (abundance of CEA), and new assays have been suggested that examine
Scientific Reports | (2021) 11:8085 | https://doi.org/10.1038/s41598-021-87526-y 6
Vol:.(1234567890)www.nature.com/scientificreports/
Figure 2. Characterization of plasma EVs isolated by UCF, scUCF and Vn96 methods, all from the same donor
plasma (n = 3). (a) Representative Western blot comparing different EV isolation methods probing for canonical
EV markers: CD63 (65 kDa), CD9 (24 kDa), FLOT1 (50 kDa), HSC70 (73 kDa), and cytoplasmic marker CANX
(75 kDa). Mean relative abundance (RA) for three experiments is indicated below each Western blot (ME is set
at 100). Full-length blots and all biological replicates are presented in Supplementary Fig. 3. (b) NTA results
showing the number of particles ± SEM per mL of starting plasma on the y-axis plotted against the size (nm) of
particles on the x-axis from UCF (i), scUCF (ii), and Vn96 with appropriate controls (iii). (c) Representative TEM
images of EVs captured by UCF, Vn96 (2 h and 24 h post proteinase K treatment), ME buffer and Scr peptide.
Scientific Reports | (2021) 11:8085 | https://doi.org/10.1038/s41598-021-87526-y 7
Vol.:(0123456789)www.nature.com/scientificreports/
Capture method Number of particles ± SEM (particles/mL of plasma) Mean size ± SEM (nm) Mode size ± SEM (nm)
UCF (n = 3) 5.58 ± 2.15 × 10¹³ 185 ± 16 151 ± 22
scUCF (n = 3) 7.71 ± 2.14 × 10¹² 138 ± 14 99 ± 5
Vn96 (n = 3) 2.04 ± 0.53 × 10¹² 173 ± 23 108 ± 10
ME (n = 3) 9.01 ± 3.06 × 1010* 138 ± 12 108 ± 16
Scr (n = 3) 3.69 ± 1.45 × 1010* 124 ± 7 82 ± 6
Table 2. NTA using multiple EV capture methods. *P < 0.05.
Figure 3. (a) Plasma (1 mL) from 9 healthy donors was subjected to centrifugation at 16, 000 × g for 10 min
(squares) or not (circles) prior to the addition of Vn96 (100 µg) for EV isolation. DNA was extracted using the
Qiagen Circulating Nucleic Acid Kit (Qiagen, cat # 55,114) and quantified with ddPCR using an RNASE P
TaqMan Assay. (b) DNA, RNA and protein yields per mL of starting plasma. Yields of DNA and RNA (ng) on
the left y-axis and protein (µg) on the right y-axis ± SEM per mL of starting plasma (n = 4).
small RNA28–30. Separately these assays demonstrate good sensitivity and specificity; however, very few of these
assays have been combined into a single assay format that analyzes multiple parameters from the same starting
material, which could lead to gains in both sensitivity and specificity. In order to facilitate the multiplexing of
biomarker analyses for different parameters, we chose to develop and characterize a multiparametric extrac-
tion protocol to isolate DNA, RNA and protein from the same liquid biopsy sample processed with the Vn96
synthetic peptide (Fig. 1b). It is important to note that Vn96 is able to capture not only DNA associated with
EVs, but also c fDNA15. We confirmed this property of Vn96 as we are able to recover non-vesicular DNA from
EV-depleted plasma that had been supplemented with a synthetic gene fragment (Figure S1); therefore, Vn96
can effectively capture all DNA from a biofluid sample, rendering the Vn96 isolation method more applicable for
biomarker analyses beyond a straight-forward EV isolation method. For this reason we have chosen to pursue
our multiparametric extraction protocol development for liquid biopsy by employing the Vn96 peptide for EV
and cfDNA isolation.
Quantification of EV cargoes obtained using the multiparametric extraction method. We first
chose to determine the amount of nucleic acid and protein cargo extracted from Vn96-isolated EVs using the
multiparametric extraction method. There is currently no consensus from commercial suppliers of EV isola-
tion kits or the EV community for conditions used for pre-clearing of plasma s amples31–33. We tested whether
pre-clearing the plasma at 16,000× g would affect Vn96-DNA recovery. As shown in Fig. 3a, in 4 out of 9 donors
(A-D) pre-clearing at 16,000× g caused a reduction in Vn96-DNA recovery, while in 5 out of 9 donors (E-I) pre-
clearing had no effect. Based on these results we decided to omit a pre-clearing step. Figure 3b shows the amount
of nucleic acid (DNA and RNA) and protein extracted from EVs isolated with the Vn96 synthetic peptide from
Scientific Reports | (2021) 11:8085 | https://doi.org/10.1038/s41598-021-87526-y 8
Vol:.(1234567890)www.nature.com/scientificreports/
1 mL of plasma (n = 4). We also determined the percent coefficient of variance for the yield of DNA (16.5%) and
RNA (20%) from 3 technical replicates in order to assess the precision of the method. These data demonstrate
that by using Vn96 combined with our multiparametric extraction method we are able to reproducibly isolate
appreciable amounts of DNA (10.8 ± 1.39 ng), RNA (16.8 ± 1.07 ng) and protein (209 ± 15.2 µg) from 1 mL of
plasma (n = 4) that provide sufficient material for downstream analyses.
Downstream analyses of EVs cargoes isolated by the multiparametric extraction
method. DNA, RNA and protein extracted from Vn96-isolated EVs and cfDNA using the multiparametric
extraction method were subsequently used for ddPCR detection for wildtype KRAS, EGFR and TP53 genes,
small RNA sequencing (sRNAseq), and mass spectrometry, respectively. Figure 4 shows the detection of KRAS
WT (a), EGFR WT (b) and TP53 WT (c). When normalized to the amount of DNA input (ng) for each ddPCR
reaction the number of copies detected for KRAS WT, EGFR WT, and TP53 WT are in concordance, indicating
that plasma may contain unbiased genome coverage of DNA, as suggested p reviously34. These results dem-
onstrate that the DNA (EV DNA and cfDNA) isolated via our multiparametric extraction method contains
clinically-relevant material.
Numerous reports have used next-generation sequencing platforms to demonstrate the potential of EV
RNA as a source of candidate biomarkers for the detection, prognosis and monitoring of treatment response
for cancer35–37. As shown in Fig. 5, the RNA (n = 4) extracted from Vn96-isolated EVs via our multiparamet-
ric extraction method was used for sRNAseq. Total reads per sample were 16,419,954 ± 1,862,233, of which
12,452,808 ± 1,883,370 reads passed Ion torrent trimming and filtering. Figure 5a shows the average read lengths
for the cDNA library generated from the EV RNA. A major peak between 21 and 23 bp and a minor peak between
31 and 32 bp were detected, which are typical for small RNA, such as miRNA. The percentage of mapped reads
to reads passing filters was 78% ± 4% demonstrating that the RNA extracted from the Vn96-isolated EVs using
our multiparametric method consists of bona fide RNA species. As shown in Fig. 5b, almost half of the mapped
reads were miRNA (47.1%), followed by “other” small RNA species (non-intergenic lncRNA, antisense RNA,
etc.; 35.02%), mRNA (10.52%), piRNA (2.67%), tRNA (1.77%), rRNA (1.19%), pseudogenes (0.78%), lincRNA
(0.66%), snRNA (0.17%) and snoRNA (0.13%).
In order to test whether our multiparametric extraction method affects the isolation of specific RNA species
we also performed sRNAseq on RNA extracted from Vn96-isolated EVs from the same donor plasma using a
single-parametric extraction method, namely the miRVana miRNA isolation (total RNA) kit. No statistically
significant differences were detected for the total reads, reads passing filters, percentage of mapped aligned reads,
and the percentage species of small RNA between multiparametric (MP) and single-parametric (SP) extraction
methods. Lastly, the abundance of each miRNA detected in MP versus SP was also not statistically different, as
shown in the log2 of abundance scatter plots depicted in Fig. 5c. The average R2 was 0.9303 ± 0.0119 (n = 4). These
data indicate that capturing DNA on the Norgen Biotek Plasma/Serum Cell-Free Circulating DNA column does
not affect downstream small RNA sequencing, and that use of the multiparametric extraction method does not
deplete the sample of any potential small RNA biomarkers.
In an attempt to identify potential miRNA normalizers for Vn96-isolated EV RNA we analyzed the variance
of individual miRNAs among donors and identified ten miRNAs that had the least variation with respect to
abundance amongst the four individual donors (Fig. 5d). Interestingly, we identified hsa-miR-25-3p, hsa-miR-
3074-5p and hsa-miR-24-1-3p as having the lowest variance amongst the different donors as well as moderate
abundance (Fig. 5d). Lastly, as shown in Fig. 5e, the vast majority of the aligned miRNA we identified in the
EVs isolated from donor plasma belonged to the hsa-miR-486 family, which represented ~ 40% of the aligned
miRNA reads. Some additional notable top 36 abundant miRNAs identified are those that have been suggested
to be EV-specific38, including the hsa-miR-let-7a family and hsa-miR-146b-5p. In addition, we tested whether
specific miRNA are protected in EVs by treating the Vn96-EV pellet with RNAse A prior to multiparametric
extraction, following previously published protocols39,40. As shown in Supplementary Fig. 4, miR-16 and let-7b-5p
are protected in EVs from RNAse A treatment.
Mass spectrometry (MS) is one technique used to enable the discovery of new protein biomarkers and has
recently been used as a platform to analyze Vn96-isolated EVs from cell culture media and u rine16,41,42. Protein
(25 ug) was extracted using our multiparametric protocol from Vn96-isolated EVs from 4 donor plasma samples
and subjected to MS analysis; each plasma sample was analyzed in triplicate and the common set of proteins from
the three MS experimental replicates was compiled for analysis (Fig. 6; Table S1). The average number of proteins
identified by MS from all 4 Vn96-EV samples was 310 ± 43 (Donors: a = 276, b = 220, c = 325 and d = 421). As
shown in Fig. 6a, we generated a 4-way Venn diagram in order to demonstrate the differences and commonali-
ties among the 4 plasma-EV samples. A common core set of 161 proteins from a total of 348 unique proteins,
representing ~ 46% commonality, was identified in the samples. Validation by Western blotting of two proteins
identified by MS is shown in supplemental data (Figure S2). Interestingly, we detected a significant number of
proteins that are exclusive to each sample, demonstrating the potential biological variability among individuals
for a plasma EV protein analysis. As such, donors a through d had 24, 8, 46, and 109 unique Vn96-isolated EV
proteins, respectively.
Next we analyzed the common core set of 161 proteins by gene ontology in order to classify the proteins into
their biological processes (b) and cell component (c). Not surprisingly, the proteins identified were assigned
biological processes most commonly found in blood, including protein activation cascade (31%), coagulation
(16%), platelet degranulation (16%), and acute inflammatory response (14%), among others (Fig. 6b). In addi-
tion, the proteins identified fell mainly into two cell components, which were cytoplasmic vesicle lumen (45%)
and blood microparticle (41%), thereby providing further evidence of the ability of Vn96 to isolate EVs (Fig. 6c).
Lastly, we compared our common core set of proteins using PantherDB (http://geneontology.org, accessed on
Scientific Reports | (2021) 11:8085 | https://doi.org/10.1038/s41598-021-87526-y 9
Vol.:(0123456789)www.nature.com/scientificreports/
Figure 4. ddPCR analysis of DNA extracted from Vn96-isolated EVs from control patient plasma (n = 4).
(a) KRAS WT ddPCR amplitude vs event number graph (left) and resulting KRAS WT copies ± Poisson
confidence min and max for each control patient. Images were generated from BioRad QuantaSoft software
(v1.7.4, https://www.bio-rad.com/en-ca/sku/1864011-quantasoft-software-regulatory-edition?ID=1864011,
accessed on 28/01/2021). (b) EGFR WT ddPCR amplitude vs event number graph (left) and resulting EGFR
WT copies ± Poisson confidence min and max for each control patient. (c) TP53 WT ddPCR amplitude vs event
number graph (left) and resulting TP53 WT copies ± Poisson confidence min and max for each control patient.
(d) Average normalized to DNA input copies ± SEM for KRAS WT, EGFR WT and TP53 WT (n = 4).
Scientific Reports | (2021) 11:8085 | https://doi.org/10.1038/s41598-021-87526-y 10
Vol:.(1234567890)www.nature.com/scientificreports/
Figure 5. Small RNA sequencing (sRNAseq) results for RNA extracted from Vn96-isolated plasma EVs
(n = 4). (a) Average number of reads ± SEM versus read length (bp). (b) Distribution of sRNA species in Vn96-
isolated plasma EVs. (c) Regression plot of each patient miRNA result extracted by single parametric (SP)
versus multiparametric (MP). (d) Top ten lowest variant miRNA (top) compared to their % of total miRNA
abundance ± SEM (bottom). (e) Top 36 abundant miRNA expressed as % of total miRNA abundance ± SEM.
Scientific Reports | (2021) 11:8085 | https://doi.org/10.1038/s41598-021-87526-y 11
Vol.:(0123456789)www.nature.com/scientificreports/
Figure 6. Mass spectrometry results for proteins extracted from Vn96-isolated plasma EVs (n = 4). (a) Venn
diagram demonstrating the overlap of proteins from each patient. A web-based tool was used to generate Venn
diagrams (http://bioinformatics.psb.ugent.be/webtools/Venn/, accessed on 28/01/2021). Gene ontology analysis
categorized by biological process (b) and cell component (c). Revigo web-based tool was used to generate
figures. 24
Scientific Reports | (2021) 11:8085 | https://doi.org/10.1038/s41598-021-87526-y 12
Vol:.(1234567890)www.nature.com/scientificreports/
28/01/2021) to identify cellular components and found that 112 out of our 161 proteins are associated with
“Extracellular Exosome” (p = 4.54E-75).
Together, our analyses of DNA, RNA, and protein obtained from Vn96-isolated EVs and cfDNA using our
multiparametric extraction method demonstrate that this material is amenable to downstream biomarker analy-
sis using standard methods, such as ddPCR, small RNA sequencing, and mass spectrometry, and provides an
opportunity to perform multi-omic analyses from the same limited sample.
Discussion
The Vn96 synthetic peptide has been recognized as an excellent technology for EV isolation from biofluids
because it does not require specialized equipment, is time efficient, and captures biomaterial (DNA, RNA and
protein) that is amenable to biomarker analyses. Additionally, Vn96 is able to co-isolate cfDNA from biofluids15,
providing additional value of this method over other EV isolation methods for circulating biomarker analyses.
We now report the development of a streamlined and simplified workflow for Vn96 peptide-mediated isolation
of EVs and cfDNA from plasma. We demonstrate that the Vn96 peptide efficiently isolates plasma EVs that have
characteristic EV protein markers, such as CD63, CD9, Flotillin1, and HSC70. We also demonstrate that the
size of EVs isolated with Vn96 is homogeneous in comparison to UCF and is similar to the EV size obtained
by scUCF. Using this new workflow for Vn96-mediated EV and cfDNA isolation from plasma, we developed
a multiparametric extraction protocol to sequentially extract DNA, RNA and protein from the same isolated
material for subsequent clinically-relevant biomarker analysis (ddPCR) and multi-omic analyses (sRNAseq and
MS). As biomarker analysis studies frequently employ the analysis of a single type of biomarker (DNA, RNA
or protein), our multiparametic extraction protocol represents an advance for efficient biomarker analysis that
conserves valuable patient samples, and provides a means to assay multiple types of biomarkers (DNA, RNA and
protein) from the same starting material to enable a comprehensive analysis of molecular changes in a disease.
EVs have gained significant attention as a material for liquid biopsy tests43,44. Indeed, several EV-specific
diagnostic biomarkers are now in development for a variety of diseases45,46. Despite the recognition that EVs
contain all types of parameters for biomarker detection (e.g. DNA, RNA, protein), their use in diagnostic tests
has been hindered by a lack of clinically-amenable methods to isolate EVs from biofluids, such as plasma. We
have previously demonstrated that the protocol used to isolate EVs with the Vn96 synthetic peptide can be
adapted for use in diagnostics labs with minimal requirements for specialized equipment or unacceptably long
timeframes14. We have now optimized our method for Vn96-mediated EV isolation from patient plasma and
show that Vn96 efficiently isolates a broad spectrum of EVs from plasma (Fig. 2), thereby providing a rich start-
ing material for biomarker analyses.
A comprehensive analysis of biomarkers found in the multiple types of material harboured by EVs could
provide improvements in the specificity and sensitivity of disease detection via biomarkers. For example, a DNA
mutation analysis may not detect any therapeutically-relevant mutations in a cancer patient’s circulating tumour
DNA (ctDNA), whereas such a patient may have a miRNA expression signature that indicates disease presence.
An analysis of both the DNA and RNA contained in the same EV population could permit a comprehensive
molecular analysis to detect disease markers that a single parametric approach may miss. An added feature of
the Vn96 synthetic peptide is its ability to co-isolate both EVs and cfDNA from biofluids (15; Figure S1), such
as plasma, providing a rich source for DNA mutation detection. With this in mind, we sought to develop a
multiparametric extraction method for Vn96-isolated material that (1) conserves the amount of patient plasma
used for diagnostic assays by making efficient use of the isolated material, (2) streamlines the time and effort
required to obtain each type of analyte for biomarker analysis, (3) utilizes a protocol that can be adapted to a
clinical diagnostics lab environment and (4) maximizes the amount of molecular ‘omic data from EVs and cfDNA
to enable multi-omic profiling. Conservation of the amount of plasma utilized is an important consideration
for biomarker discovery studies that make use of biobank samples, where only small amounts of plasma may
be available for analysis. An efficient use of the isolated material is important because despite the efficiency of
EV and cfDNA isolation using the Vn96 peptide, there is a finite amount of material available for downstream
analyses. Separate workflows for the isolation of plasma DNA, RNA and protein increase the time and effort
required to generate material for biomarker analysis and slows the pace of discovery and/or biomarker testing.
Finally, to have an impact on patient care the method must be adaptable to a clinical diagnostic laboratory set-
ting. Moreover, a growing trend in the field of biomarker discovery is the use of machine learning and artificial
intelligence algorithms in order to better diagnose and/or predict complex diseases, such as cancer. This type of
approach is enabled by a great number patient samples (n) and improved by the complexity of the data associated
with each patient (e.g. multi-omic datasets).
Our multiparametric extraction protocol achieves the above-listed goals by (1) requiring only 1–4 mL of
patient plasma, (2) permitting sequential extraction of DNA, RNA, and protein with minimal handling from
the same EV and cfDNA isolation, (3) using methods that can be performed in a clinical diagnostics laboratory,
and (4) providing material that is amenable to multi-omic analyses.
We believe the workflow we have developed for Vn96-isolated EV and cfDNA analyses is an important step
toward the fulsome deployment of EV-based diagnostic and prognostic assays in a clinical lab setting. Future
investigations using our EV and cfDNA isolation and extraction protocols will determine whether multipara-
metric biomarker analyses of EV cargoes can improve the sensitivity and specificity of biomarkers for disease
detection.
Received: 25 June 2020; Accepted: 22 March 2021
Scientific Reports | (2021) 11:8085 | https://doi.org/10.1038/s41598-021-87526-y 13
Vol.:(0123456789)www.nature.com/scientificreports/
References
1. Bedard, P. L., Hansen, A. R., Ratain, M. J. & Siu, L. L. Tumour heterogeneity in the clinic. Nature 501, 355–364 (2013).
2. Lorenz, J. & Blum, M. Complications of percutaneous chest biopsy. Semin. Interv. Radiol. 23, 188–193 (2006).
3. Hofman, P. The challenges of evaluating predictive biomarkers using small biopsy tissue samples and liquid biopsies from non-
small cell lung cancer patients. J. Thorac. Dis. 11, S57–S64 (2019).
4. Hofman, P. & Popper, H. H. Pathologists and liquid biopsies: to be or not to be?. Virchows Arch. 469, 601–609 (2016).
5. Andree, K. C., van Dalum, G. & Terstappen, L. W. M. M. Challenges in circulating tumor cell detection by the Cell Search system.
Mol. Oncol. 10, 395–407 (2016).
6. Mohan, S., Chemi, F. & Brady, G. Challenges and unanswered questions for the next decade of circulating tumour cell research in
lung cancer. Transl. Lung Cancer Res. 6, 454–472 (2017).
7. Xu, R. et al. Extracellular vesicles in cancer: implications for future improvements in cancer care. Nat. Rev. Clin. Oncol. 15, 617–638
(2018).
8. D’Souza-Schorey Crislyn, C. & Clancy, J. W. Tumor-derived microvesicles: Shedding light on novel microenvironment modulators
and prospective cancer biomarkers. Genes Dev. 26, 1287–1299 (2012).
9. Beckler, M. D. et al. Proteomic analysis of exosomes from mutant KRAS colon cancer cells identifies intercellular transfer of mutant
KRAS. Mol. Cell. Proteom. 12, 343–355 (2013).
10. Kalra, H. et al. Extracellular vesicles containing oncogenic mutant β-catenin activate Wnt signalling pathway in the recipient cells.
J. Extracell. Vesicles 8, 1690217 (2019).
11. Cappello, F. et al. Exosome levels in human body fluids: a tumor marker by themselves?. Eur. J. Pharm. Sci. 96, 93–98 (2017).
12. Xue, V. W., Wong, C. S. C. & Cho, W. C. S. Early detection and monitoring of cancer in liquid biopsy: advances and challenges.
Expert Rev. Mol. Diagn. 19, 273–276 (2019).
13. Cohen, J. D. et al. Detection and localization of surgically resectable cancers with a multi-analyte blood test. Science 359, 926–930
(2018).
14. Ghosh, A. et al. Rapid isolation of extracellular vesicles from cell culture and biological fluids using a synthetic peptide with specific
affinity for heat shock proteins. PLoS ONE 9, e110443 (2014).
15. Zocco, D. et al. Isolation of extracellular vesicles improves the detection of mutant DNA from plasma of metastatic melanoma
patients. Sci. Rep. 10, 1–2 (2020).
16. Joy, A. P. et al. Proteome profiling of extracellular vesicles captured with the affinity peptide Vn96: comparison of Laemmli and
TRIzol© protein-extraction methods. J. Extracell. Vesicles 7, 1438727 (2018).
17. Kozomara, A. & Griffiths-Jones, S. MiRBase: integrating microRNA annotation and deep-sequencing data. Nucl. Acids Res. 39,
D155–D162 (2011).
18. Martin, M. Cutadapt removes adapter sequences from high-throughput sequencing reads. EMBnet. J. 17, 10 (2011).
19. Wysoker, A., Tibbetts, K. & Fennell, T. Picard tools version 1.113. http://picard.sourceforge.net. (2014).
20. Langmead, B. & Salzberg, S. L. Fast gapped-read alignment with Bowtie 2. Nat. Methods 9, 357–359 (2012).
21. Liao, Y., Smyth, G. K. & Shi, W. FeatureCounts: an efficient general purpose program for assigning sequence reads to genomic
features. Bioinformatics 30, 923–930 (2014).
22. Robinson, M. D. & Oshlack, A. A scaling normalization method for differential expression analysis of RNA-seq data. Genome Biol.
11, R25 (2010).
23. Robinson, M. D., McCarthy, D. J. & Smyth, G. K. edgeR: a Bioconductor package for differential expression analysis of digital gene
expression data. Bioinformatics 26, 139–140 (2009).
24. Supek, F., Bošnjak, M., Škunca, N. & Šmuc, T. Revigo summarizes and visualizes long lists of gene ontology terms. PLoS ONE 6,
e21800 (2011).
25. Lötvall, J. et al. Minimal experimental requirements for definition of extracellular vesicles and their functions: a position statement
from the International Society for Extracellular Vesicles. J. Extracell. Vesicles 3, 26913 (2014).
26. Théry, C., Amigorena, S., Raposo, G. & Clayton, A. Isolation and characterization of exosomes from cell culture supernatants and
biological fluids. Curr. Protoc. Cell Biol. 30, 3.22.1-3.22.29 (2006).
27. Askeland, A. et al. Mass-spectrometry based proteome comparison of extracellular vesicle isolation methods: comparison of ME-
kit, size-exclusion chromatography, and high-speed centrifugation. Biomedicines 8, 246 (2020).
28. Song, L.-L. & Li, Y.-M. Current noninvasive tests for colorectal cancer screening: an overview of colorectal cancer screening tests.
World J. Gastrointest. Oncol. 8, 793 (2016).
29. Zheng, Y., Zhou, J. & Tong, Y. Gene signatures of drug resistance predict patient survival in colorectal cancer. Pharmacogenomics
J. 15, 135–143 (2015).
30. Zekri, A. R. N. et al. Circulating serum miRNAs as diagnostic markers for colorectal cancer. PLoS ONE 11, e0154130 (2016).
31. Bæk, R., Søndergaard, E. K. L., Varming, K. & Jørgensen, M. M. The impact of various preanalytical treatments on the phenotype
of small extracellular vesicles in blood analyzed by protein microarray. J. Immunol. Methods 438, 11–20 (2016).
32. Théry, C. et al. Minimal information for studies of extracellular vesicles 2018 (MISEV2018): a position statement of the Interna-
tional Society for Extracellular Vesicles and update of the MISEV2014 guidelines. J. Extracell. Vesicles 7, 1535750 (2018).
33. Venturella, M., Carpi, F. M. & Zocco, D. Standardization of blood collection and processing for the diagnostic use of extracellular
vesicles. Curr. Pathobiol. Rep. 7, 1–8 (2019).
34. Thakur, B. K. et al. Double-stranded DNA in exosomes: a novel biomarker in cancer detection. Cell Res. 24, 766–769 (2014).
35. Giraldez, M. D. et al. Comprehensive multi-center assessment of small RNA-seq methods for quantitative miRNA profiling. Nat.
Biotechnol. 36, 746–757 (2018).
36. Roychowdhury, S. & Chinnaiyan, A. M. Translating cancer genomes and transcriptomes for precision oncology. CA. Cancer J.
Clin. 66, 75–88 (2016).
37. Yuan, T. et al. Plasma extracellular RNA profiles in healthy and cancer patients. Sci. Rep. 6, 19413 (2016).
38. Arroyo, J. D. et al. Argonaute2 complexes carry a population of circulating microRNAs independent of vesicles in human plasma.
Proc. Natl. Acad. Sci. U. S. A. 108, 5003–5008 (2011).
39. Enderle, D. et al. Characterization of RNA from exosomes and other extracellular vesicles isolated by a novel spin column-based
method. PLoS ONE 10, e0136133 (2015).
40. Huang, X. et al. Characterization of human plasma-derived exosomal RNAs by deep sequencing. BMC Genomics 14, 319 (2013).
41. Griffiths, S. G., Cormier, M. T., Clayton, A. & Doucette, A. A. Differential proteome analysis of extracellular vesicles from breast
cancer cell lines by chaperone affinity enrichment. Proteomes 5, E25 (2017).
42. Bijnsdorp, I. V. et al. Feasibility of urinary extracellular vesicle proteome profiling using a robust and simple, clinically applicable
isolation method. J. Extracell. Vesicles 6, 1313091 (2017).
43. Armstrong, D. & Wildman, D. E. Extracellular vesicles and the promise of continuous liquid biopsies. J. Pathol. Transl. Med. 52,
1–8 (2018).
44. Garcia-Romero, N. et al. Extracellular vesicles compartment in liquid biopsies: clinical application. Mol. Aspects Med. 60, 27–37
(2018).
Scientific Reports | (2021) 11:8085 | https://doi.org/10.1038/s41598-021-87526-y 14
Vol:.(1234567890)You can also read