IGA SUBCLASSES HAVE DIFFERENT EFFECTOR FUNCTIONS ASSOCIATED WITH DISTINCT GLYCOSYLATION PROFILES - NATURE
←
→
Page content transcription
If your browser does not render page correctly, please read the page content below
ARTICLE
                  https://doi.org/10.1038/s41467-019-13992-8                 OPEN

                  IgA subclasses have different effector functions
                  associated with distinct glycosylation profiles
                  Ulrike Steffen 1*, Carolien A. Koeleman2, Maria V. Sokolova 1, Holger Bang3, Arnd Kleyer 1, Jürgen Rech1,
                  Harald Unterweger4, Martin Schicht5, Fabian Garreis5, Jonas Hahn1, Fabian T. Andes1, Fabian Hartmann1,
                  Madelaine Hahn1, Aparna Mahajan1, Friedrich Paulsen 5, Markus Hoffmann 1, Günter Lochnit 6,
                  Luis E. Muñoz 1, Manfred Wuhrer2, David Falck 2, Martin Herrmann 1 & Georg Schett1*
1234567890():,;

                  Monomeric serum immunoglobulin A (IgA) can contribute to the development of various
                  autoimmune diseases, but the regulation of serum IgA effector functions is not well defined.
                  Here, we show that the two IgA subclasses (IgA1 and IgA2) differ in their effect on immune
                  cells due to distinct binding and signaling properties. Whereas IgA2 acts pro-inflammatory on
                  neutrophils and macrophages, IgA1 does not have pronounced effects. Moreover, IgA1 and
                  IgA2 have different glycosylation profiles, with IgA1 possessing more sialic acid than IgA2.
                  Removal of sialic acid increases the pro-inflammatory capacity of IgA1, making it comparable
                  to IgA2. Of note, disease-specific autoantibodies in patients with rheumatoid arthritis display
                  a shift toward the pro-inflammatory IgA2 subclass, which is associated with higher disease
                  activity. Taken together, these data demonstrate that IgA effector functions depend on
                  subclass and glycosylation, and that disturbances in subclass balance are associated with
                  autoimmune disease.

                  1 Department  of Internal Medicine 3—Rheumatology and Immunology, Friedrich-Alexander-University Erlangen-Nürnberg (FAU) and Universitätsklinikum
                  Erlangen, Erlangen, Germany. 2 Leiden University Medical Center, Center for Proteomics and Metabolomics, Glycomics and Clinical Proteomics Group,
                  Leiden, Netherlands. 3 Orgentec Diagnostika, Mainz, Germany. 4 Section of Experimental Oncology and Nanomedicine (SEON), ENT Department, Friedrich-
                  Alexander-University Erlangen-Nürnberg (FAU) and Universitätsklinikum Erlangen, Erlangen, Germany. 5 Institute of Functional and Clinical Anatomy,
                  Friedrich Alexander University Erlangen-Nürnberg, Erlangen, Germany. 6 Protein Analytics, Institute of Biochemistry, Faculty of Medicine, Justus-Liebig-
                  University Giessen, Giessen, Germany. *email: ulrike.steffen@uk-erlangen.de; georg.schett@uk-erlangen.de

                  NATURE COMMUNICATIONS | (2020)11:120 | https://doi.org/10.1038/s41467-019-13992-8 | www.nature.com/naturecommunications                               1
ARTICLE                                                                  NATURE COMMUNICATIONS | https://doi.org/10.1038/s41467-019-13992-8

I
    mmunoglobulin A (IgA) is the most frequently produced                     spectrometry analysis of O-glycans and N-glycans indicates that
    antibody in the human body1. The majority of IgA is secreted              IgA1 and IgA2 are differentially glycosylated, and IgA1 effector
    as a dimer into mucosal tissues, where it has an important                function increases after enzymatic removal of sialic acid or whole
function in intestinal microbiota homeostasis2. However, in                   N-glycans. In addition, differences in the IgA1:IgA2 ratio amongst
humans, IgA also represents the second most abundant immu-                    autoantibodies from patients with RA are associated with disease
noglobulin in the serum, reaching concentrations of 1–3 mg/ml1.               severity. In summary, our study identifies the IgA subclass as a
In the past few years, it has become clear that serum IgA has                 major regulator of IgA effector function, which might have broad
particular immunological functions independent from the role of               implications for the development of human autoimmune diseases.
secretory IgA in the gut. Of note, serum IgA strongly differs from
secretory IgA. Whereas secretory IgA is dimeric, serum IgA is
composed mainly of monomers. The monomeric form and the                       Results
lack of the secretory component enable serum IgA to bind to Fcα-              IgA2 has stronger pro-inflammatory effects than IgA1. To
receptor I (FcαRI) expressed by myeloid cells, such as monocytes,             investigate putative differences in the effector functions of the two
neutrophils, and some subsets of macrophages and dendritic cells              IgA subclasses, we isolated IgA from pooled serum of healthy
(DCs)3. Serum IgA can thereby induce pro-inflammatory                          donors and separated it into IgA1 and IgA2. IgA containing
responses, such as the release of cytokines and chemokines, pha-              immune complexes and particles coated with IgA have been
gocytosis, degranulation, and formation of neutrophil extracellular           reported to be potent inducers of NET formation24,25. We thus
traps (NETs)4. Opsonization of gut bacteria with IgA even con-                first analyzed the effects of IgA1 and IgA2 in a human NET
verts anti-inflammatory intestinal CD103+ DCs to a pro-                        formation assay. We isolated neutrophils from the blood of
inflammatory phenotype, which protects against invading patho-                 healthy donors and stimulated them with 200 µg/ml of serum
gens, but might also result in chronic inflammation5. Evidence                 IgA1 and IgA2 that was either monomeric or had been heat
exists that serum IgA contributes to autoimmune diseases, such as             aggregated to mimic immune complexes. As a control for the
inflammatory bowel disease6,7, autoimmune skin blistering                      protein load, human serum albumin (HSA) was used. Neu-
diseases8,9, or rheumatoid arthritis (RA)10–12 as well as to trans-           trophils challenged with IgA displayed an increased NET for-
plant rejection13. In addition, IgA has gained interest as a ther-            mation rate compared to cells treated with HSA (Fig. 1a–c). This
apeutic antibody against cancer cells, as it activates neutrophil-            effect was more pronounced with heat aggregated IgA (=HAA)
mediated antibody-dependent cellular cytotoxicity better than                 than with monomeric IgA. While we did not see a significant
IgG14,15.                                                                     difference between monomeric IgA1 and IgA2, heat aggregated
   By contrast, several anti-inflammatory effects of serum IgA                 IgA2-induced NET formation more potently than heat aggre-
have also been described, proposing a protective role of IgA                  gated IgA1. This difference was consistent among various con-
against autoimmunity and autoinflammation. Crosslinking of                     centrations of IgA (Supplementary Fig. 1a, b).
FcαRI or stimulation with monomeric IgA inhibited the pro-                       A blocking antibody against FcαRI (=CD89) completely
duction of pro-inflammatory cytokines and induced IL-10                        abrogated heat aggregated IgA-induced NET formation (Fig. 1d,
expression in human monocytes and monocyte-derived                            e), while no effect was seen with the isotype control. Of note,
DCs16,17. In addition, injection of human serum IgA reduced                   most neutrophils rapidly became adherent in the presence of
paw swelling in FcαRI transgenic mice with collagen-induced                   aggregated IgA (Fig. 1f), but not if FcαRI was blocked. Together,
arthritis or collagen antibody-induced arthritis18.                           these data confirm that activation of neutrophils by aggregated
   The observed discrepancies between pro-inflammatory and                     IgA is FcαRI dependent, as it has been published before24,25. As
anti-inflammatory effects of serum IgA demonstrate that more                   expected, blocking of FcγRI (=CD64) or FcγRIII (=CD16) did
knowledge is required to understand the mechanisms of IgA-                    not affect NET formation (Supplementary Fig. 1c, d).
mediated effector functions. FcαRI initiates activating but also                 In addition to the increased NET formation, neutrophil
inhibitory signals depending on the intensity of its activation19.            stimulation with heat aggregated IgA2 resulted in an increased
However, how binding of IgA to FcαRI is regulated and modu-                   release of IL-8, while heat aggregated IgA1 had no verifiable effect
lated remains unclear. FcαRI belongs to the same family as Fcγ-               compared to the HSA-treated control (Fig. 1g). To exclude major
receptors (FcγR)20 that are important for IgG effector functions.             alterations in the IgA complex formation to be a reason for the
For IgG, it is well established that subclass-specific structural              observed differences in neutrophil stimulation, we measured the
differences and Fc glycosylation affect affinity to FcγR21,22;                 complex size of heat aggregated IgA1 and IgA2 with dynamic
similar regulatory mechanisms might exist for IgA.                            light scattering. Complexes of both IgA subclasses showed equal
   Humans possess two IgA subclasses, IgA1 and IgA2, that differ              sizes with a mean diameter of ~28 nm (Supplementary Fig. 1e, f).
mainly in the structure of their hinge region and in the number of            Electron microscopy images confirmed the IgA complexes to be
glycosylation sites3. In serum, IgA1 is predominant against IgA2              rather small in size (Supplementary Fig. 1g). In addition, all IgA
with a ratio of 9:1, whereas in mucosal tissues, IgA1 and IgA2 are            samples had been verified to be free of endotoxin to avoid
more evenly distributed. Of note, with the exception of chim-                 endotoxin-mediated side effects.
panzees, gorillas, and gibbons, humans are the only species pos-                 NET formation can be induced via different pathways26. To
sessing two IgA subclasses23. By contrast, mice express only one              better characterize IgA-mediated NET formation, we used the
IgA isotype and do not have a functional homologue to FcαRI3.                 inhibitors diphenylene iodonium (DPI) and GSK484 directed
The fact that mice have a completely different IgA system that                against neutrophil NADPH oxidase (NOX) and peptidylarginine
can’t be compared to humans might explain why subclass specific                deiminase 4 (PAD4), respectively. Phorbol 12-myristate 13-
effects of IgA have scarcely been examined to date. However,                  acetate (PMA) was used as positive control for NOX-dependent
further knowledge about the effects of IgA subclass and glyco-                NET formation and ionophore A32187 served as positive control
sylation is needed to understand the two-sided function of serum              for PAD4-dependent NET formation. Heat aggregated IgA1 and
IgA as inducer of both tolerance and inflammation.                             IgA2-induced NET formation was completely blocked in the
   In this study, we explore differences in the effector functions of         presence of DPI (Supplementary Fig. 2), indicating the formation
human serum IgA1 and IgA2 on myeloid cells. We show that IgA2                 of reactive oxygen species by NOX to be the main pathway. In
induces NET formation and cytokine production by neutrophils                  contrast, PAD4 activation does not seem to play a major role as
and macrophages to a substantially higher degree than IgA1. Mass              the inhibitor GSK484 showed no effect.

2                 NATURE COMMUNICATIONS | (2020)11:120 | https://doi.org/10.1038/s41467-019-13992-8 | www.nature.com/naturecommunications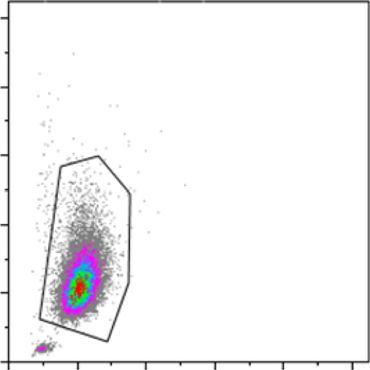
NATURE COMMUNICATIONS | https://doi.org/10.1038/s41467-019-13992-8 ARTICLE
a b c
600 800 HSA HAA1 HAA2
HSA
Rel. amount of external DNA
Rel. amount of external DNA
IgA1 **
IgA2 ***
HAA1
600 * ***
400
HAA2
***
400
**
200 *
200
0 0
0 100 200 300
SA
A1
1
A2
2
AA
AA
Ig
Ig
H
Time (min)
H
H
d 500
e ns f
HSA 600 HSA HAA1 HAA2
***
Rel. amount of external DNA
Rel. amount of external DNA
HAA1
400 HAA1+αCD89
HAA1+ iso
ns
Control
HAA2 400
300 HAA2+αCD89 **
HAA2+ iso
200
200
100
0 0
+αCD89
0 100 200 300
o
o
SA
1
AA 89
2
AA 89
is
is
1+ AA
2+ AA
H CD
H CD
H
1+
2+
Time (min)
H
AA H
α
α
AA
H
H
g 8 h 6000 150
**
IL-8 fold change
TNF-α (pg/ml)
6 ** **
IL-8 (pg/ml)
4000 100
ns
4 ns
ns
2000 ns 50
2 ns
0 0 0
HSA HAA1 HAA2 No HSA IgA1 IgA2 No HSA IgA1 IgA2
coating coating
Fig. 1 IgA2 activates neutrophils and macrophages more potently than IgA1. a–c Human neutrophils were stimulated with 200 µg/ml of monomeric or
heat aggregated (=HAA) IgA1 and IgA2, or with human serum albumin (HSA). Neutrophil extracellular trap (NET) formation was evaluated by staining
extracellular DNA with Sytox Green. a NET formation over time. b Relative amount of extracellular DNA at 280 min after stimulation normalized on
HSA treatment; n = 5 donors. c Representative images at 280 min after stimulation. Scale bar = 50 µm. d–f NET formation of human neutrophils with
200 µg/ml HAA1 or HAA2 in the presence of 10 µg/ml blocking antibody against FcαRI (=αCD89) or isotype control (=iso). d NET formation over time.
e Relative amount of extracellular DNA at 260 min after stimulation normalized on HSA treatment; n = 4 donors. f Representative images at 35 min after
stimulation. Scale bar = 20 µm. g IL-8 released by neutrophils 4 h after stimulation with HSA, HAA1, or HAA2; n = 6 donors. h Cytokines released by
macrophages 6 h after seeding in wells coated with HSA, IgA1, or IgA2; n = 4 donors. Significances were tested with paired one-way ANOVA followed by
Bonferroni correction for selected pairs of columns b, d or Dunnet’s correction g, h. *p < 0,05; **p < 0,01; and ***p < 0,001. Data are presented as mean ±
s.e.m. a, d or scatter blots with bars showing mean ± s.e.m. b, e, g, h. Source data are provided as a Source Data file.
To determine if the observed stronger activation with IgA2 is drive NET formation via FcαRI. Similar to FcγRs, the activation of
cell-type-specific or a global phenomenon, we next investigated FcαRI leads to immunoreceptor tyrosine-based activation motif
the effects of IgA1 and IgA2 on human monocyte-derived phosphorylation in the common Fc receptor gamma chain with
macrophages. To mimic the presence of immune complexes subsequent recruitment and activation of spleen tyrosine kinase
without the need of heat aggregation, we immobilized IgA1, IgA2, (Syk). Downstream, several pathways are activated, including
or the protein load control HSA on the surface of cell culture Ca2+ release, formation of phosphatidylinositol (3,4,5)-trispho-
plate wells. Differentiated macrophages were seeded into these sphate and activation of the mitogen-activated protein kinase/
wells and after 6 h the supernatant was analyzed for the presence extracellular signal-regulated kinase (MAPK/Erk) pathway27.
of cytokines. Macrophages stimulated with immobilized To get a first hint if both IgA subclasses activate FcαRI to a
IgA2 secreted substantially increased amounts of IL-8 and tumor similar degree, we isolated human neutrophils and stimulated
necrosis factor α (TNF-α), although the levels of TNF-α were them with 100 µg/ml of heat aggregated IgA1 and IgA2, or HSA
overall relatively low (Fig. 1h). Immobilized IgA1 did not in the presence of the Syk inhibitor R406 or the Erk inhibitor
significantly increase the secretion of these cytokines. PD98059. As expected, inhibition of Syk reduced NET formation
to ~60–70% of the values reached with heat aggregated IgA1 or
IgA1 and IgA2 induce different signaling in neutrophils. To IgA2 without inhibitor (Fig. 2a, b). Interestingly, inhibition of Erk
elucidate why the two IgA subclasses exert different effects on only diminished NET formation triggered by IgA2 complexes, but
myeloid cells, we investigated signaling pathways involved in IgA- had no effect on IgA1 complex-mediated NET formation. The
mediated NET formation. As described above, IgA complexes basal NET formation rate in the presence of the protein load
NATURE COMMUNICATIONS | (2020)11:120 | https://doi.org/10.1038/s41467-019-13992-8 | www.nature.com/naturecommunications 3ARTICLE NATURE COMMUNICATIONS | https://doi.org/10.1038/s41467-019-13992-8
a HSA HAA1 HAA2
150 150 150
Rel. amount of ext. DNA
Rel. amount of ext. DNA
Rel. amount of ext. DNA
Control
DMSO
100 100 100 R406 0,0175 μM
R406 0,07 μM
50 50 50
0 0 0
0 100 200 300 0 100 200 300 0 100 200 300
Time (min) Time (min) Time (min)
150 150 150
Rel. amount of ext. DNA
Rel. amount of ext. DNA
Rel. amount of ext. DNA
Control
DMSO
100 100 100 PD98059 0,5 μM
PD98059 5 μM
50 50 50
0 0 0
0 100 200 300 0 100 200 300 0 100 200 300
Time (min) Time (min) Time (min)
250 250 250
Rel. amount of ext. DNA
Rel. amount of ext. DNA
Rel. amount of ext. DNA
Control
200 200 200 DMSO
SHP099 2 μM
150 150 150
100 100 100
50 50 50
0 0 0
0 100 200 300 0 100 200 300 0 100 200 300
Time (min) Time (min) Time (min)
b R406 PD98059 SHP022
p = 0.1
200 250 250 **
Rel. amount of ext. DNA
Rel. amount of ext. DNA
Rel. amount of ext. DNA
** * 200 200
150 **
150 * 150
100
100 100
50
50 50
0 0 0
w/o
DMSO
0,5 μM
5 μM
w/o
DMSO
0,5 μM
5 μM
w/o
DMSO
0,5 μM
5 μM
w/o
DMSO
0,0175 μM
0,07 μM
w/o
DMSO
0,0175 μM
0,07 μM
w/o
DMSO
0,0175 μM
0,07 μM
w/o
DMSO
2 μM
w/o
DMSO
2 μM
w/o
DMSO
2 μM
HSA HAA1 HAA2 HSA HAA1 HAA2 HSA HAA1 HAA2
c d 1000 HAA2
30 HAA1
HAA1 ***
Secondary antibody
HAA2 800
20
***
% max
600
ΔMFI
Neutrophils
SSC
10 *** 400
200
0
0 25 50 75 100 0
μg/ml 0 200 400 600 800 1000 10
1
10
2
10
3
FSC IgA-FITC
Fig. 2 IgA2 induces stronger binding and activating signaling to neutrophils than IgA1. a, b Human neutrophils were stimulated with 100 µg/ml of heat
aggregated IgA1 and IgA2 (=HAA1 and HAA2) or with human serum albumin (=HSA) in the presence of inhibitors for Syk (=R406), Erk (=PD98059) or
Shp-2 (=SHP099) at the indicated concentrations. Neutrophil extracellular trap (NET) formation was evaluated by staining extracellular DNA with Sytox
Green. a NET formation over time and b relative amount of extracellular DNA at 265 min after stimulation normalized on treatment without inhibitors; n =
5–6 donors. c Binding of HAA1 and HAA2 to neutrophils measured by flow cytometry; n = 4 donors. d Representative blots of flow cytometry analysis
showing neutrophil gating and fluorescence intensity. FSC, forward scatter; SSC, side scatter. Significances were tested with paired one-way ANOVA
followed by Dunnett’s correction b or Bonferroni correction for selected pairs of columns c. *p < 0,05; **p < 0,01; and ***p < 0,001. Data are presented as
mean ± s.e.m. a, c or scatter blots with bars showing mean ± s.e.m. b. Source data are provided as a Source Data file.
4 NATURE COMMUNICATIONS | (2020)11:120 | https://doi.org/10.1038/s41467-019-13992-8 | www.nature.com/naturecommunicationsNATURE COMMUNICATIONS | https://doi.org/10.1038/s41467-019-13992-8 ARTICLE
control HSA was not influenced by the two inhibitors, In contrast, the signal for free galactose (detected with erythrina
demonstrating that the observed inhibitory effects were specific christagalli lectin) was doubled in IgA2 compared to IgA1.
for IgA-triggered NET formation. In addition, the solvent To determine the compositions of individual N-glycans, we
dimethyl sulfoxide (DMSO) had no effect on NET formation. performed mass spectrometry analysis of glycopeptides from
Cytotoxic effects of the inhibitors could be excluded (Supple- isolated serum IgA1 and IgA2 from 12 healthy donors (age 40–62
mentary Fig. 3a, b), while the solvent DMSO displayed a minor years; 75% female; Fig. 3d–g). Remarkably, we observed only very
cytotoxic effect by itself. little variation between the donors. With respect to the
Activating signals of immunoreceptors can be blocked by glycosylation sites N144/N131 and N340/N327 that are present
simultaneous inhibitory signals that lead to the activation of in both subclasses, IgA2 displayed in general less galactosylation,
phosphatases, like Src homology 2 (SH2) domain containing less sialylation (only at N340/N327), less bisecting N-acetylglu-
inositol phosphatase, SH2-containing tyrosine phosphatase-1 cosamine, and less fucosylation (only at N340/N327) of complex
(Shp-1) or Shp-2 via immunoreceptor tyrosine-based inhibitory type glycans. In addition, IgA2 showed relatively high levels of
motif phosphorylation28. Inhibition of the phosphatase Shp-2 noncomplex glycans (=high mannose or hybrid type; see
with the inhibitor SHP099 markedly increased aggregated IgA1- Supplementary Fig. 4b, c). The two N-glycosylation sites unique
induced NET formation (Fig. 2a, b). We also saw a tendency to IgA2 were mainly monosialylated and had a high level of
toward increased NET formation in the presence of Shp-2 bisection and fucosylation. Of note, for the glycosylation site
inhibitor, when neutrophils were stimulated with aggregated N340/N327, we could detect in both IgA subclasses a second—
IgA2. However, this effect was less pronounced and not truncated—glycopeptide form in which the C-terminal tyrosine
significant. Basal NET formation in the presence of HSA was was missing. This phenomenon has been described before34, but
not affected by the Shp-2 inhibitor. Together these data suggest it is so far unclear if it is of biological relevance. Compared to the
that IgA2 complexes initiate a robust neutrophil activation via nontruncated version, the truncated glycopeptides displayed quite
activation of Syk and Erk, while IgA1 complex-mediated signaling similar glycan compositions, with overall slightly increased
seems to be less stable and at least partially blocked by inhibitory sialylation, galactosylation, and fucosylation levels (Supplemen-
Shp-2 signals. tary Fig. 5a). Noncomplex type glycans were not observed for the
To test if the observed differences in signaling could arise from truncated version.
a different binding affinity of the IgA subclasses, we measured the In addition to N-gylcans, we investigated the O-glycosylation
relative amount of aggregated IgA1 and IgA2 bound to sites of IgA1. We detected on average 4.5 O-glycans per heavy
neutrophils by flow cytometry, using a secondary antibody that chain with an overall galactosylation of 80% and sialylation of
recognizes both IgA subclasses. We observed a consistently higher 50% (Supplementary Fig. 5b).
binding of IgA2 complexes to neutrophils compared to IgA1 Together, our mass spectrometry data revealed a consistently
complexes (Fig. 2c, d). Of note, this effect was not due to a higher lower sialylation in IgA2 compared to IgA1 with on average 25%
affinity of the secondary antibody to IgA2, as polystyrene beads less sialic acid per N-glycan and also per IgA molecule when
coated with IgA2 even displayed lower fluorescence signals than counting N- and O-glycans together (Supplementary Fig. 5c).
IgA1-coated polystyrene beads (Supplementary Fig. 3c). In addition to conserved Fc glycosylation, antibodies can
introduce further glycosylation sites within the variable domains
of the Fab region caused by somatic hypermutation35. To date,
IgA1 and IgA2 have different glycosylation patterns. For IgG, it the function of Fab glycosylation is unclear, but it could influence
has been well established, that the binding affinity to FcγR and antigen binding, effector function or the half-life of immunoglo-
subsequent signaling is strongly regulated by Fc glycosylation29. bulins. To test for the presence of Fab glycosylation in serum
IgG glycans are in general biantennary complex-type oligo- IgA, we performed polyacrylamide gel electrophoresis with two
saccharides containing a highly conserved heptamer core of independent preparations of IgA1 and IgA2 together with IgG
mannose and N-acetylglucosamine residues. To this core, addi- from sera of healthy donors, followed by lectin blot analysis with
tional sugar residues can be attached, such as galactose, sialic acid, lens culinaris agglutinin to detect N-glycans (Supplementary
bisecting N-acetylglucosamine, and fucose (Supplementary Fig. 5d, e). As IgA2 contains a conserved glycosylation site (N41)
Fig. 4a). For IgG, it has been shown that the composition of these in the Fab region of the heavy chain, we concentrated on the
sugars greatly affects IgG effector functions29. Mouse and in vitro light chain. As expected, we found a signal for N-glycosylation in
experiments indicate that for example the presence of terminal the light chains of IgG. In contrast, no signal could be observed
galactose or sialic acid plays an important role in the decision if in IgA1 or IgA2, suggesting that IgA does not or only to very
IgG acts pro- or anti-inflammatory30–32. While IgG contains only little extent contain variable domain Fab glycosylation.
one conserved N-glycosylation site, IgA1 holds two and IgA2
even four conserved sites for N-glycosylation33 (Fig. 3a). In
addition, IgA1 possesses several O-glycosylation sites in its hinge IgA1 effector functions are controlled by Fc glycosylation. To
region. We thus hypothesized that differences in the glycan investigate if the higher levels of sialic acid in IgA1 glycans might
composition, such as the presence of terminal sialic acid, might be responsible for its lack of inflammatory effector functions, we
affect IgA effector functions as well. removed sialic acid of serum IgA1 and IgA2 by treatment with
To test if differences in sialylation might contribute to the the enzyme neuraminidase (Supplementary Fig. 6a). Indeed,
different effector functions of the IgA subclasses, we performed desialylation of IgA1 increased its capacity to induce NET for-
lectin blot analysis on isolated serum IgA1 and IgA2 from healthy mation by neutrophils (Fig. 4a) and IL-8 production by macro-
donors. As expected, we detected two times more N-glycans phages (Fig. 4b) at levels comparable to IgA2. By contrast, the
(detected with lens culinaris lectin) in IgA2 compared to IgA1 activity of IgA2 was not noticeably affected by neuraminidase
(Fig. 3b, c), which fits to the reported number of four N- treatment. Interestingly, the complete removal of N-glycans with
glycosylation sites in IgA2 versus only two N-glycosylation sites in PNGase F had the same effect on IgA1 (Fig. 4c, d) standing in
IgA133. When normalized on the signal for the N-glycan, the strong contrast to experiences made with IgG, which is unable to
signal for terminal α2,6-linked sialic acid (detected with sambuccus exert most effector functions if its Fc glycan is missing36. The
nigra agglutinin) was reduced by half in IgA2 compared to IgA1. effects of deglycosylation on IgA2 could not be investigated, as we
NATURE COMMUNICATIONS | (2020)11:120 | https://doi.org/10.1038/s41467-019-13992-8 | www.nature.com/naturecommunications 5ARTICLE NATURE COMMUNICATIONS | https://doi.org/10.1038/s41467-019-13992-8
a IgA1 IgA2 b
IgA 70 kDa
IgA
N41 55 kDa
N131
N144 Lens culinaris 70 kDa
N205 IgA
O-glycosylation agglutinin 55 kDa
N340 N-glycosylation N327
c Glycan per protein Sialic acid per glycan Galactose per glycan Sambuccus nigra 70 kDa
IgA
3 1.5 4 agglutinin 55 kDa
** ***
**
Relative intensity
Relative intensity
Relative intensity
3
2 1.0
2 Erythrina 70 kDa IgA
1 0.5 cristagalli lectin 55 kDa
1
Marker
IgA1
IgA2
IgA1
IgA2
IgA1
IgA2
0 0.0 0
IgA1 IgA2 IgA1 IgA2 IgA1 IgA2
#1 #2 #3
d Sialylation Galactosylation Bisection Fucosylation Non-complex
100 100 100 100 100
IgA1
80 80 IgA2
*** 80
75
80
N144/N131
50
60 60 60 25 60
*** *
%
%
%
%
%
1.5
40 40 40 40
*** 1.0 ***
20 20 20 0.5 20
0 0 0 0.0 0
S0 S1 S2 G0 G1 G2 G3 IgA1 IgA2 IgA1 IgA2 IgA1 IgA2
e Sialylation Galactosylation Bisection Fucosylation Non-complex
100 100 *** 100 100 *** 100
IgA1
80 *** 80 IgA2 80 80 80
N340/N327
***
60 60 60 60 60
%
%
%
%
%
40 *** 40 *** 40 40 40 ***
20 20 20 20 20
0 0 0 0 0
S0 S1 S2 G0 G1 G2 G3 IgA1 IgA2 IgA1 IgA2 IgA1 IgA2
f Sialylation Galactosylation Bisection Fucosylation g Sialylation Galactosylation Bisection Fucosylation
100 100 100 100 80 100 100 100
80 80 80 80 60 80 80 80
N205
60 60 60 60 60 60 60
N41
%
%
%
%
%
%
%
%
40
40 40 40 40 40 40 40
20 20 20 20 20 20 20 20
0 0 0 0 0 0 0 0
S0 S1 S2 G0 G1 G2 G3 IgA2 IgA2 S0 S1 S2 G0 G1 G2 G3 IgA2 IgA2
Fig. 3 IgA1 and IgA2 are differentially glycosylated. a Schematic overview of glycosylation sites in IgA1 and IgA2. Bold letters indicate glycosylation sites
present in both IgA subclasses. b Representative lectin blots of IgA1 and IgA2 isolated from sera of healthy donors using antibodies against IgA or lectins
against the core structure of N-glycans (=lens culinaris agglutinin), terminal α2,6-linked sialic acid (=sambuccus nigra agglutinin), and terminal galactose
(=erythrina christagalli lectin). c Quantification of the lectin blots; n = 6 donors. d–f Mass spectrometric quantification of sialyation, galactosylation,
bisection, fucosylation, and the presence of noncomplex structures for the glycosylation sites N144/N131 d, N340/N327 e, N41 f, and N205 g; n = 12
donors. Significances were tested with paired two-sided Student’s t-test c–g or paired one-way ANOVA followed by Bonferroni correction for selected pairs
of columns d–g. *p < 0,05; **p < 0,01; and ***p < 0,001. Data are presented as scatter plots with mean ± s.e.m. c or box plots with medians and inter-
quartile ranges + whiskers ranging from min to max d–g. Source data are provided as a Source Data file.
were not able to remove all sugars from IgA2 with PNGase F indicate that IgA effector functions are not only determined by
(Supplementary Fig. 6b). binding affinity, but that other factors are involved as well. Again,
Dynamic light scattering measurements showed a size increase we tested if binding of the secondary antibody was affected by
in heat aggregated IgA after desialylation and deglycosylation desialylation or deglycosylation using polystyrene beads, but we
(Supplementary Fig. 7a), which was equal for IgA1 and IgA2. In could not see a difference between beads coated with native,
addition, flow cytometry analysis revealed a slightly increased desialylated, or deglycosylated IgA1 (Supplementary Fig. 7b).
binding of aggregated desialylated IgA1 compared to aggregated
native IgA1 to neutrophils, while binding of aggregated
deglycosylated IgA1 was not altered (Fig. 4e). However, binding Increased IgA2:IgA1 ratios correlate with RA disease scores.
of aggregated IgA2 was still much stronger. Together, these data The presence of autoantibodies from the IgA class is associated
6 NATURE COMMUNICATIONS | (2020)11:120 | https://doi.org/10.1038/s41467-019-13992-8 | www.nature.com/naturecommunicationsNATURE COMMUNICATIONS | https://doi.org/10.1038/s41467-019-13992-8 ARTICLE
a 200 250 ns
b
*
Rel. amount of external DNA
Rel. amount of external DNA
HSA
HAA1 200
150
HAA2
HAA1-ds
6 **
150
HAA2-ds **
IL-8 fold change
100
4 *
100
50 2
50
0 0 0
0 100 200 300
ds
ds
s
s
SA
SA
1
2
Ig 1
A2
l
t ro
-d
-d
AA
AA
A
1-
2-
Ig
H
Ig
H
A1
A2
on
AA
AA
Time (min)
H
H
Ig
C
H
H
c 500 800 d e
ns
HSA **
Rel. amount of external DNA
Rel. amount of external DNA
400 HAA1
600
HAA2
5 50 ns
300 HAA1-dg
***
4 ** 40
IL-8 fold change
400
*
200 3 30 ***
ΔMFI
ns
200 2 20
100
1 10
0 0 0 0
0 100 200 300
SA
dg
ds
1
ds
2
dg
g
SA
A1
1
A2
2
l
tro
AA
AA
-d
AA
AA
2-
1-
1-
1-
H
Ig
Ig
H
A1
Time (min) on
H
H
AA
AA
AA
H
H
AA
Ig
C
H
H
H
H
Fig. 4 Removal of sialic acid or all N-glycans increases pro-inflammatory activity of IgA1. a Human neutrophils were stimulated with 100 µg/ml of human
serum albumin (=HSA) and native or desialylated (=-ds) heat aggregated IgA1 and IgA2 (=HAA1 and HAA2). NET formation was evaluated by staining
extracellular DNA with Sytox Green. Shown is NET formation over time and the relative amount of extracellular DNA at 280 min after stimulation
normalized on HSA treatment; n = 6 donors. b IL-8 released by macrophages 6 h after seeding in wells coated with HSA, IgA1, desialylated IgA1 (=IgA1-ds),
IgA2 or desialylated IgA2 (=IgA2-ds); n = 7 donors. c Human neutrophils were stimulated with 100 µg/ml of human serum albumin (=HSA) and native or
deglycosylated (=-dg) heat aggregated IgA1 and IgA2 (=HAA1 and HAA2); n = 5 donors. d IL-8 released by macrophages 6 h after seeding in wells coated
with HSA, IgA1, deglycosylated IgA1 (=IgA1-dg) or IgA2; n = 6 donors. e Binding of heat aggregated IgA1 and IgA2 (=HAA1 and HAA2) that has been
desialylated (=-ds) or deglycosylated (=-dg) on neutrophils measured by flow cytometry; n = 7 donors. Significances were tested with paired one-way
ANOVA followed by Bonferroni correction for selected pairs of columns a, c, e or Dunnet’s correction b, d. *p < 0,05; **p < 0,01; and ***p < 0,001. Data are
presented as mean ± s.e.m. a, c or scatter blots with bars showing mean ± s.e.m. a–e. Source data are provided as a Source Data file.
with a worse disease prognosis, increased synovitis and joint We next investigated the IgA subclass distribution in
destruction in patients with RA11,12,37. Neutrophils and macro- autoantibodies against citrullinated proteins (ACPA) that are
phages play a major role in the manifestation of synovitis38. As highly specific for RA. Interestingly, compared to total serum IgA,
we found IgA2 to activate these cells, we hypothesized that the IgA1:IgA2 ratio in ACPA was strongly shifted toward IgA2
especially autoantibodies of the IgA2 subclass might contribute to (Fig. 5b). We further tested whether the levels of IgA ACPA and
disease severity in RA. To investigate if the IgA levels or subclass their subclass distribution correlated with disease activity in RA
distribution are altered in patients with RA, we measured the using a validated instrument (disease activity score 28; DAS28).
amount of total IgA, IgA1, and IgA2 in the serum of 48 patients Interestingly, higher levels of IgA1 ACPA correlated with lower
with RA and compared them to the levels of 32 age and sex- DAS28 scores (Fig. 5c), suggesting a protective effect of IgA1
matched healthy controls (see Supplementary Table 1 for char- autoantibodies. Conversely, a high percentage of IgA2 in ACPA
acteristics of patients and controls). RA patients displayed slightly correlated with higher disease scores. This effect was specific for
reduced levels of serum IgA, IgA1, and IgA2 (Fig. 5a). As ACPA as the levels and proportion of total serum IgA1 and
expected, in both groups IgA1 levels were about ten times higher IgA2 showed no correlation. Together, these data are in line with
than IgA2 levels. However, the IgA subclass ratio was slightly our findings that IgA2, but not IgA1 acts pro-inflammatory on
changed in RA patients leading to a higher percentage of the pro- myeloid cells and indicate that IgA2 autoantibodies might
inflammatory IgA2. Interestingly, investigating a larger cohort of contribute to disease manifestation in patients with RA.
healthy subjects, we found markedly increased serum IgA levels
in men compared to women (Supplementary Fig. 8a). This dif-
ference was based on higher IgA1 levels in men, while IgA2 levels Discussion
were the same in both groups. Regarding subclass distribution, Immunoglobulins are an essential component of the adaptive
women thus displayed a higher IgA2 percentage in IgA. To immune system to fight pathogens. In human serum, IgG is the
determine if the observed difference in the IgA1:IgA2 ratio most frequent immunoglobulin class, but, with concentrations
between healthy subjects and RA patients is sex dependent, we between 1–3 mg/ml, IgA is also abundantly present in human
reanalyzed our data separately for men and women. However, we serum1. However, the biological relevance of IgA and the reg-
found the same tendencies for both sexes (Supplementary ulation of its effector functions are still insufficiently character-
Fig. 8b), although the increase in IgA2 percentage was smaller in ized. In the past few years, increasing evidence suggests that IgA
women with RA, most likely due to the higher basal value in is not only involved in gut homeostasis, but also plays an
healthy women. important role in the regulation of immune responses. In
NATURE COMMUNICATIONS | (2020)11:120 | https://doi.org/10.1038/s41467-019-13992-8 | www.nature.com/naturecommunications 7ARTICLE NATURE COMMUNICATIONS | https://doi.org/10.1038/s41467-019-13992-8
a IgA IgA1 IgA2 IgA2 % b ACPA
15 ** 15 1.5 25
** 100
** * ***
20 80
% IgA2 of IgA
10 10 1.0
% of IgA
15 60
mg/ml
mg/ml
mg/ml
10 40
5 5 0.5
5 20
0 0 0.0 0 0
Healthy RA Healthy RA Healthy RA Healthy RA Total IgA ACPA
c ACPA
6 6 6 p = 0,041
p = 0,002 ns
r = –0.496 r = 0.333
4 4 4
DAS28
DAS28
DAS28
2 2 2
0 0 0
0 10 20 30 0 2 4 6 8 0 20 40 60 80 100
ACPA IgA1 (μg/ml) ACPA IgA2 (μg/ml) ACPA % IgA2
Total IgA
6 6 6
ns ns ns
4 4 4
DAS28
DAS28
DAS28
2 2 2
0 0 0
0 2000 4000 6000 8000 10,000 0 200 400 600 800 0 5 10 15 20 25
IgA1 (μg/ml) IgA2 (μg/ml) % IgA2
Fig. 5 A high IgA2 percentage in ACPA correlates with higher RA disease activity. a Amount of serum IgA, IgA1, and IgA2 as well as IgA2 percentage in
patients with RA (n = 48) and healthy controls (n = 32). b IgA2 percentage of total IgA compared to ACPA in the serum of ACPA-positive RA patients
(n = 38). c Correlation of the IgA1 and IgA2 amount, and IgA2 percentage in total serum IgA and IgA-ACPA with the disease activity score (DAS) 28 score
of ACPA positive RA patients (n = 38). Significances were tested with two-sided Student’s t-test using Welch’s correction a, paired two-sided Student’s t-
test b, or Pearson c. *p < 0,05; **p < 0,01; and ***p < 0,001. Data are presented as scatter plots with mean ± s.e.m. Source data are provided as a Source
Data file.
addition, several autoimmune diseases are associated with the For both IgA subclasses, the induction of NET formation was
presence of autoantibodies of the IgA class4. However, the role of diminished by the Syk inhibitor R406. This was expected as
IgA is controversially discussed and pro- as well as anti- FcαRI, like FcγR, signals via the common Fcγ receptor chain with
inflammatory effects have been described27. subsequent activation of Syk3. Interestingly, we found that IgA2,
The present study shows that the two IgA subclasses IgA1 but not IgA1-mediated NET formation was additionally affected
and IgA2 act differently on neutrophils and macrophages. by Erk inhibition, indicating Erk activation by IgA2 complexes.
While we did not detect pronounced effector functions of IgA1, Erk is reported to be a downstream target of FcαRI27. Whether
IgA2 promoted inflammatory reactions like enhanced NET activation of Erk by IgA2 complexes is due to a more persistent
formation and the expression of inflammatory cytokines. This binding of IgA2 than IgA1 complexes to FcαRI (quantitative
different behavior of IgA1 and IgA2 could be an explanation for difference) or due to an additional activation of coreceptors
the at first sight controversial effects of IgA observed in pre- (qualitative difference) remains to be determined in future stu-
vious studies. Many studies describing anti-inflammatory dies. We found that IgA2 complexes elicit a stronger binding to
effects of IgA worked with total serum IgA16–19,39, which is neutrophils than IgA1 complexes. However, from this experiment
to 90% composed of IgA1 that did not induce inflammatory we can’t conclude if the increased binding is due to an increased
cytokine production in our hands. On the other hand, the affinity to FcαRI or to other, yet unknown receptors.
described associations with autoimmune diseases are most According to the UniProt-structures P01876 and P01877, the
likely due to specific autoantibodies that may have an increased constant regions of IgA1 and IgA2 share 88% amino acid
IgA2 fraction, as we have observed for RA-specific ACPA. In sequence identity42,43. Apart from the hinge region, most dif-
contrast to our findings, Hansen et al. reported similar pro- ferences are changes of single amino acids. However, so far it has
inflammatory effects of IgA1 and IgA2 on CD103+ DC5. not been investigated if these differences alter the affinity to
However, they performed their experiments in the presence of FcαRI or to other receptors. In addition, detailed analysis of
the toll-like receptor 2 ligand Pam3CSK4. It is likely that the subclass specific IgA glycosylation, especially of the shared gly-
presence of secondary inflammatory stimuli, which we did not cosylation sites N144/N131 and N340/N327 are scarce as most
use in our study, generally increases pro-inflammatory signal- studies measured the glycosylation of these sites only for
ing of IgA, as it is known for IgG40,41 and thereby overcomes IgA134,44. We found one study of Chandler et al. investigating all
differences between the two IgA subclasses. glycans of serum IgA1 and IgA245. However, they had a very low
8 NATURE COMMUNICATIONS | (2020)11:120 | https://doi.org/10.1038/s41467-019-13992-8 | www.nature.com/naturecommunicationsNATURE COMMUNICATIONS | https://doi.org/10.1038/s41467-019-13992-8 ARTICLE
sample size and a high variation, which might explain why they whether O-glycans play a role as well needs to be clarified in
did not see glycosylation differences between the IgA subclasses. further studies.
As described in former studies, we found that IgA contained Interestingly, we found that in RA-specific ACPA, compared to
high amounts of galactose, sialic acid, bisecting N-acet- total serum IgA, the IgA1:IgA2 ratio was shifted toward pro-
ylglucosamine, and fucose (with exception of N144/N131, that inflammatory IgA2. This shift could explain published data,
was mainly unfucosylated)34,44,45. We found highly significant showing that ACPA of the IgA class are associated with poor
differences between IgA1 and IgA2 glycosylation. Overall, IgA1 disease prognosis, higher inflammation, and more severe joint
was more sialylated and galactosylated, and displayed higher destruction in RA patients10–12,37. Unfortunately, these studies
levels of bisecting N-acetylglucosamine compared to IgA2 on the have not discriminated between IgA1 and IgA2. We found that an
shared glycosylation sites. Interestingly, we also found glycans increased IgA2 fraction in IgA-ACPA, but not in total IgA cor-
that were not of complex, but of high-mannose or hybrid type. related with higher disease scores in RA patients, indicating IgA2
This phenomenon stands in strong contrast to IgG, for which ACPA to be involved in disease progression. The exact
glycans of noncomplex type have been found only in very little mechanisms still have to be defined, but it is likely that IgA2
amounts46,47. In addition, IgG is in general much less sialylated immune complexes enhance the invasion of immune cells into
and galactosylated than IgA48. This fact could be explained by inflamed tissues by stimulating neutrophils and macrophages to
different glycan positions in IgA and IgG with IgA glycans being release IL-8, a potent attractor of neutrophils57. Van der Steen
more exposed to the outside of the immunoglobulin molecule33, et al. showed that neutrophils migrate to IgA deposits in a skin
which might result in a greater accessibility and thus higher blistering disease model8 supporting this hypothesis. Of note, the
galactosylation and sialylation rate. presence of IgA1 ACPA correlated with lower disease scores
It is currently not known how the distinct glycosylation sites of which fits to the described protective effect of serum IgA in a
IgA affect its effector functions. There are some studies reporting murine inflammatory arthritis model18 given that serum IgA is
that glycans are not involved in binding of IgA to FcαRI49,50, but mainly composed of IgA1.
also one study showing an increased association rate of degly- Together, our data propose a concept how serum IgA effector
cosylated IgA to FcαRI51. Our data clearly show that enzymatic functions are regulated in humans. IgA1, which makes the
removal of terminal sialic acid or the whole glycan increases the majority of serum IgA, seems to be important for immune
pro-inflammatory capacities of IgA1, demonstrating that IgA homeostasis, while IgA2 exerts inflammatory effects. In addition,
glycosylation is important for IgA effector function. It has to be our data demonstrate that IgA glycosylation controls IgA effector
noted that desialylation and deglycosylation led to an increased functions. Further research is needed to elucidate how exactly IgA
IgA complex size after heat aggregation. However, we do not glycosylation influences the inflammatory capacity of IgA. In
believe that this size increase was responsible for the stronger pro- addition, the relevance of autoantibody glycosylation for auto-
inflammatory effects observed after sugar removal, as we saw the immune disease development in general has still to be proven by
same increase in both IgA subclasses and desialylation did not therapeutic manipulation in patients. However, our findings
alter the effector function of IgA2 despite the increased complex provide an important step for a better understanding of the
size. Furthermore, we observed only a mild increase in binding of potential contribution of IgA to autoimmune diseases and for the
IgA1 complexes to neutrophils after desialylation and no change generation of therapeutic IgA.
after deglycosylation, indicating that the binding affinity to FcαRI
might indeed not be dramatically influenced by the glycan Methods
composition. However, the glycan composition might affect IgA isolation and generation of IgA complexes. IgA was isolated from pooled
binding to other receptors and thereby influence effector func- sera of healthy donors using peptide M agarose (Invivogen) according to the
tions as it has been described for IgG52. In mice, secretory IgA has manufacturer’s instructions. After an additional washing step with 0.1 M glycine
buffer (pH 5.0) to remove nonspecifically bound proteins, bound IgA was eluted
been found to bind to specific ICAM-3 grabbing nonintegrin- with 0.1 M glycine buffer (pH 2.7), immediately neutralized using 1 M Tris buffer
related 1 (SIGNR1), which is an important mediator of anti- (pH 9), and dialyzed against phosphate-buffered saline (PBS) (pH 7.2). IgA1 and
inflammatory effects of sialylated IgG53. It is possible that IgA1, IgA2 were separated using jacalin agarose (Thermo Scientific) according to the
but not IgA2 binds to similar receptors via its sialylated glycans. manufacturer’s instructions. IgA2 was collected with the flow through. IgA1 bound
to the agarose and was eluted with 0.1 M galactose buffer. Both IgA fractions were
Loss of these glycans or of sialic acid would abolish the interac- concentrated and buffered to PBS using Amicon Ultra Centrifugal Filters (Merck)
tion of IgA1 to these receptors and lead to increased pro- followed by treatment with Triton-X114 (Sigma) to remove possible traces of
inflammatory effects, as we have seen in our experiments. endotoxins. Traces of Triton-X114 were subsequently removed with detergent
However, at the moment, these concepts remains speculative and removal columns (Thermo Scientific). Protein concentration was determined with
the DC protein assay (Bio-Rad). Purity of IgA1 and IgA2 was tested with western
need to be investigated in future studies. blot analysis using antibodies against IgA1 and IgA2 (Southern biotech), as well as
Of note, in addition to N-glycans, IgA1 possesses several sites Coomassie staining to exclude contaminations by other serum proteins.
for O-glycosylation in its hinge region that accounts for half of IgA aggregates were obtained by heat aggregation at 63 °C for 30 min.
the sialic acid residues present in the IgA1 molecule. O-glycan-
bound sialic acid most likely contributed to the high difference in Isolation and stimulation of neutrophils. Neutrophils were freshly isolated from
sialylation detected in our lectin blot analysis between IgA1 and blood with ethylenediaminetetraacetic acid (EDTA) as coagulant from healthy
IgA2, and might also contribute to the differences in IgA1 and donors by standard density gradient centrifugation using Ficoll (Lymphoflot,
BioRad). After taking the polymorph nuclear cell (PMN) fraction, erythrocytes
IgA2 effector functions. Low levels in O-glycan galactosylation are were hypotonically lysed in two cycles with sterile water. All stimulation assays
associated with IgA immune complex formation and mesangial were performed in RPMI medium without phenol red and supplemented with 1%
IgA deposition in IgA-mediated nephropathy54–56. If O-glycan penicillin/streptomycin and 1% glutamin (both Gibco, Invitrogen).
sialylation plays a role as well is less understood, but might be For NET formation assays, neutrophils were plated in 96-well microplates
(Ibidi) at a concentration of 0.75 × 10⁶ cells/ml together with 2.5 µM Sytox Green
possible. From our experiments, we can’t say if the increased pro- (Invitrogen) for visualization of extracellular DNA. After addition of the indicated
inflammatory effects of desialylated IgA1 are because of N- or O- amounts of IgA, heat aggregated IgA or HSA (Sigma), the plate was placed in a live
glycan desialylation. However, treatment with PNGaseF, cleaving cell imaging chamber of a BZ-X710 microscope (Keyence) and kept at 37 °C and
only N-glycans, also profoundly increased the inflammatory 5% CO2. Every 10–15 min pictures were taken. The area of Sytox Green-positive
events was analyzed by Photoshop CS5 software and normalized on the number of
properties of IgA1, demonstrating the importance of N-gly- cells present at the first measured time point.
coslyation for the regulation of IgA1 effector functions. Whether For Fc receptor studies, blocking antibodies against FcαRI (clone MIP8a,
both N-glycosylation sites are involved in this regulation and BioRad), FcγRI (clone 10.1), FcγRIII (clone 3G8), or isotype control (mouse IgG1,
NATURE COMMUNICATIONS | (2020)11:120 | https://doi.org/10.1038/s41467-019-13992-8 | www.nature.com/naturecommunications 9ARTICLE NATURE COMMUNICATIONS | https://doi.org/10.1038/s41467-019-13992-8
κ, all Biolegend) were used at a concentration of 10 µg/ml. Neutrophils were Uncropped blot images can be found in the Source Data file.
incubated with the antibodies for 5 min before aggregated IgAs were added.
For the characterization of pathways involved in NET formation, inhibitors
against NOX (=DPI) and PAD4 (=GSK484, all Sigma) were used at a IgA glycosylation analysis by mass spectrometry. An equivalent of 20 µg of
concentration of 1 µM. In addition, the stimulators PMA and ionophore A23187 IgA1 or IgA2 eluate isolated from sera of 12 healthy donors (age 40–62 years; 75%
(all Sigma) were used at concentrations of 10 nM and 4 µM, respectively. female) was dried and redissolved in 10 µl of 100 mM Tris buffer (pH 8.5) con-
For signaling studies inhibitors against Syk (=R406), Erk (=PD98059) and Shp- taining 1% sodium deoxycholate, 10 mM Tris(2-carboxyethyl)phosphine, and 40
2 (=SHP099, all Axon Medchem) were used at the indicated concentrations. mM chloroacetamide. Denaturation, reduction, and alkylation was performed for
Neutrophils were incubated with the inhibitors or DMSO as solvent control for 5 5 min at 95 °C. After cooling, 500 ng of sequencing grade trypsin (Promega) were
min before aggregated IgAs or HSA were added. added in 50 µl ammonium bicarbonate buffer (pH 8.5) and incubated overnight at
For measurement of cytokine production, neutrophils were seeded at a density 37 °C. Afterward, SDS was precipitated with 2% formic acid. Liquid
of 10 × 106 cells/ml and stimulated with 200 µg/ml of heat aggregated IgA or HSA. chromatography–mass spectrometry (MS) analysis of IgA tryptic glycopeptides
After 4 h, the supernatant was centrifuged for 5 min at 4 °C and 10,000 × g to was performed as described previously34. In brief, (glyco-)peptides were separated
remove cell debris and stored at −20 °C for further analysis. Concentrations of on an Acclaim PepMap C18 column (particle size 2 μm, pore size 100 Å, 75 × 150
cytokines and chemokines were measured by multiplex bead technology mm, Thermo Scientific) and analyzed on a quadrupole-time-of-flight-MS (Impact
(Legendplex; BioLegend) and quantified by cytofluorometry with a Gallios HD, Bruker Daltonics) coupled via a Captive Sprayer nano-electrospray ionization
cytofluorometer and subsequent analysis with Kaluza Analysis 2.1 software (both source (Bruker Daltonics). Data were processed with LaCyTools version 1.1.0-
Beckman Coulter). alpha, build 20181102b58. Healthy donor IgA glycopeptides were taken from
previous reports, curated on basis of the existing data and relative quantities per
glycosylation site were extracted34. Derived traits calculations can be found in the
Investigation of cell viability. PMNs were isolated as described above, resus- same report.
pended in RPMI medium without phenol red that was supplemented with 1%
penicillin/streptomycin, 1% glutamin (both Gibco, Invitrogen) and 100 µg/ml HSA
(Sigma), and seeded in a 96-well cell culture plate (200 µl with 150,000 PMNs per Flow cytometry IgA binding studies to neutrophils and beads. Neutrophils
well). PMNs were first incubated with the indicated inhibitors or DMSO for 30 min were freshly isolated from EDTA-blood from healthy donors by standard density
at 37 °C and 5% CO2. In addition, some PMNs were heated for 5 min to 65 °C to gradient centrifugation using Ficoll (Lymphoflot, BioRad) followed by two cycles of
induce cell death (=positive control). A volume of 20 µl of alamarBlue reagent hypotonic erythrocyte lysis with sterile water. Purified neutrophils were kept in PBS
(Thermo scientific) was added to each well. Viability of the cells was analyzed in an supplemented with 2 mM EDTA and 2% FCS at a concentration of 2 × 10⁶ cells/ml
Infinite® 200 PRO plate reader (Tecan) at 37 °C and 5% CO2 by the assessment of and incubated with heat aggregated IgA at the indicated concentrations for 20 min
the absorbance at the wavelengths 570 and 595 nm every hour for a total of 4 h. at 4 °C. After washing, neutrophils were incubated with 1.25 µg/ml fluorescein
isothiocyanate (FITC)-labeled goat F(ab)2 anti-human IgA (#2052-02; Southern
Biotech) for 20 min at 4 °C.
Generation and stimulation of macrophages. Human monocytes were purified
Polystyrene beads (size 1 µm; Color Y; Estapor, Merck) were incubated with
by plastic adhesion of peripheral blood mononuclear cells that had been isolated
100 µg/ml IgA in PBS for 1 h at room temperature and constant agitation. After
from EDTA-blood of healthy donors using a Ficoll gradient (Lymphoflot, BioRad).
washing, the beads were incubated with 1.25 µg/ml FITC-labeled goat F(ab)2 anti-
Macrophages were generated in α-Mem (Invitrogen) supplemented with 10% fetal
human IgA (Southern Biotech) in PBS supplemented with 2 mM EDTA and 2%
bovine serum (Biochrome) and 1% penicillin/streptomycin (Invitrogen) in the
FCS for 20 min at 4 °C.
presence of 30 ng/ml macrophage colony-stimulating factor (Peprotech). After
Flow cytometry was performed on a Gallios cytofluorometer and evaluated
6 days, macrophages were detached using Cell Stripper (Corning) and seeded at a
using Kaluza Analysis 2.1 software (both Beckman Coulter). Cell or bead
concentration of 0.5 × 10⁶ cells/ml on plates coated with 50 µg/ml IgA1, IgA2, or
aggregates, dead cells, and cell debris were excluded. Delta mean fluorescence
HSA. After 4 h, the supernatant was centrifuged for 5 min at 4 °C and 10,000 × g to
intensity (ΔMFI) values were calculated by subtracting the MFI of neutrophils or
remove cell debris and stored at −20 °C for further analysis. Cytokine con-
beads stained with secondary antibody only.
centrations were measured as described above.
Measurement of IgA complex size. IgA complexes were generated by incubation Enzymatic desialylation and deglycosylation of IgA. For desialylation, 1 mg of
of IgA1 or IgA2 with a concentration of 5 mg/ml at 63 °C for 30 min. The human IgA1 or IgA2 was incubated with 200 U α2-3,6,8 neuraminidase (NEB) for
hydrodynamic size of the aggregates dispersed in PBS was acquired by dynamic 18 h at 37 °C. For deglycosylation, 1 mg of human IgA1 or IgA2 was incubated with
light scattering with a Malvern Nano ZS (Malvern Panalytical) in backscattered 1000 U PNGase F (NEB) for 18 h at 37 °C. The digestion efficiency was controlled
mode (173°) and at 25 °C. with lectin blot analysis. Digested IgA was purified over a peptide M column
(Invivogen) according to the manufacturer’s instructions and tested for endotoxin
contamination using a LAL chromogenic endotoxin quantitation kit (Thermo
Transmission electron microscopy. IgA complexes were generated by incubation scientific). Protein concentration was determined with the DC protein assay (Bio-
of IgA1 or IgA2 with a concentration of 535 mg/ml at 63 °C for 30 min. For the Rad).
transmission electron microscopy (TEM) negative staining, aggregated IgA solu-
tions were diluted in buffer containing 10 mM Hepes and 140 mM NaCl2 to a final
concentration of 15 µg/ml and coated on a 200 mesh copper grid supported carbon Serum IgA quantification in healthy donors and patients with RA. Sera were
film (Formovar, Plano). After 2 min incubation, the grid was washed with one obtained from patients with established RA presenting at the Department of
droplet of H2O and air-dried for 30 min at room temperature. Staining was per- Medicine 3 of the University Clinic of Erlangen and of age- and sex-matched
formed with 1% uranyl acetate for 2 min. The staining solution was removed with healthy volunteers. Disease activity was evaluated using the DAS28 score. Con-
filter paper and the grid was washed again with one droplet of H2O and air-dried centrations of total serum IgA, IgA1, and IgA2 was determined by ELISA using
for 30 min at room temperature. goat F(ab)2 anti-human IgA (#2052-01) as capture and HRP-coupled goat anti-IgA
The visualization of IgA aggregates was performed with a transmission electron (#2050-05), mouse anti-human IgA1 (#9130-05), or mouse anti-human IgA2
microscope (TEM 109, Zeiss) operating at 80 kV and magnifications between (#9140-05) as detection antibodies (all Southern Biotech). ACPA levels were
50,000× and 140,000×. determined using cyclic-citrullinated peptide-coated plates (Orgentec Diagnostika).
Gel electrophoresis and lectin blotting. IgA1 and IgA2 isolated from sera of Statistics. Statistical analysis was performed with GraphPad Prism 5.03 software.
healthy donors was resolved on a 10% sodium dodecyl sulfate For comparison of two groups, two-sided Student’s t-test with Welch’s correction
(SDS)–polyacrylamide gel under reducing conditions and transferred to a poly- for unequal standard error or paired two-sided Student’s t-test was used. Statistics
vinylidene difluoride membrane (Merk). After blocking with 3% deglycosylated for three or more groups were calculated with one-way analysis of variance
gelatin (Sigma), blots were incubated with horseradish peroxidase (HRP)-labeled (ANOVA) followed by either Dunnet’s correction for all columns versus the
goat anti-human IgA (1:10,000; #2050-05; Southern Biotech), biotinylated lens control column or Bonferroni correction for selected pairs of columns. Correlations
culinaris agglutinin (5 µg/ml; #B-1045) for the detection of the core glycan, bioti- were investigated with Pearson’s correlation coefficient. p < 0.05 was considered
nylated erythrina cristagalli lectin (5 µg/ml; #B-1145) for galactose detection, or significant. Data are presented as scatter plots with mean ± s.e.m. or box plots with
biotinylated sambuccus nigra lectin (2 µg/ml; #B-1305; all vector laboratories) for medians and inter-quartile ranges + whiskers ranging from min to max. All ana-
sialic acid detection, followed by incubation with HRP-labeled streptavidin (1:500; lyses were performed in a blinded manner.
# DY998; R&D). Detection was performed with chemoluminescence reagent (ECL;
Thermo Scientific) on a chemilumineszenz-imager (Celvin S 320+, Biostep). Band
intensities were quantified with Photoshop CS5 software. Study approval. All analyses involving human blood samples were performed in
For protein staining of the light chains, IgA1, IgA2, and IgG isolated from accordance to the Declaration of Helsinki principles, the institutional guidelines
mixed sera of healthy donors was resolved on a 15% SDS–polyacrylamide gel under and with the approval of the Ethical Committee of the University Clinic of
reducing conditions with subsequent staining with Imperial™ Protein Stain Erlangen (Permit 277_17 B and 98_18 B). All individuals provided informed
(Thermo Scientific) according to the manufacturers’ instructions. consent prior to participation in the study.
10 NATURE COMMUNICATIONS | (2020)11:120 | https://doi.org/10.1038/s41467-019-13992-8 | www.nature.com/naturecommunicationsYou can also read