Measurement report: The effect of aerosol chemical composition on light scattering due to the hygroscopic swelling effect - Recent
←
→
Page content transcription
If your browser does not render page correctly, please read the page content below
Atmos. Chem. Phys., 21, 9977–9994, 2021
https://doi.org/10.5194/acp-21-9977-2021
© Author(s) 2021. This work is distributed under
the Creative Commons Attribution 4.0 License.

Measurement report: The effect of aerosol chemical composition on
light scattering due to the hygroscopic swelling effect
Rongmin Ren1 , Zhanqing Li2 , Peng Yan3 , Yuying Wang4 , Hao Wu5 , Maureen Cribb2 , Wei Wang1 , Xiao’ai Jin1 ,
Yanan Li3 , and Dongmei Zhang1
1 StateKey Laboratory of Remote Sensing Science, College of Global Change and Earth System Science,
Beijing Normal University, Beijing 100875, China
2 Earth System Science Interdisciplinary Center, Department of Atmospheric and Oceanic Science,

University of Maryland, College Park, MD, USA
3 Centre for Atmosphere Watch and Service, Meteorological Observation Center of China Meteorological Administration,

Beijing, China
4 Key Laboratory for Aerosol–Cloud–Precipitation of China Meteorological Administration, School of Atmospheric Physics,

Nanjing University of Information Science and Technology, Nanjing 210044, China
5 School of Electrical Engineering, Chengdu University of Information Technology, Chengdu 610225, China

Correspondence: Zhanqing Li (zli@atmos.umd.edu)

Received: 4 December 2020 – Discussion started: 18 January 2021
Revised: 18 May 2021 – Accepted: 19 May 2021 – Published: 2 July 2021

Abstract. Liquid water in aerosol particles has a significant      better describe deliquescence and reduces uncertainties in
effect on their optical properties, especially on light scatter-   simulating aerosol hygroscopicity.
ing, whose dependence on chemical composition is inves-
tigated here using measurements made in southern Beijing
in 2019. The effect is measured by the particle light scat-
tering enhancement f (RH), where RH denotes the relative           1   Introduction
humidity, which is found to be positively and negatively im-
pacted by the proportions of inorganic and organic matter,         Atmospheric aerosols have impacts on visibility, the earth–
respectively. Black carbon is also negatively correlated. The      atmosphere radiation budget, clouds, and precipitation via
positive impact is more robust when the inorganic matter           direct and indirect effects (IPCC, 2013). Both effects are as-
mass fraction was smaller than 40 % (R = 0.93, R: the Pear-        sociated with the hygroscopic properties of aerosols and rela-
son’s correlation coefficient), becoming weaker as the inor-       tive humidity (RH) of the atmosphere. The particle light scat-
ganic matter mass fraction gets larger (R = 0.48). A sim-          tering enhancement factor, f (RH, λ), is the ratio of the scat-
ilar pattern was also found for the negative impact of the         tering coefficient at an elevated RH level to that under a fixed
organic matter mass fraction. Nitrate played a more signif-        low RH level (usually RH < 40 %) at a certain light wave-
icant role in aerosol hygroscopicity than sulfate in Beijing.      length (λ). It has been characterized during international field
However, the deliquescence point of ambient aerosols was at        experiments (Fierz-Schmidhauser et al., 2010a, b; Zieger et
about RH = 80 % when the ratio of the sulfate mass concen-         al., 2010, 2014) and in particular China (Yan et al., 2009;
tration to the nitrate mass concentration of the aerosol was       Zhang et al., 2015; Kuang et al., 2016; L. Liu et al., 2018;
high (mostly higher than ∼ 4). Two schemes to parameterize         C. Zhao et al., 2019; Zhao, 2019; Wu et al., 2020).
f (RH) were developed to account for the deliquescent and             Aerosol chemical composition has a strong impact on
non-deliquescent effects. Using only one f (RH) parameteri-        aerosol hygroscopicity (Fierz-Schmidhauser et al., 2010a, b;
zation scheme to fit all f (RH) processes incurs large errors.     Wang et al., 2017, 2018, 2019). Zhang et al. (2015) stud-
A piecewise parameterization scheme is proposed, which can         ied the relationship between the scattering enhancement fac-
                                                                   tor and chemical composition in Lin’an, China, finding that

Published by Copernicus Publications on behalf of the European Geosciences Union.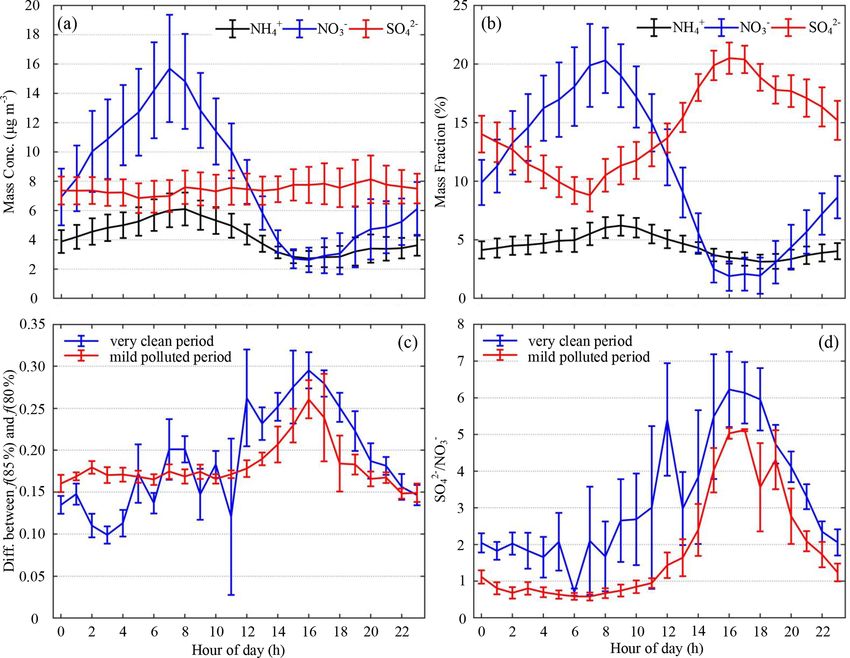
9978                                                                                         R. Ren et al.: Measurement report

nitrate has a stronger effect on aerosol hygroscopicity than       this deliquescent phenomenon to improve model simulations
sulfate has, which is partially due to the rigid control of sul-   of aerosol hygroscopicity.
fur dioxide (SO2 ) that reduces the amount of sulfate and in-         In this study, f (RH, λ) at three wavelengths for RH rang-
creases the content of nitrite (Morgan et al., 2010). Apart        ing from 40 % to about 90 % was measured by a high-
from sea salt emissions and gypsum dust emissions during           resolution humidified nephelometer system deployed in the
construction containing sulfate, sulfate is mainly formed by       southern suburban area of Beijing, China. Other aerosol
the oxidation of its gaseous precursor, SO2 , in the atmo-         chemical and physical properties were also simultaneously
sphere. In recent years, SO2 emissions have been reduced           measured. Humidograms were classified into two categories,
substantially through a series of effective measures taken in      i.e., deliquescent and non-deliquescent, each parameterized
China, like controlling the burning of loose coal and desul-       separately. The parameterization results of deliquescent pro-
furizing industrial equipment (Zhang et al., 2019). Reduc-         cesses agreed well with observations. This result is useful for
ing SO2 in the atmosphere thus directly affects the reduction      improving simulations of f (RH, λ) of ambient aerosols dur-
in the sulfate content of aerosols. The saturated vapor pres-      ing deliquescence in the BTH metropolitan region.
sure of nitric acid (HNO3 ) is higher than that of sulfuric acid      The paper is organized as follows. Section 2 describes the
(H2 SO4 ), so the availability of ammonia (NH3 ) is key to the     instruments and methods. Section 3 presents and discusses
partitioning of HNO3 . HNO3 is often neutralized by NH3 af-        the results of this study, and Sect. 4 provides a summary.
ter H2 SO4 . Therefore, a reduction in SO2 means that more
NH3 can be used to neutralize HNO3 , leading to higher ni-
trate concentrations, such as ammonium nitrate (HN4 NO3 ),         2     Instruments and methods
in aerosols (Monks et al., 2009). Zieger et al. (2014) ana-
                                                                   2.1    Observation site
lyzed the correlation between the chemical composition of
aerosols and f (RH = 85 %, 550 nm) in Melpitz, Germany,            A comprehensive field experiment was conducted at the cli-
and noted negative and positive impacts by organic and black       mate observatory of the China Meteorological Administra-
carbon and by inorganic substances, such as ammonium, re-          tion, located in Yizhuang, Beijing, near the southern Fifth
spectively. However, the correlation between the mass frac-        Ring Beltway (39.81◦ N, 116.48◦ E) surrounded primarily
                                                   2−
tions of individual nitrate (NO−3 ) and sulfate (SO4 ) ions and    by residential communities and industrial parks (Fig. S1 in
f (RH = 85 %, 550 nm) were weak. Zieger et al. (2015) also         the Supplement). Measurements made here can character-
found that the mass fraction of sulfates was strongly cor-         ize the aerosol chemical and physical properties of a typ-
related with scattering enhancement, while the mass frac-          ical suburban area of this megacity in the North China
tion of nitrates had a low correlation in Hyytiälä, Finland.       Plain. Equipped with a multitude of instruments measuring,
Jin et al. (2020) reported that apart from inorganic matter,       for example, optical, hygroscopic, and chemical properties
e.g., SO2−           −
         4 and NO3 , organic species also significantly con-       of aerosols (Z. Li et al., 2019), this study employs only
tributed to the aerosol liquid water content. They proposed        those measurements acquired from 19 September to 4 Oc-
that in the initial phase of a pollution event, the aerosol liq-   tober 2019. The instruments used in this field experiment in-
uid water content contributed by organic matter accelerated        clude a dual-nephelometer system (Aurora 3000, Ecotech),
aqueous-phase reactions, converting gaseous precursors into        an aerosol chemical speciation monitor (ACSM; Aerodyne
secondary aerosols which then absorb more liquid water.            Research Inc.), and a seven-wavelength aethalometer (AE33,
   Air pollution has been and continues to be a serious prob-      Magee Scientific). They were all located in a mobility con-
lem in China, especially in megacities like Beijing. A high        tainer on the ground. There are two air conditioners inside the
scattering enhancement factor is one of the most important         container whose temperature was maintained at about 23◦ C.
factors causing degradation in visibility. Some observational      Sample air (16.7 L min−1 ) went through a PM2.5 cyclone in-
studies of the light hygroscopicity enhancement factor in          let at about 4 m above the ground, which only allowed par-
Beijing have been conducted (Liu et al., 2013; Yang et al.,        ticles with an aerodynamic diameter smaller than 2.5 µm to
2015; Zhao et al., 2018; P. Zhao et al., 2019). However, stud-     enter, and was then dried by a Nafion dryer (MD-700-36F-3,
ies exploring the relationship between aerosol chemical com-       Perma Pure LLC). The average RH within the sampling line
position and the particle light scattering enhancement fac-        was about 30 %. The sample air was not heated.
tor are lacking. Moreover, although several optimal expres-
sions of f (RH, λ) for different seasons have been developed       2.2    Instruments
(Pan et al., 2009; Yan et al., 2009; Kuang et al., 2016; Wu
et al., 2017; Yu et al., 2018; P. Zhao et al., 2019), param-       A dual-nephelometer system with a high time resolution was
eterization of the deliquescent curve of SO2−    4 in ambient      used to measure the particle light scattering enhancement
aerosols has not yet been done for the Beijing–Tianjin–Hebei       factor of aerosol. After an aerosol sample passed through the
(BTH) metropolitan region, where aerosol deliquescent phe-         Nafion dryer, the dry sample flow (RH < 40 %) was divided
nomena frequently occur (Kuang et al., 2016). It is thus im-       into two routes. One sample flow (5 L min−1 ) went directly
portant to develop an optimal parameterization to describe         into the dry nephelometer. The other sample flow (5 L min−1 )

Atmos. Chem. Phys., 21, 9977–9994, 2021                                             https://doi.org/10.5194/acp-21-9977-2021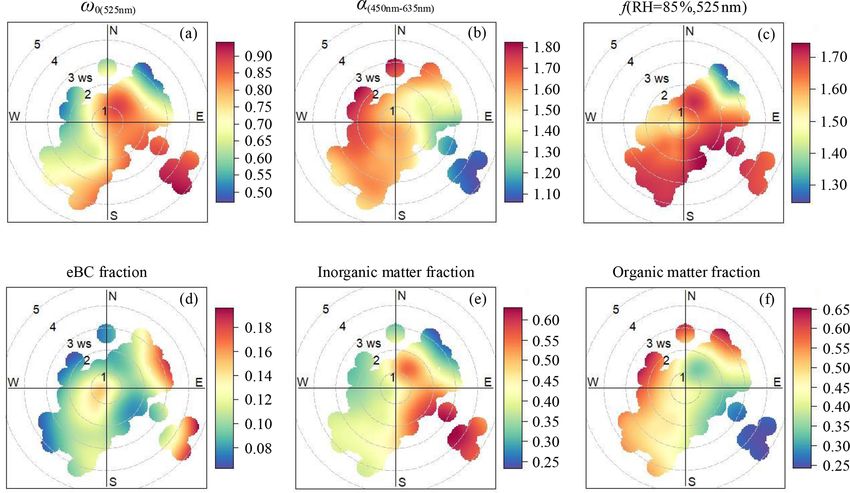
R. Ren et al.: Measurement report                                                                                                  9979

passed through an annular concentric humidifying tube (MD-         RHoutlet and Toutlet were used to calculate Tdew-point at this
700-6F-3, Perma Pure LLC). The water vapor controlled by           position using Eq. (1) (Wanielista et al., 1997; James et al.,
the temperature of the liquid water in the outer annulus of        2015):
the tube passes through a Nafion membrane, humidifying
                                                                                    1
aerosols in the inner tube (Carrico et al., 1998). The tem-                       8
                                                                   Tdew-point = RHoutlet (112 + 0.9Toutlet ) + 0.1Toutlet − 112.    (1)
perature of the liquid water was controlled by adjusting the
power of the water baths. The sample flow was then humidi-         We assume that Tdew-point was approximately the same as that
fied to a given RH and channeled into the wet nephelometer.        in the optical chamber of the wet nephelometer. Based on the
The scattering coefficients under dry (the mean ± standard         temperature in the optical chamber (Tchamber ) and Tdew-point ,
deviation value of RH was 28.75 ± 5.50 %) and wet ambient          the actual RH in the optical chamber (RHchamber ) can be cal-
conditions were measured synchronously by the two neph-            culated by rearranging Eq. (1), i.e.,
elometers (Yan et al., 2009). To improve the performance of
this system and to decrease the amount of time needed to un-                        112 − 0.1Tchamber + Tdew-point
                                                                   RHchamber =                                       .       (2)
dergo one aerosol humidifying process, two water baths were                              112 + 0.9Tchamber
used in turn to heat the water circulating in the interior layer
of the humidifying tube (Liu and Zhao, 2016).                      The dual-nephelometer system with a high time resolu-
    Since the RH of aerosols inside the nephelometers was          tion in this study was calibrated with ammonium sulfate,
constantly changing and real measured data at every moment         (NH4 )2 SO4 , whose deliquescence RH (DRH) was 80 % at
were needed, the nephelometers operated without Kalman             298 K (Cheung et al., 2015). Figure S4 shows that the mea-
filters. Manual “full calibration” and zero check and span         sured phase transition occurs at RH = 80.37 %. It illustrates
check of the two nephelometers were performed at 10:30 (all        that the RH inside the nephelometer chamber is correct and
times in Beijing time, UTC + 8 h) on 19 September 2019.            that the system is functioning properly.
The calibration tolerance of the zero check was ± 2 Mm−1 ,            An ACSM measured the mass concentrations of non-
and that of the span check was ± 2 % of the span point. Cal-       refractory aerosol chemical species, including SO2−
                                                                                                                     4 , NO3 ,
                                                                                                                              −
                                                                                     +
ibrations of the two nephelometers in the dry state were con-      ammonium (NH4 ), chlorine (Chl), and organics (Orgs) in
sistent (Fig. S2). The truncation and illumination correction      particulate matter with diameters less than 2.5 µm (PM2.5 ).
of the scattering coefficients has been done following Müller      The mass concentration of the equivalent black carbon (eBC)
et al. (2011), which was developed specifically for Ecotech        could be retrieved from the measurements of AE33. The Chi-
nephelometers originating from Anderson and Ogren (1998)           nese Ministry of Ecology and Environment network and the
for TSI nephelometers. For the f (RH) calculations, there          Beijing Municipal Environmental Monitoring Center (http:
is no truncation and illumination correction applied to the        //106.37.208.233:20035/, last access: 1 June 2021 and http:
scattering coefficients of both dry and humidified types of        //www.bjmemc.com.cn/, last access: 1 June 2021) provided
nephelometer. The comparison of the deviation between cor-         mass concentrations of PM2.5 measured at the Yizhuang sta-
rected and uncorrected f (RH = 85 %, 525 nm) is shown in           tion, about 3 km southeast of the observatory. The LI-COR
Fig. S3. The linear least square regression slop ± standard        eddy covariance system (this system includes WindMaster
deviation is 1.064 ± 0.002, the intercept ± standard devia-        Pro, LI-7500A, and Smart2-00171, LI-COR) measured vari-
tion is −0.082 ± 0.004, and R is 0.999. The fitted line is         ous meteorological parameters.
very close to the line of 1 : 1. The uncorrected f (RH = 85 %,
525 nm) is a little lower than the corrected f (RH = 85 %,         2.3   Methods
525 nm).
                                                                   The particle light scattering enhancement factor, f (RH, λ),
    Because the RH levels measured by the probe built into the
                                                                   is defined as
optical chamber of the wet nephelometer (RHchamber ) were
imprecise, the RHchamber was corrected in this paper. First,                      σsp (RH, λ)
a set of calibrated RH and temperature probes was placed at        f (RH, λ) =                   ,                                  (3)
                                                                                 σsp (RHdry , λ)
the inlet of the wet nephelometer, and another set was placed
at the outlet of the wet nephelometer, obtaining 1 min av-         where σsp (RH, λ) represents the scattering coefficient at an
erages of RH and temperature. We used Vaisala HMP110               elevated RH (usually RH > 40 %), and σsp (RHdry , λ) is the
probes with accuracies of ± 0.2◦ C for the 0–40◦ C tempera-        scattering coefficient in the dry state (usually RH < 40 %)
ture range and ± 1.5 % RH and ± 2.5 % RH for the 0 % RH–           at wavelength λ. Values of f (RH, λ) are generally greater
90 % RH and 90 % RH–100 % RH ranges, respectively. The             than 1 and increase with increasing RH. In this study, we as-
temperatures measured by these three probes were different.        sume that the aerosol is in the dry state when RH < 40 %.
However, in principle, the dew point temperatures (Tdew-point )    This means that in theory, f (RH) should equal 1 when
at these three positions are all the same. Since the RH and        RH is lower than 40 %. However, due to systematic er-
temperature probes at the outlet of the wet nephelometer           rors and differences in RH measured synchronously by the
(RHoutlet and Toutlet ) were less affected by the humidifier,      dry nephelometer and the wet nephelometer, the measured

https://doi.org/10.5194/acp-21-9977-2021                                                Atmos. Chem. Phys., 21, 9977–9994, 2021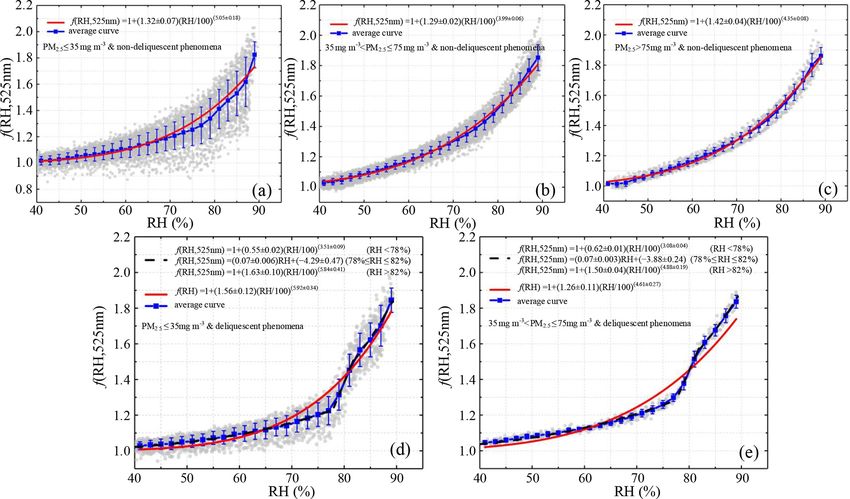
9980                                                                                       R. Ren et al.: Measurement report

f (RH < 40 %) has small fluctuations and does not equal 1.       found. However, when the value of γ>82 % is much higher
Therefore, f (RH > 40 %) was normalized as                       than γ 40 %)                     iquescence occurring in the RH range of 78 % to 82 %. Here,
f (RH > 40 %)normalized =                           . (4)
                            f (RH < 40 %)averaged                when η is higher than 0.4, deliquescence occurs.

Here, f (RH < 40 %)averaged is the corrected coefficient av-
eraged over the whole dataset of RH < 40 %.                      3     Results and discussion
   The absorption coefficient of PM2.5 at 520 nm was calcu-
lated by the eBC monitor (Han et al., 2015; Zou et al., 2019).   3.1    Overview
To facilitate comparisons, absorption coefficients at 520 nm
were transformed into those at 525 nm by assuming that the       Figure 1 depicts the hourly averaged time series of the
absorption coefficient is inversely proportional to the wave-    light-scattering coefficient (σsp,525 nm ), the absorption coef-
length (Bond and Bergstrom, 2006; C. Liu et al., 2018). The      ficient (σap,525 nm ), the single-scattering albedo (ω0(525 nm) ),
quantity ω0(525 nm) is the aerosol single-scattering albedo at   the scattering Ångström exponent (α(450−635 nm) ), and the
525 nm. The dependence of light scattering on wavelength         particle light scattering enhancement factor at RH = 85 %,
is described by the Ångström exponent (α(λ1 −λ2 ) ), an index    f (RH = 85 %, 525 nm), at the main observatory, and the
describing the particle size:                                    mass concentration of PM2.5 measured at the Yizhuang
                                                                 station from 19 September to 4 October 2019. During
               logσsp (λ1 ) − logσsp (λ2 )                       this period, the hourly averaged σsp,525 nm ranged from 3
α(λ1 −λ2 ) =                               .               (5)
                    logλ2 − logλ1                                to 799 Mm−1 (Fig. 1a), with a mean ± standard devia-
                                                                 tion value of 245 ± 168 Mm−1 (Table 1). The hourly av-
Here, α(450−635 nm) between 450 and 525 nm was calculated        eraged σap,525 nm varied from 7 to 135 Mm−1 (Fig. 1b),
using Eq. (5).                                                   with a mean ± standard deviation value of 50 ± 24 Mm−1
  The following parameter (Forg ) denotes the relative           (Table 1). Figure 1c and f show that ω0(525 nm) increased
amount of organic and inorganic matter:                          as the PM2.5 concentration increased. The hourly aver-
           Cc                                                    aged ω0(525 nm) during the observation period ranged from
Forg =           ,                                         (6)   0.24 to 0.98, with an overall mean ± standard deviation
         Cc + Ci
                                                                 value of 0.77 ± 0.15. The mean ± standard deviation val-
where Cc is the organic matter mass concentration mea-           ues of ω0(525 nm) during clean (PM2.5 ≤ 35 µg m−3 ), moder-
sured by the ACSM, and Ci represents the mass concentra-         ately polluted (35 µg m−3 < PM2.5 ≤ 75 µg m−3 ), and heav-
tion of inorganic salts like (NH4 )2 SO4 , ammonium bisulfate    ily polluted (PM2.5 > 75 µg m−3 ) periods were 0.65 ± 0.16,
(NH4 HSO4 ), and ammonium nitrate (NH4 NO3 ).                    0.83 ± 0.08, and 0.93 ± 0.04, respectively (Table 1).
   Deliquescence of ambient aerosols was present through-           The ω0(525 nm) increased as PM2.5 pollution increased, in-
out the study period. To identify this process and describe      dicating that during the contamination process, the propor-
its magnitude in the 78 % RH–82 % RH range, the hysteresis       tion of aerosol components with strong scattering proper-
index η is defined as (Zieger et al., 2010)                      ties increased, and the proportion of aerosol components
                                                                 with strong absorbing properties decreased. Higher values
          γ82 %                                                 the northeast at a speed of 1–2 m s−1 and when relatively
The terms γ82 % are the fit parameters of the        stronger winds were from the southeast (Fig. 2a), which was
f (RH) parametrization scheme,                                   frequently accompanied by a high proportion of inorganic
                                                                 matter (Fig. 2e) and low proportions of eBC (Fig. 2d) and
f (RH) = (1 − RH)−γ ,                                      (8)   organic matter (Fig. 2f). Figure 1d shows that the range of
                                                                 α(450−635 nm) was narrow at most times during the obser-
at RH < 78 % and RH > 82 %, respectively. The parameter          vation period. Relatively larger particles with lower values
γ is retrieved from Eq. (8) using the whole RH range. It         of α(450−635 nm) generally occurred when weak winds were
can replace f (RH) in a wider RH range (Doherty et al.,          from the east and southeast (Fig. 2b).
2005; Quinn et al., 2005; Zhang et al., 2015). The theo-            During the observation period, f (RH = 85 %, 525 nm)
retical range of η is 0 to 1. The γ82 % terms,       ranged from 1.15 to 1.86, meaning a 1.15- to 1.86-fold
respectively, represent the magnitudes of the scattering en-     increase in the scattering coefficient at RH = 85 % com-
hancement when RH < 78 % and RH > 82 %. If the values            pared to dry conditions (Fig. 1e). Daily average values of
of γ82 % are about the same, then η will be close    f (RH = 85 %, 525 nm) varied between 1.32 and 1.74, with
to 0. This suggests that f (RH) increases slowly and con-        low values (< 1.40) on 19 and 24 September and rela-
tinuously when 78 % < RH < 82 %, and no deliquescence is         tively high values (> 1.70) on 22 and 28 September and

Atmos. Chem. Phys., 21, 9977–9994, 2021                                            https://doi.org/10.5194/acp-21-9977-2021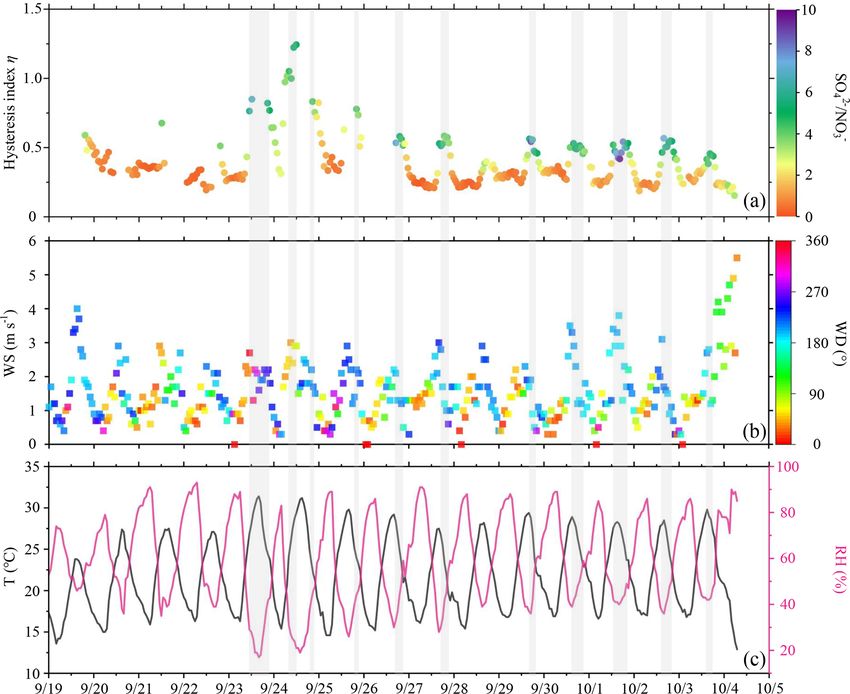
R. Ren et al.: Measurement report                                                                                                      9981

Figure 1. Hourly averaged time series (18 September to 4 October 2019) of the (a) scattering coefficient (σsp,525 nm ) measured by the dry
nephelometer (unit: Mm−1 ), (b) absorption coefficient (σap,525 nm ; unit: Mm−1 ), (c) single-scattering albedo (ω0(525 nm) ), (d) scattering
Ångström exponent (α(450−635 nm) ), (e) particle light scattering enhancement factor at RH = 85 % (f (RH = 85 %, 525 nm)), and (f) mass
concentration of PM2.5 (unit: µg m−3 ) measured at the Yizhuang station. The segments of the time series with a blue background represent
the occurrence of deliquescence. The timescale is Beijing time (UTC + 8 h). The date in this figure is in the month/day format.

2 October. Organic matter mass fractions were larger than                ganic matter mass fractions were relatively small when the
52 %, and inorganic matter mass fractions were generally                 f (RH = 85 %, 525 nm) was greater than 1.70. The campaign
smaller when f (RH = 85 %, 525 nm) was less than 1.40.                   mean ± standard deviation values of f (RH = 85 %, 525 nm)
However, high values of f (RH = 85 %, 525 nm) in this                    were 1.64 ± 0.13 (Table 1). Figure 2c reveals that strongly
study were often closely correlated with large fractions of              hygroscopic aerosols with high values of f (RH = 85 %,
                                        2−
water-soluble ions, such as NO−
                              3 and SO4 , in PM2.5 . Inor-               525 nm) primarily came from the southeast sector. The pro-
ganic matter mass fractions were larger than 53 %, and or-               portion of secondary inorganics with strong hygroscopic

https://doi.org/10.5194/acp-21-9977-2021                                                   Atmos. Chem. Phys., 21, 9977–9994, 2021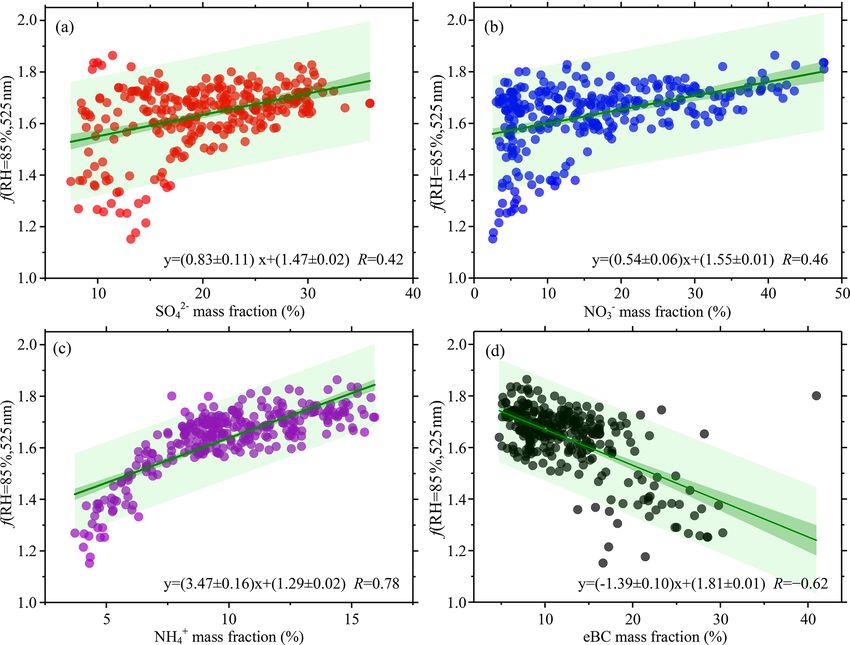
9982                                                                                                 R. Ren et al.: Measurement report

Table 1. Average σsp,525 nm , σap,525 nm , ω0(525 nm) , α(450−635 nm) , f (RH = 85 %, 525 nm), and PM2.5 mass concentration values at different
pollution levels.

                                                       Entire                PM2.5 pollution levels (µg m−3 )
                                                 observation       Very clean     Moderately polluted     Heavily polluted
                                                      period     (PM2.5 ≤ 35)      (35 < PM2.5 ≤ 75)        (PM2.5 > 75)
                   σsp,525 nm (Mm−1 )              245 ± 168           89 ± 45                279 ± 93            530 ± 75
                   σap,525 nm (Mm−1 )                 50 ± 24          43 ± 21                 51 ± 20              50 ± 27
                   ω0(525 nm) (–)                 0.77 ± 0.15      0.65 ± 0.16             0.83 ± 0.08          0.93 ± 0.04
                   α(450−635 nm) (–)              1.55 ± 0.16      1.58 ± 0.15             1.54 ± 0.15          1.33 ± 0.13
                   f (RH = 85 %, 525 nm) (–)      1.64 ± 0.13      1.49 ± 0.16             1.70 ± 0.06          1.7 1± 0.05
                   PM2.5 (µg m−3 )                   44 ± 25            22 ± 9                 51 ± 12               90 ± 9

Figure 2. Wind dependence of (a) the single-scattering albedo (ω0(525 nm) ), (b) the scattering Ångström exponent (α(450−635 mm) ), (c) the
particle light scattering enhancement factor at RH = 85 % (f (RH = 85 %, 525 nm)), (d) the mass fraction of eBC, (e) the mass fraction of
inorganic matter, and (f) the mass fraction of organic matter. The circular contours show the average change in wind speed and direction.

abilities in aerosols from this direction was high, while the             hygroscopicity, such as organic matter and eBC, increased
proportion of organic matter with weak hygroscopic abilities              with increasing northeasterly wind speeds (Fig. 2d, f). Fur-
was low (Fig. 2e–f). Figure 2d indicates that the mass frac-              thermore, aerosols from the southwest and southern sectors
tion of eBC with weak hygroscopicity was slightly low in the              within the wind-speed range of 2 to 4 m s−1 had higher scat-
southeast sector when wind speeds were lower than 4 m s−1 .               tering enhancement factors (Fig. 2c) mainly because of the
However, when wind speeds were higher than 4 m s−1 , the                  deliquescence of sulfates in the ambient aerosols. The spe-
mass fraction of eBC was relatively high in this direction.               cific reasons are explained in detail in Sect. 3.3. Figure S5
Of all data associated with southeast winds, only three cases             shows that apart from the lower values (10th percentile val-
were identified with wind speeds higher than 4 m s−1 , likely             ues in Table S1), a small wavelength dependence in scat-
winds of short duration so not representative. In the northeast           tering enhancement factor is found in all other percentiles,
direction, high values of f (RH = 85 %, 525 nm) occurred                  with a stronger wavelength dependence for high values of
when the wind speed was lower than 2 m s−1 . The hygro-                   f (RH = 85 %). Zieger et al. (2014) and Zhang et al. (2015)
scopic capacity of aerosols also weakened as the wind speed               obtained similar results for Melpitz, Germany, and Lin’an,
increased (Fig. 2c). The proportion of secondary inorganics               China, respectively.
with strong hygroscopicity decreased with increasing wind                    Figure S6a to b show the time series of mass concentra-
speed (Fig. 2e), while the proportion of substances with weak             tions and mass fractions, respectively, of submicron aerosols,

Atmos. Chem. Phys., 21, 9977–9994, 2021                                                      https://doi.org/10.5194/acp-21-9977-2021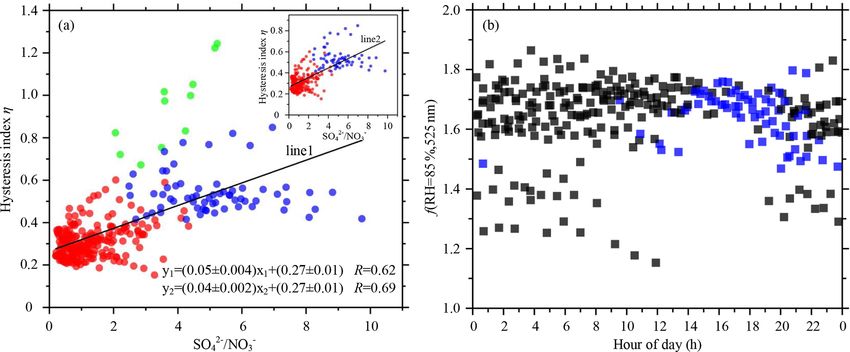
R. Ren et al.: Measurement report                                                                                           9983

i.e., organic matter, nitrate, sulfate, ammonium, chloride, and   mass fraction had the strongest positive correlation (R =
eBC in PM2.5 . The rightmost pie chart in Fig. S6c shows          0.78) with f (RH = 85 %, 525 nm) (Fig. 3c). The reason is
that during the entire observation period, organic matter was     that ammonium is the common positive ion of (NH4 )2 SO4
the major component of PM2.5 , accounting for 39 %. Ni-           and NH4 NO3 , two major salts of inorganic substances in
trate and sulfate comprised similar fractions of PM2.5 , i.e.,    aerosols. The relationship between f (RH = 85 %, 525 nm)
21 % and 19 %, respectively. The mass fraction of nitrate         and ammonium is thus similar to that between f (RH = 85 %,
was slightly larger than that of sulfate. Note that eBC ac-       525 nm) and inorganic content. The hygroscopic properties
counted for 11 % of PM2.5 during the entire measurement           were different for NH4 NO3 and (NH4 )2 SO4 . As expected,
period. Two special periods were noted. One started in the        f (RH = 85 %, 525 nm) was positively correlated with the
afternoon of 21 September and ended late morning on 22            sum of the nitrate and sulfate mass fractions (slope = 1.03
September (Sect. I in Fig. S6a). First, the concentrations of     and R = 0.79; Fig. S8), similar to the correlation between
all chemical components during this period were high. As          f (RH = 85 %, 525 nm) and the inorganic mass fraction. Wu
shown by the leftmost pie chart in Fig. S6c, the mass frac-       et al. (2017) and Zieger et al. (2014) reported similar results.
tion of nitrate was the largest, accounting for 33 % of the to-      Figure 4 shows f (RH = 85 %, 525 nm) as a function of
tal mass fraction on average, lasting a long time. However,       the mass fractions of organic and inorganic matter. The mass
compared with the proportion of inorganic matter (66 %),          fractions of inorganic and organic matter were respectively
the mass fraction of organic matter was much smaller, ac-         calculated by dividing inorganic matter (the sum of nitrate,
counting for 27 % of the total mass fraction. Accordingly,        sulfate, ammonium, and chloride) and organic matter mass
the f (RH = 85 %, 525 nm) remained at a high level during         concentrations by the total mass concentration. The inorganic
this period (Fig. 1e). The other special period was on 24         mass fraction was positively correlated with f (RH = 85 %,
September (Sect. II in Fig. S6a). The mass concentrations         525 nm) because of the high hygroscopicity of the inorganic
of all aerosol species remained low. The middle pie chart in      compounds, while organic substances were negatively cor-
Fig. S6c clearly demonstrates that organic matter comprised       related with f (RH = 85 %, 525 nm) because of their lower
the main fraction of PM2.5 , accounting for 55 % on average,      hygroscopicity (P. Zhao et al., 2019). Both correlation coef-
followed by eBC. The fraction of nitrate was especially small     ficients were similar to those from previous studies (Zieger
during this clean period. The fraction of sulfate, accounting     et al., 2014; Zhang et al., 2015; Wu et al., 2017). Also, the
for 16 %, was 4 times that of nitrate, which was an advantage     absolute values of both the slopes and corresponding stan-
for deliquescence in this period (discussed in more detail in     dard deviations found here (0.80 ± 0.04 and 1.00 ± 0.06 for
Sect. 3.3). Although the proportions of hydrophobic organic       f (RH = 85 %, 525 nm) as a function of inorganic and or-
matter and eBC in aerosols during this period was very high,      ganic matter mass fractions, respectively) were similar to
f (RH = 85 %, 525 nm) was not the lowest during the whole         those reported in Lin’an, China (0.96 ± 0.02 and 1.20 ± 0.04,
observation period because the f (RH = 85 %, 525 nm) of           respectively; Zhang et al., 2015), but much lower than those
deliquescence was higher than the normal value. Note that         observed in Melpitz, Germany (2.2 ± 0.078 and 3.1 ± 0.1,
PM2.5 aerosols at the observatory in suburban Beijing were        respectively; Zieger et al., 2014). This might be because
faintly acidic during the observation period (Fig. S7), bene-     the f (RH = 85 %, 525 nm) measured in Melpitz, Germany,
fitting the hygroscopic enhancement of ambient aerosols.          was much higher than that in Lin’an and Beijing. Ambient
                                                                  aerosols in Melpitz, Germany, were partially affected by sea
3.2   The relationship between the particle light                 salt, like sodium chloride, transported from the North Sea
      scattering enhancement factor and aerosol                   and being highly hygroscopic. Marine aerosols have a higher
      chemical composition                                        hygroscopicity than aerosols influenced more by human ac-
                                                                  tivity.
Figure 3 displays f (RH = 85 %, 525 nm) as a function of the         Distinguishing between data points below and above the
main chemical component mass fractions. The total aerosol         40 % organic mass fraction level in Fig. 4, the absolute val-
mass concentration is the sum of mass concentrations of           ues of the linear regression slope and R for data below
all chemical constituents, including nitrate, sulfate, ammo-      40 % were lower than those for data above 40 %. How-
nium, chloride, and organic matter measured by the ACSM           ever, for the inorganic mass fraction (left panels of Fig. 4),
and eBC retrieved by the AE33. The mass fractions of indi-        the absolute values of the linear regression slope and R
vidual chemical components were calculated by respectively        for data below 40 % were higher than those for data above
dividing the mass concentrations of sulfate, nitrate, ammo-       40 %. This indicates that the positive correlation between
nium, and eBC by the sum of all chemical constituents. The        f (RH = 85 %, 525 nm) and the inorganic matter mass frac-
f (RH = 85 %, 525 nm) and eBC were negatively correlated,         tion was very strong when inorganic matter mass fractions
with a correlation coefficient R equal to −0.62 (Fig. 3d). A      were smaller than 40 %. However, when inorganic matter
positive correlation is seen between f (RH = 85 %, 525 nm)        mass fractions were larger than 40 %, the increasing ten-
and the three other inorganic substances’ mass fractions be-      dency in f (RH = 85 %, 525 nm) as the proportion of inor-
cause of their hygroscopic characteristics. The ammonium          ganic matter increased slowly decreased. Inversely, the neg-

https://doi.org/10.5194/acp-21-9977-2021                                           Atmos. Chem. Phys., 21, 9977–9994, 2021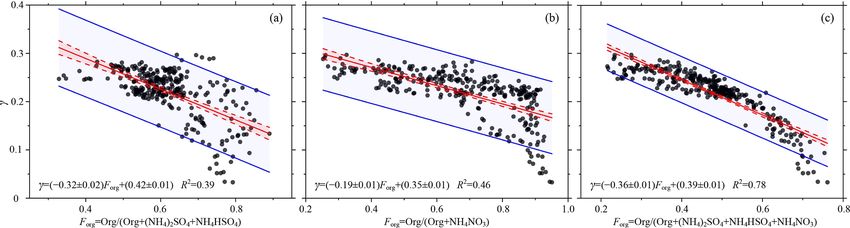
9984 R. Ren et al.: Measurement report
Figure 3. The particle light scattering enhancement factor f (RH = 85 %, 525 nm) as a function of different aerosol chemical component
mass fractions measured by the ACSM and the AE33: (a) sulfate (SO2− −
4 ) mass fraction, (b) nitrate (NO3 ) mass fraction, (c) ammonium
+
(NH4 ) mass fraction, and (d) the equivalent black carbon (eBC) mass fraction. Solid green lines represent bivariate linear regressions. The
dark-green shaded areas denote 95 % confidence levels, and the light-green shaded areas show the 95 % prediction bands for the fits. The
linear regression function and the Pearson’s correlation coefficient (R) are given in each panel.
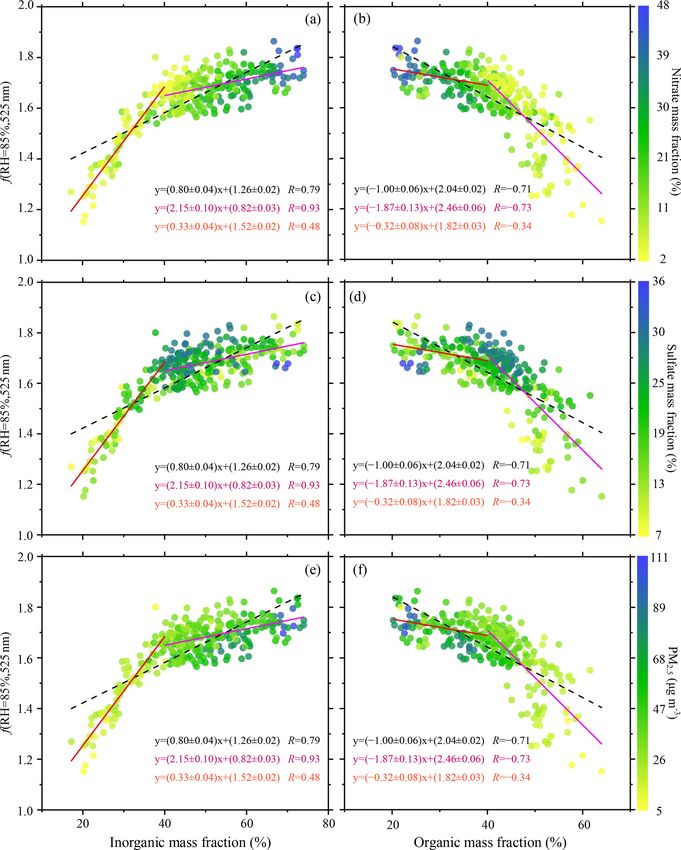
ative correlation between f (RH = 85 %, 525 nm) and the or- level of inorganic matter and a low level of organic matter
ganic matter mass fraction was slightly weak when organic is not as high as expected due to the compensating effect
matter mass fractions were smaller than 40 %. When organic between the size and the chemical composition of aerosol.
matter mass fractions were larger than 40 %, the decreasing Second, the higher mass concentration of ambient aerosols is
tendency in f (RH = 85 %, 525 nm) as the proportion of or- maybe another reason. Overall, when the mass concentration
ganic matter decreased became more robust. There may be of inorganic substances was less than 40 %, the total mass
several reasons for this phenomenon. First, particle size may concentration of aerosols was relatively low in this experi-
be one of the most important factors to explain this. For parti- ment. When the proportion of inorganic matter was higher
cles with strong hygroscopicity, if their particle number size than 40 %, the total mass concentration of aerosols was high,
distribution tends towards large particle sizes, their hygro- with a clear inhibiting effect of high aerosol mass concen-
scopic growth ability may be similar to that of smaller par- tration to the f (RH = 85 %, 525 nm) (Fig. 4e). Finally, it is
ticles with weak hygroscopicity (Zieger et al., 2010, 2013; also possible that when the proportion of inorganic matter is
Wang et al., 2017, 2018). On the one hand, the f (RH) of par- very high, aerosols absorb too much water vapor, leading to
ticles usually decreases with increasing particle size (Zieger insufficient ambient water vapor.
et al., 2013), resulting in a lower f (RH) for larger particles. The green dots in Fig. S9a and b represent deliquescence.
On the other hand, the larger particles’ amplification effect The range of inorganic mass fraction in these deliquescent
of scattering cross section because of hygroscopic growth is processes was from 30 % to 50 %, and the range of organic
weaker than that of smaller particles (Wu et al., 2017). It may mass fraction was from 40 % to 60 %. A comparison between
be that when there is a high proportion of inorganic matter Fig. 4a and c and b and d shows that the proportion of sulfate
and a low proportion of organic matter, the inorganic matter in the total aerosol was much higher than that of nitrate for
is mainly composed of relatively large particles. It is possi- these deliquescent processes. Meanwhile, the f (RH = 85 %,
ble that the f (RH = 85 %, 525 nm) of aerosols with a high 525 nm) of these deliquescent processes were all above the
Atmos. Chem. Phys., 21, 9977–9994, 2021 https://doi.org/10.5194/acp-21-9977-2021R. Ren et al.: Measurement report 9985 Figure 4. The particle light scattering enhancement factor f (RH = 85 %, 525 nm) as a function of organic matter mass fraction and inorganic matter mass fraction measured by the ACSM and the AE33: f (RH = 85 %, 525 nm) as a function of (a) inorganic matter mass fraction and (b) organic matter mass fraction colored by the nitrate mass fraction; f (RH = 85 %, 525 nm) as a function of (c) inorganic matter mass fraction and (d) organic matter mass fraction colored by the sulfate mass fraction; and f (RH = 85 %, 525 nm) as a function of (e) inorganic matter mass fraction and (f) organic matter mass fraction colored by the mass concentration of PM2.5 . Dotted black lines denote bivariate linear regressions. The red and magenta lines are the best-fit linear regression lines through data points associated with mass fractions smaller than 40 % and larger than 40 %, respectively. The linear regression functions and the Pearson’s correlation coefficients (R) are given in each panel. https://doi.org/10.5194/acp-21-9977-2021 Atmos. Chem. Phys., 21, 9977–9994, 2021
9986                                                                                        R. Ren et al.: Measurement report

best-fit regression lines. This demonstrates that the scattering   were still 10 million tons. As a result, the decrease in SO2
enhancement factor at 85 % RH of deliquescence was gener-          resulted in an increase in NH4 NO3 (Morgan et al., 2010; Xu
ally higher than that of the non-deliquescent process. Kuang       et al., 2019; Zhang et al., 2019; H. Li et al., 2019). Several
et al. (2016) also drew the same conclusion.                       previous studies focusing on megacities like Shanghai and
   Comparing Fig. 4a and c, as the proportion of inorganic         Beijing have all suggested that the increase in nitrate mass
salts in the total aerosol increased, the proportion of nitrate    concentration played an important role in enhancing the
in the total aerosol also increased, unlike the proportion of      water content of submicron aerosols and reducing visibility
sulfate in the total aerosol. This demonstrates that nitrate       under high RH conditions (Sun et al., 2012; Shi et al., 2014;
played a primary role in affecting aerosol hygroscopic en-         Zhang et al., 2015).
hancement during the study period in Beijing. To further              Figure S10a shows the scatterplot of γ as a function
compare the correlation between sulfate and the hygroscop-         of Forg (Org/(Org + (NH4 )2 SO4 + NH4 HSO4 + NH4 NO3 ),
icity of aerosols with that between nitrate and the hygroscop-     where the color of the data points represents the
icity of aerosols, an ion-pairing scheme was used to calcu-        SO2−         2−
                                                                       4 / (SO4 + SO2 ) molar ratio. This molar ratio indi-
late the mass concentrations of (NH4 )2 SO4 , NH4 HSO4 , and       cates the relative age of aerosols (Quinn et al., 2005)
NH4 NO3 in aerosols on the basis of the molar numbers of           because by gas- and aqueous-phase oxidation processes,
all ions (Gysel et al., 2007). The following is the ion-pairing    SO2 will convert to SO2−   4 . The molar ratio of more aged
scheme:                                                            aerosols is high due to the sufficient time for the con-
                                                                   version. The SO2−           2−
                                                                                     4 / (SO4 + SO2 ) molar ratio is low for
nNH4 NO3 = nNO− ,
              3                                                    younger aerosols. The figure shows that high γ corresponded
                                                                   to high SO2−           2−

nH2 SO4 = max 0, nSO2− − nNH+ + nNO− ,                                         4 / (SO4 + SO2 ) molar ratios with a low or-
                        4           4           3                  ganic matter content, while low γ corresponded to low
                                                                   SO2−         2−

nNH4 HSO4 = min 2nSO2− − nNH+ + nNO− nNH+ − nNO− ,
                                4           3       4   3
                                                                       4 / (SO4 + SO2 ) molar ratios with a high organic mat-
                    4                                            ter content, consistent with results reported by Quinn et
n(NH4 )2 SO4   = max nNH+ − nNO− − nSO2− , 0 ,                     al. (2005) and Zhang et al. (2015). This demonstrates that
                            4           3       4
nHNO3 = 0,                                                  (9)    the hygroscopicity of aged aerosols is higher than that of
                                                                   younger aerosols. Figure S10b shows that the aerosol scatter-
where n denotes the number of moles. Figure 5a to c show           ing coefficients log10 (σsp ) were relatively low when γ was
γ as a function of Forg (Eq. 6), where Ci represents the sum       low and the organic matter mass fraction was large. On the
of (NH4 )2 SO4 and NH4 HSO4 , NH4 NO3 and the sum of               contrary, log10 (σsp ) was high when γ was high, and the or-
(NH4 )2 SO4 , NH4 HSO4 , and NH4 NO3 mass concentrations,          ganic mass fraction was small, with a relatively large varia-
respectively. Overall, γ and Forg are negatively correlated.       tion.
The coefficient of determination between γ and Forg
(Org / (Org + NH4 NO3 )) (Fig. 5b) was higher than that be-        3.3   Deliquescence of ambient aerosols
tween γ and Forg (Org / (Org + (NH4 )2 SO4 + NH4 HSO4 ))
(Fig. 5a). The coefficient of determination between γ and          Figure 6a shows the time series of η, with the color of the data
Forg    (Org / (Org + (NH4 )2 SO4 + NH4 HSO4 + NH4 NO3 )           points representing the ratio of SO2− 4 mass concentration to
was the highest (Fig. 5c). This suggests that nitrate played       NO− 3  mass  concentration.  Figure  6b and c show the time se-
a more significant role than sulfate in affecting aerosol          ries of wind direction and wind speed and ambient temper-
hygroscopic growth during the study period in Beijing. In          ature and RH, respectively. Overall, deliquescence often oc-
recent years, the Chinese government has made more efforts         curred under high ambient temperature and low RH condi-
to control SO2 emissions (Zhang et al., 2019), e.g., adjusting     tions (Fig. 6c). It also more easily occurred when winds with
and optimizing industrial capacities. Clean fuels have also        low speeds came from the south or southwest (Fig. 6b). High
been promoted in the residential sector, with trials for using     values of η usually occurred when the ratio of SO2−    4 mass
clean energy in heating in northern China carried out in all       concentration to NO−    3 mass concentration  was high  (mostly
“2+26” cities and in the Fenhe River and Weihe River plains.       higher than ∼ 4). Figure 7a shows a relatively strong corre-
In addition, compliance with industrial emission standards         lation between η and the ratio of SO2−   4 mass concentration
has been strengthened. Desulfurization technology has been         to NO− 3 mass   concentration   (R =  0.62). The blue dots rep-
also applied to many heavy industrial facilities. However,         resent the hysteresis index (η > 0.4) of deliquescence, show-
China has many small-scale manufacturing enterprises, so it        ing that the corresponding ratios of SO2−   4 mass concentra-
is much more difficult to regulate NOx emissions than SO2          tion to NO− 3  mass    concentration  were high (mostly higher
emissions. H. Li et al. (2019) have reported that emissions        than ∼ 4). The red dots represent the hysteresis index of non-
of SO2 and NOx in 2017 dropped by 79.9 % and 38.1 %,               deliquescent processes, showing that the corresponding ra-
respectively, from 2014 levels in Beijing, China. In 2020,         tios of SO2−                              −
                                                                              4 mass concentration to NO3 mass concentration
SO2 and primary PM2.5 emissions dropped to 1 million               were generally less than 4. Because PM2.5 mass concentra-
tons, while NOx and volatile organic compound emissions            tions were extremely low on 24 September 2019, data were

Atmos. Chem. Phys., 21, 9977–9994, 2021                                              https://doi.org/10.5194/acp-21-9977-2021
R. Ren et al.: Measurement report 9987
Figure 5. Scatter plots of γ as a function of the relative amounts of organic and inorganic matter (Forg ): (a) Forg = Org/(Org + (NH4 )2 SO4 +
NH4 HSO4 ), (b) Forg = Org/(Org + NH4 NO3 ), and (c) Forg = Org/(Org + (NH4 )2 SO4 + NH4 HSO4 + NH4 NO3 ). Solid red lines show the
linear fits, dotted red lines represent the 95 % confidence levels, and solid blue lines represent the 95 % prediction bands for the fit. The linear
regression function and the squared Pearson’s correlation coefficient (R 2 ) are given in each panel.
noisy then, and the system error was relatively large (green ronmental conditions of high temperature and low humidity.
dots). When these cases of large systematic errors were elim- Note that secondary sulfates are usually produced by pho-
inated, the correlation between η and the ratio of SO2− 4 to tochemical reactions so that the sulfate content of aerosols
NO− 3 mass concentration increased (R = 0.69). In the North gradually accumulates from late morning to late afternoon
China Plain, Kuang et al. (2016) also observed a similar del- (Huang et al., 2010; Sun et al., 2012). Generally speaking,
iquescent phenomenon associated with (NH4 )2 SO4 , while in the ambient temperature was higher, and the humidity was
Ny-Ålesund, Norway, this deliquescent phenomenon was re- lower in the afternoon, so high values of SO2− −
4 / NO3 mostly
lated to sea salt (Zieger et al., 2010). occurred in the afternoon. This may also explain why the del-
According to observational results, there are two environ- iquescent cycle occurred most frequently in the afternoon, as
mental conditions of consequence for ambient aerosol deli- shown in Fig. 7b.
quescence: The blue-shaded zones in Fig. 1a and f show that
deliquescence usually occurred when the air quality was
1. high ambient temperature and low ambient RH good. To better explain this phenomenon, the obser-
2. relatively good air quality and solar illumination. vation period was divided into a very clean period
(PM2.5 ≤ 35 µg m−3 ) and a moderately polluted period
Concerning the first condition, Cheung et al. (2015) proposed (35 µg m−3 < PM2.5 ≤ 75 µg m−3 ). The difference between
an indicator describing the neutralization extent of aerosols, f (RH = 85 %, 525 nm) and f (RH = 80 %, 525 nm), i.e., DF,
2−
i.e., the molar ratio, MR = (NH+ −
4 − NO3 ) / SO4 . The MR or f (RH = 85 %, 525 nm) minus f (RH = 80 %, 525 nm),
value of the non-deliquescent process was always the low- was calculated. Figure 8c shows the values of DF during
est in their study. Their results indicate that when the nitrate a very clean period and a moderately polluted period. The
content of ambient aerosols was slightly high, and the sul- DF of deliquescence is larger than that of non-deliquescence
fate content was low, aerosol particles did not exhibit del- because the f (RH) of deliquescence jumps suddenly as the
iquescence resulting from acidic sulfate. Here, only when RH increases from 80 % to 85 %, while the f (RH) of non-
the mass concentration ratio of sulfate to nitrate was high deliquescence increases smoothly as the RH increases. The
(mostly higher than ∼ 4) did ambient aerosol particles exhibit values of the particle light scattering enhancement factor
deliquescence. Figure 8a and b illustrate the diurnal varia- at high RH for deliquescent processes were usually higher
tions in nitrate, along with ammonium and sulfate. Both the than those for non-deliquescent processes, consistent with
mass concentration and mass fraction of nitrate reached their the strong hygroscopicity of (NH4 )2 SO4 . Figure 8c shows
largest and smallest values in the early morning and in the that the diurnal range of DF during the clean period was
afternoon, respectively. It was closely correlated with the di- larger than that during the moderately polluted period. In par-
urnal variation in ambient temperature and RH, where RH ticular, from late morning to late afternoon, the DF during
gradually rose as the temperature gradually decreased from the clean period was much higher than that during the mod-
the late afternoon to the early morning of the next day, fol- erately polluted period. Figure 8d shows the diurnal varia-
lowed by a reversal of the trend into the late afternoon of tion in SO2− − 2− −
4 / NO3 . The ratio SO4 / NO3 during the clean
the next day (Fig. 6c). Morino et al. (2006) and Wang et period was higher than that during the moderately polluted
al. (2009) found that the formation of nitrate requires low period, especially from late morning to late afternoon. Over-
temperatures and high RH, conditions favorable for the con- all, good air quality and solar illumination were conducive
version of gaseous nitric acid to solid-phase nitrate. Ambi- to photochemical reactions so that more secondary sulfate
ent aerosol deliquescence is thus closely related to the envi-
https://doi.org/10.5194/acp-21-9977-2021 Atmos. Chem. Phys., 21, 9977–9994, 20219988 R. Ren et al.: Measurement report
Figure 6. Time series of (a) hysteresis index η colored by the SO2− −
4 /NO3 mass concentration ratio, (b) wind speed (WS; unit: m s )
−1
colored by wind direction (WD; unit: ◦ ), and (c) ambient temperature (T ; unit: ◦ C) and relative humidity (RH; unit: %). The segments of the
time series with a grey background represent the processes of deliquescence. The date in this figure is in the month/day format.
Figure 7. (a) Scatter plot of hysteresis index η as a function of the SO2− −
4 /NO3 mass concentration ratio. Blue dots represent deliquescence
and red dots non-deliquescent processes. Green dots represent those data points with high systematic errors. The inset figure shows the scatter
plot excluding the green dots. (b) Scatter plots of the observed f (RH = 85 %, 525 nm) values for non-deliquescent (black) and deliquescent
(blue) cycles. The linear regression functions and the Pearson’s correlation coefficients (R) are given in the bottom right corner of (a) for
each fitted line.
Atmos. Chem. Phys., 21, 9977–9994, 2021 https://doi.org/10.5194/acp-21-9977-2021R. Ren et al.: Measurement report 9989
Figure 8. Average diurnal cycles of (a) mass concentration (unit: µg m−3 ) and (b) mass fraction (unit: %) of ammonium (black curves),
nitrate (blue curves), and sulfate (red curves) measured by the ACSM. (c) The difference between f (RH = 85 %, 525 nm) and f (RH =
80 %, 525 nm) and (d) the mass concentration ratio of sulfate to nitrate (SO2− −
4 /NO3 ) during the clean period (blue curve) and the moderately
polluted period (red curve). Vertical lines are the standard deviations.
could be generated during the day, facilitating the deliques- clear deliquescence (Fig. 9d, e). All f (RH) curves were thus
cence of ambient aerosols. first classified into deliquescent curves and non-deliquescent
curves. After averaging PM2.5 concentrations of the corre-
3.4 Parameterizations of f (RH) sponding cycles, all non-deliquescent curves were further di-
vided into clean (PM2.5 ≤ 35 µg m−3 ), moderately polluted
3.4.1 Parameterization with the equation (35 µg m−3 < PM2.5 ≤ 75 µg m−3 ), and polluted (PM2.5 >
f (RH) = 1 + m × RHn 75 µg m−3 ) categories. The deliquescent curves were di-
vided into clean and moderately clean categories only be-
Many empirical expressions have been presented to param-
cause deliquescence mainly occurred under good air qual-
eterize f (RH) (Kotchenruther and Hobbs, 1998; Carrico et
ity conditions. For cycles without deliquescence (Fig. 9a–c),
al., 2003; Pan et al., 2009; Fierz-Schmidhauser et al., 2010a;
the measured values were fitted using Eq. (10). For cycles
Chen et al., 2014; Brock et al., 2016; Titos et al., 2016; Kuang
with deliquescence (Fig. 9d, e), f (RH) increased smoothly
et al., 2017). The following is the two-parameter scheme in-
under low RH conditions then increased sharply. Under
troduced by Kotchenruther and Hobbs (1998):
low and high RH conditions, the fitted f (RH) values were
f (RH) = 1 + m × RHn . (10) usually lower than observed values, but the slopes of the
two curves were similar. However, when RH approached
The parameter m determines the largest value of ∼ 80 % where f (RH) sharply increased, the fitted f (RH)
f (RH = 100 %), and the parameter n dominates the values were usually higher than observed values, with dif-
magnitude of the scattering enhancement, reflecting the ferent slopes of the two curves. Therefore, segment fitting
curvature of the humidogram. (Eq. 12) was applied in the parameterization of deliques-
Deliquescence was frequently observed during the en- cent f (RH). The deliquescence observed in our study was
tire measurement campaign. In total, 294 cycles of f (RH) primarily caused by (NH4 )2 SO4 in ambient aerosols. The
were measured, and 47 cycles (16 % of all cycles) showed
https://doi.org/10.5194/acp-21-9977-2021 Atmos. Chem. Phys., 21, 9977–9994, 20219990 R. Ren et al.: Measurement report
Table 2. Curve-fitting parameters of f (RH) at 525 nm for different aerosol types using Eqs. (10) and (12).
Classification m n a b Reference
Non-deliquescence Very clean 1.32 ± 0.07 5.05 ± 0.18 This study
Moderately polluted 1.29 ± 0.02 3.99 ± 0.06
Polluted 1.42 ± 0.04 4.35 ± 0.08
Deliquescence Very clean RH < 78 % 0.55 ± 0.02 3.51 ± 0.09
RH > 82 % 1.63 ± 0.10 5.84 ± 0.41
78 % < RH < 82 % 0.07 ± 0.006 −4.29 ± 0.47
40 % < RH < 90 % 1.56 ± 0.12 5.92 ± 0.34
Moderately polluted RH < 78 % 0.62 ± 0.01 3.08 ± 0.04
RH > 82 % 1.50 ± 0.04 4.88 ± 0.19
78 % < RH < 82 % 0.07 ± 0.003 −3.88 ± 0.24
40 % < RH < 90 % 1.26 ± 0.11 4.61 ± 0.27
Clean 1.20 ± 0.06 6.70 ± 0.27 Pan et al. (2009)
Polluted 2.30 ± 0.03 6.27 ± 0.10
Dust 0.64 ± 0.04 5.17 ± 0.4
Locally polluted 1.24 ± 0.29 5.46 ± 1.90 Zhang et al. (2015)
Northerly polluted 1.20 ± 0.21 3.90 ± 1.27
Dust-influenced 1.02 ± 0.19 4.51 ± 0.80
Figure 9. Fitted f (RH) of non-deliquescent curves (a–c) and deliquescent curves (d–e) for different pollution levels. Solid red lines represent
fitted curves parameterized by Eq. (10). Dotted black lines represent the curves fit by segment function Eq. (12), and the solid blue lines
represent the average curves.
DRH of the pure (NH4 )2 SO4 aerosols generated in the lab- For 78 % < RH < 82 %, f (RH) values were parameterized
oratory was 80.37 %, measured by our high-resolution hu- by Eq. (11):
midified nephelometer system (Fig. S4). Because the DRH
of all deliquescence in this study, according to statistics, was f (RH) = a × RH + b. (11)
mainly distributed between 78 % and 80 %, Eq. (10) was ap-
Parameter a determines the degree of f (RH) jumps during
plied to fit f (RH) values when RH ≥ 82 % or RH ≤ 78 %.
deliquescence, i.e., the slope of the linear fitting line. Param-
Atmos. Chem. Phys., 21, 9977–9994, 2021 https://doi.org/10.5194/acp-21-9977-2021R. Ren et al.: Measurement report 9991
eter b determines the f (RH, 525 nm) value before deliques- 4 Conclusions
cence (RH = 78 %) and after deliquescence (RH = 82 %).
Direct measurements of aerosol hygroscopicity, as expressed
f (RH) = 1 + m × RHn RH ≤ 78% by f (RH,λ), were carried out at a site in the southern urban
f (RH) = a × RH + b 78% < RH < 82% (12) edge of Beijing, aimed at investigating the effect of aerosol
f (RH) = 1 + m × RHn RH ≥ 82%
water uptake on particle light-scattering properties. The mass
Table 2 summarizes the parameters m and n used in this study concentrations of aerosol chemical components were mea-
and in similar studies. For the non-deliquescence case, the sured simultaneously by the ACSM and AE-33. Also mea-
parameter n for the clean period was the largest (∼ 27 % sured were other aerosol parameters, such as the light absorp-
larger than that for the moderately polluted period and tion coefficient and the mass concentration of PM2.5 . In total,
∼ 16 % larger than that for the polluted period). The differ- 294 cycles of f (RH) were measured, and 47 cycles (16 % of
ence between the clean and moderately polluted parameter all cycles) showed clear deliquescence.
m was small, while the parameter m in the polluted period The proportion of components making up the chemical
was about 0.1 larger than that in the other two periods. As a composition of aerosols is key to influencing f (RH). In
result, f (RH = 85 %, 525 nm) was the largest in the polluted general, f (RH) had a strong positive correlation with the
period and the smallest in the clean period. For the deliques- proportion of inorganic matter and a negative correlation
cence case, the fitted parameters m and n for the whole RH with the proportion of organic matter and eBC. High val-
range (40 % < RH < 90 %) were much larger than the m and ues of f (RH) usually occurred for aged aerosols whose
n for RH < 78 %. If Eq. (10) was used to parameterize the mass fraction of organic matter was small. Low values of
whole RH range of the deliquescence curves instead of seg- f (RH = 85 %, 525 nm) often occurred for primary aerosols
ment fitting, bigger differences between the parameterized with more organic matter. Furthermore, when the mass frac-
fitting results and measured values would occur. This would tion of inorganic matter was smaller than 40 %, the pos-
cause greater uncertainties in the model simulation of aerosol itive correlation between f (RH = 85 %, 525 nm) and inor-
hygroscopicity. Also, there was no significant difference be- ganic matter was much stronger. A similar phenomenon was
tween parameter a under clean (a = 0.07 ± 0.006) and mod- also found for the negative correlation between organic mat-
erately polluted (a = 0.07±0.003) conditions, indicating that ter and f (RH = 85 %, 525 nm). The compensating effect be-
the trend and amplitude of the jump growth for aerosol deli- tween the size and chemical composition of aerosol may be
quescence are consistent under these two environmental con- one of the main reasons for this phenomenon. High mass
ditions. However, the absolute value of parameter b under concentrations of ambient aerosols and insufficient water va-
clean conditions (b = −4.29±0.47) was higher than that un- por in the sample flow may be the other two reasons. Nitrate
der moderately polluted conditions (b = −3.88 ± 0.24), in- also played a more significant role in affecting aerosol hy-
dicating that the DRH for clean periods was slightly higher groscopic growth than sulfate in Beijing.
than that for moderately polluted periods. Favorable meteorological conditions for aerosol deliques-
cence were high ambient temperature and low RH, as well
3.4.2 Steepness of humidograms as relatively good air quality and strong solar illumination.
High temperatures and low RH levels were not conducive to
The steepness index proposed by Zhang et al. (2015), τ , is the formation of nitrate, while good air quality and light con-
defined as ditions were conducive to photochemical reactions so that
0
f (80 %)
n−1
4 more secondary sulfates could be generated. Only when the
τ= 0 −1 = −1 (13) ratio of the sulfate mass fraction to the nitrate mass fraction
f (60 %) 3
was greater than ∼ 4 did the deliquescence phenomenon of
to quantitatively describe the change in the curvature of the ambient aerosols easily occur.
humidogram curves; f 0 (80 %) and f 0 (60 %) are the deriva- All humidograms were first classified as either deliques-
tives of the fitted curve of f (RH) given in Eq. (10) at the two cent or non-deliquescent. The two kinds of humidograms
different RH values. were further classified according to the mass concentration of
A low τ means that the curvature of the humidogram is PM2.5 . The two-parameter scheme, f (RH) = 1 + m × RHn ,
small, and a high τ means that the slopes of the curve from introduced by Kotchenruther and Hobbs (1998), was applied
low to high RH sharply change. Figure S11 shows the scatter to fit the non-deliquescent f (RH). The deliquescent f (RH)
plot of τ as a function of the nitrate mass fraction, colored by was parameterized by segment functions (Eq. 12). For the
the sulfate mass fraction. In the 0 %–15 % nitrate mass frac- deliquescence case, the fitted parameters m and n for the
tion range, τ decreased sharply as the nitrate mass fraction whole RH range (40 % < RH < 90 %) were much larger than
increased, demonstrating that the curvature of the humido- the parameters for RH < 78 %. This demonstrates that large
gram became smaller. For nitrate mass fractions larger than errors would be incurred if only Eq. (10) was used to pa-
15 %, τ stabilized to a constant value of ∼ 1.6, and the cur- rameterize the whole RH range of deliquescence curves. The
vature of the humidogram was much smaller. piecewise parameterization scheme (Eq. 12) is a better fit
https://doi.org/10.5194/acp-21-9977-2021 Atmos. Chem. Phys., 21, 9977–9994, 2021You can also read


