CRISTA-NF measurements during the AMMA-SCOUT-O3 aircraft campaign
←
→
Page content transcription
If your browser does not render page correctly, please read the page content below
Atmos. Meas. Tech., 3, 1437–1455, 2010
www.atmos-meas-tech.net/3/1437/2010/                                                                   Atmospheric
doi:10.5194/amt-3-1437-2010                                                                            Measurement
© Author(s) 2010. CC Attribution 3.0 License.                                                           Techniques

CRISTA-NF measurements during the AMMA-SCOUT-O3
aircraft campaign
K. Weigel1,* , M. Riese1,2 , L. Hoffmann1 , S. Hoefer1 , C. Kalicinsky2 , P. Knieling2 , F. Olschewski2 , P. Preusse1 ,
R. Spang1 , F. Stroh1 , and C. M. Volk2
1 Instituteof Chemistry & Dynamics of the Geosphere (ICG-1), Forschungszentrum Jülich, 52425 Jülich, Germany
2 Department   of Physics, University of Wuppertal, 42907 Wuppertal, Germany
* now at: Institute of Environmental Physics (IUP), University of Bremen, 28359 Bremen, Germany

Received: 10 February 2010 – Published in Atmos. Meas. Tech. Discuss.: 9 March 2010
Revised: 12 September 2010 – Accepted: 17 September 2010 – Published: 13 October 2010

Abstract. The Cryogenic Infrared Spectrometers and Tele-           significance, the UTLS is one of the least understood re-
scopes for the Atmosphere – New Frontiers (CRISTA-NF)              gions of the atmosphere. This is a result of its great dy-
instrument participated in the AMMA-SCOUT-O3 measure-              namical, chemical, and micro-physical complexity. This ap-
ment campaign in July and August 2006. The instru-                 plies, for example, to stratosphere-troposphere-exchange of
ment is mounted on the high-flying Russian research aircraft       trace gases, which has a strong impact on the structure and
M55-Geophysica and measures limb-emissions in the mid-             chemical composition of the UTLS (e.g. Holton et al., 1995).
infrared region in the tangent altitude range of about 6 to        Unfortunately, the UTLS is only sparsely covered by in situ
21 km. We present a new retrieval setup which is based on 9        measurements and not well resolved by satellite observations
integrated spectral windows allowing to retrieve an extended       (e.g. Engel et al., 2006).
set of trace gases and temperature fields with high vertical          The Cryogenic Infrared Spectrometers and Telescopes
resolution (up to 500 m). Retrieval results are shown for tem-     for the Atmosphere – New Frontiers (CRISTA-NF) limb-
perature, water vapor (H2 O), ozone (O3 ), nitric acid (HNO3 ),    observations of atmospheric infrared-emissions provide the
peroxyacetyl nitrate (PAN), carbon tetrachloride (CCl4 ), and      opportunity to derive profile information with high spatial
aerosol extinction. Comparisons of temperature, O3 , and           sampling in the UTLS for a variety of trace substances. The
H2 O observations with corresponding in situ measurements          instrument is mounted on the high-flying Russian research
on-board M55-Geophysica show reasonable agreement. In              aircraft M55-Geophysica, which reaches flight altitudes up
particular, CRISTA-NF observations in the vicinity of the          to 21 km (Stefanutti et al., 1999). The CRISTA-NF optics
aircraft resemble horizontal variations found in the in situ       are adapted from optical system of the Space Shuttle experi-
measurements better than corresponding ECMWF fields.               ment CRISTA that was successfully flown aboard the Shuttle
                                                                   Pallet Satellite SPAS in November 1994 [STS 66] and Au-
                                                                   gust 1997 [STS 85] (Offermann et al., 1999; Grossmann et
1   Introduction                                                   al., 2002).
                                                                      In this paper, we present CRISTA-NF observations,
The upper troposphere/lower stratosphere (UTLS) plays a            which were made during the Special Observation Period of
key role in the climate system. Changes in the structure           the African Monsoon Multidisciplinary Analyses (AMMA)
and chemical composition of this region result in partic-          campaign (Redelsperger et al., 2006), which was performed
ularly large changes in the radiative forcing of the atmo-         in cooperation with the Stratosphere-Climate links with em-
sphere, which trigger climate change. In spite of its immense      phasis On the UTLS-O3 (SCOUT-O3) project (Cairo et al.,
                                                                   2010). CRISTA-NF participated in ten M55-Geophysica
                                                                   flights: a test flight over Italy (hereafter TF2), four trans-
                    Correspondence to: K. Weigel                   fer flights between Oberpfaffenhofen (Germany) and the
                    (weigel@iup.physik.uni-bremen.de)              main campaign site in Ouagadougou, Burkina Faso, Africa

Published by Copernicus Publications on behalf of the European Geosciences Union.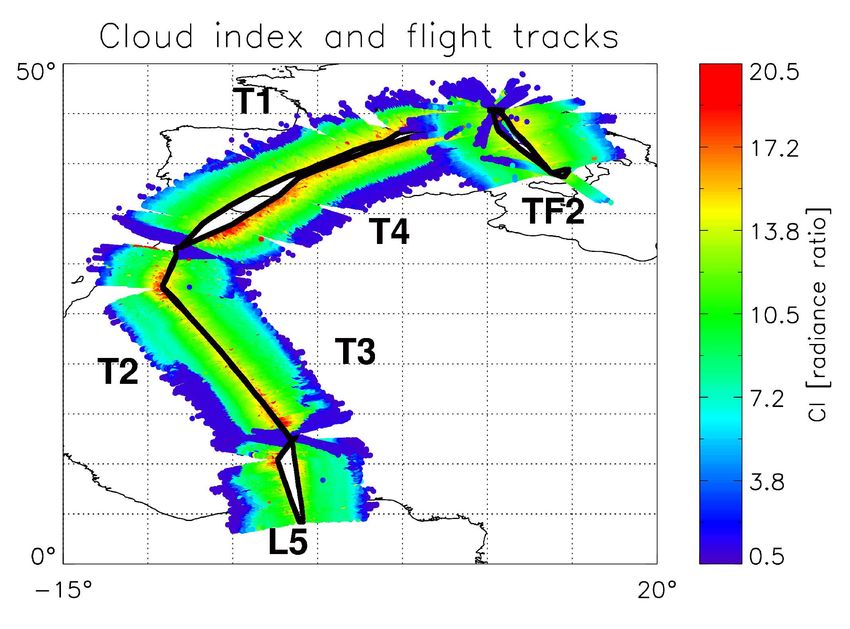
1438                                                              K. Weigel et al.: CRISTA-NF measurements during AMMA

(hereafter T1–T4), and five local flights from Ouagadougou        altitude profile is recorded in about 70 s. CRISTA-NF views
(hereafter L1–L5), which is located at 4◦ W and 12◦ N. Here,      perpendicular to the flight direction. The measurement time
we focus on results obtained for the local flight L5 (13 Au-      results in a horizontal distance between subsequent altitude
gust 2006). Flight L5 was chosen because on this flight           profiles along the flight direction of about 15 km, depend-
CRISTA-NF has the best data quality of all local flights          ing on the speed of the aircraft. The horizontal resolution
(i.e. fewest clouds and no complicated flight maneuvers). We      along the line of sight is coarser (see e.g. von Clarmann et
decided to focus on a local flight because the main focus of      al., 2009). It dependents on the vertical resolution, the ver-
the AMMA campaign and hence the in situ measurements              tical distance to the aircraft altitude and the atmospheric re-
was on the local flights. In particular we present a detailed     fraction. In can be in the order up to of several 100 km.
characterization of our the retrieval approach and compar-           The incoming radiance is spectrally analyzed by two Ebert
isons with simultaneous in situ measurements.                     Fastie grating spectrometers (see e.g. Fastie, 1991) that con-
   Section 2 gives a brief overview on the CRISTA-NF in-          tain a number of Si:Ga semi-conductor detectors. The scan-
strument and its spatial and spectral sampling characteristics.   ning direction of the gratings is changed after each spectral
In Sect. 3, we introduce our radiative transfer scheme that       scan. High measurement speed and consequently high spa-
allows fast and accurate forward calculations based on pre-       tial sampling is achieved by Helium-cooling of the optical
calculated atmospheric emissivity tables. The new retrieval       system and detectors. Helium-cooling also results in an ex-
scheme uses 9 ISWs from channel L6, in contrary to the re-        cellent signal-to-noise ratio of the limb-observations and suf-
trieval scheme presented by Hoffmann et al. (2009), which         ficient suppression of self-emissions of the instrument. The
uses 3 ISWs from channel H5. The higher number of ISWs            atmospheric limb-radiance enters the optical system trough
from a wider spectral range allows us to retrieve not only wa-    a zinc selenide (ZnSe) window and passes several stray light
ter vapor volume mixing ratios, aerosol extinction, tangent       baffles and an aperture that constrains the line of sight (LOS)
heights and radiometric offset as in Hoffmann et al. (2009)       to a beam of 500 in the vertical and 3000 in the horizontal di-
but additionally O3 , HNO3 , PAN, CCl4 and temperature. An        rection (perpendicular to the LOS). This results in a field of
overview on the retrieval scheme is given in Sect. 4 with         view (FOV) of approximately 300 m at about 10 km tangent
emphasis on the retrieval grid, the determination of tangent      height (see Spang et al., 2008).
heights from CRISTA-NF radiance measurements, a priori               Detailed descriptions of the CRISTA-NF optical system
information used for the retrieval, achievable vertical reso-     and radiometric calibration procedures are given by Kull-
lution, measurement contribution, and error analysis. Re-         mann et al. (2004); Kullmann (2006) and Schroeder et al.
trieved distributions of temperature and volume mixing ratios     (2009), respectively. Here, we concentrate on measurements
of water vapor (H2 O), ozone (O3 ), nitric acid (HNO3 ), per-     made by a specific detector channel of the “Low Resolu-
oxyacetyl nitrate (PAN), carbon tetrachloride (CCL4 ), and        tion Spectrometer” covering the spectral region from 776 to
aerosol extinction for two fights are presented in Sect. 5.       868 cm−1 (detector LRS6). The spectral resolving power
A comparison of observed temperature H2 O, and O3 values          is about λ/dλ = 500 for this spectrometer. Figure 1 shows
with corresponding in situ measurements is also presented in      spectra measured by this detector during the flight on 13 Au-
Sect. 5.                                                          gust 2006 during the AMMA campaign.
                                                                     An important prerequisite for the retrieval is to filter the
                                                                  data for clouds and optically thick conditions. Therefore
2   The CRISTA-NF instrument                                      the cloud index is calculated as color ratio between the ISW
                                                                  from 791–793 and 832–834 cm−1 at the measurement loca-
CRISTA-NF measures thermal emissions (4 to 15 µm) of se-          tions (see Spang et al., 2008). A cloud index lower than 3.5
lected trace gases with a dense vertical sampling. The in-        is indicative for a significant influence of clouds (or optically
strument is mounted on the high-flying Russian research air-      thick conditions due to the water vapor continuum at the low-
craft M55-Geophysica. First observations of the CRISTA-           ermost altitudes). Corresponding spectra are excluded from
NF instrument on-board M55-Geophysica were made during            the retrieval. Figure 3 shows the cloud index of all flights
the SCOUT-O3 tropical aircraft campaign in autumn 2005            where retrieval results are available with the scheme pre-
(Hoffmann et al., 2009; Spang et al., 2008; Kullmann, 2006).      sented here.
   CRISTA-NF uses a Herschel telescope with a tiltable mir-
ror to scan the atmosphere from the flight altitude of the air-
craft (up to 21 km) down to about 6 km with a vertical sam-       3   Fast radiative transfer model
pling step of about 250 m (60 vertical steps). The tangent
point moves away from the aircraft with decreasing tangent        The fast measurement speed of CRISTA-NF results in a large
height. The horizontal distance of the tangent point from the     amount of limb-radiance data. The retrieval must therefore
aircraft is about 200 km at 10 km tangent height for the high-    be based on a fast forward model which is capable of simu-
est flight altitudes of the aircraft. Measurement time for one    lating the limb-radiation received by the instrument along an
spectrum (tangent point) is about 1.2 s that means a complete     LOS in viable CPU-time. In this work, we use the Juelich

Atmos. Meas. Tech., 3, 1437–1455, 2010                                                 www.atmos-meas-tech.net/3/1437/2010/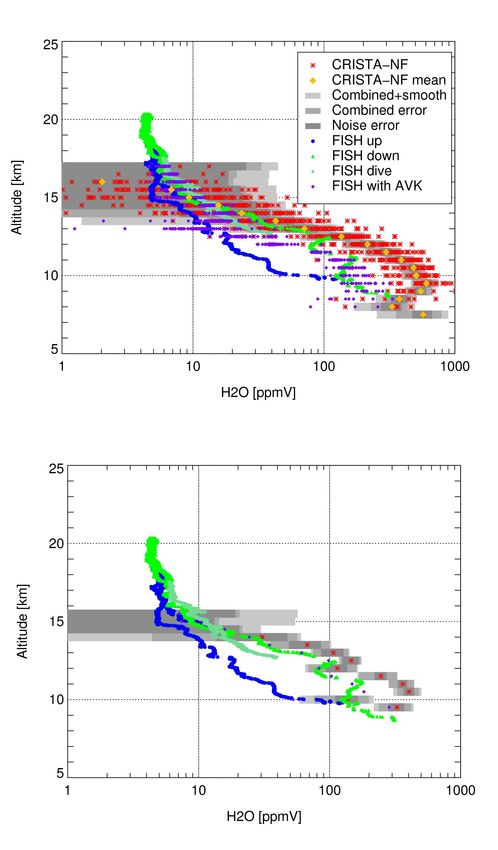
K. Weigel et al.: CRISTA-NF measurements during AMMA                                                                                                   1439

                                                                                                                     Tangent altitude=12.6 km
                                                                                                   0.020                            CRISTA−NF
                                                                                                                                    RFM
                                                                                                                                    CCl4
                                                                                                                                    F12

                                                                       Radiance [W/(m2 sr cm−1)]
                                                                                                                                    CO2
                                                                                                   0.015
                                                                                                                                    F11
                                                                                                                                    F22
                                                                                                                                    H2O
                                                                                                                                    HNO3
                                                                                                   0.010                            O3
                                                                                                                                    PAN
                                                                                                                                    Aerosol
                                                                                                                                    OFFSET
                                                                                                   0.005

                                                                                                   0.000
                                                                                                           780       800        820            840    860
                                                                                                                                          −1
                                                                                                                           Wavenumber [cm ]
Fig. 1. Measured radiance spectra from detector LRS6 (776–
868 cm−1 ) from profile 87 during the local flight L5. Color coding
shows the approximate tangent altitude (without retrieval correc-     Fig. 2. CRISTA-NF spectra from detector LRS6, flight L5 pro-
tions and refraction).                                                file 87 (black line). RFM calculation for the retrieval result is shown
                                                                      as black dashed line. Colored lines show the contribution of the
                                                                      most relevant trace gases to the result: CO2 (green), O3 (red), H2 O
                                                                      (blue), CFC-11 (cyan), HCFC-22 (pink), HNO3 (orange), CCL4
Rapid Spectral Simulation Code (JURASSIC; Hoffmann,                   (violet) and PAN (orchid). The contribution of Aerosol is shown as
2006; Hoffmann et al., 2009) that is applicable for satel-            yellow, the instruments radiance offset as gold line. Grey and col-
lite limb and nadir geometries (e.g. Hoffmann et al., 2008;           ored bars indicate the position of the integrated spectral windows
Hoffmann and Alexander, 2009). The fast radiative trans-              (ISWs) used for the retrieval. The ISWs dominated by CFC-11 and
                                                                      CO2 are highlighted in cyan and green, respectively.
fer code of JURASSIC is based on emissivity look-up ta-
bles that are pre-calculated by the detailed line-by-line MI-
PAS reference forward model (RFM) (Dudhia et al., 2002).              Table 1. Integrated spectral bands (ISWs) used and main target
The RFM calculations are based on spectroscopic data taken            variables.
from the HITRAN 2004 database (Rothman et al., 2005). For
PAN spectroscopic data of Allen et al. (2005) are used. The                                            ISW [cm−1 ]    Main target
RFM is well capable to simulate CRISTA-NF observations
                                                                                                       777.8–778.7    O3
as shown in Fig. 2 for the spectral range covered by detec-                                            784–785        H2 O
tor LRS6 (776–868 cm−1 ) and a tangent altitude of 12.6 km.                                            787–790        Offset
For the RFM, the measurement simulation is shown along                                                 791–793        CO2 (Temperature/altitude)
with single gas contributions. This LRS6 detector chan-                                                794.1–795      PAN
nel covers a spectral range in the the atmospheric window                                              796.6–797.5    CCL4
region containing absorptions of various trace gases. The                                              832–832.9      Aerosol
most distinct spectral features are the CO2 Q-branch at about                                          844.3–847.3    CFC-11 (Temperature/altitude)
792 cm−1 and a CFC-11 band emission between about 840                                                  863–864        HNO3
and 860 cm−1 .
   For the fast forward model JURASSIC, we calculate in-
tegrated emissivities for 9 spectral windows in the spectral
range of detector LRS6. The spectral position and the main            ISW are between 0.9 and 3 cm−1 . The lower limit is cho-
targets for each integrated spectral window (hereafter ISW)           sen in order to have at least two spectral sampling points in
are presented in Table 1 (see also Fig. 2 for the contribu-           each ISW (the CRISTA-NF spectral sampling for detector
tions of different emitters to the total radiance). Most ISW          LRS6 is about 0.4 cm−1 ). The restriction to 3 cm−1 is driven
are chosen such that targeted trace gases are primary emitters        by the need to minimize the influence of interfering species.
in these spectral windows, i.e. the ISW from 784–785 cm−1             The 787–790 cm−1 and 832–832.9 cm−1 ISW are located in
a significant fraction of the measured radiance is caused by          spectral regions with rather low emissions to obtain infor-
H2 O at lower altitudes. The same H2 O line was used for              mation about aerosol (which has an almost continuum-like
the H2 O retrieval for the CRISTA satellite experiment (Of-           emission) and the radiometric offset, which can not be com-
fermann et al., 2002; Schaeler and Riese, 2001). The CO2              pletely characterized by the black body calibration alone (see
Q-branch was previously used for the CRISTA temperature               Sect. 4).
retrieval e.g. by Riese et al. (1997, 1999). The widths of the

www.atmos-meas-tech.net/3/1437/2010/                                                                             Atmos. Meas. Tech., 3, 1437–1455, 2010
1440                                                                                          K. Weigel et al.: CRISTA-NF measurements during AMMA

Table 2. CRISTA-NF Level-2 data are available for the following AMMA flights.

                                 Abbr.            Date            Location                  Main objective     Remark
                                 TF2          29 Jul 2006         From and                  Instrument         Active attitude system
                                                                  to Verona                 test flight        used
                                 T1           31 Jul 2006         Verona                    Transfer
                                                                  to Marrakesh              flight
                                 T2           1 Aug 2006          Marrakesh                 Transfer           Detector temperature
                                                                  to Ouagadougou            flight             over 14.5 K (first 1000 s)
                                 L5          13 Aug 2006          From and                  CALIPSO1           Detector temperature
                                                                  to Ouagadougou            validation         over 14.5 K (first 900 s)
                                 T3          16 Aug 2006          Ouagadougou               Transfer
                                                                  to Marrakesh              flight
                                 T4          17 Aug 2006          Marrakesh                 Transfer           Detector temperature
                                                                  to Verona                 flight             over 14.5 K (first 2500 s)

1 Cloud-Aerosol Lidar and Infrared Pathfinder Satellite Observation satellite (Winker et al., 2009).

   For the fast radiative transfer calculations, the pre-
calculated emissivity tables are utilized by approximate ra-
diative transfer schemes. We use a combination of the emis-
sivity growth approximation (EGA) (e.g. Gordley and Rus-
sell, 1981, Weinreb and Neuendorfer, 1973) and the Curtis-
Godson Approximation (CGA). These approximative meth-
ods provides good agreement with detailed line-by-line cal-
culations in the stratosphere (e.g. Marshall et al., 1994).
However, for applications in the troposphere, deviations from
radiance values obtained from detailed line-by-line calcula-
tions sometimes exceeded 5 to 10%. We therefore applied
a linear regression model (see Hoffmann et al., 2009 and
Weigel, 2009) to improve the agreement with line-by-line
calculation to 0.2–0.8%, depending on the wavelength. A
similar approach was already successfully explored by Fran-
cis et al. (2006).                                                                            Fig. 3. Cloud index (CI) along the flight path for the transfer flights
                                                                                              (T1–T4), the fifth local flight (L5) and the test flight (TF2) during
                                                                                              the AMMA campaign. A CI lower than 3.5 (dark blue) indicates
4    Temperature and trace gas retrieval                                                      cloudy or optical dense conditions.

In the retrieval process, the received limb-radiance observa-
tions have to be inverted into an atmospheric state. Since                                    multi-target approach, i.e. all atmospheric quantities are re-
the forward model is non-linear, there is no direct analytical                                trieved simultaneously.
way to calculate the composition of the atmosphere from the
measured radiance. Hence, inverse methods must be used.                                       4.1      A priori information
This is done with the JURASSIC retrieval processor, which
provides the maximum a posteriori solution (Rodgers, 2000)                                    Most a priori values of retrieved quantities and estimates of
of the inverse problem. Trace gas volume mixing ratios,                                       forward model parameters are taken from the MIPAS refer-
temperature, and aerosol extinction, which are varied dur-                                    ence atmospheres (Remedios et al., 2007b). Carbon dioxide
ing the retrieval process are called “retrieved” quantities or                                mixing ratios are particularly important forward model pa-
emitters. Trace gas mixing ratios, which are kept constant                                    rameters, since they provide the basis for our temperature re-
are called “forward model parameters” further on. In this                                     trieval. For this reason, the 2001 values contained in the MI-
study we apply a 1-D retrieval approach, i.e. individual limb                                 PAS reference atmosphere have been adjusted to 2006 condi-
scans of CRISTA-NF are analyzed separately, assuming a                                        tions. Other modifications of forward model parameters are:
homogeneously stratified atmosphere. Further, we apply a                                      CFC-113 is increased by a factor of 3.7 to achieve a better

Atmos. Meas. Tech., 3, 1437–1455, 2010                                                                               www.atmos-meas-tech.net/3/1437/2010/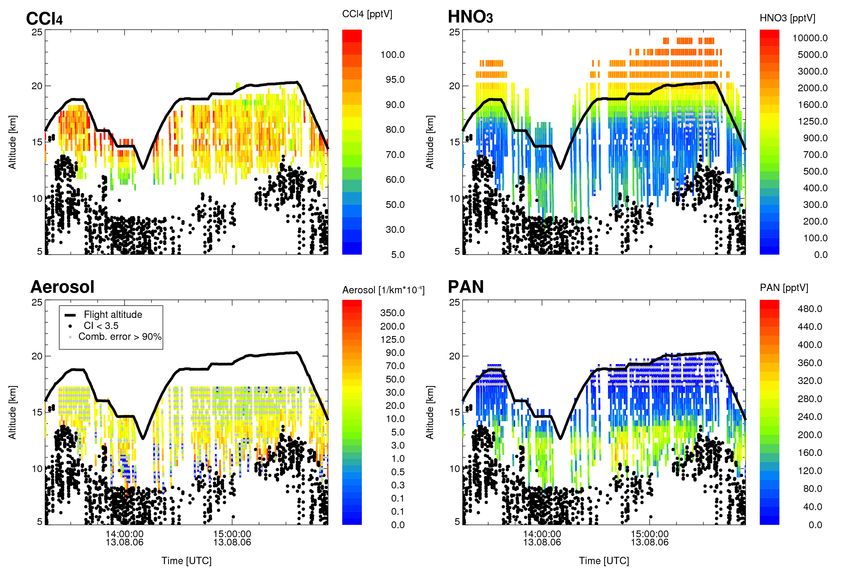
K. Weigel et al.: CRISTA-NF measurements during AMMA                                                                         1441

agreement with more recent measurements (e.g. Dufour et            content of the observations is poor. Otherwise it is found less
al., 2005 and Laube et al., 2008). CFC-113 is not one of our       important.
target trace gases (retrieved quantities), but we find that this
adjustment improves the agreement between simulated and            4.2   Retrieval grid and tangent height determination
measured radiance values in the spectral regions where CFC-
113 emits. The PAN a priori value is set to zero in our re-        Since part of the systematic error depends on the scanning
trieval approach, but an a priori standard deviation estimated     direction of the gratings (see Riese et al., 1999) the spec-
from Glatthor et al. (2007) is used. Annual mean HCFC-22           tra of each altitude scan are separated into two profiles, each
values from the Atmospheric Chemistry Experiment Fourier           containing spectra of one scanning direction of the grating
Transform Spectrometer (ACE-FTS; see e.g. Bernath et al.,          only (hereafter “forward” and “backward” spectra). The re-
2005) are used. CFC-11 and CFC-12 profiles are combined            sulting vertical sampling of the corresponding “forward” and
from measurements of the High Altitude Gas Analyser (HA-           “backward” profiles is approximately 500 m. Therefore we
GAR) instrument (see e.g. Werner et al., 2009 and Homan            chose a retrieval grid spacing of 500 m in the tangent altitude
et al., 2010) on-board the M55-Geophysica and values from          range. In our analysis, this retrieval grid was found to be a
Remedios et al. (2007b) for the upper altitudes.                   well-working pragmatic ad-hoc choice.
   A priori profiles for O3 and temperature are taken from            For an accurate simulation of the limb-radiance received
European Centre for Medium-Range Weather Forecasts                 by CRISTA-NF from the LOS, it is necessary to include in-
(ECMWF) operational analyses with 0.5 degrees horizontal           formation on the atmosphere above the highest tangent point
resolution on 28 pressure levels interpolated on the vertical      because upper layers also contribute to the radiance received
retrieval grid and position for each profile. Pressure is cal-     from the LOS. To account for this radiance contribution, a
culated from temperature and altitude assuming hydrostatic         coarser vertical grid is sufficient. We therefore run the for-
conditions using the ECMWF pressure as reference at 15 km          ward model on a vertical grid with 63 levels and a vertical
altitude.                                                          step varying with altitude. The actual vertical spacing used
   In addition to the absolute standard deviations from the        in our analysis is as follows:
climatology, percentage standard deviations constant for all         – 500 m spacing for altitudes between 3–20 km i.e. the re-
altitudes have been defined, which are used if they exceed             gion that covers the observations (tangent points).
the climatological standard deviation. Rather conservative
values are chosen for the standard deviation of the a priori         – 1 km spacing for altitudes between 1–3 km and between
information of the retrieved quantities in order to avoid a            20–30 km i.e. in the vicinity of the altitude range cov-
suppression of the information provided by the observation.            ered by observations.
More details about the selected a priori data can be found Ta-
bles 3 and 4. Table 5 contains the errors for the measured ra-       – 2 km spacing for altitudes between 30–50 km.
diances derived during the instrument calibration (Schroeder         – 2.5 km spacing for altitudes between 50–65 km.
et al., 2009).
   The a priori covariance for retrieved quantities is deter-          A 1-D-retrieval is run for each profile independently as-
mined by a first-order autoregressive model (Rodgers, 2000):       suming a horizontal homogeneous atmosphere. However, in-
                                                                   formation on the horizontal structure of the atmosphere can
Sij = σi σj exp (−1z/cz ),                                  (1)
                                                                   be obtained from successive profiles along the flight direc-
where σi is the standard deviation at altitude zi , 1z =           tion of the aircraft. The retrieval is run on selected altitude
 zi − zj is the vertical distance, and cz is the correlation       ranges of the retrieval grid depending on the retrieved quan-
length. The correlation length determines the strength of the      tities. The lowest altitude is 5 km for all retrieved quantities,
decay of the correlations in the a priori covariance. For each     the upper altitude varies between 17 km for H2 O and aerosol
retrieved quantity the vertical correlation lengths can be cho-    extinction, 60 km for HNO3 and O3 , and 25 km for the other
sen individually. For O3 and HNO3 long vertical correlation        retrieved quantities.
lengths (100 km) are found necessary to regularize the re-             As discussed in Hoffmann et al. (2009), the tangent alti-
trieval. These long correlation lengths are necessary to stabi-    tude cannot be determined with sufficient accuracy from the
lize the retrieval for emitters with a high stratospheric abun-    M55-Geophysica attitude system alone. Hence, it is retrieved
dance (i.e. O3 and HNO3 ) and correspond to a smoothness           simultaneously with the target trace gases, temperature and
constraint (for the difference between the a priori and the re-    an radiometric offset. For the temperature and altitude re-
trieved profile) (Rodgers, 2000). For CCL4 and PAN a ver-          trieval we use the CO2 Q-branch at 792 cm−1 as well as the
tical correlation length of one kilometer is chosen, for H2 O      845 cm−1 CFC-11 emission band (see Fig. 2).
and temperature the vertical correlation length is set to 5 km         Like CO2 , which is commonly used for the retrieval of
and for aerosol to 25 km. The choice of the correlation length     atmospheric temperature, the concentration of CFC-11 in
may have significant influences on the the retrieval error and     the troposphere and lower stratosphere is sufficiently well
characteristics such as vertical resolution if the information     known to accurately retrieve the altitude of the measurement.

www.atmos-meas-tech.net/3/1437/2010/                                                   Atmos. Meas. Tech., 3, 1437–1455, 2010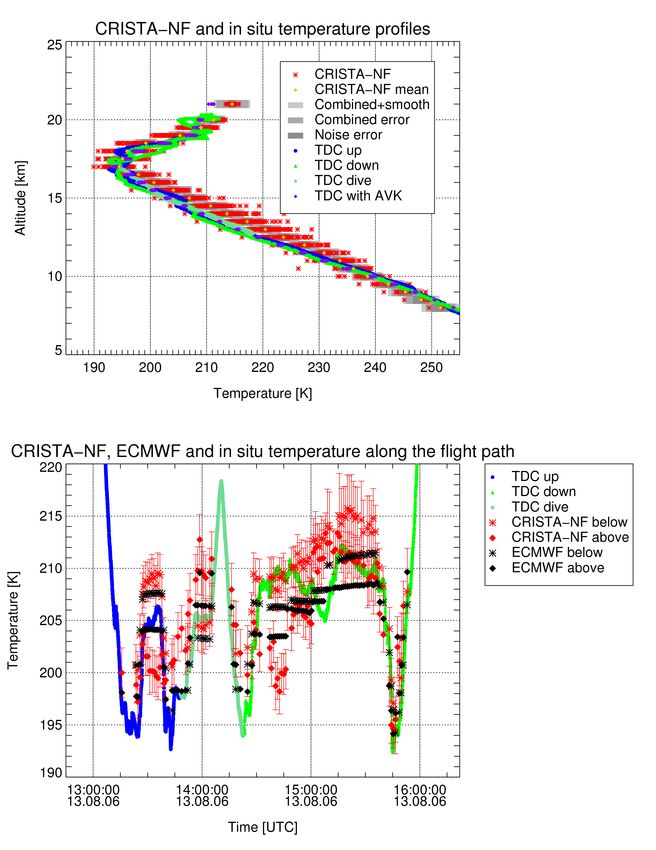
1442                                                                                  K. Weigel et al.: CRISTA-NF measurements during AMMA

Table 3. Retrieved gases, aerosol and temperature.

                            Emitter             A priori                Altitude dependent           Minimum          Uncertainty
                                                state                   dependent a priori        a priori standard   of spectros-
                                                                        standard deviation            deviation        copic data
                            CCL4                global1                 midlat./tropical1                       1%                2%
                            H2 O                midlat./tropical1       200 ppmV under,                        50%                5%
                                                                        2 ppmV over 17 km
                            HNO3                tropical1               800 pptV under 25 km                   20%           4.5%
                                                                        tropical1 above
                            O3                  ECMWF                   300 ppbV                               5%                 5%
                            PAN                 set to                  100% of approximated                 100%                 4%
                                                zero                    profile from
                                                                        (Glatthor et al., 2007)
                            Aerosol             HALOE2                  –                                    500%                  –
                            Temperature         ECMWF                   –                                      5K                  –

1 Remedios et al. (2007b), 2 HALogen Occultation Experiment (Hervig et al., 1993)

Table 4. Forward model parameters.

                                 Para-           A priori                Altitude                 Minimum          Uncertainty
                                 meter           state                   dependent a priori    a priori standard   of spectros-
                                                                         standard deviation        deviation        copic data
                                 C2 H6           midlat./tropical1       midlat./tropical1           5%                  10%
                                 ClONO2          tropical1               tropical1                   5%                  3.5%
                                 CO2             modified                global1                     5%                    5%
                                                 global1
                                 CFC-11          HAGAR,                  HAGAR,                      5%                    3%
                                                 midlat./tropical1       midlat./tropical1
                                 CFC-113         modified                –                           10%                   5%
                                                 global1
                                 CFC-114         global1                 –                           5%                    5%
                                 CFC-12          HAGAR                   HAGAR,                      5%                    1%
                                                 midlat./tropical1       midlat./tropical1
                                 HCFC-22         ACE-FTS or              global1                     5%                    4%
                                                 global1
                                 HNO4            midlat./tropical1       midlat./tropical1           5%                   10%
                                 OCS             global1                 global1                     5%                   10%
                                 Pressure        ECMWF                   –                           1%                     –

1 Remedios et al. (2007b)

CFC-11 was measured by the in situ instrument HAGAR on                                   The a priori standard deviation for the altitude retrieval
M55-Geophysica during the AMMA campaign. The profiles                                 is given as standard deviation of the pointing angle of 0.5◦ .
measured during ascent and descent of M55-Geophysica are                              No correlation length is set for the tangent altitudes. Atmo-
combined with CFC-11 values above the flight altitude from                            spheric refraction has a significant effect for lower tangent
the MIPAS reference atmosphere scaled to the measured val-                            altitudes and is included in the radiative transfer model.
ues and smoothed at the transition. The CFC-11 a priori co-                              In the retrieval process, the tangent heights of the obser-
variance is a combination of the climatological error and the                         vations are varied keeping all other atmospheric variables
difference between the HAGAR ascent and descent profiles.                             and parameters on a fixed vertical atmospheric grid, i.e. there

Atmos. Meas. Tech., 3, 1437–1455, 2010                                                                      www.atmos-meas-tech.net/3/1437/2010/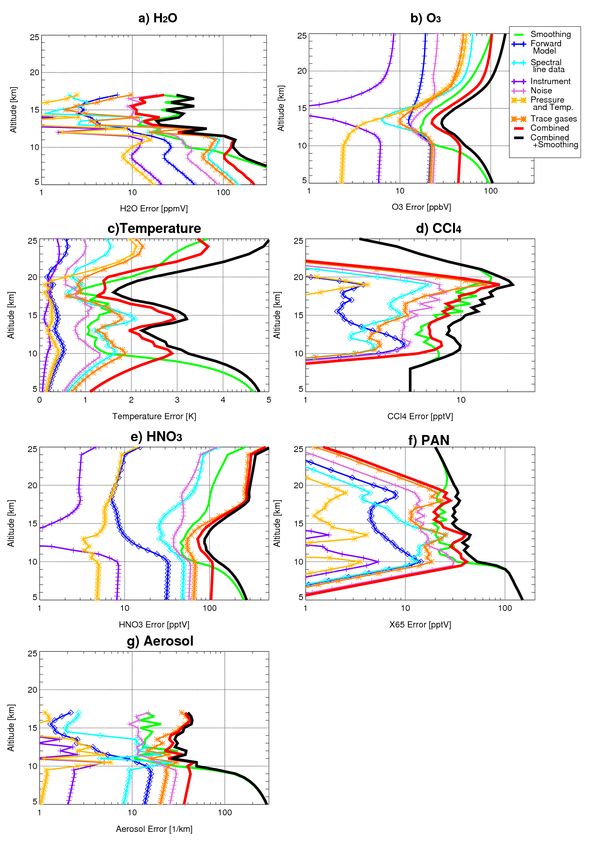
K. Weigel et al.: CRISTA-NF measurements during AMMA                                                                            1443

Table 5. Radiance uncertainties.

                    ISB [cm−1 ]        Forward Model             Offset          Gain    Absolute noise    Relative
                                   standard deviation [%]    [W/m2 sr cm−1 ]     [%]    [W/m2 sr cm−1 ]   noise [%]
                    777.8–778.7             0.70                 0.0015           1        0.00005            1
                    784–785                 0.82                 0.0015           1        0.00005            1
                    787–790                 0.51                 0.0015           1        0.00005            1
                    791–793                 0.35                 0.0015           1        0.00005            1
                    794.1–795               0.45                 0.0015           1        0.00005            1
                    796.6–797.5             0.42                 0.0015           1        0.00005            1
                    832–832.9               0.25                 0.0015           1        0.00005            1
                    844.3–847.3             0.21                 0.0015           1        0.00005            1
                    863–864                 0.18                 0.0015           1        0.00005            1

are two independent grids: one for the retrieved atmospheric          comparison we use in situ data measured on-board M55-
quantities and one for the ”instrument related” quantities like       Geophysica with a higher time and altitude resolution and
tangent altitude and offset. A similar concept was also used          relatively small errors. Assuming that the independent data
by Kiefer et al. (2007) for MIPAS observations.                       have ideal characteristics they can be degraded with the AVK
                                                                      to be comparable to the CRISTA-NF retrieval result, follow-
4.3   Averaging kernel, measurement contribution, and                 ing e.g. von Clarmann (2006):
      comparison with independent data
                                                                      x ind (AVK) = A x ind + (I − A) x a                          (3)
For the interpretation of the retrieval results it is important to
                                                                      where x ind are the independent data (transferred to the re-
have measures indicating how a retrieved value depends one
                                                                      trieval grid) and x ind(AVK) are the resulting data. In order to
measurement information and a priori data. Such measures
                                                                      not restrict the altitude range for comparison, the profile of in
can be derived from the averaging kernel (AVK) matrix. The
                                                                      situ measurements is extended with the a priori value used for
AVK matrix describes the sensitivity of the retrieval to the
                                                                      the CRISTA-NF retrieval above the flight altitude in Eq. (3).
true state (Rodgers, 2000):
                                                                      When comparing in situ profiles to CRISTA-NF data later
x̂ = Ax + (I − A) x a + G ,                                  (2)     on the original and the degraded in situ measurements are
                                                                      shown. For comparison along the flight path the in situ data
where A is the AVK matrix, I the identity matrix, x a the a pri-      are not degraded because no in situ measurements are avail-
ori state, x̂ the retrieval result, x the true state and G is the    able above and below the flight altitude and additional infor-
retrieval error. The gain matrix G maps from measurement              mation would be necessary to apply Eq. (3). Alternatively, in
space to state space. The retrieval resolution and the mea-           situ data may be compared directly (i.e. without applying the
surement contribution are derived from the AVK: Following             AVK) to CRISTA-NF measurements if the smoothing errors
Purser and Huang (1993) the resolution is determined as in-           of the retrieval are taken into account (see next section).
formation density (reciprocal of the trace of the AVK matrix)
multiplied by the vertical grid spacing. The measurement              4.4      Error analysis
contribution is calculated as the sum over the rows of the
AVK matrix. The measurement contribution is an approxi-               In this section, we discuss the error budget of the CRISTA-
mate measure of the proportion to which measurement and a             NF observations based on typical profile data for H2 O and O3
priori information contribute to the retrieval results (Rodgers,      obtained during a tropical flight from Ouagadougou (Burkina
2000). A value of 0.0 for the measurement contribution                Faso) on 13 August 2006. Figure 4 shows retrieved mixing
means, that the result contains only a priori information. A          ratio values of H2 O and O3 for forward spectra and back-
value of 1.0 means that the result contains only measurement          ward spectra (see Sect. 2) together with the corresponding
information. However, the measurement contribution can ex-            a priori profiles. A priori water vapor volume mixing ratios
ceed the value of one in case of non-linearities or due to large      are taken from the MIPAS reference atmospheres for tropi-
retrieval errors.                                                     cal conditions (Remedios et al., 2007b). The a priori standard
   When the retrieved profiles are compared to independent            deviation was set to a maximum of 50% and 200 ppmv be-
profiles with higher vertical resolution the AVK matrix needs         low 17 km altitude and 2 ppmv constant above. This leads to
to be considered. The retrieval result can be regarded as             a low error estimate above 17 km to reflect the lower strato-
a combination of the unknown real state, the a priori and             spheric variability. Below a higher, conservative error esti-
the retrieval errors (Rodgers, 2000), see also Eq. (2). For           mate is used. The H2 O mixing ratio is retrieved up to an

www.atmos-meas-tech.net/3/1437/2010/                                                       Atmos. Meas. Tech., 3, 1437–1455, 2010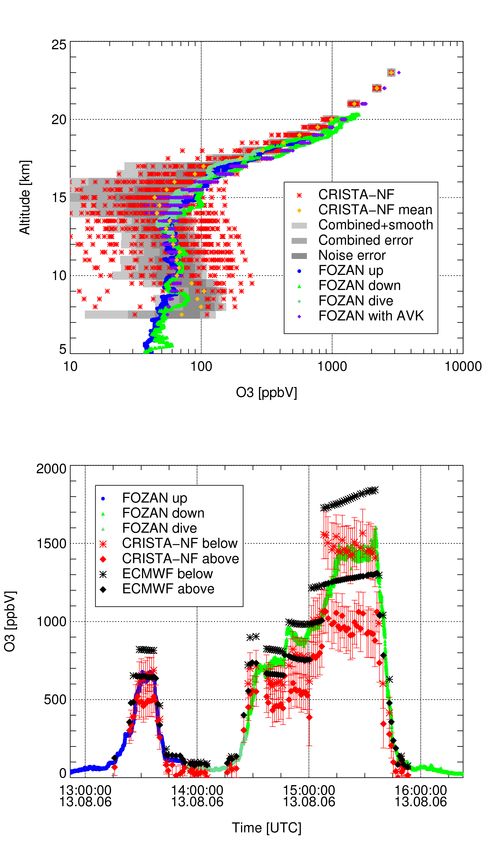
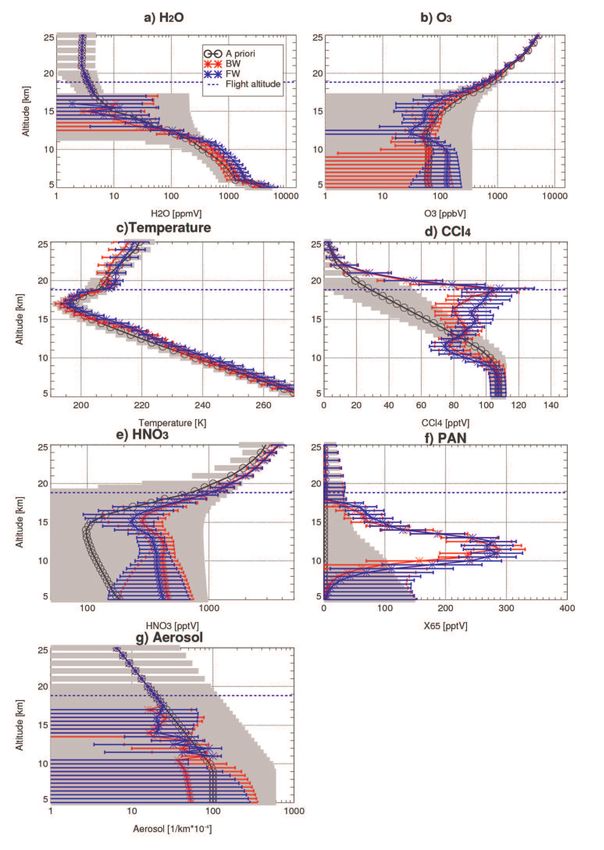
1444                                                                  K. Weigel et al.: CRISTA-NF measurements during AMMA

Fig. 4. Profiles for forward (FW) and backward (BW) spectra with combined plus smoothing error of H2 O, O3 , temperature, CCL4 , HNO3 ,
PAN, and aerosol extinction for profile 87, flight L5. The a priori standard deviation is shown in gray (y-axis vary).

Atmos. Meas. Tech., 3, 1437–1455, 2010                                                     www.atmos-meas-tech.net/3/1437/2010/
K. Weigel et al.: CRISTA-NF measurements during AMMA                                                                          1445

altitude of 17 km. For the spectral range used in our retrieval          comparing the retrieval results to an estimate of the
approach (H2 O line at 784 cm−1 ), the detection limit for wa-           real state (e.g. high resolution in situ observations) the
ter vapor is about 10 to 15 ppmv in this detector channel.               smoothing error should be included, when comparing
   The retrieved O3 volume mixing ratios are compared with               to an estimate after degrading the data with the AVK it
a priori data obtained from ECMWF (Fig. 4b). The a pri-                  should be omitted.
ori standard deviation for O3 is set to a maximum of 5% or
300 ppbv. The small a priori standard deviation for O3 and            – Forward model error:
HNO3 above 18 km reflects the presumably lower temporal                 The forward model error is determined by comparing
and spatial variability in the stratosphere and is necessary to         the fast forward model remaining after regression cor-
stabilize the retrieval. This leads also to small a posteriori          rection with the line-by-line model reference model out-
errors for O3 and HNO3 above 18 km. We cannot rule out                  put. The forward model error is a function of tangent
the possibility that it leads to an underestimation of the O3           height and ISW and varies between about 0.2 and 0.8%.
retrieval errors where the resolution is low. At tangent points       – Uncertainties of spectroscopic data:
between flight altitude and 12 km, values retrieved from for-           The errors caused by uncertainties of the spectral line
ward and backward spectra agree well and are somewhat                   data and tabulated asorption cross-sections from HI-
lower than the a priori value. Below 12 km, ozone values                TRAN 2004.
obtained from the forward and backward spectra are higher
than the a priori values and start to differ from each other.         – Model parameter errors:
This is due to a lack of measurements below (lowest tangent             Retrieval errors caused by the uncertainties of the for-
altitude 10.5 km for backward and 9.8 km for forward spec-              ward model parameters, i.e. interfering species, refer-
tra) as well as the large a priori correlation length.                  ence pressure, and top column data of retrieval vari-
   Figure 4c shows the result of the temperature retrieval for          ables. In Fig. 5 this error is divided into contributions
forward and backward spectra. The retrieved temperatures                from temperature column and reference pressure as well
are higher than the a priori temperature at about 11 to 15 km           as the one from interfering species.
altitude. The result of the CCl4 retrieval for profile 87 is dis-
                                                                      – Instrument error:
played in Fig. 4d. Large differences are found between the
                                                                        The instrument error comprises the radiometric offset
a priori profile from the Remedios climatology and the re-
                                                                        and gain uncertainties. These uncertainties are esti-
trieval result. This most probably results from the fact, that
                                                                        mated in the frame of the black body calibration (for
there is only a global averaged profile in the climatology but
                                                                        details see Schroeder et al., 2009). A radiometric off-
the measurement take place in the tropic, i.e. the climatolog-
                                                                        set of about 0.0015 W/(m2 sr cm−1 ) was determined for
ical profile is representative for an atmosphere with a much
                                                                        detector LRS6 during calibrations. The gain error is on
lower tropopause height. Figure 4e shows the result of the
                                                                        the order of 1%.
HNO3 retrieval for profile 87. The retrieval result shows a
higher HNO3 abundance than the climatology. The retrieval             – Noise:
result for PAN is shown in Fig. 4f. A zero profile is used as           This is the error caused by measurement noise. For de-
a priori while the a priori error is estimated from Glatthor et         tector LRS6, it is estimated to 0.00005 W/(m2 sr cm−1 ).
al. (2007). PAN volume mixing ratios up to about 280 pptv               However, in our retrieval setup a value of 1% is used
are found between 10 and 15 km altitude. In Fig. 4g the re-             to compensate for any missing retrieval error and to
trieval result for aerosol extinction is shown together with the        achieve agreement in the forward model fits (see dis-
a priori profile.                                                       cussion below).
   The errors of the retrieval results are shown in Fig. 4. The
corresponding detailed error analysis is shown in Fig. 5. The          The combined error shown in Fig. 5 is the square root of
error budget consists of several components including instru-       the sum of all components mentioned above except for the
ment and forward model errors:                                      smoothing error. The leading terms of the combined error
                                                                    for most of the retrieved variables are the errors due to the
  – Smoothing error:                                                non-retrieved emitters, the spectral line data and the noise.
    The smoothing error depends on the a priori covariance          The instrumental errors, forward model errors and pressure
    and the AVK matrix. However, in this study the a pri-           and temperature uncertainties play a minor role. The error
    ori covariance does not represent a real ensemble of at-        components vary somewhat between different profiles but the
    mospheric states. Rather conservative estimates of the          profile shown in Fig. 5 can be considered to be representative.
    standard deviations are used in order to avoid a suppres-       Other possible error sources are effects of an insufficient rep-
    sion of information obtained from the observation. This         resentation of aerosol extinction, thin clouds, the horizontal
    will cause some overestimation of the smoothing error.          structure along the LOS, remaining effects of detector re-
    On the other hand, an error budget without smooth-              laxations or of the determination of the spectral resolving
    ing error tends to underestimate the full error. When           power, undetected stray light and spikes, and uncertainties in

www.atmos-meas-tech.net/3/1437/2010/                                                   Atmos. Meas. Tech., 3, 1437–1455, 2010
1446                                                                   K. Weigel et al.: CRISTA-NF measurements during AMMA

Fig. 5. Error components for H2 O, O3 , temperature, CCL4 , HNO3 , PAN, and aerosol extinction for profile 87 (forward spectra), flight L5
(y-axis vary).

Atmos. Meas. Tech., 3, 1437–1455, 2010                                                       www.atmos-meas-tech.net/3/1437/2010/
K. Weigel et al.: CRISTA-NF measurements during AMMA 1447
the line-by-line reference model. It is therefore important to The data of this instrument are plotted between the two solid
check the error budget by comparison of the retrieval results black lines indicating the flight altitude of the aircraft.
to independent data. The M55-Geophysica started in Ouagadougou and flew
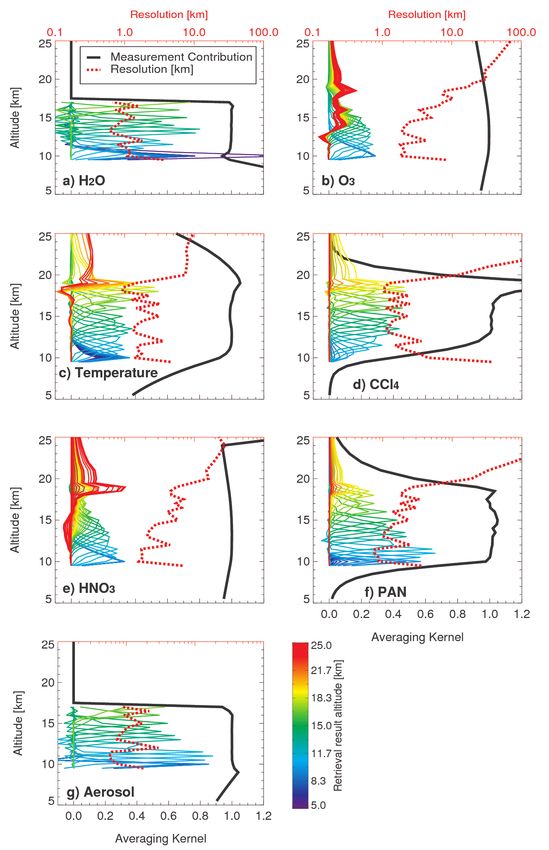
The vertical resolution and measurement contribution of southwards, climbing up to nearly 19 km and then perform-
the observations are used to identify and filter for low-quality ing a so-called “dive” by descending down to about 13 km.
data. Figure 6a shows the AVKs, vertical resolution and mea- After climbing again to a flight altitude of about 19 km,
surement contribution for H2 O. The resolution reaches often the aircraft turned around, flew northward, climbed above
values better than 1 km and can be 500 m in the ideal case. 20 km before it started the final descent and landing in Oua-
Fluctuations in the resolution are mainly cause by a vary- gadougou. CRISTA-NF looks to the starboard side of the air-
ing altitude sampling due to roll movements of the aircraft. craft, thus westward during the first half of the flight and east-
The measurement contribution is close to 1.0 from the low- ward during the second half (see Fig. 3 for the flight path).
est tangent altitude up to 17 km. This is used as additional With the exception of a few profiles, clouds or optical dense
indicator for the vertical range where the H2 O retrievals are conditions are only found below 8 to 13.5 km.
reliable (e.g. Hoffmann et al., 2008). Figure 6b shows the The in situ temperatures agree in most cases well with the
AVKs, vertical resolution and measurement contribution for CRISTA-NF measurements made in the vicinity of the air-
O3 . The AVK peaks are broader here and rarely reach max- craft (see Fig. 7). In addition, we compare in situ profiles
imum values higher than 0.3. The AVKs, vertical resolution measured during the ascend and descend of the aircraft to
and measurement contribution for temperature, CCl4 , HNO3 , all limb-profiles obtained during the flight (Fig. 8). For this
PAN and aerosol extinction are shown in Fig. 6c–g. The up- comparison, it should be kept in mind that the tangent points
per threshold for the resolution is set to 20 km for HNO3 and of the observation move away from the instrument with de-
O3 and 3 km for all other retrieval variables; the lower and creasing altitude and reach a distance of about 200 km for a
upper thresholds for the measurement contribution are 0.8 tangent height of 10 km at highest flight levels.
and 1.2, respectively. In the following, only retrieval results The mean in situ temperature profile shown in Fig. 7 is
meeting these quality criteria are displayed. The vertical res- folded with the mean AVKs of all CRISTA-NF profiles, since
olution for all profiles from Flight L5 for the retrieved trace each profile resulting from the CRISTA-NF retrieval has a
gases and temperature can be found in the electronic supple- somewhat different AVK matrix. The resulting in situ tem-
ment. perature profiles agree well with the original in situ measure-
The retrievals generally reproduce measured radiance ments, indicating a relatively small influence of the CRISTA-
within the specified error bars (see for example Fig. 2). The NF AVKs on the results. Above 15 and below 11 km the
consistency of these retrieval results with the measurements mean CRISTA-NF temperature profile agrees with the mean
and a priori data can be validated by a χ 2 -test (e.g. Rodgers, in situ temperatures within the combined error. Between
2000). As for the CRISTA-NF H2 O retrieval for SCOUT-O3 11 and 15 km the CRISTA-NF data are systematically higher
(Hoffmann et al., 2009), most values of the normalized χ 2 for than the in situ data (up to 5 K). This may be partly caused by
the retrieval result are smaller or close to 1.0 indicating that uncertainties in the altitude determination since similar devi-
the retrievals are consistent with the measured and a priori ations are also found most other flights (see Weigel, 2009).
data within their error estimates. Outliers with a normalized If temperature and altitude retrieval are not completely in-
χ 2 larger than two are excluded from further analyzes. dependent this can also influence the retrieval results for the
trace gases, especially when they vary strongly with altitude.
CRISTA-NF temperature observations in the vicinity of
5 Results the aircraft and corresponding and in situ measurements
agree rather well in term of relative variations along the hor-
5.1 Temperature results izontal flight track. This is demonstrated in Fig. 8b that
shows the in situ temperature data in comparison with the
Figure 7 shows the result of the temperature retrieval for CRISTA-NF results at retrieval grid altitudes just below and
flight L5 as a function of height and measurement time (hor- above the flight track. In addition, ECMWF temperatures
izontal location). Temperature data are presented as colored are shown that are interpolated onto the same positions. In
symbols. During the whole flight the lowest temperatures most cases, the values of the situ measurements are between
are found at altitudes of 17 to 18 km. Spectra with a cloud the corresponding CRISTA-NF temperatures (located below
index smaller than 3.5 are represented by black dots. Gaps and above). In addition, CRISTA-NF measurements resem-
in this 2-D representation of the temperature field (blank ar- ble much more of the horizontal variations found in the in
eas) are caused by the exclusion of data violating our quality situ temperatures than in corresponding ECMWF data.
criteria (see Sect. 4). For comparison with the CRISTA-NF
temperatures, we included in situ temperature measurements
by the Thermo Dynamic Complex (TDC; Shur et al., 2007)
from the Central Aerological Observatory (CAO) in Moscow.
www.atmos-meas-tech.net/3/1437/2010/ Atmos. Meas. Tech., 3, 1437–1455, 20101448 K. Weigel et al.: CRISTA-NF measurements during AMMA Fig. 6. Averaging kernel matrix, measurement contribution and resolution for H2 O, O3 , temperature, CCL4 , HNO3 , PAN, and aerosol extinction for profile 87 (forward spectra), flight L5. Atmos. Meas. Tech., 3, 1437–1455, 2010 www.atmos-meas-tech.net/3/1437/2010/
K. Weigel et al.: CRISTA-NF measurements during AMMA                                                                               1449

Fig. 7. CRISTA-NF and TDC temperatures during flight L5. The
TDC temperatures are plotted along the flight altitude with the same
color scale as the 2-D representation of CRISTA-NF temperatures.
Black dots mark spectra with a CI lower than 3.5. Note the non-
linear color scale.

5.2   Trace gas results

Figure 9 shows the results of the H2 O retrieval along the
flight track together with total water measured in situ by
the Fast In situ Stratospheric Hygrometer (FISH; Zoeger et
al., 1999). Since CRISTA-NF observes gas-phase water and
                                                                       Fig. 8. CRISTA-NF and TDC temperatures during flight L5 shown
FISH measures total water (including water droplets and ice
                                                                       as profiles (a) and along the flight path (b). Along the flight the
crystals), only FISH measurements for non saturated condi-             CRISTA-NF temperature from the retrieval grid point below and
tions are included in the comparison. For water vapor, in-             above the flight path are shown. Error bars on CRISTA-NF data
dividual CRISTA-NF profiles with good signal to noise ratio            indicate combined plus smoothing error.
are available up to 15 km altitude. Therefore only FISH mea-
surements obtained during the ascent, dive and descent of the
aircraft (below 15 km) can be compared.                                for this is the fact that CRISTA-NF H2 O observations agree
   CRISTA-NF H2 O mixing ratios are generally higher than              much better to respective values from in situ observations for
FISH measurements obtained during ascend, dive, and de-                several other flights, e.g. on 29 July 2006 (Fig. 11). The large
scend (below 15 km). This also applies to H2 O profiles ob-            spatial and temporal variation of H2 O for flight L5 from Oua-
tained from the flight path segments with nearly constant al-          gadougou is also reflected by large differences observed by
titudes. However, all of these measurements have a consider-           FISH during ascent (lower values) and descent (higher val-
able horizontal distance to the closest CRISTA-NF profiles,            ues).
which makes comparisons difficult as a result of the enor-                Figure 12 shows a cross section of the CRISTA-NF O3
mous variability of water vapor in the troposphere. Unfortu-           retrieval results for the same flight. In general, the O3
nately, there are no CRISTA-NF profiles even close to these            volume mixing ratios are lower than about 200 ppbv be-
ascent in situ data (Fig. 9). In particular, during the ascent         low 17 km and increase rapidly above this level. There
of the aircraft, FISH H2 O mixing ratios are much lower. In-           are several profiles with relatively high O3 volume mixing
terestingly, the best agreement is obtained for the last limb-         ratios between 100 and 200 ppbv below 15 km. Compar-
profile before descent, which has the smallest horizontal dis-         isons to ozone values measured by the Fast OZone AN-
tance to the corresponding in situ measurement location (see           alyzer (FOZAN; Yushkov et al., 1999) show good agree-
Fig. 10b). It seems therefore likely that the higher H2 O mix-         ment (see also Fig. 13). Mean CRISTA-NF O3 values agree
ing ratios from CRISTA-NF are at least partly due to higher            well with respective FOZAN measurements between 10 and
H2 O mixing ratios south of Ouagadougou. Further evidence              13.5 km. The mean CRISTA-NF O3 values are lower above

www.atmos-meas-tech.net/3/1437/2010/                                                       Atmos. Meas. Tech., 3, 1437–1455, 2010
1450 K. Weigel et al.: CRISTA-NF measurements during AMMA
Fig. 9. CRISTA-NF and FISH H2 O during flight L5. The FISH
H2 O are plotted along the flight altitude with the same color scale
as the 2-D representation of CRISTA-NF H2 O. Black dots mark
spectra with a CI lower than 3.5. Note the non-linear color scale.
this altitude range and higher at lower altitudes. However,
for most cases the differences are within the combined er-
ror of the CRISTA-NF retrievals. Although the resolution
of CRISTA-NF O3 observations is lower than for tempera-
ture and H2 O, the degradation of the FOZAN data with the
AVKs has no large effect on the resulting in situ profile used
for the comparison. For the other flights where FOZAN data
are available (T3, T4) the CRISTA-NF O3 is systematically
higher than the FOZAN measurements where the ozone mix- Fig. 10. CRISTA-NF and FISH H2 O during flight L5 shown for all
ing ratio becomes rather low, i.e. below 10 to 12 km, respec- profiles (a) and profile 155.
tively. The deviations from FOZAN exceed the CRISTA-
NF covariance and smoothing error in these cases (Weigel,
2009).
Retrieval results for HNO3 , PAN, CCL4 , and aerosol ex-
CRISTA-NF and in situ data both show large horizontal
tinction are presented in Fig. 14. Again, strict filtering cri-
variability of O3 along the flight track. CRISTA-NF O3 ob-
teria are applied to CRISTA-NF data to show only reliable
servations in the vicinity of the aircraft and corresponding
results. The most interesting feature of Fig. 14 is an en-
and FOZAN in situ measurements agree rather well in term
hancement of the amounts of HNO3 and PAN below 15 km
of relative variations along the horizontal flight track. This
altitude that might be caused by pollution sources of denser
is demonstrated in Fig. 13b that shows the in situ ozone data
populated areas at Ouagadougou or areas at the coast of Côte
in comparison with the CRISTA-NF results at retrieval grid
d’Ivoire, Ghana, and Togo. Highest HNO3 mixing ratios as-
altitudes just below and above the flight track. Note that
sociated with this pattern are found in the southern part of the
even for the small vertical distance of 500 m significant dif-
flight and close to the descent in Ouagadougou below about
ferences of ozone mixing ratios are found in the CRISTA-NF
12 km. With the exception of these polluted air masses, the
observation, as a result of relatively steep vertical gradients.
mixing ratio of HNO3 monotonically increases with altitude.
The O3 measurements of FOZAN are in between the higher
PAN mixing ratios rapidly decrease in the upper troposphere
CRISTA-NF O3 values at the retrieval grid points above and
(above 14 km) and reach values below the detection limit of
lower O3 values at the retrieval grid just below, but closer to
CRISTA-NF at about 17 km altitude. The lowest CCL4 mix-
the higher values. It should be noted that like in the case of
ing ratios are found above the flight altitude at 20 to 21 km,
temperature, the horizontal variability seen in the in situ data
caused by the decrease of CCL4 in the stratosphere due to
is better resembled by CRISTA-NF observations than by cor-
photolytic decomposition.
responding ECMWF O3 fields.
Atmos. Meas. Tech., 3, 1437–1455, 2010 www.atmos-meas-tech.net/3/1437/2010/K. Weigel et al.: CRISTA-NF measurements during AMMA 1451
Fig. 11. CRISTA-NF and FISH H2 O during flight TF2 shown for
all profiles.
Fig. 13. CRISTA-NF and FOZAN O3 during flight L5 shown
as profiles (a) and along the flight path (b). Along the flight the
CRISTA-NF O3 from the retrieval grid point below and above the
flight path are shown if both fulfill the quality requirements together
with the combined plus smoothing error.
Fig. 12. CRISTA-NF and FOZAN O3 during flight L5. The
FOZAN O3 are plotted along the flight altitude with the same color
scale as the 2-D representation of CRISTA-NF O3 . Black dots mark We utilized a fast radiative transfer model and retrieval
spectra with a CI lower than 3.5. Note nonlinear color scale. processor to retrieve atmospheric data from nine spectral
windows of an CRISTA-NF detector channel covering the
spectral region from 776 to 868 cm−1 . A new retrieval
6 Discussion and summary scheme is presented that provides atmospheric fields of tem-
perature, H2 O, O3 , HNO3 , PAN, CCL4 , and aerosol extinc-
In this paper, we present measurements by the CRISTA-NF tion. At the same time, the radiometric offset and mea-
instrument on-board the high-flying Russian research aircraft surement altitudes are retrieved. Simultaneous retrieval of
M55-Geophysica. The limb-sounding instrument provides temperature and altitude are necessary due the insufficient
profile observations with dense sampling in the vertical di- accuracy of the combined M55-Geophysica and CRISTA-
rection and horizontally along the flight track. With its capa- NF pointing system. Our approach involves a combina-
bilities it serves as a demonstrator for proposed UTLS satel- tion of limb-radiances from spectral bands around 792 cm−1
lite missions such as PRocesses Exploration through Mea- and 845 cm−1 , in combination with good a priori knowl-
surements of Infrared and millimeter-wave Emitted Radia- edge of CO2 and CFC-11 mixing ratios. Within the alti-
tion (PREMIER) (e.g. Riese et al., 2005 and ESA, 2008). tude range covered by measurements the achieved vertical
www.atmos-meas-tech.net/3/1437/2010/ Atmos. Meas. Tech., 3, 1437–1455, 20101452 K. Weigel et al.: CRISTA-NF measurements during AMMA
Fig. 14. CRISTA-NF results for CCL4 , HNO3 , aerosol extinction and PAN. Black dots mark spectra with a CI lower than 3.5. Note nonlinear
color scales.
resolution of the retrieved atmospheric constituents varies corresponding values from the the in situ measurements. In
between about 500 m and 3 km, depending on the retrieved addition, CRISTA-NF measurements resemble the horizontal
quantities and the tangent altitude sampling of the individ- variations found in the in situ data better than corresponding
ual profiles. Measurement contribution and retrieval errors ECMWF data.
indicate a good data quality for H2 O (below about 15 km),
temperature, CCL4 , PAN, O3 , and HNO3 . The distribution Supplementary material related to this
of the simultaneous retrieved trace gases and temperatures article is available online at:
show an overall consistent result. http://www.atmos-meas-tech.net/3/1437/2010/
Retrieved profiles of CRISTA-NF temperature, H2 O, and amt-3-1437-2010-supplement.pdf.
O3 O3 were compared to corresponding in situ observations
on-board M55-Geophysica from TDC, FISH, and FOZAN.
In general, the CRISTA-NF data agree well with in situ ob- Acknowledgements. The AMMA-SCOUT-O3 measurement
servations. Differences found can partly be explained by campaign was facilitated by the European Commission and the
spatial differences between the measurement positions of EC Integrated Project SCOUT-O3 (505390-GOCE-CT-2004) and
CRISTA-NF and the in situ instruments. Some systematic AMMA. Based on a French initiative, AMMA was built by an
differences between CRISTA-NF retrieval results and the in international scientific group and is currently funded by a large
number of agencies. It has been the beneficiary of a major financial
situ measurements were found, i.e. higher temperatures and
contribution from the European Communities Sixth Framework
H2 O volume mixing ratios in the troposphere and low O3
Research Program. Many thanks also to the team and pilots of
volume mixing ratios in the lower stratosphere. Good agree- the Myasishchev Design Bureau for making the M55-Geophysica
ment is found for temperature and O3 measurement in the flights possible under difficult logistic conditions. We like to thank
vicinity of the aircraft, where is best spatial and temporal co- Anu Dudhia for providing the MIPAS Reference Forward Model
incidence is obtained. For most cases, the absolute values and his help to include the HITRAN 2004 spectroscopic database.
of the CRISTA-NF observations are in good agreement with For providing other observation data for comparisons and retrieval
Atmos. Meas. Tech., 3, 1437–1455, 2010 www.atmos-meas-tech.net/3/1437/2010/K. Weigel et al.: CRISTA-NF measurements during AMMA 1453
support I like to thank Fabrizio Ravegnani and Vladimir Yushkov troposphere from the Spurt project: an overview, Atmos. Chem.
for the FOZAN data, Cornelius Schiller and the FISH-Team for the Phys., 6, 283–301, doi:10.5194/acp-6-283-2006, 2006.
FISH data, Genrich Shur for the TDC data, and the ACE-FTS Team European Space Agency: PREMIER: Candidate Earth Explorer
for the ACE-FTS data. The Atmospheric Chemistry Experiment Core Missions - Reports for Assessment, ESA SP-1313(5), Mis-
(ACE), also known as SCISAT, is a Canadian-led mission mainly sion Science Division, ESA-ESTEC, Noordwijk, The Nether-
supported by the Canadian Space Agency and the Natural Sciences lands, ISSN 0379–6566, 121 pp., 2008.
and Engineering Research Council of Canada. Last but not least Fastie, W. G.: Ebert Spectrometer Reflections, Phys. Today, 4(1),
we like to thank everybody, who provided technical support for the 37–43, 1991.
CRISTA-NF measurements and data analysis. Francis, G. L., Edwards, D. P., Lambert, A., Halvorson, C. M.,
Lee-Taylor, J. M., and Gille, J. C.: Forward modeling and ra-
Edited by: Erkki Kyrölä diative transfer for the NASA EOS-Aura High Resolution Dy-
namics Limb Sounder (HIRDLS) instrument, J. Geophys. Res.,
111, D13301, doi:10.1029/2005JD006270, 2006.
References Glatthor, N., von Clarmann, T., Fischer, H., Funke, B., Grabowski,
U., Höpfner, M., Kellmann, S., Kiefer, M., Linden, A., Milz, M.,
Allen, G., Remedios, J. J., and Smith, K. M.: Low temperature mid- Steck, T., and Stiller, G. P.: Global peroxyacetyl nitrate (PAN)
infrared cross-sections for peroxyacetyl nitrate (PAN) vapour, retrieval in the upper troposphere from limb emission spectra of
Atmos. Chem. Phys., 5, 3153–3158, doi:10.5194/acp-5-3153- the Michelson Interferometer for Passive Atmospheric Sounding
2005, 2005. (MIPAS), Atmos. Chem. Phys., 7, 2775–2787, doi:10.5194/acp-
Bernath, P. F., McElroy, C. T., Abrams, M. C., Boone, C. D., Butler, 7-2775-2007, 2007.
M., Camy-Peyret, C., Carleer, M., Clerbaux, C., Coheur, P.-F., Grossmann, K. U., Offermann, D., Gusev, O., Oberheide, J., Riese,
Colin, R., DeCola, P., DeMaziére, M., Drummond, J. R., Dufour, M., and Spang, R.: The CRISTA-2 mission, J. Geophys. Res.,
D., Evans, W. F. J., Fast, H., Fussen, D., Gilbert, K., Jennings, D. 107(D23), 8173, doi:10.1029/2001JD000667, 2002.
E., Llewellyn, E. J., Lowe, R. P., Mahieu, E., McConnell, J. C., Gordley, L. L. and Russell III, J. M.: Rapid inversion of limb radi-
McHugh, M., McLeod, S. D., Michaud, R., Midwinter, C., Nas- ance data using an emissivity growth approximation, Appl. Op-
sar, R., Nichitiu, F., Nowlan, C., Rinsland, C. P., Rochon, Y. J., tics, 20, 807–813, 1981.
Rowlands, N., Semeniuk, K., Simon, P., Skelton, R., Sloan, J. J., Hervig, M. E., Russell III, J. M., Gordley, L. L., Park, J. H., and
Soucy, M.-A., Strong, K., Tremblay, P., Turnbull, D., Walker, K. Drayson, S. R.: “Observationa of aerosol by the HALOE experi-
A., Walkty, I., Wardle, D. A., Wehrle, V., Zander, R., and Zou, J.: ment onboard UARS: A preliminary Validation”, Geophys. Res.
Atmospheric Chemistry Experiment (ACE): Mission overview, Lett., 20(12), 1291–1294, 1993.
Geophys. Res. Lett., 32, L15S01, doi:10.1029/2005GL022386, Hoffmann, L.: Schnelle Spurengasretrieval für das Satellitenexper-
2005. iment Envisat MIPAS, Ph.D. thesis, University of Wuppertal,
Cairo, F., Pommereau, J. P., Law, K. S., Schlager, H., Garnier, Wuppertal, Germany 2006.
A., Fierli, F., Ern, M., Streibel, M., Arabas, S., Borrmann, S., Hoffmann, L., Kaufmann, M., Spang, R., Müller, R., Remedios,
Berthelier, J. J., Blom, C., Christensen, T., D’Amato, F., Di Don- J. J., Moore, D. P., Volk, C. M., von Clarmann, T., and Riese,
francesco, G., Deshler, T., Diedhiou, A., Durry, G., Engelsen, M.: Envisat MIPAS measurements of CFC-11: retrieval, val-
O., Goutail, F., Harris, N. R. P., Kerstel, E. R. T., Khaykin, S., idation, and climatology, Atmos. Chem. Phys., 8, 3671–3688,
Konopka, P., Kylling, A., Larsen, N., Lebel, T., Liu, X., MacKen- doi:10.5194/acp-8-3671-2008, 2008.
zie, A. R., Nielsen, J., Oulanowski, A., Parker, D. J., Pelon, J., Hoffmann, L. and Alexander M. J.: Retrieval of Strato-
Polcher, J., Pyle, J. A., Ravegnani, F., Rivière, E. D., Robin- spheric Temperatures from AIRS Radiance Measurements
son, A. D., Röckmann, T., Schiller, C., Simões, F., Stefanutti, for Gravity Wave Studies, J. Geophys. Res., 114, D07105,
L., Stroh, F., Some, L., Siegmund, P., Sitnikov, N., Vernier, J. P., doi:10.1029/2008JD011241, 2009.
Volk, C. M., Voigt, C., von Hobe, M., Viciani, S., and Yushkov, Hoffmann, L., Weigel, K., Spang, R., Schroeder, S., Arndt, K.,
V.: An introduction to the SCOUT-AMMA stratospheric aircraft, Lehmann, C., Kaufmann, M., Ern, M., Preusse, P., Stroh, F., and
balloons and sondes campaign in West Africa, August 2006: Riese, M.: CRISTA-NF measurements of water vapor during the
rationale and roadmap, Atmos. Chem. Phys., 10, 2237–2256, SCOUT-O3 Tropical Aircraft Campaign, Adv. Space Res., 43(1),
doi:10.5194/acp-10-2237-2010, 2010. 74–81, 2009.
Dudhia, A., Morris, P. E., and Wells, R. J.: Fast monochromatic Holton, J. R., Haynes, P. H., McIntyre, M. E., Douglass, A. R.,
radiative transfer calculations for limb sounding, J. Quant. Spec- Rood, R. B., and Pfister, L.: Stratosphere-Troposphere Ex-
trosc. Ra., 74(6), 745–756, 2002. change, Rev. Geophys., 33(4), 403–439, 1995.
Dufour, G., Boone, C. D., and Bernath, P. F.: First mea- Homan, C. D., Volk, C. M., Kuhn, A. C., Werner, A., Baehr, J., Vi-
surements of CFC-113 and HCFC-142b from space using ciani, S., Ulanovski, A., and Ravegnani, F.: Tracer measurements
ACE-FTS infrared spectra, Geophys. Res. Lett., 32, L15S09, in the tropical tropopause layer during the AMMA/SCOUT-
doi:10.1029/2005GL022422, 2005. O3 aircraft campaign, Atmos. Chem. Phys., 10, 3615–3627,
Engel, A., Bönisch, H., Brunner, D., Fischer, H., Franke, H., doi:10.5194/acp-10-3615-2010, 2010.
Günther, G., Gurk, C., Hegglin, M., Hoor, P., Königstedt, R., Kiefer, M., von Clarmann, T., Grabowski, U., De Laurentis, M.,
Krebsbach, M., Maser, R., Parchatka, U., Peter, T., Schell, D., Mantovani, R., Milz, M., and Ridolfi, M.: Characterization of
Schiller, C., Schmidt, U., Spelten, N., Szabo, T., Weers, U., MIPAS elevation pointing, Atmos. Chem. Phys., 7, 1615–1628,
Wernli, H., Wetter, T., and Wirth, V.: Highly resolved obser- doi:10.5194/acp-7-1615-2007, 2007.
vations of trace gases in the lowermost stratosphere and upper
www.atmos-meas-tech.net/3/1437/2010/ Atmos. Meas. Tech., 3, 1437–1455, 2010You can also read