Evidence for the predictability of changes in the stratospheric aerosol size following volcanic eruptions of diverse magnitudes using space-based ...
←
→
Page content transcription
If your browser does not render page correctly, please read the page content below
Atmos. Chem. Phys., 21, 1143–1158, 2021
https://doi.org/10.5194/acp-21-1143-2021
© Author(s) 2021. This work is distributed under
the Creative Commons Attribution 4.0 License.

Evidence for the predictability of changes in the stratospheric
aerosol size following volcanic eruptions of diverse magnitudes
using space-based instruments
Larry W. Thomason1 , Mahesh Kovilakam2 , Anja Schmidt3,4 , Christian von Savigny5 , Travis Knepp1 , and
Landon Rieger6
1 NASA    Langley Research Center, Hampton, Virginia, USA
2 SSAI,  Hampton, Virginia, USA
3 Department of Chemistry, Cambridge University, Cambridge, UK
4 Department of Geography, Cambridge University, Cambridge, UK
5 Institute of Physics, University of Greifswald, Greifswald, Germany
6 Institute of Space and Atmospheric Studies, University of Saskatchewan, Saskatoon, Saskatchewan, Canada

Correspondence: Larry W. Thomason (l.w.thomason@nasa.gov)

Received: 18 May 2020 – Discussion started: 18 June 2020
Revised: 23 November 2020 – Accepted: 25 November 2020 – Published: 27 January 2021

Abstract. An analysis of multiwavelength stratospheric            1   Introduction
aerosol extinction coefficient data from the Stratospheric
Aerosol and Gas Experiment II and III/ISS instruments is          Volcanic eruptions represent the primary source of varia-
used to demonstrate a coherent relationship between the           tion in stratospheric aerosol levels (Thomason et al., 1997b;
perturbation in extinction coefficient in an eruption’s main      Solomon et al., 2011; Schmidt et al., 2018; Robock, 2000).
aerosol layer and the wavelength dependence of that pertur-       The optical signature of volcanically derived aerosol is gen-
bation. This relationship spans multiple orders of magnitude      erally dominated by sulfuric acid droplets, but this can be
in the aerosol extinction coefficient of stratospheric impact     enhanced by the presence of ash either mixed with the sul-
of volcanic events. The relationship is measurement-based         furic acid droplets or as distinct layers (Winker and Osborn,
and does not rely on assumptions about the aerosol size dis-      1992; Vernier et al., 2016). Sulfuric acid aerosol is known
tribution. We note limitations on this analysis including that    for its ability to significantly modulate climate (Schmidt and
the presence of significant amounts of ash in the main sul-       Robock, 2015), primarily by scattering incoming solar ra-
furic acid aerosol layer and other factors may significantly      diation to space, and even relatively small volcanic events
modulate these results. Despite these limitations, the findings   have been noted to affect global temperature trends (Santer
suggest an avenue for improving aerosol extinction coeffi-        et al., 2014). In addition, as sulfuric acid aerosol particles
cient measurements from single-channel observations such          absorb upwelling infrared radiation, the presence of a vol-
as the Optical Spectrograph and Infrared Imager System as         canic aerosol layer can change the thermal structure of the
they rely on a prior assumptions about particle size. They        stratosphere (Labitzke, 1994) and the troposphere and mod-
may also represent a distinct avenue for the comparison of        ulate stratospheric circulation as well as transport across the
observations with interactive aerosol models used in global       tropopause (Pitari et al., 2016). Significant effort has been
climate models and Earth system models.                           expended toward measuring stratospheric aerosol using a va-
                                                                  riety of instruments (Kremser et al., 2016), and an exten-
                                                                  sive data collection of observations are now available. Some
                                                                  global climate models (GCMs) and Earth system models
                                                                  (ESMs) use these measurements or parameters directly de-
                                                                  rived from them (Mann et al., 2015), whereas others, which

Published by Copernicus Publications on behalf of the European Geosciences Union.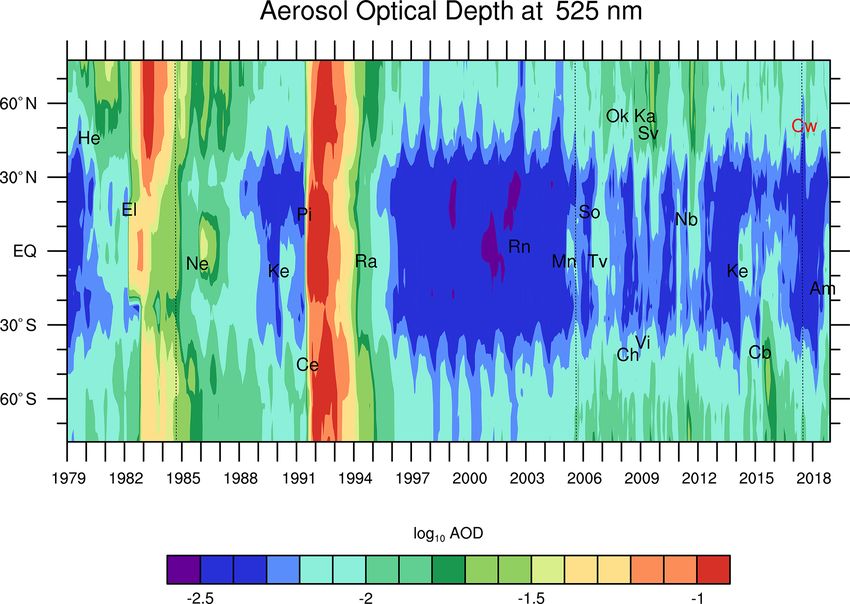
1144 L. W. Thomason et al.: Evidence for the predictability of changes in the stratospheric aerosol size
use interactive aerosol model schemes (Mills et al., 2016) and
similar tools (Toohey et al., 2016), assess how well their tools
replicate observations and, thus, infer the reliability of the
models’ assessment of the climate impact of volcanic erup-
tions (Timmreck et al., 2016).
The initial impetus for this study was to develop tools to
understand how reliably the long-term variability of strato-
spheric aerosol can be characterized given the limited data
sets available. Thus, one aim of this work was to under-
stand how small to moderate volcanic events manifest them-
selves in SAGE II/III observations with the goal of infer-
ring the uncertainty in single-wavelength space-based data
sets that use a fixed aerosol size distribution as a part
of their retrieval algorithm, such as the Optical Spectro-
graph and Infrared Imager System (OSIRIS; 2002–present)
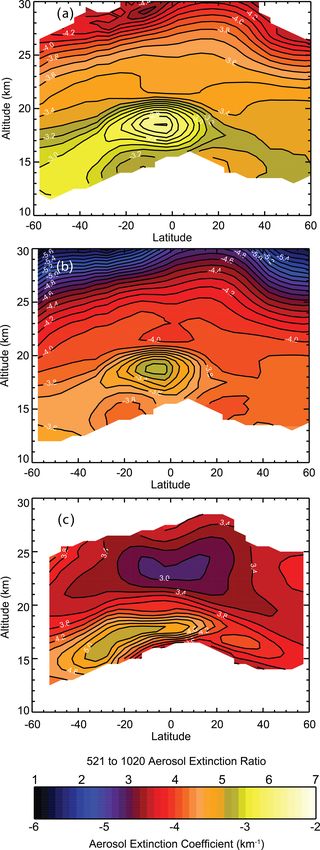
and the Cloud-Aerosol LIdar with Orthogonal Polarization Figure 1. Stratospheric aerosol optical depth at 525 nm from GloS-
(CALIOP; 2006–present) (Rieger et al., 2019; Kar et al., SAC v2.0 (Kovilakam et al., 2020). Volcanic and similar events are
2019). The current OSIRIS algorithm is dependent on a pri- denoted using the abbreviations given in Table 1. Dotted vertical
ori assumptions about the aerosol size distribution and, thus, lines indicate (from left to right) the start of the SAGE II mission
a fixed spectral dependence for aerosol extinction coefficient. in 1984, the end of the SAGE II mission in 2005, and the start of the
As we show below, there are substantial changes in the spec- SAGE III mission in 2017.
tral dependence of aerosol extinction coefficient following
these eruptions, which the current OSIRIS algorithm does
not capture. A longer-term goal is to infer how well the 2 Data and methods
wavelength dependence can be estimated for these single-
wavelength measurements. These factors are relevant not Space-based measurements of stratospheric aerosol
only for understanding the limitations in single-channel data have been made on a nearly global basis since the
sets but also for the multi-instrument data sets that are re- Stratospheric Aerosol and Gas Experiment (SAGE;
liant on them, such as the Global Space-based Stratospheric aboard the Applications Explorer Mission 2 plat-
Aerosol Climatology (GloSSAC) (Kovilakam et al., 2020). form) operated from 1979 through 1981 (Chu
For this study, we make use of observations made by the and McCormick, 1979). The SAGE II mission
Stratospheric Aerosol and Gas Experiment (SAGE) II (1984– (https://doi.org/10.5067/ERBS/SAGEII/SOLAR_BINARY_L2-
2005) and III/ISS (2017–present) which span a broad range V7.0) spanned the recovery of stratospheric aerosol levels
of volcanic perturbations of the stratosphere. We demon- from two large-magnitude volcanic eruptions: the eruption
strate that, for the most part, the changes in aerosol ex- of El Chichón in 1982 and the 1991 eruption of Mt. Pinatubo
tinction coefficient and apparent aerosol particle size, where (Thomason et al., 2018). Here, we define large-magnitude
we use the spectral dependence of aerosol extinction coef- eruptions as those with a volcanic explosivity index (VEI;
ficient as a proxy for size, are well correlated across nearly Newhall and Self, 1982) of 6 or more, and small- to
2 orders of magnitude in extinction coefficient change. This moderate-magnitude eruptions as those with a VEI of 3, 4,
relationship is a directly measurable characteristic of the or 5, whereby we only consider those eruptions that had a
changes in the aerosol size distribution following an erup- measurable impact on the stratospheric aerosol load in the
tion without assumptions regarding the functional form for period from 1979 to 2019 (see Table 1). The Mt. Pinatubo
the aerosol size distribution (e.g., lognormal). As compar- eruption was the largest stratospheric event since at least
isons of interactive aerosol model scheme calculations and Krakatau in 1883 (Stothers, 1996). In the SAGE II record,
measurements of stratospheric aerosol form the basis of as- the Mt. Pinatubo event remains clearly detectable until
sessing how well GCMs’ and ESMs’ microphysics mod- the late 1990s; thus, it has an impact on nearly half of the
ules perform, the observed relationship provides a potentially 21-year data set. In the 7 years of SAGE II observations prior
unique, measurement-focused means of assessing interactive to Mt. Pinatubo, stratospheric aerosol levels consistently
aerosol models for volcanic eruptions of different magni- decrease following the 1982 El Chichón eruption (Thomason
tudes. et al., 1997a). As a result, nearly 75 % of the SAGE II record
is dominated by the recovery from two large-magnitude
volcanic events. This can be clearly seen in Fig. 1 where the
long-term variation in the stratospheric aerosol optical depth
from the Global Space-based Stratospheric Aerosol Clima-
tology (GloSSAC), a global multi-instrument climatology of
Atmos. Chem. Phys., 21, 1143–1158, 2021 https://doi.org/10.5194/acp-21-1143-2021
L. W. Thomason et al.: Evidence for the predictability of changes in the stratospheric aerosol size                          1145

aerosol optical properties, is shown for 1979 through 2018         benign periods where the zonal variance is often not much
(Kovilakam et al., 2020). As a result, due to the timing of the    larger than the measurement uncertainty, particularly in the
SAGE II mission, much of what is inferred as the “normal”          tropics (Thomason et al., 2010). The events we discuss be-
properties of stratospheric aerosol inferred from SAGE II          low are not sampled in a temporally uniform way, and the
observations is skewed toward these large events rather than       time between an eruption and the first SAGE II observations
a handful of small to moderate events that occur throughout        at the relevant latitudes varies from a few days to more than
the period of interest.                                            a month. This is an outcome of the sparse spatial sampling
   As shown in Fig. 1, starting with the January 2005 erup-        characteristic of solar occultation, with latitudinal coverage
tion of Manam, which is near the end of the SAGE II record         dictated by orbital and seasonal considerations; moreover, a
(October 1984 through August 2005), there are regular              given latitude is measured at best once or twice per month. In
injections of aerosol and its precursors following volcanic        addition, with 15 profiles per day with 24◦ of longitude spac-
eruptions. While none of these events approached the               ing, the sampling is sparse with respect to longitude even
magnitude of Mt. Pinatubo or El Chichón, they were able to         when latitudes of interest are available. Furthermore, aerosol
subtly modulate climate and are of general scientific interest     properties in a single profile at a single altitude are the av-
(Solomon et al., 2011; Ridley et al., 2014; Schmidt et al.,        erage of multiple samples along different line-of-sight paths
2018). From the end of the SAGE II mission in August 2005          through the atmosphere such that the spatial extent of a mea-
until the start of the SAGE III/ISS mission in June 2017,          surement at an altitude extends over hundreds if not thou-
space-based missions consist of measurements used in GloS-         sands of square kilometers (Thomason et al., 2003). This
SAC from instruments such as OSIRIS and CALIOP (Rieger             large measurement volume increases the possibility that only
et al., 2019; Kar et al., 2019) and data from other instruments    part of a SAGE II observation’s measurement volume will
including the Scanning Imaging Absorption Spectrometer             actually consist of a mix of volcanically derived material and
for Atmospheric Cartography (SCIAMACHY; von Savigny,               unperturbed stratosphere. As a result, the interpretation of an
2015), the Michelson Interferometer for Passive Atmo-              extinction measurement pair must be carried out in a simi-
spheric Sounding (MIPAS; Griessbach et al., 2016), the             lar fashion to SAGE observations of water clouds, which are
Ozone Mapping and Profiler Suite Limb Profiler (OMPS LP;           better interpreted as a mixture of aerosol and cloud extinc-
Loughman et al., 2018), and Global Ozone Monitoring by             tion coefficients rather than purely “cloud” extinction coeffi-
Occultation of Stars (GOMOS; Bingen et al., 2017). Since           cients (Thomason and Vernier, 2013). With these limitations,
the start of the ongoing SAGE III/ISS mission in June 2017         the ability to characterize the attributes of the early plume is
(https://doi.org/10.5067/ISS/SAGEIII/SOLAR_HDF4_L2-                restricted.
V5.1, last access: 10 February 2020), several additional              The SAGE instruments use solar occultation to measure
small to moderate volcanic events have been observed               aerosol extinction coefficient at multiple wavelengths from
including two eruptions by Ambae (April and July 2018;             the ultraviolet to the near infrared. These measurements are
Kloss et al., 2020b), an eruption by Raikoke (June 2019;           of high accuracy and precision across a broad range of ex-
Muser et al., 2020), and an eruption by Ulawun (June/August        tinction levels, have a vertical resolution of ∼ 1 km, and are
2019). In addition, there are at least two pyrocumulus (also       reported in 0.5 km increments from 0.5 to 40.0 km (Damadeo
known as flammagenitus) events, specifically the Canadian          et al., 2013). The multiwavelength aerosol extinction coef-
forest fire event of August 2017 (Kloss et al., 2019; Bourassa     ficient measurements provide limited information regarding
et al., 2019) and the Australian bush fires of December 2019       the details of the aerosol size distribution (Thomason et al.,
and January 2020 (Khaykin et al., 2020). These nonvolcanic         2008; Von Savigny and Hofmann, 2020), although many ef-
events are interesting but are not the focus of this paper.        forts at deriving the aerosol size distribution have been pro-
After 2005, the frequency of small volcanic and smoke              posed (Yue and Deepak, 1983; Wang et al., 1996; Bingen et
events is substantially higher than observed during the            al., 2004; Malinina et al., 2018; Bauman et al., 2003; Ander-
SAGE II mission, and there is a significant qualitative            son et al., 2000). The primary measure of particle size for
difference in the stratospheric aerosol variability in between     SAGE II comes from the ratio of the aerosol extinction coef-
the two periods. After the end of the SAGE II mission              ficient measurements at 525 and 1020 nm. Figure 2a shows
in 2005 and until the start of the SAGE III mission, the           the Mie aerosol extinction coefficient as a function of par-
long-term stratospheric record is less robust, which is partly     ticle radius at 525 and 1020 nm for sulfuric acid aerosol at
due to the limited global multiwavelength measurements of          stratospheric temperatures (based on Bohren and Huffman,
aerosol extinction coefficient.                                    1998), and their ratio is shown in Fig. 2b . While incorporat-
   It should be clear from the outset that the solar occultation   ing a realistic size distribution would complicate the picture,
measurement strategy is, in general, not conducive to process      the ratio relationship shows approximately how the inferred
studies and understanding the distribution of aerosol follow-      aerosol size changes with the extinction coefficient ratio.
ing highly localized events like volcanic eruptions. Follow-       Over the lifetime of the SAGE II mission, in the stratospheric
ing these sorts of events, we observe that SAGE observations       aerosol layer, this ratio varies from around 5 (∼ 0.2 µm) to
have a high zonal variance in the data compared with more          values of around 1, where the ability to discriminate aerosol

https://doi.org/10.5194/acp-21-1143-2021                                            Atmos. Chem. Phys., 21, 1143–1158, 2021
1146 L. W. Thomason et al.: Evidence for the predictability of changes in the stratospheric aerosol size
Table 1. Volcanic eruptions and smoke events that significantly impact stratospheric aerosol levels in Version 2.0 of the GloSSAC data set
(Kovilakam et al., 2020); these events are denoted in Fig. 1 using the abbreviations in parentheses following their names.
Volcano name Eruption date Latitude
St. Helens (He) 27 Mar 1980 46◦ N
El Chichón (El) 4 Apr 1982 17◦ N
Nevado del Ruiz (Ne) 14 Nov 1985 5◦ S
Kelut (Ke) 10 Feb 1990 8◦ S
Pinatubo (Pi) 15 Jun 1991 15◦ N
Cerro Hudson (Ce) 12 Aug 1991 46◦ S
Rabaul (Ra) 19 Sept 1994 4◦ S
Ruang (Rn) 25 Sept 2002 2◦ N
Manam (Mn) 27 Jan 2005 4◦ S
Soufrière Hills (Sh) 20 May 2006 16◦ N
Tavurvur (Tv) 07 Oct 2006 4◦ S
Chaitén (Ch) 02 May 2008 42◦ S
Okmok (Ok) 12 Jul 2008 55◦ N
Kasatochi (Ka) 07 Aug 2008 55◦ N
Fire/Victoria (Vi) 07 Feb 2009 37◦ S
Sarychev (Sv) 12 Jun 2009 48◦ N
Nabro (Nb) 13 Jun 2011 13◦ N
Kelut (Ke) 13 Feb 2014 8◦ S
Calbuco (Cb) 22 Apr 2015 41◦ S
Canadian wildfires (Cw)∗ Aug 2018 51◦ N
Ambae (Am) 5–6 Apr 2018/27 Jul 2018 15◦ S
∗ Canadian wildfires (Cw) occurred in August 2017 and created pyrocumulonimbus
(PyroCb) that injected smoke into the stratosphere (Peterson et al., 2018). This event is
also marked in Fig. 1.
Figure 2. (a) Mie extinction efficiency for sulfuric acid droplets at stratospheric temperatures at 525 (solid) and 1020 nm (dashed). (b) The
ratio of extinction coefficient at 525 to 1020 nm for single particles as a function of radius for sulfuric acid aerosol at stratospheric tempera-
tures.
is reduced to noting that the particles are “large” with extinc- tion that the “normal” process is that volcanic input into the
tion dominated by aerosol larger than ∼ 0.5 µm. As shown in stratosphere generally increases the aerosol extinction coef-
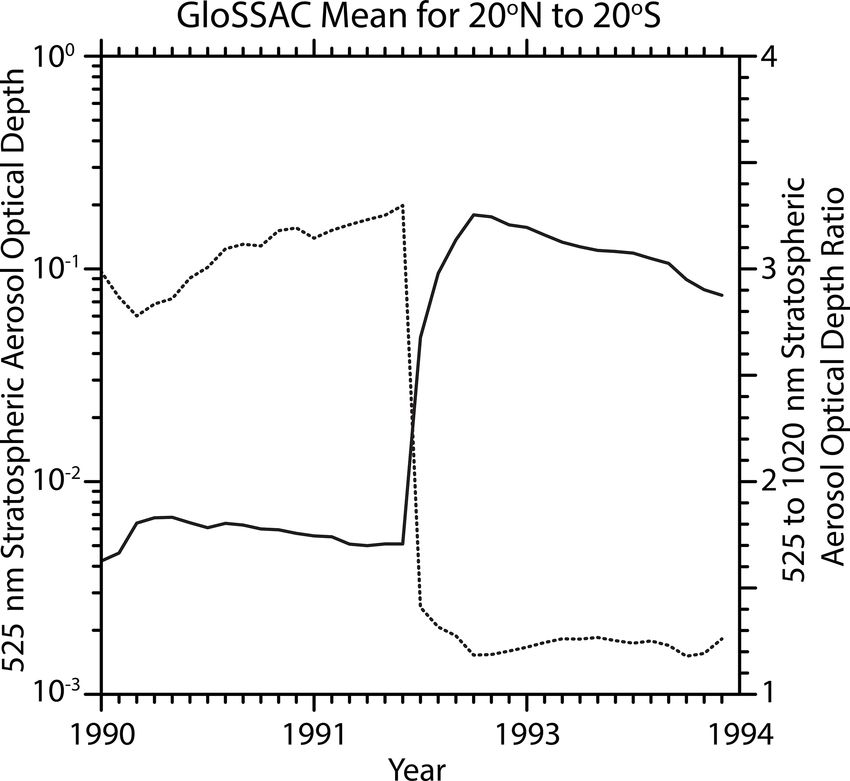
Fig. 3, the mean GloSSAC v2.0 525 nm stratospheric aerosol ficient and decreases the aerosol extinction coefficient ratio
optical depth between 20◦ S and 20◦ N, whose construction is (suggesting an increase in the size of particles that dominate
discussed in detail in Kovilakam et al. (2020), increased by a aerosol extinction). However, we will demonstrate below that
factor of about 40 between June and July 1991. At the same the impact of volcanic events on the stratospheric aerosol ex-
time, the 525 to 1020 nm optical depth ratio changed from tinction coefficient ratio is strongly modulated by the magni-
around 3.3 to a ratio of about 1.2. With low volcanic activity tude of the eruption and, to a lesser extent, the stratospheric
in this period, the relaxation of stratospheric aerosol loading aerosol loading prior to the eruption. We will also show that
toward background levels remains obvious in the tropics into the data suggest that sulfur-rich but relatively ash-poor erup-
the late 1990s. The Mt. Pinatubo event can lead to the percep- tions show a consistent, predictable behavior that lends it-
Atmos. Chem. Phys., 21, 1143–1158, 2021 https://doi.org/10.5194/acp-21-1143-2021L. W. Thomason et al.: Evidence for the predictability of changes in the stratospheric aerosol size 1147
SAGE III/ISS in identical ways except for one detail. The
current version of SAGE III data (5.1) has a defect in which
aerosol extinction at 521 nm is biased low below about 20 km
due to an error in the O4 absorption cross section used in pro-
cessing this version. The O4 error has a subtle, positive im-
pact on the ozone retrieval below 20 km where there is sig-
nificant overlap in the spectral regions used to retrieve ozone
and where O4 absorbs. The small error in ozone has a larger
impact on aerosol where ozone absorbs strongly (521, 602,
and 676 nm), but other aerosol measurement wavelengths
are unaffected. Therefore, we have replaced the 521 nm data
product with an interpolation between 448 and 756 nm that
employs a simple Ångström coefficient scheme. The 448
and 756 nm aerosol extinction coefficients do not manifest
the bias, whereas 602 and 676 nm measurements have bi-
ases similar to those at 521 nm. The interpolation is possible
as stratospheric aerosol extinction coefficient is always ob-
Figure 3. The GloSSAC v2.0 depiction of the 525 nm aerosol op- served to be smoothly varying with wavelength and approx-
tical depth (solid) and the 525 to 1020 nm stratospheric aerosol op- imately linear in log–log space. The presence of the 521 nm
tical depth ratio (dotted) for 1990 through the end of 1993, encom- bias is inferred using this methodology, and this approach
passing the Kelut eruption in early 1990 and the Mt. Pinatubo erup- was used in the validation paper for SAGE III/Meteor 3M
tion in mid-1991. aerosol data (Thomason et al., 2010). The differences be-
tween the inferred 521 nm extinction coefficients and the re-
ported values in the lower stratosphere (tropopause to 20 km)
self as a test for interactive aerosol schemes used in global average about 6 % and are usually less than 10 %. Above
climate models. We also observe that the presence of large 20 km the differences are usually on the order of 1 % to 2 %
aerosol, probably ash, following a few eruptions significantly with the estimate usually less than the observation; this is
modulates these results. probably a reflection of the limitation of the accuracy of the
interpolation and is consistent with past uses of the same ap-
proach (Thomason et al., 2010). In any case, the same ar-
3 Results guments regarding the effects of small to moderate volcanic
eruptions on aerosol extinction coefficient as a function of
Herein, we examine the impact of 11 eruptions by 9 volca- wavelength described below can be made whether the 448 or
noes (see Table 2) that affected the stratosphere for which 521 nm aerosol extinction coefficient is used in the SAGE III
there are SAGE II or SAGE III/ISS measurements available. analysis. We interpolate the 521 nm values solely for compar-
These begin with the November 1985 eruption of Nevado ison with SAGE II data, and this process has minimal impact
del Ruiz (Colombia) and continue to the second eruption of on the conclusion drawn below.
Ulawun (Papua New Guinea) in August 2019. Two volca- For each event, we collect all SAGE II/III aerosol extinc-
noes have two eruptions in this record: Ambae in April and tion coefficient data at 525 and 1020 nm between 10 and
July 2017 and Ulawun in June and August 2019. Due to the 25 km where the profiles occur within 10◦ latitude of the
nature of SAGE III sampling, the Ulawun events cannot be eruption for a period starting 3 months prior to the eruption
distinguished well and are treated as a single event. Over- until 6 months following it. Depending on the latitude, as
all, the eruptions increase aerosol extinction coefficient be- recorded in Table 2, and season, the volume and frequency
tween 10−4 and 10−2 km−1 relative to pre-eruption levels, of observations can vary significantly. Figure 4a shows all
with a similar relative increase of 2 orders of magnitude com- of the data for Nevado del Ruiz in this temporal window at
pared with the levels observed prior to the eruptions. From the altitude of the maximum increase in aerosol extinction
observations in the latitude region near the location of each coefficient – in this case 20.5 km. The Nevado del Ruiz erup-
eruption and extending from just prior to each eruption to tion occurred on 13 November 1985 (Julian day 317), and
several months following the eruption, we infer the impact the immediate enhancement of aerosol extinction coefficient
of these eruptions by noting the perturbation on the strato- is clear: aerosol extinction coefficient increases by about an
spheric aerosol extinction at both 525 and 1020 nm when order of magnitude from about 0.0007 km−1 to values ap-
the extinction coefficient at 1020 nm is at a maximum. The proaching 0.01 km−1 . As shown in Fig. 4b, the aerosol ex-
ratio of these perturbations provides a rough assessment of tinction coefficient ratio increases from about 2.2 prior to the
the impact of the eruptions on the size of particles dominat- eruption to a broad range of values from 2 to 3.5 immediately
ing aerosol extinction. We analyze data from SAGE II and following the eruption (∼ Day 380 or January 1986); this is
https://doi.org/10.5194/acp-21-1143-2021 Atmos. Chem. Phys., 21, 1143–1158, 20211148 L. W. Thomason et al.: Evidence for the predictability of changes in the stratospheric aerosol size
Table 2. Volcanic events observable in the SAGE II (1984–2005) and SAGE III/ISS (2017–present) records including the total number of
observations used in the analysis.
Eruption Date Latitude Altitude SAGE Julian date
(km) observations of eruption(s)
Nevado del Ruiz 13 Nov 1985 5◦ N 20.5 634 317
Kelut 10 Feb 1990 8◦ S 20.5 523 41
Mt. Pinatubo 17 Jun 1991 15◦ N 22.0 433 168
Cerro Hudson 8 Aug 1991 46◦ S 11.5 1162 221
Ruang 25 Sep 2002 9◦ S 18.5 255 268
Manam 27 Jan 2005 4◦ S 20.0 219 27
Ambae 5–6 Apr 2018/28 Jul 2018 15◦ S 18.0 858 95/209
Raikoke 22 Jun 2019 48◦ N 15.0 1014 173
Ulawun 26 Jun 2019/3 Aug 2019 5◦ S 18.5 491 177/215
the inverse of what was observed following the Mt. Pinatubo pattern is clear in Fig. 4a and b. We defer to this pattern and
eruption, as shown in Fig. 3. The Nevado del Ruiz extinction average the extinction values at both 525 and 1020 nm into
ratio becomes much more consistent in the subsequent sam- these irregularly spaced temporal duration bins. We required
ples of this region of the stratosphere and falls from roughly a minimum of six profiles to be available in the temporal
2.8 to 2.4 at the end of the analysis period (∼ Day 560 or bin for the bin to be included in further analysis. This elimi-
July 1986). The early spread in extinction coefficient and nates a few periods, such as the few points around Julian day
in the extinction coefficient ratio is primarily due to inho- 340 and around Julian day 350, as seen in Fig. 4a. Within
mogeneity in the volcanic aerosol within the analysis area each bin, we select the maximum values of the extinction
(Sellitto et al., 2020). This is suggested by Fig. 5 in which coefficient at 1020 nm in each profile within a 4 km vertical
the extinction coefficient ratio is plotted versus extinction window (nine observations) that extends from 1 km below
coefficient for this data set. Almost without exception, the to 3 km above the broadly observed maximum in the extinc-
enhancement in aerosol extinction coefficient is associated tion profiles (20.5 km in this case); this vertical window is
with larger extinction coefficient ratio values. The distinction chosen because we try to capture the behavior of the most
between volcanically perturbed observations and the unper- intense part of the volcanic layer, including the tendency for
turbed periods prior to the eruption is clearly recognizable. the layer to increase in altitude during the months following
A handful of points show very high aerosol extinction co- the eruption. The 4 km window is primarily a way to find
efficients but extinction coefficient ratios close to and occa- the altitude (and the associated extinction coefficients) of the
sionally less than those observed prior to the eruption (< 2.3 volcanic layer in each profile, as it can vary from profile to
or so). For these observations, some large particles (possibly profile, within a temporal bin, and over the months following
ash) are evidently present; however, as SAGE-like observa- the eruption. For events in this analysis, there is a 0.5 to 2 km
tions contain little or no information about composition, their rise in the altitude of the peak aerosol extinction coefficient
composition cannot be inferred unambiguously. In any case, during the analysis period following the eruption, which is
these points are rare and are only observed in the first month mostly due to dynamical processes (Vernier et al., 2011). The
following the eruption, which is possibly due to the removal averaging produces a simplified characterization of the ef-
of large particles by sedimentation. Generally, we find that fects of the eruption, as shown in Fig. 6. In this figure, we see
the low-latitude eruptions like Nevado del Ruiz exhibit less that the change in aerosol extinction coefficient and extinc-
zonal variability in aerosol extinction coefficient than mid- tion coefficient ratio are well correlated, with both reaching
and high-latitude events. For instance, SAGE III/ISS obser- a maximum near Julian day 380 (as sampled by SAGE II).
vations of the Canadian pyrocumulus event in August 2017 One difference is that while both parameters begin to relax
(Bourassa et al., 2019) varied with respect to extinction co- back toward pre-eruption levels, extinction coefficient does
efficient at some latitudes from a pre-event extinction of so faster than the extinction coefficient ratio. As the scale for
10−4 km−1 to values that exceeded 10−2 km−1 as late as the extinction coefficient ratio does not extend to zero, the
the end of October 2017. In this regard, low-latitude events difference in the recovery rates is even more significant. Fig-
are a more straightforward evaluation than high-variability, ure 7 shows the same plots for the remaining nine eruptions.
higher-latitude events. They can be crudely sorted into two categories. While all
Given the geometry of the solar occultation measurements, show relatively rapid increases in the aerosol extinction co-
SAGE II and III sample a latitude band episodically, revisit- efficient at 1020 nm with the maximum values occurring with
ing a latitude every few weeks to months and making obser- the first or second observation by SAGE II/III, one category
vations in a latitude band for 1 to several days. This sampling of eruption is similar to the Nevado del Ruiz eruption, show-
Atmos. Chem. Phys., 21, 1143–1158, 2021 https://doi.org/10.5194/acp-21-1143-2021L. W. Thomason et al.: Evidence for the predictability of changes in the stratospheric aerosol size 1149
Figure 4. The time series of the SAGE II 1020 nm aerosol extinction coefficient (in km−1 ) (a) and the 525 to 1020 nm aerosol extinction
coefficient ratio (b) at 20.5 km between 10◦ S and 10◦ N in days from 1 January 1985 (Day 1); thus, the first day is 19 July 1985, the eruption
occurs on Day 317 (13 November 1985), and the plot ends on 23 August 1986. The date of the eruption is denoted by a vertical dashed red
line.
Figure 5. The same data as shown in Fig. 4a and b except now plot-
Figure 6. Same data as shown in Fig. 4 except averaged in temporal
ted as the 1020 nm aerosol extinction coefficient (in km−1 ) versus
data clusters. In this figure, extinction coefficient is the solid line
the extinction coefficient ratio. The extinction coefficient ratio is a
and the extinction coefficient ratio is the dotted line. The date of the
rough estimate of the size of aerosol particles that dominate extinc-
eruption is denoted by the vertical red dashed line.
tion. Values near 1 suggest a particle radius greater than ∼ 0.4 m
with increasing values indicating smaller particles. Values for ob-
servations prior to the eruption are red. All data are for 20.5 km.
(Fig. 7d), and Raikoke in 2018 (Fig. 7g). We will now discuss
some individual events.
ing rapid increases in the aerosol extinction ratio following Figure 8a shows the before and after state of the main
the eruption. These tend to be among the smaller eruptions aerosol layer for these 10 eruptions. Here, “before” values
and include Cerro Hudson in 1991 (Fig. 7c), Manam in 2005 are defined as the first data point in the series shown in
(Fig. 7e), Ambae twice in 2018 (Fig. 7f), and Ulawun twice Fig. 7, and “after” values are defined as the point where
in 2019 (Fig. 7g). In the case of the second Ambae erup- the 1020 nm aerosol extinction coefficient reaches a maxi-
tion, there is a small increase in the observed aerosol extinc- mum. As one could infer from Fig. 7, we see two types of
tion coefficient ratio following the eruption, and it remains events – those with positive slopes (larger extinction / larger
large (∼ 4.8) compared with the value prior to the first Am- extinction ratio) and those with negative slopes (larger ex-
bae eruption (∼ 3.2). A second category of volcanic events tinction / smaller extinction ratio) – with some suggestion of
shows the opposite behavior, with a decrease in the extinc- a change in slope from strongly positive to negative with in-
tion ratio following an event; such events include Kelut in creasing aerosol extinction coefficient perturbation. To iso-
1990 (Fig. 7a), Mt. Pinatubo in 1991 (Fig. 7b), Ruang in 2002 late this change, we define an aerosol extinction coefficient
https://doi.org/10.5194/acp-21-1143-2021 Atmos. Chem. Phys., 21, 1143–1158, 20211150 L. W. Thomason et al.: Evidence for the predictability of changes in the stratospheric aerosol size
Figure 7. Similar analysis as that shown in Fig. 6 except for Kelut in 1990 (a); Mt. Pinatubo (b) and Cerro Hudson (c) in 1991; Ruang in
2002 (d); Manam in 2005 (e); Ambae in 2018 (f); and Ulawun (g) and Raikoke (h) in 2019. In each frame, extinction coefficient is the solid
line and the extinction coefficient ratio is the dotted line. The dates of the eruptions are denoted by the vertical red dashed lines. The plot for
the Nevado del Ruiz eruption shown in Fig. 6 is repeated here in panel (i) for comparison. Days refer to the number of days since the start of
year in which the analysis begins for an individual eruption. For panels (a) to (i) these years are 1989, 1991, 1991, 2002, 2004, 2018, 2019,
and 2019, respectively.
perturbation as cient perturbation ratio (or more simply perturbation ratio) as
perturbation ratio = δk525 /δk1020 . (2)
δkλ = kλ (after) − kλ (before) , (1)
which is computed for 1020 and 525 nm, where the 1020 nm Figure 8b shows the relationship between the perturbation
aerosol extinction coefficient is a maximum. It should be parameters. The perturbation ratio for eight of these events
noted that the maximum extinction coefficient at 525 nm is well sorted by the magnitude of the extinction coefficient
does not necessarily occur at the same altitude or time as perturbation from the smallest extinction coefficient pertur-
the maximum in the 1020 nm extinction coefficient. There bation event (Manam) to the largest (Mt. Pinatubo). Based
is some variability in the timing of the before data used in on Fig. 2b, we would expect that the relationship would
this analysis; however, within these data sets, we observe asymptote to about one for large events close to or larger
that aerosol extinction coefficient levels at a given altitude than Mt. Pinatubo, reflecting the presence of very large ra-
and latitude slowly vary with time independent of recent vol- dius aerosol (>0.4 µm); thus, some sort of curvature seems
canic activity due to the recovery from past volcanic activity reasonable. It should be noted that SAGE II did not observe
and seasonal processes. For the events discussed here, due to the entirety of the Mt. Pinatubo plume due to its extreme
the timing of the events, these changes are very small com- opacity. However, the available observations uniformly show
pared with the volcanic events in our study and, in terms of very high extinction (>10−2 km−1 ) and a low extinction ra-
the calculation of perturbation values, the exact background tio (∼ 1) with all observations. Therefore, while the detailed
level only has a secondary effect on the calculated values. As location of the Mt. Pinatubo data in plots 7 and 8 is not exact,
a result, the timing of the before samples does not materially the general location, particularly in Fig. 8b, is representative
affect these results. We define an aerosol extinction coeffi- of this event. While the perturbation ratio approach effec-
Atmos. Chem. Phys., 21, 1143–1158, 2021 https://doi.org/10.5194/acp-21-1143-2021L. W. Thomason et al.: Evidence for the predictability of changes in the stratospheric aerosol size 1151 Figure 8. The “before” (left-hand point) to peak 1020 nm aerosol extinction coefficient (right-hand point) for the 10 eruptions considered in this study is shown in panel (a), and the differences between them (perturbations) are shown in panel (b). tively treats the aerosol as an add-on to the before aerosol to 4.7 with an increase of 1020 nm extinction from approxi- extinction, we do not suggest that volcanic aerosol does not mately 10−4 to about 3 × 10⁻³ km−1 . The second eruption interact with the pre-existing aerosol. Nonetheless, the ob- initially increases the extinction coefficient ratio from 4.5 served relationship in Fig. 8b suggests that the values of just prior to the eruption to 4.9 with the earliest observations the perturbation pair (extinction coefficient and perturbation shortly after the eruption; this value subsequently decreases ratio) are insensitive to the initial conditions of the strato- to 4.1 when aerosol extinction coefficient is at a maximum. spheric aerosol. This relationship suggests a potential route Aerosol extinction coefficient increases from 2.0 × 10⁻⁴ to to inferring uncertainty in the OSIRIS and CALIOP data dur- 1.3 × 10⁻³ km−1 or by about a factor of 6 (Fig. 7f). With ing the SAGE II to SAGE III/ISS gap period by estimating these values, and despite appearances, both eruptions fit well changes in the extinction coefficient slope (or Ångström co- with the majority of the other events (Fig. 8b). In this case, efficient) based on perturbations in those instruments’ mea- the eruptions occur at slightly different altitudes, so the ap- sured quantities. There is uncertainty regarding the details parent rise in the aerosol layer from the beginning to the end of this analysis, particularly as it relates to the timing of of the period is a little larger than for most events (∼ 2 km). the measurements following the eruption; thus, the appar- In this case, particularly for the second eruption, the extinc- ent linearity of the eight data points should be interpreted tion change is so large that the impact of the pre-eruption cautiously. Nonetheless, it should be possible for ESMs and aerosol values is negligible. Another interesting feature is GCMs with detailed aerosol microphysical models to calcu- that the largest ratios after the eruption do not necessarily late aerosol extinction coefficient at any wavelength; there- coincide with the largest extinction. Figure 9 shows the ex- fore, this analysis may provide the opportunity for a small to tinction latitude–altitude cross sections for September 2018 moderate volcanic plume closure experiment. for 521 nm (Fig. 9a) and 1020 nm (Fig. 9b) as well as their Despite the close timing of the two Ambae eruptions in ratio (Fig. 9c). It is clear here that the maximum in the ex- 2018 (April and July), the eruptions are clearly distinguish- tinction ratio lies below the main peak in the extinction coef- able in the SAGE III/ISS data shown in Fig. 7f, with the ficient in the tropics and notably stretches to higher southern later eruption being many times more intense than the ear- latitudes; however, the maximum extinction ratio value ac- lier one (Kloss et al., 2020b). Individually, the Ambae (Van- tually occurs near 30◦ S despite more inhomogeneous con- uatu) eruptions in 2018 are similar to the Nevado del Ruiz ditions at this latitude than in the tropics. This is not an ob- eruption that is discussed in detail above, as both show an vious outcome, but it is consistent with the general observa- increase in extinction coefficient and extinction coefficient tion that the largest perturbations in the extinction ratio occur ratio relative to the values seen in early 2018 (which is char- with smaller extinction coefficient perturbations, as shown in acteristic of most small to moderate eruptions). However, Fig. 8b. It also shows the importance of keeping in mind that the extinction coefficient ratio decreases following the sec- the relationship between extinction coefficient perturbation ond eruption, suggesting that the second eruption may be an and the overall extinction ratio in Fig. 8b is for the densest outlier to the generally observed behavior. To calculate the part of the volcanic plume and not for all parts of the volcanic perturbations for these two events, we use data from prior cloud. The fact that the dependence of the aerosol extinction to the first eruption as the before values for both, although coefficient perturbation ratio on extinction coefficient pertur- the results for the second eruption are insensitive to the per- bation occurs within a particular eruption as well as among turbation caused by the earlier eruption. The initial Ambae different eruptions (for the peak values shown in Fig. 8) im- eruption increased the extinction coefficient ratio from 3.2 plies that a consistent physical process is at work. https://doi.org/10.5194/acp-21-1143-2021 Atmos. Chem. Phys., 21, 1143–1158, 2021
1152                    L. W. Thomason et al.: Evidence for the predictability of changes in the stratospheric aerosol size

                                                                    Figure 10. The SAGE II 525 to 1020 nm aerosol extinction coeffi-
                                                                    cient ratio plotted versus the 1020 nm aerosol extinction coefficient
                                                                    (in km−1 ) during the Kelut event from December 1989 through Au-
                                                                    gust 1990 plotted at 20.5 km between 20◦ S and the Equator. Mea-
                                                                    surements occurring before the eruption are colored red.

                                                                    the weeks that follow (3.9). The Kelut scatterplot (Fig. 10)
                                                                    shows that while the scatter of extinction coefficient and ra-
                                                                    tio are compact for most of this period, there are some ob-
                                                                    servations of higher extinction and ratios approaching one
                                                                    that occur in the earliest observation period, suggesting the
                                                                    immediate presence of large aerosol (>0.5 µm). While the
                                                                    data do not inherently provide certainty, it is possible that an
                                                                    extinction-dominating presence of ash particles rather than
                                                                    sulfuric acid particles in the main aerosol layer immediately
                                                                    after the eruption may push the perturbation location below
                                                                    the rough curve suggested by most of the events. Similar
                                                                    data from Ruang are less illuminating due to a much smaller
                                                                    sample in the 50 % duty cycle period of SAGE II data (af-
                                                                    ter the end of 2000), and it is not possible to infer a cause
                                                                    for their anomalous position in Fig. 8b. Both eruptions show
                                                                    increased aerosol extinction coefficient ratios away from the
Figure 9. The mean SAGE III/ISS 525 (a) and 1020 nm (b) aerosol     main aerosol peak, suggesting, at least in part, behavior more
extinction coefficient and the 525 to 1020 nm aerosol extinction    consistent with most eruptions.
coefficient ratio (c) as a function of latitude and altitude from      Another interesting feature are differences between the
September 2019, shortly after the second 2019 eruption of Ambae
                                                                    Nevado del Ruiz, Cerro Hudson, and Raikoke eruptions
(July 2019; 15◦ S).
                                                                    which cause very similar extinction coefficient perturbations
                                                                    but different perturbation extinction ratios. The position of
                                                                    Nevado del Ruiz in Fig. 8b is consistent with the overall per-
   There are two events lying a considerable distance from          turbation relationship. Raikoke lies on the same side as the
the main curve in Fig. 8b: Ruang and the 1990 eruption of           Kelut and Ruang eruptions but, unlike Kelut, there is little
Kelut. For Kelut, the first observations of the plume take          evidence of a mix of increased extinction coefficient observa-
place about 10 d after the eruption. This is where the ex-          tions with small and large extinction ratios (large particles in-
tinction ratio is the lowest (Fig. 7a); it increases from 2.2 to    ferred to be ash but possibly other compositions) at the peak
2.6 in the following few weeks and then to 2.9 at the end of        extinction level, as the data essentially uniformly show small
the observation period. Ruang shows some similar features,          extinction coefficient ratios following the mean relationship
with the low perturbation ratio (2.9) occurring shortly after       in Fig. 7g. As Raikoke is one of only two midlatitude erup-
the eruption followed by a recovery toward larger values in         tions in the data set, it is possible that latitude plays a role

Atmos. Chem. Phys., 21, 1143–1158, 2021                                                https://doi.org/10.5194/acp-21-1143-2021
L. W. Thomason et al.: Evidence for the predictability of changes in the stratospheric aerosol size 1153
in the perturbation relationship. However, Cerro Hudson lies possible that volcanic precursor gases and sulfuric acid va-
closer to Nevado del Ruiz’s position and is a similar event por primarily condense onto existing aerosol and these, as
to Raikoke: it occurs at a similar latitude (although opposite well as very small homogeneously nucleated aerosol par-
hemisphere) and in a similar season as well as at a similar ticles, rapidly (compared to the measurement frequency of
pre-eruption aerosol extinction coefficient level. It is possi- SAGE-like measurements) coagulate to form much larger-
ble that atmospheric conditions or some detail of eruptions sized aerosol than after small-magnitude eruptions; thus,
can have a modulating impact on how events manifest them- the aerosol extinction coefficient ratio decreases extremely
selves with respect to extinction coefficient and ratio but not rapidly toward a value of one. This alternative is not consis-
be easily detectable from the data alone. For instance, for tent with the observations of most small to moderate erup-
Raikoke, we cannot exclude the possibility of the presence tions shown in Fig. 8, and the conceptual model we describe
of small amounts of ash embedded in the main aerosol layer below is not intended to capture this behavior.
with the sulfuric acid aerosol influencing extinction coeffi- To demonstrate how the homogeneous nucleation and co-
cient and ratio. The presence of ash following the Raikoke agulation process could impact SAGE-like observations, we
eruption has been inferred above 15 km and perhaps as high have used a conceptual model that simulates a volcanic per-
as 20 km (Muser et al., 2020; Kloss et al., 2020a). In this turbation as single-radii sulfuric acid particles that begin at a
case, it is possible that the ash is coated with sulfuric acid 1 nm radius and grow to large particle sizes (500 nm) but hold
and that these particles may freeze. It is also possible that py- the total volume of new aerosol material constant. The goal
rocumulus events in Alberta, Canada, and Siberia, occurring is to show that the large aerosol extinction coefficient per-
around the time of the Raikoke eruption (Yu et al., 2019), turbation ratios observed following small to moderate erup-
played a role in the evolution of extinction following this tions are consistent with the presence of many small parti-
event. Overall, there are substantial opportunities for com- cles that grow through coagulation to larger particles with
plex optical properties in this eruption. To some extent, while smaller extinction ratios. The model also shows why similar-
we are fortunate to have as many events for this analysis as sized eruptions can appear differently in extinction coeffi-
we do, it is still a relatively small sample, and some factors cient measurements depending on the state of stratospheric
that can impact the extinction coefficient–extinction ratio re- aerosol prior to the eruption. This is an extremely simple
lationship may not be fully revealed. view of how the aerosol size changes after an eruption and
cannot capture the details of the microphysical processes go-
ing on in the volcanic aerosol layer; nonetheless, we believe
4 Discussion that it provides a reasonable interpretation of the observa-
tions as well as a starting point for a model for post-volcanic
Based on the observations discussed above, although without aerosol spectral dependence that could be useful for OSIRIS
a detailed simulation of the aerosol microphysical processes and similar measurements including a degree of predictabil-
at play, we speculate that most small to moderate eruptions ity for events not measured by SAGE instruments, such as
are initially dominated by small (∼ 1 nm), mostly homoge- Sarychev, Kasatochi and Nabro. It may also be useful in com-
neously nucleated sulfuric acid particles that are present in parisons of SAGE-like observations and results from GCMs
very large number densities (Deshler et al., 1992; Boulon et and ESMs.
al., 2011; Sahyoun et al., 2019). As shown in Fig. 2a, due to For the model, we determine the volume density of aerosol
their small size, these particles are initially extremely poor required to produce 1020 nm extinction coefficient perturba-
scatterers and, thus, would not impact the SAGE-like extinc- tions of 10−4 , 10−3 , and 10−2 km−1 at a single radius of
tion measurements. However, as they coagulate into steadily 500 nm. This can be expressed using
larger particles (possibly also consuming small-sized aerosol
present in the pre-existing aerosol layer) and further conden- δkλ
n (r) = (3)
sation occurs, they would produce perturbations to the ob- Qλ (r)π r 2
served aerosol extinction and ratio that reflect their magni-
and
tude. This process generally causes an increase in the aerosol
extinction coefficient ratio but may produce the opposite ef- 4π r 3 n(r)
fect depending on the properties of the aerosol present prior V = , (4)
3
to the eruption (which is discussed in more detail below). The
coagulation process continues producing ever-larger aerosol where δkλ is the extinction coefficient perturbation at wave-
and smaller particle number densities until coagulation is no length λ (in this case 1020 nm), r is perturbation particle ra-
longer efficient at the timescales we examine here and with dius (500 nm), n(r) is the inferred perturbation particle num-
respect to mixing of the material within the stratosphere. ber density, Qλ (r) is the Mie extinction efficiency for the
Some eruptions, like that of Raikoke in 2019, clearly de- wavelength (shown for 525 and 1020 nm in Fig. 2a) and ra-
part from this conceptual model as we discuss further be- dius considered for sulfuric acid aerosol at stratospheric tem-
low. For large-magnitude eruptions, like Mt. Pinatubo, it is peratures, and V is the required volume density of aerosol.
https://doi.org/10.5194/acp-21-1143-2021 Atmos. Chem. Phys., 21, 1143–1158, 20211154 L. W. Thomason et al.: Evidence for the predictability of changes in the stratospheric aerosol size
Figure 11. The estimated 525 to 1020 nm aerosol extinction ratio and the 1020 nm aerosol extinction coefficient for the second Ambae
eruption (a, c) and Nevado del Ruiz (b, c) computed using fixed aerosol volume density perturbations and single-radii particles that yield an
extinction coefficient perturbation at 525 nm of 10−4 (solid), 10−3 (dotted), and 10−2 km−1 (dashed) using rough “before” 525 and 1020 nm
extinction coefficient values for each eruption.
The choice of 500 nm for this calculation is somewhat arbi- is akin to a time axis, although a particularly nonlinear one.
trary, and the use of any value would not affect the conclu- It is likely that the transition across the smallest size par-
sions drawn from this study. For an extinction perturbation of ticles is extremely rapid (relative to SAGE-like observation
10−2 km−1 , the number density is 4.50 cm−3 with a volume timescales at least), and the large end of the timescale may ef-
density of 2.37 µm3 cm−3 . Holding V fixed, we compute the fectively be reached rapidly for large events like Mt. Pinatubo
number density and the aerosol extinction coefficient pertur- but effectively never for small to moderate eruptions due to
bation as a function of radius at 525 and 1020 nm using the other processes that control coagulation and other as-
pects of aerosol morphology. Indeed, the first observations
3V of the main Mt. Pinatubo cloud in early July 1991, a few
n (r) = (5)
4π r 3 weeks after the eruption, show an extinction coefficient ratio
and of essentially one. Whether this would have been the case for
observations immediately after the eruption is an interesting
δkλ = Qλ (r) n (r) π r 2 (6) unknown. In the aftermath of the second Ambae eruption, as
shown in Fig. 7f, the aerosol extinction coefficient ratio max-
for a radii, r, from 1 to 500 nm. The ratio of these extinc- imum occurs before the extinction maximum at 1020 nm, and
tion coefficient perturbations follows the relationship shown the ratio has in fact decreased by the time the extinction coef-
in Fig. 2b. Finally, we add before aerosol extinction coeffi- ficient at 1020 nm is at a maximum. This is reproduced by the
cient values that we previously determined for the Nevado model for the “Ambae” eruption where the maximum in the
del Ruiz eruption and the July 2018 Ambae eruption and aerosol extinction ratio is observed at significantly smaller
show these relationships in Fig. 11a and c, respectively. Due radii (Fig. 11a) than the radii for which the 1020 nm aerosol
to their different pre-eruption extinction levels, the extinc- extinction coefficient is at a maximum (Fig. 11b). This be-
tion ratio plots shown for the two volcanic events are no- havior is also exhibited in the model for the Nevado del Ruiz
tably different despite having identical extinction coefficient eruption, where the aerosol extinction coefficient perturba-
perturbations at 525 and 1020 nm, which were computed us- tion ratio (shown in Fig. 11c) does not reach such a high
ing the above relationships. This is consistent with the data peak; nonetheless, it clearly reaches a maximum at smaller
shown in Fig. 8a. To some extent, the radius axis in this plot
Atmos. Chem. Phys., 21, 1143–1158, 2021 https://doi.org/10.5194/acp-21-1143-2021L. W. Thomason et al.: Evidence for the predictability of changes in the stratospheric aerosol size 1155
radii than the 1020 nm aerosol extinction coefficient maxi- that volcanic events with significant amounts of ash may be-
mum in Fig. 11d. have considerably differently from those dominated by the
If the initial growth to 200 nm is rapid at SAGE temporal sulfuric acid component.
sampling scales (∼ monthly), the model simulations quali- The perturbation relationship, shown in Fig. 8b, is only
tatively reproduce the increase in the extinction coefficient based on the measurements themselves and makes no as-
ratio seen in many of the eruptions analyzed with a step in- sumptions about the underlying composition or size distri-
crease in the extinction coefficient ratio followed by a de- bution of the aerosol. In this respect, it is a unique tool
crease in time. In addition, these results show that, while the to intercompare observations and interactive aerosol mod-
extinction coefficient perturbations themselves may be insen- els used in GCMs and ESMs. This should be extremely
sitive to the before stratospheric state, the result is not. In fact, straightforward as extinction coefficients can be calculated
scenarios can be easily constructed in which the same erup- from aerosol products already produced by these modules,
tion, again with minimal interaction with the pre-existing although care would need to be exercised to reproduce the
aerosol, results in a different sign in the slope of the change in observations used herein. As the results span a large dy-
the extinction coefficient ratio. Obviously, we must exercise namic range of aerosol extinction coefficient perturbations
caution in interpreting the observations based on the simple (> 2 orders of magnitude), the testing range covers a signif-
model employed here. For instance, as we do not know the icant range of volcanic events. As the observed relationship
timescale of coagulation, significant uncertainty remains in is well-behaved, testing is potentially not limited to observed
how to interpret Fig. 8b in a temporal sense. Moreover, the volcanic events but may be applied to hypothetical events or
aerosol volume density is unlikely to be constant over this historical events for which space-based observations do not
time as the conversion of SO2 to H2 SO4 has a time constant exist.
on the order of 30 d and depends on the magnitude of the A longer-term goal is to assess the data quality of
eruption. Nonetheless, while not a primary goal of this study, data sets consisting of a single-wavelength measurement of
we argue this very simple model suggests that SAGE II/III aerosol extinction coefficient or similar parameters, particu-
observations are consistent with volcanic material primarily larly when a fixed aerosol size distribution is a part of the
nucleating homogeneously followed by coagulation, whose retrieval process. This is important as a part of the data qual-
timescale depends on the magnitude of the eruption. In the ity assessment of these data sets as well as their use in long-
end, however, certainty can only be obtained via closure ex- term data sets such as GloSSAC. In this regard, the results
periments between observations such as these and GCMs and are mixed. It is clear from Fig. 8b that the wavelength de-
ESMs with detailed microphysical models. pendence of a predominant sulfuric acid volcanic event can
be estimated from the relationship shown therein. As a fixed
particle size distribution is used in the OSIRIS retrieval pro-
5 Conclusions cess, a fixed wavelength dependence is effectively intrinsic to
the OSIRIS aerosol extinction coefficient retrieval process.
Herein, we have used SAGE II/III observations to exam- The use of these results in OSIRIS retrievals is an ongoing
ine the behavior of stratospheric aerosol extinction coeffi- study which we hope will result in positive improvements in
cient in the aftermath of small- to large-magnitude volcanic the OSIRIS aerosol data products in the future. In the short-
events with the primary goal of understanding how these term, we believe that we may be able to use these results in
events manifest themselves in SAGE-like observations. We spot applications, such as assessing the extinction error due
have focused on initial plume development at peak extinc- to the fixed aerosol size distribution in the immediate after-
tion levels, not on the long-term development or details of math of an event.
its distribution, as transport and other aerosol processes such
as sedimentation have not been considered. At peak extinc-
tion levels, under most circumstances, we have found that Code and data availability. SAGE II
observations of the impact of volcanic eruptions on strato- (https://doi.org/10.5067/ERBS/SAGEII/SOLAR_BINARY_L2-
spheric aerosol, as measured by the SAGE series of instru- V7.0, Thomason, 2013) and SAGE III/ISS data
ments, show a crude independence of the characteristics of (https://doi.org/10.5067/ISS/SAGEIII/SOLAR_HDF4_L2-
V5.1, Thomason, 2020a) are accessible at the NASA
the pre-existing aerosol and a correlation between the magni-
Atmospheric Sciences Data Center. GloSSAC v2.0
tude of the enhancement in aerosol extinction coefficient and (https://doi.org/10.5067/GLOSSAC-L3-V2.0, Thomason, 2020b)
its wavelength dependence, as shown in Fig. 8b. While this is available from the same location. Data analysis products shown
relationship is insensitive to the pre-existing aerosol level, herein are available from the corresponding author upon request.
the pre-existing aerosol can modulate the observed changes
in the aerosol extinction coefficient ratio. The analysis is
straightforward for tropical eruptions but more challenging Author contributions. LWT developed the analysis tools used
for mid- and high-latitude eruptions where transport is gen- throughout the paper and was the primary of author of the arti-
erally more complex than in the tropics. Also, it is possible cle. MK and LR advised the author, particularly with respect to the
https://doi.org/10.5194/acp-21-1143-2021 Atmos. Chem. Phys., 21, 1143–1158, 2021You can also read