Irish Water and Scottish Water: A Comparison - Scientific ...
←
→
Page content transcription
If your browser does not render page correctly, please read the page content below
Journal of Water Resource and Protection, 2019, 11, 1064-1089
                                                                                                http://www.scirp.org/journal/jwarp
                                                                                                            ISSN Online: 1945-3108
                                                                                                              ISSN Print: 1945-3094

Irish Water and Scottish Water: A Comparison

Rodney McDermott1*, Brian Solan1, Sarah McCord1, Kim Littlewood2

Belfast School of Architecture and the Built Environment, Ulster University, Belfast, UK
1

Open University, Milton Keynes, UK
2

How to cite this paper: McDermott, R.,          Abstract
Solan, B., McCord, S. and Littlewood, K.
(2019) Irish Water and Scottish Water: A        Rising costs of production and the need for capital investment in the public
Comparison. Journal of Water Resource           water supply network in Ireland, has placed a strong emphasis on the need
and Protection, 11, 1064-1089.                  for water conservation and tackling the current high levels of leakage (De-
https://doi.org/10.4236/jwarp.2019.118063
                                                partment of the Environment, Community and Local Government, 2015) [1].
Received: June 29, 2019                         Consequently, Irish Water which is Ireland’s national water utility has had to
Accepted: August 27, 2019                       consider various business models and supply frameworks to demonstrate
Published: August 30, 2019
                                                value for money. This has included those successfully implemented by Scot-
Copyright © 2019 by author(s) and               tish Water. Therefore, the aim of this study was to compare both national
Scientific Research Publishing Inc.             utility providers in terms of structure and financial performance. The results
This work is licensed under the Creative        of this study showed that both utility providers differed significantly. The
Commons Attribution International
                                                Utility has, indeed, tried to achieve “too much too soon” (O’Leary, 2018 [2];
License (CC BY 4.0).
http://creativecommons.org/licenses/by/4.0/
                                                Donegal Now, 2016) [3]. Therefore, the initial results of this study suggest
               Open Access                      that, continuing to consider Scottish Water as the benchmark may generate
                                                unrealistic targets and expectations which in all probability may not be
                                                achieved.

                                                Keywords
                                                Irish Water, Scottish Water, Water Charges, Water Leakage, Water Utility

                                              1. Introduction
                                              The Scottish Water Corporation exemplar is playing a pivotal role in the devel-
                                              opment, design and implementation of a Water Industry Operating Framework
                                              in Ireland (Scottish Government, 2018) [4]. In this way, Irish Water has adopted
                                              the Scottish Water business model as a comparative benchmark to demonstrate
                                              value for money. This being the case, surely both utilities must have relatively
                                              similar financial models and priorities for asset improvement to ensure a fair
                                              unbiased comparison? If so, why has the financial model been a success in Scot-
                                              land and not in Ireland? The Scottish Water utility model was one of the main

DOI: 10.4236/jwarp.2019.118063         Aug. 30, 2019             1064                     Journal of Water Resource and Protection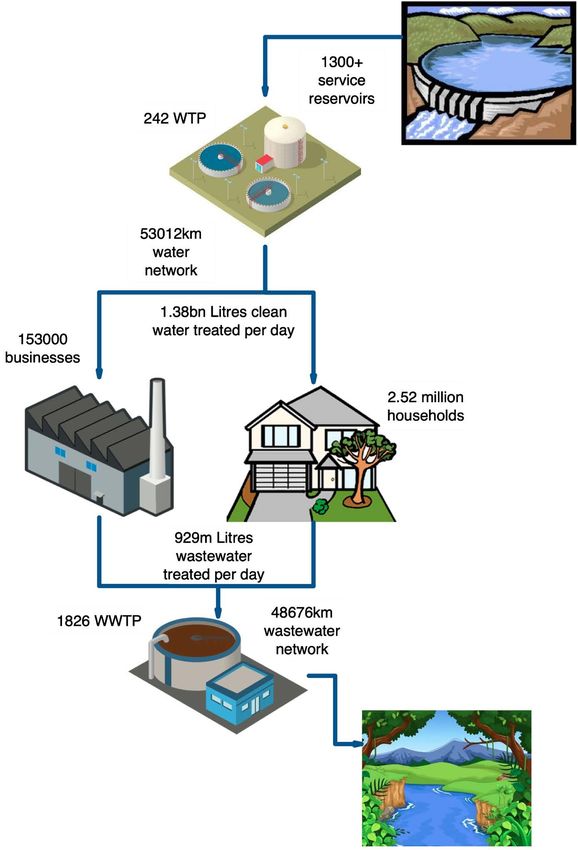
R. McDermott et al.

                                 exemplars used during the formation of the Irish Water utility (Scottish Water,
                                 2015) [5] and continues to provide major input towards the design of the Water
                                 Industry Operating Framework (WIOF) in Ireland (Scottish Government, 2018)
                                 [4]. In their report, Price Waterhouse Cooper (PWC) (2011) [6] also highlighted
                                 Scottish Water as a particularly useful model to consider alongside the Irish
                                 Water utility, due to its experience in amalgamation of Local Authority Water
                                 Services. As a well-established utility and one of the most efficient in the UK, the
                                 Scottish Water model was deemed as providing a good architype of water service
                                 provider success (NIA, 2014) [7]. Meetings were held between the two bodies
                                 during which Irish Water sought the advice and perspectives of top Scottish
                                 Water management (Irish Water, 2014) [8] regarding best practice and strategies
                                 for the management of the project. However, in recent years, Irish Water has
                                 undergone detailed scrutiny, much of which has been negative, whilst Scottish
                                 Water has been praised regularly for the efficient service it provides. Given this
                                 paradox between seemingly similar organisations, it is interesting to note that
                                 little or no formal research has been completed directly comparing the two
                                 companies. It is this gap in the published literature that the current authors
                                 aimed to address.

                                 2. Review of Existing Literature
                                 The existing literature was reviewed in relation to revenue, operational expendi-
                                 ture (OpEx) and capital expenditure (CapEx).

                                 2.1. Revenue
                                 Both Irish Water and Scottish Water are currently using very different methods
                                 to generate their finance. Following years of political debate and public outrage,
                                 Irish Water decided to abandon and refund volumetric domestic charges and is
                                 currently funded through general taxation (O’Regan, 2016 [9]; CRU, 2019) [10].
                                 Plans are in place to reintroduce domestic charging in the form of an excess use
                                 charge, aided by the meters which were installed during a nationwide domestic
                                 metering programme (Citizens Information, 2018 [11]; Finn, 2016) [12]. In con-
                                 trast, Scottish Water has never rolled out nationwide domestic metering. In-
                                 stead, they charge customers based on their council tax bands (Scottish Water,
                                 2019) [13]. Scottish Water has also recently introduced competition to their
                                 non-domestic market. The utility wholesales to licenced providers that retail
                                 their services to the non-domestic market (Utility Week, 2018) [14]. The usage
                                 of competition should ensure a fair and equitable service that provides value for
                                 money to end users, with quality being directly assured to the customers (WICS,
                                 2010) [15]. Conversely, in Ireland, there is no competition in the non-domestic
                                 market because Irish Water charges its non-domestic consumers directly based
                                 on their volumetric usage (RPS and Veolia, 2010) [16]. Finally, Irish Water ap-
                                 pears to have a high dependence on the Irish Government as a source of finance.
                                 This form of support is acceptable in time of economic growth and develop-

DOI: 10.4236/jwarp.2019.118063                       1065                    Journal of Water Resource and Protection
R. McDermott et al.

                                 ment; however, the financial crisis in recent decades means this source of reve-
                                 nue has been constrained. External financing is available in the form of grants,
                                 borrowing and shareholder capital (Blacklocke et al, 2014 [17]; Fitzgerald, 2018
                                 [18]). However, Scottish Water has no access to share capital and is less than
                                 10% funded by the Scottish Government. During the 2015-2016 and 2016-2017
                                 periods, Scottish Water received no additional government loans (Scottish Wa-
                                 ter, 2017 [19], Cuthbert 2018 [20]).

                                 2.2. Operational Expenditure
                                 Differences exist between Irish Water and Scottish Water in terms of activities
                                 related to operational expenditure. Whilst Irish Water is responsible for the pro-
                                 vision of water in Ireland, these services are also provided by local authorities
                                 under a series of Service Level Agreements (SLAs) (Kennelly, 2018 [21]; Irish
                                 Water, 2013 [22]). Many believe that this has left the Irish water industry frag-
                                 mented, expensive and has served as a barrier to efficient communication
                                 (Brennan, 2016 [23]; NERA, 2016 [24]). Experience has shown that adding lay-
                                 ers of bureaucracy creates inefficiencies which ultimately impacts the quality of
                                 the service provided. Consequently, Irish Water continues to be criticised in the
                                 national press and has been scrutinised for many reasons including consultancy
                                 charges, bonus payments and staff salaries (O’Regan, 2016 [9]; Finn, 2017 [25];
                                 Duffy, 2014 [26]). Similarly, Scottish Water has also been at the centre of similar
                                 controversies (Hutcheon, 2019) [27].
                                   Irish Water has faced leakage levels of almost 50% (equating to approximately
                                 833 Mil. L/day in 2014) and, in 2017, introduced a nationwide leakage reduction
                                 programme to reduce wastage (CER, 2017 [28]; Irish Water, 2015 [29]). Leakage
                                 in Scotland has been reduced to 492 Mil L/day and has achieved its calculated
                                 economic level of leakage (ELL) (Scottish Government, 2018a [30]). Pressure on
                                 the current water supply infrastructure is ever-increasing. According to Blacklocke
                                 et al (2014) [17], the water supply in the Greater Dublin Area (GDA) has little or
                                 no spare capacity. Despite having a comparatively high rainfall throughout the
                                 year, water shortages are not uncommon in the GDA in summer, particularly
                                 following any lower than average winter rainfall. The current population of
                                 Dublin alone stands at 1.3 million and requires in the region of 550 million litres
                                 of water every day Blacklocke et al. (2014) [17]. Dublin City Council (2010a)
                                 [31] estimates the Water Supply Area (WSA) will see the population increase to
                                 2.2 million people by 2031, utilising around 800 million litres per day. During
                                 the census of 2016, the population of Dublin was reported to be 1,173,179, a
                                 5.6% increase from the 2011 census Central Statistics Office (2018) [32]. The to-
                                 tal population of Ireland in 2018 was calculated to be 4,857,000, an 8.29% in-
                                 crease on the 2008 population (4,485,100). These changing demographics means
                                 Irish Water needs to upgrade and modernise the water supply in the GDA which
                                 will require significant capital expenditure. However, changes in populations
                                 and demand are unlikely to be a problem Scottish Water will face due to the

DOI: 10.4236/jwarp.2019.118063                       1066                    Journal of Water Resource and Protection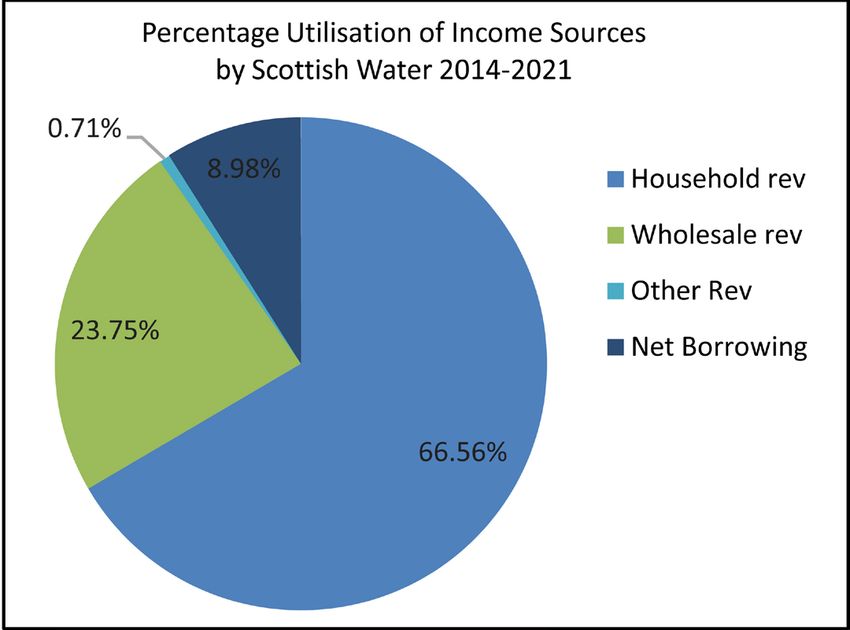
R. McDermott et al.

                                 abundance and evenly distributed rainfall across Scotland and the quality of
                                 their supply network.
                                   Another barrier, to the efficient operation and management of Irish Water, is
                                 the lack of available knowledge surrounding the current asset inventory (Irish
                                 Water, 2015) [29]. A similar problem was faced by Scottish Water in its forma-
                                 tive years, when significant time and effort was directed towards formalising as-
                                 set inventory (Audit Scotland, 2005) [33]. Irish Water has more than double the
                                 operating costs of the UK benchmark and was set a target reduction of 20% from
                                 2015 to 2018 (Irish Water, 2015 [29]; CER, 2016 [34]). However, real operating
                                 costs are expected to rise 13% by 2021 as a result of growth and expansion (Irish
                                 Water, 2015 [29]; CER, 2016 [34]). By contrast, Scottish Water has made con-
                                 tinuous and ongoing efforts to increase their efficiency including research into
                                 new technology that reduces the likelihood of pipe bursts and by increasing its
                                 capacity for renewable energy (Utility Week, 2017a [35]; W&WT, 2019 [36]).

                                 2.3. Capital Expenditure
                                 A major problem identified with Irish Water’s capital is its dependence on a
                                 Victorian-built infrastructure (Blacklocke, et al. 2014) [17]. It has been reported
                                 that Irish Water will spend approximately €370 million over a 10-year period on
                                 the replacement of lead pipes (O’Brien, 2016) [37]. In addition to the high num-
                                 ber of ongoing boil water notices (BWNs) in Ireland, there is also a significant
                                 number of waste water treatment plants in Ireland that are discharging raw
                                 sewage or have discharges that are non-compliant with European standards.
                                 Consequently, Irish Water was before the European Court of Justice for its fail-
                                 ure to comply with both the Drinking Water Directive (DWD) (EC, 1998) [38]
                                 and the Urban Waste Water Treatment Directive (UWWTD) (EC, 1991) [39].
                                 Therefore, significant capital expenditure will be required over the upcoming
                                 years to bring Ireland’s water infrastructure up to the necessary standards (EPA,
                                 2018 [40]; EPA, 2018a [41]). Furthermore, huge levels of capital investment will
                                 be required just to maintain the current service conditions which means a con-
                                 tinuation of the failure to meet current European standards and associated fines
                                 (Brady & Gray, 2018) [42]. This type of public censure from the European
                                 Commission (EC) may further erode public confidence in a utility that has sig-
                                 nificant ongoing PR problems.
                                   It is important to note that whilst Scottish Water has proven itself in recent
                                 years by successfully achieving European standards and meeting targets set by
                                 the Water Industry Commission for Scotland (WICS), this was not always the
                                 case. In its early years, Scottish Water faced many of the same problems that
                                 Irish Water is currently facing. Scottish Water struggled with the quantity and
                                 quality of assets available with much time and effort directed towards the for-
                                 malising available data (Audit Scotland, 2005) [33]. Many years of un-
                                 der-investment had left Scottish Water’s assets in poor condition. Over a 15-year
                                 period, £5 billion was spent to ensure compliance with European Union (EU)

DOI: 10.4236/jwarp.2019.118063                       1067                    Journal of Water Resource and Protection
R. McDermott et al.

                                 directives (Dickie and Sawkins, 2001) [43]. Byatt (2012) [44] reflected on a
                                 “clumsy assessment” of environmental and water obligations which would have
                                 led to a hugely expensive capital investment programme and subsequently an
                                 88% rise in prices. The WICS proposed a much lower capital investment which
                                 was accepted by Scottish Water. It is worth noting that on occasions, Scottish
                                 Water has also struggled to complete its capital programmes within the required
                                 periods (Hendry, 2016) [45].
                                   Capital expenditure currently accounts for approximately 50% of Scottish
                                 Water’s total expenditure (Hendry, 2016) [45]. In the regulatory period from
                                 2015-2021, Scottish Water will spend £3.9 billion ensuring its infrastructure is
                                 “fit for purpose” now and in the years to come (Scottish Government, 2018) [4].
                                 Scottish Water has committed to investing £3.9 billion between 2015-2021 with
                                 the aim of providing a water infrastructure for Scotland that will not only serve
                                 its current communities but also for decades to come (Scottish Government,
                                 2018 [4]; KPMG, 2018 [46]). Thus, Scottish Water is adding resilience to its asset
                                 base by future proofing its infrastructure base.

                                 2.4. Summary
                                 In terms of capital investment and operational practices, Scottish Water may
                                 have faced similar problems to Irish Water in its formative years; however,
                                 there are now major operational and income generation differences between
                                 Scottish Water and Irish Water. Therefore, with Scottish Water International
                                 Limited (which is a subsidiary of Scottish Water) currently working as a sub-
                                 contractor to Ernst & Young on the development, design and implementation
                                 of the Water Industry Operating Framework in Ireland (Scottish Government,
                                 2018) [4], it is vitally important to consider if Scottish Water should continue
                                 to be used as the comparative benchmark for transforming the future of Ire-
                                 land’s water industry.

                                 3. Method
                                 This study focused on three financial areas. Initially, revenue was studied, en-
                                 compassing each utility provider’s level of government borrowings and the asso-
                                 ciated charges to their respective consumer bases. Operational expenditure was
                                 then studied, not only as an indicator of the efficiency but also to provide a con-
                                 text of spending behaviours. However, this analysis concentrated on the capital
                                 expenditure profile, with a special focus on the percentage allocated towards the
                                 maintenance and upgrading of the current asset base. This gave insight into the
                                 main objectives and priorities of the organisations in terms of repairing or re-
                                 placing defective assets. The conditions of some assets were considered to give
                                 an indication of the general state of the water industries within the two coun-
                                 tries. This body of research involved a study of the financial accounts, Exchequer
                                 statements and relevant Commissioner publications over relevant operational
                                 years. Following the review of existing literature surrounding the two utilities, it

DOI: 10.4236/jwarp.2019.118063                       1068                     Journal of Water Resource and Protection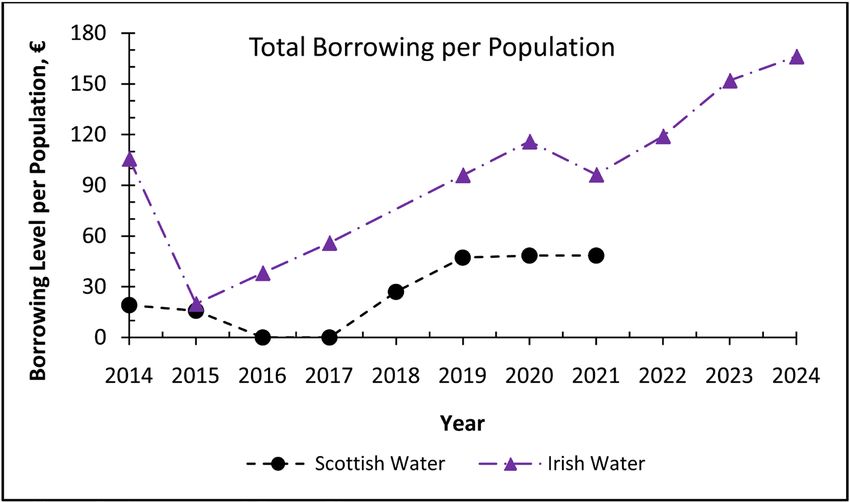
R. McDermott et al.

                                 was evident that further research was necessary. Table 1 shows the data sources
                                 used for the analysis. Table 2 shows the units used for the analysis of data.
                                   Currency exchange rates tend to fluctuate as a result of the changing market
                                 within the respective countries. There are many factors affecting the market in-
                                 cluding inflation rates, government debt and political stability. However, per-
                                 haps the most influential factor on the value of the Great Britain Pounds (GBP£)
                                 over recent years has been Brexit. The Brexit vote took place on 23rd June 2016
                                 and, since this date, mounting uncertainty has caused the value of the GBP£ to
                                 vary greatly over the past three years. For this reason, it has been decided that an
                                 average exchange rate was taken over the 2014-2018 period. For the conversion
                                 of Sterling (£) to Euro (€), a standard conversion factor of 1.221 was adopted.
                                 This was calculated from an average figure using the daily rate over the past 5
                                 years (OFX, 2019) [47].
                                   The financial year runs from 1st April to 31st March in the UK whereas, in
                                 Ireland, the financial year runs from 1st January to 31st December. Due to dif-
                                 ferences in the financial years, the accounts were analysed by the year in which
                                 they end. This is summarised in Table 3.

                                 Table 1. Data sources used for analysis.

                                    Scottish Water Data Sources                        Irish Water Data Sources

                                           Scottish Water                                       Irish Water

                                   Scottish Environment Protection
                                                                                Environmental Protection Agency—EPA
                                            Agency—SEPA

                                   Water Industry Commission for      Commission for Regulation of Utilities— CRU; Previously
                                          Scotland—WICS                 known as Commission for Energy Regulation—CER

                                       Drinking Water Quality
                                                                            Office of the Comptroller and Auditor General
                                        Regulator—DWQR

                                             MarketLine                                           ERVIA

                                                                               Department of Housing Planning and Local
                                               KPMG
                                                                                       Government—DHPLG

                                                                                                CH2M Hill

                                 Table 2. Chosen units for analysis of data.

                                              Measurement                                             Units

                                                    Costs                                           Euro (€)

                                                Distances                                        Kilometres (km)

                                                    Area                                       Sq. Kilometres (km2)

                                 Table 3. Explanation for comparison of accounts.

                                         Year end             2014   2015      2016     2017      2018        2019    2020   2021

                                   Irish Water Accounts       2014   2015      2016     2017      2018        2019    2020   2021

                                 Scottish Water Accounts 2013-14 2014-15 2015-16 2016-17 2017-18 2018-19 2019-20 2020-21

DOI: 10.4236/jwarp.2019.118063                             1069                       Journal of Water Resource and Protection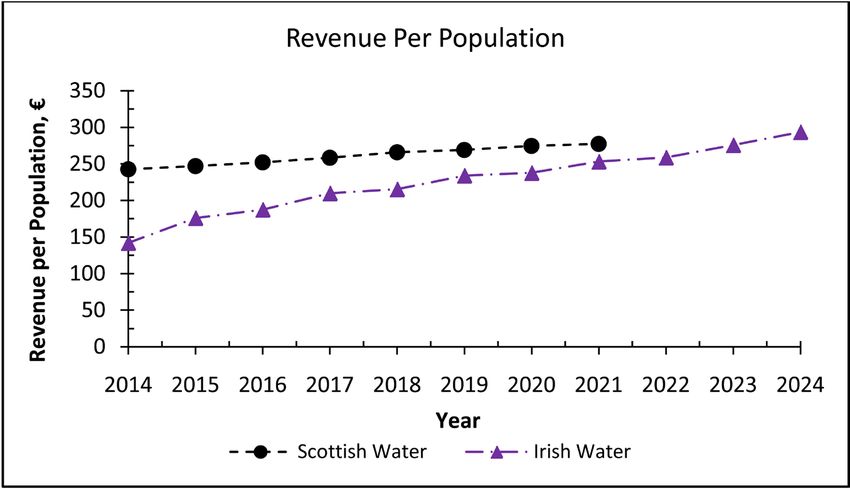
R. McDermott et al.
Due to time constraints of this study, the most recently published accounts
available were for the 2017-2018 financial year as follows:
• Irish Water—2017 Financial Year [48].
• Scottish Water—2017-2018 Financial Year [49].
Any figures quoted beyond the extent of these accounts are forecast figures
only. The adoption of International Financial Reporting Standards (IFRS Foun-
dation, 2017) [50] has simplified accounting procedures and eased the auditing
and analysis of accounts. As both Ireland and Scotland have signed up to these
standards, comparisons could be achieved for the purpose of this study.
The comparison of both companies was normalised relative to the population
that each company serves, with presenting monetary information per head of
population. All values quoted in the text being actual monetary values unless
otherwise stated. This ensures a rational and equitable basis of comparison. To
provide a greater representation of the costs, they were divided by the popula-
tion of their respective countries and, therefore, this cost or revenue was per
population head.
• Most recent estimate of the Scottish population is 5,424,800 (National Re-
cords of Scotland, 2019) [51].
• Current population of Ireland is estimated to be 4,831,243 (Worldometers,
2019) [52].
4. Results
Results showed variations in assets, revenue, operational expenditure and capital
expenditure between the two utility providers.
4.1. Assets
4.1.1. Asset Quantity
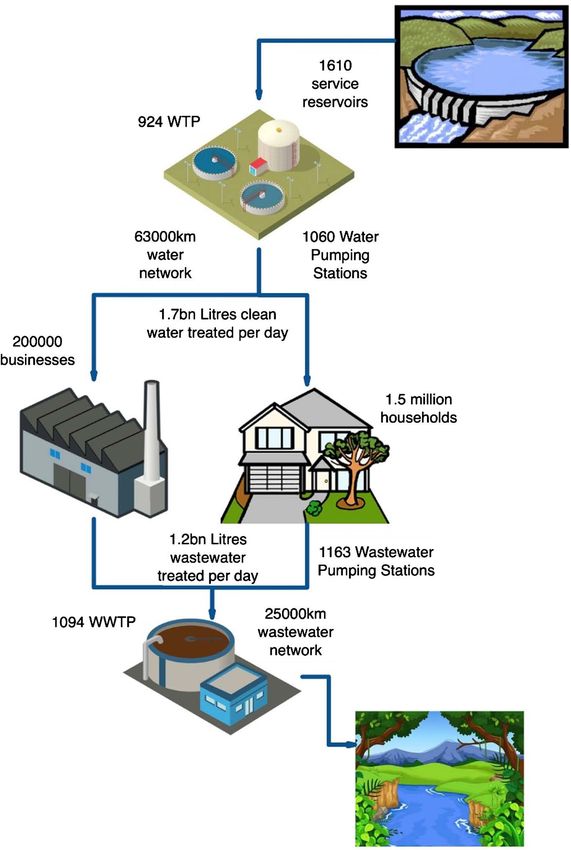
Irish Water produces approximately 0.32 billion litres more clean water and
treats 271 million litres more wastewater than Scottish Water despite having al-
most 11% less population (Figure 1 and Figure 2 detail the asset inventory).
Therefore, Irish Water is treating considerably more water and wastewater even
when allowing for the age and condition of the existing asset stock (Blacklocke et
al., 2014) [17]. There are three possible reasons for Irish Water treating this level
of clean water including a higher level of water consumption in Ireland or water
lost through leakage or poor operational practice. Ireland is deemed to be
62.95% urbanisation, whereas Scotland’s urbanisation is 72% (Statista, 2017 [53];
National Statistics, 2011 [54]). Given the higher level of urbanisation in Scot-
land, it would be expected that there should be more properties feeding directly
into the wastewater network and, therefore, necessitating a greater volume of
wastewater treatment. However, this is not the case.
The smaller number of wastewater treatment plants in Ireland may be related
to a lower level of urbanisation, compared to Scotland. The greater the percent-
age of the population living within or near a town or city, the more homes and
DOI: 10.4236/jwarp.2019.118063 1070 Journal of Water Resource and Protection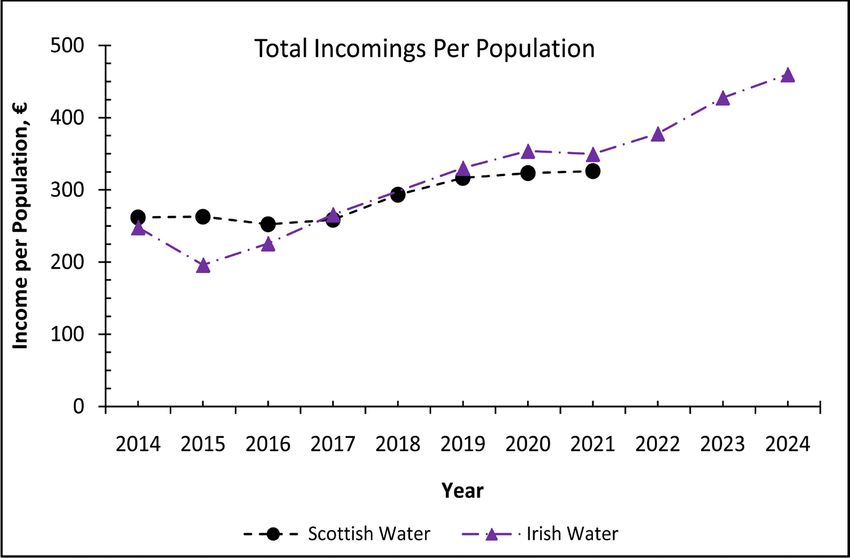
R. McDermott et al.

                                 businesses are connected directly to the wastewater network. In Ireland, which is
                                 less densely populated, it may be the case that a lot more homes have septic tank
                                 arrangements and, therefore, are not directly connected to a wastewater net-
                                 work.
                                   Ireland has a total of 924 Water Treatment Plants (WTPs), in contrast to Scot-
                                 tish Water’s 242 WTPs. Of the 924 WTPs in Ireland, approximately 235 are
                                 treating a volume greater than 1 million litres per day (Irish Water, 2015b) [29].
                                 From this, there are approximately 700 WTPs in Ireland producing relatively
                                 small volumes of drinking water. All these WTPs, regardless of their size or
                                 output, require operational staff and maintenance, electricity supply and regular
                                 servicing and inspections. Thus, the legacy of assets within Irish Water has cre-
                                 ated a sequence of plants that serve as a significant financial drain on Irish Wa-
                                 ter. The continued operation of such a vast number of small plants is question-
                                 able; however, local service demands, geographic distances and available finan-
                                 cial resources mean that this situation cannot be remedied quickly. This is re-
                                 flective of the fragmented nature of the utility in its formative years and it is
                                 likely to change as the utility develops from its historic local authority-based
                                 strategy to a nationwide utility.
                                   The greater the number of assets, the greater the expenditure involved. This
                                 expenditure includes the capital expenses required to build and maintain, daily
                                 operating expenses due to power usage, treatment processes and trained operat-
                                 ing staff requirements. Is there room to eliminate some of the smaller plants
                                 and/or reservoirs and create a more streamlined utility? This is a question that
                                 Irish Water needs to address to ensure the future of the organisation.

                                 4.1.2. Assets
                                 The main assets and outputs of Scottish Water and Irish Water utilities are illus-
                                 trated in Figure 1 and Figure 2. Scottish Water serves an area of 80,239 square
                                 km whilst Irish Water serves an area of 69,825 square km.

                                 4.1.3. Asset Quality
                                 Figure 3 illustrates that Irish Water still has a relatively high level of leakage.
                                 Current estimates suggest a rate of 44% despite ongoing efforts, such as the 2017
                                 National Leakage Reduction Programme. Metering may have aided in lessening
                                 the asset information deficit; however, further improvement work is still re-
                                 quired in this area. Scottish Water has achieved its economic level of leakage yet
                                 is still losing approximately 482 ML/day, approximately 35%. However, Article 9
                                 of the Water Framework Directive (WFD) (EC, 2000) [59] encourages water
                                 conservation, aiming for minimal wastage. Therefore, there is room for im-
                                 provement, in terms of leakage, for both utility providers. It is interesting to note
                                 that both organisations have similar rates of improvement in terms of addressing
                                 water leakage; however, despite this, it is likely that both companies will con-
                                 tinue to have legacy issues with the ageing pipe network they inherited. Al-
                                 though compliance with the Drinking Water Directive (DWD) (EC, 1998) [38]

DOI: 10.4236/jwarp.2019.118063                        1071                    Journal of Water Resource and Protection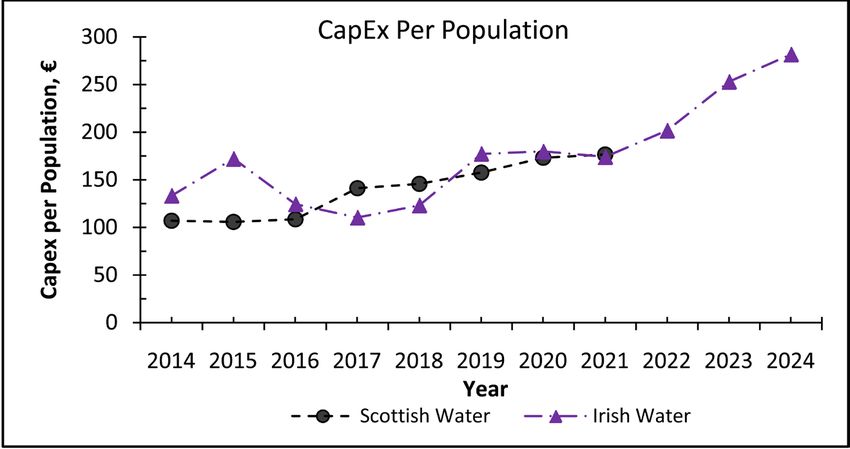
R. McDermott et al.

                                 and the Urban Wastewater Treatment Directive were also assessed (UWWTD)
                                 (EC, 1991) [39], no suitable diagram could be drawn due to the variability be-
                                 tween the two utilities.
                                    Ireland has made substantial strides in terms of its compliance with the DWD
                                 (EC, 1998) [38] but there is still a large proportion of remediation/upgrade
                                 schemes remaining on the Environmental Protection Agency’s (EPA) remedial
                                 action list (EPA, 2019) [60]. There are also many wastewater treatment plants in
                                 Ireland that are not fully compliant with the UWWTD (EC, 1991) [39]. Irish

                                 Sources: Scottish Water, 2018 [49]; Scottish Water, 2018a [55]; MarketLine, 2018 [56].

                                 Figure 1. Overview of Scottish Water asset base.

DOI: 10.4236/jwarp.2019.118063                           1072                          Journal of Water Resource and Protection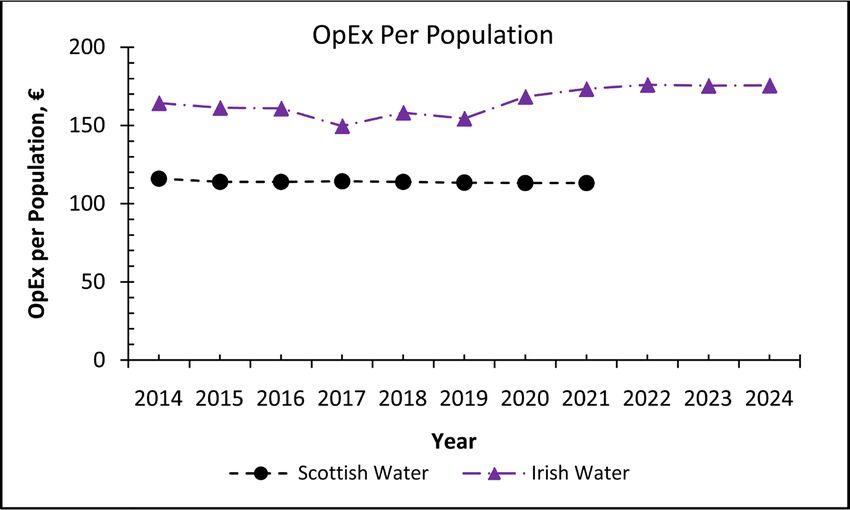
R. McDermott et al.

                                 Sources: Irish Water, 2015 [29]; Irish Water, 2016a [57]; Irish Water, 2018 [58].

                                 Figure 2. Overview of Irish Water assetbase.

                                 Water has aimed for full compliance by 2023—18 years after the deadline set by
                                 the EC. However, most wastewater treatment plants in Scotland are now fully
                                 compliant with the UWWTD (EC, 1991) [39] and, in most cases, water quality is
                                 at a very high level (Scottish Water, 2018) [49].

                                 4.2. Revenue
                                 Figure 4 shows that Scottish Water’s revenue per head of population is rising
                                 steadily but at a lower rate of increase when compared with Irish Water. The

DOI: 10.4236/jwarp.2019.118063                            1073                          Journal of Water Resource and Protection
R. McDermott et al.
Sources: CER, 2017 [28]; Irish Water, 2015 [29]; CER, 2016 [34]; Irish Water, 2017 [48]; Irish Water,
2018b [61]; WICS, 2013 [62]; WICS, 2014 [63]; WICS, 2015 [64]; WICS, 2016 [65]; WICS, 2017 [66];
WICS, 2018 [67]; Scottish Water, 2019a [68].
Figure 3. Chart showing leakage rate for both utilities.
Sources: Scottish Water, 2015 [5]; Scottish Water, 2017 [19]; Irish Water, 2015 [29]; Irish Water,
2017 [48]; Scottish Water, 2018 [49]; Scottish Water, 2018a [55]; Irish Water, 2018 [58]; Irish Water,
2016 [69]; Irish Water, 2018a [70]; Scottish Water, 2016 [71].
Figure 4. Chart showing historic and projected revenues for both utilities divided by their
estimated populations taking into consideration the Irish Water domestic charges refund.
actual results are rising from £1078.2 million (€1316.5 million) in 2014 to an an-
ticipated £1233 million (€1505.5 million) in 2021 (Scottish Water, 2015 [45];
Scottish Water, 2018a [55]). Irish Water’s revenue per head of population is ris-
ing at a greater rate from €687 in 2014 to an anticipated €1223 by 2021 (Irish
Water, 2016 [69]; Irish Water, 2018a [70]).
Irish Water’s borrowing levels are significantly higher than that of Scottish
Water. However, when considering total borrowing levels, Irish Water’s bor-
rowing per head of population reduced significantly in 2015 (Figure 5). This
may have been due to the expected income from domestic charging. Even at this
lowest level in 2015, Irish Water’s borrowing is still greater than that of Scottish
DOI: 10.4236/jwarp.2019.118063 1074 Journal of Water Resource and ProtectionR. McDermott et al.
Water. Total borrowing for Irish Water is expected to grow at a steady rate from
2015 to 2020, falling to €465 million in 2021 then rising again to €803 million in
2024 (Irish Water, 2018a [70]; Office of the Comptroller and Auditor General,
2017 [72]; Office of the Comptroller and Auditor General, 2018 [73]). There is
no clear reason for this sharp decline in borrowing in 2021 and, on examination
of Figure 4, there has been no corresponding increase in revenue to counteract
this loss in income. Irish Water’s anticipated shareholder capital contributions
and government loans were not available for 2018 and, therefore, it is thought
that these figures will be in line with the historic and projected borrowings.
Both Irish Water and Scottish Water have not relied solely on their revenue to
fund capital programmes or operations but have also required additional fund-
ing in the form of borrowing (Figure 5). It is important to note that Scottish
Water can only access borrowings from the Scottish Government. In contrast, Irish
Water can also borrow from banks or other financial institutions. For the purposes
of this study, only government borrowing was considered as year-on-year bank
loans were not demarcated clearly within the relevant financial statements.
Scottish Water had anticipated borrowing levels of £120 million in their
2015-2021 Business Plan (Scottish Water, 2014) [74]. However, their current an-
nual financial reports have shown their borrowings to be significantly lower than
expected. Government borrowing in 2015 was £70 million (€85.5 million) and,
during 2016 and 2017, there was no additional borrowing from government (Scot-
tish Water, 2016 [71]; Scottish Water, 2017 [19]). As highlighted by Cuthbert
(2018) [20], investment programmes over this 2-year period were funded without
additional borrowing. Despite this, £760 million (€928 million) of borrowing has
been agreed over the period of 2018-2021 (Scottish Water, 2018a) [55]. This has
Sources: Scottish Water, 2015 [5]; Scottish Water, 2017 [19]; Irish Water, 2017 [48]; Scottish Water,
2018 [49]; Scottish Water, 2018a [55]; Irish Water, 2016 [69]; Scottish Water, 2016 [71]; Office of the
Comptroller and Auditor General, 2017 [72]; Office of the Comptroller and Auditor General, 2018
[73].
Figure 5. Borrowing per head of population, including Irish Water’s income from share-
holder capital contributions.
DOI: 10.4236/jwarp.2019.118063 1075 Journal of Water Resource and ProtectionR. McDermott et al.
led to an anticipated increase in government borrowing to £215 million (€263
million) in 2020 and 2021 (Scottish Water, 2018a) [55]. Scottish Water’s ability
to generate efficiency and, hence, outperform its anticipated operating costs al-
lows it to build up cash balances. This then enables Scottish Government to de-
fer its lending and benefits customers because interest on loans is reduced. Cru-
cially, it also allows Scottish Government to divert spending to other essential
services.
Figure 6 shows the total income for the two utilities, encompassing any reve-
nue sources, loans and, for Irish Water only, shareholder capital contributions.
The general trend shows a rise in income for both utilities. Irish Water’s income
shows a significant drop in 2015 which could perhaps be due to the lower net
government loans in comparison to previous and preceding years. Net loans are
likely to have been decreased in this year due to the anticipation of increased in-
come from domestic charging (Irish Water, 2016 [69]; Irish Water, 2018a [70];
Office of the Comptroller and Auditor General, 2017 [72]; Office of the Comp-
troller and Auditor General, 2018 [73]). From 2015 onwards, total income in-
creases for both utilities. By 2017, Irish Water’s total income had exceeded that
of Scottish Water. However, it is important to consider the exact source of its
income.
A review of the published data confirms that Irish Water is highly dependent
on the Irish Government to provide a secure source of income (Figure 7). Most
of the income over the period 2014-2024 originated from a combination of
shareholder capital contributions and government subvention with only 19.8%
of income over the 10-year period coming from consumer charges. The lack of
Sources: Scottish Water, 2015 [4]; Scottish Water, 2017 [19]; Irish Water, 2015 [29]; Irish Water,
2017 [48]; Scottish Water, 2018 [49]; Scottish Water, 2018a [55]; Irish Water, 2018 [58]; Irish Water,
2016 [70]; Irish Water, 2018a [71]; Scottish Water, 2016 [72]; Office of the Comptroller and Auditor
General, 2017 [72]; Office of the Comptroller and Auditor General, 2018 [73].
Figure 6. Total income including revenue and borrowing per head of population.
DOI: 10.4236/jwarp.2019.118063 1076 Journal of Water Resource and ProtectionR. McDermott et al.
Sources: Irish Water, 2015b [29]; Irish Water, 2017 [48]; Irish Water, 2018 [58]; Irish Water, 2016
[69]; Irish Water, 2018a [70]; Office of the Comptroller and Auditor General, 2017 [72]; Office of the
Comptroller and Auditor General, 2018 [73].
Figure 7. Utilisation of income sources by Irish Water 2014-2024.
domestic charging in Ireland is a direct violation of the Water Framework Di-
rective’s (EC, 2000) [59] requirement for “full cost recovery”. The failure of do-
mestic charging in Ireland has been twofold—the historic lack of transparency
within the Irish Water industry and the use of charges as a political incentive
(Rodriguez-Sanchez et al, 2018) [75]. In contrast, Scottish Water has achieved a
level of trust with its consumers through the provision of a consistent level of
excellent service and transparency in all its communications. This has helped fa-
cilitate it to collect approximately 90% of its income from consumers. The utility
is less than 10% government-funded and external finance comes only in the
form of loans as needed (Figure 8).
4.3. Operational Expenditure (OpEx)
The review of OpEx also returned insightful results. The operational expenditure
of Irish Water is significantly higher than its benchmark model from Scottish
Water (Figure 9). Irish Water’s OpEx is anticipated to rise from €794 million in
2014 to €848 million by 2024 (Irish Water, 2016 [69]; Irish Water, 2018a [70]).
This is likely caused, in part, by the scale of the asset base of Irish Water. An-
other contributing factor may be the SLAs (Irish Water, 2013) [22] currently in
operation. These have left Irish Water restricted in its ability to make sufficient
cuts and reduce its operational expenditure (Brennan, 2016 [23]; Irish Water,
2018 [57]). In contrast, Scottish Water’s OpEx is expected to fall slightly from
€629 million in 2014 to €614 million by 2021 (WICS, 2013a [76]; WICS, 2015
[64]). Scottish Water has actively reduced its operational expenditure through
changes in its operational practices and alterations to its asset base. WICS plays
DOI: 10.4236/jwarp.2019.118063 1077 Journal of Water Resource and ProtectionR. McDermott et al.
Sources: Scottish Water, 2015 [4]; Scottish Water, 2016 [66]; Scottish Water, 2017 [19]; Scottish Wa-
ter, 2018a [53]; Scottish Water, 2018b [70].
Figure 8. Utilisation of income sources by Scottish Water 2014-2021.
Sources: CER, 2016 [34]; Irish Water, 2017 [48]; Irish Water, 2018 [58]; WICS, 2013 [62]; WICS,
2014 [63]; WICS, 2015 [64]; WICS, 2016 [65]; Irish Water, 2018a [70]; WICS, 2013a [76]; WICS,
2017a [77]; WICS, 2018b [68].
Figure 9. Chart showing Operational expenditure per head of population.
an active role in driving operation efficiencies. This is evidenced in the consis-
tent and sustainable rate at which the OpEx is decreasing year-on-year.
4.4. Capital Expenditure (CapEx)
Irish Water’s CapEx in general is increasing but with little consistency (Figure 10).
CapEx rose from €644 million in 2014 to €831 million in 2015 in terms of actual
CapEx (Irish Water, 2015) [29]. Capital expenditure fell to €533 million in 2017,
however, it is expected to rise to €1360 million by 2024 (Irish Water, 2018a) [70].
The inconsistent nature of Irish Water’s capital spend is likely to be a result of
the failure in adopting domestic charging and securing its own source of income.
DOI: 10.4236/jwarp.2019.118063 1078 Journal of Water Resource and ProtectionR. McDermott et al.
From a review of the breakdown of expenditure, it is clear that Irish Water’s
emphasis is on capital enhancement with a very small proportion being spent on
capital maintenance (Figure 11). Irish Water’s capital expenditure is projected
to rise significantly over the period 2019-2024; however, achieving this level of
expenditure is dependent upon the success of Irish Water in securing a viable
income stream (Brady and Gray, 2017) [42].
Scottish Water’s capital expenditure continues to rise annually in a consistent
and sustainable manner (Figure 10) from €580 million in 2014 to a projected
spend of €957 million in 2021. It has a balanced approach to its capital mainte-
nance and capital enhancement, with roughly half of the budget being spent on
each (Figure 11).
4.5. Implications for Future Financing
The populations of both Ireland and Scotland are projected to rise significantly
over the coming years (Figure 12). By 2050, the population of Ireland is ex-
pected to grow beyond that of Scotland. At that stage, the population in Scotland is
expected to be in the region of 5.77 million. For the same year, the population in
Ireland is expected to be 5.79 million. This will have a substantial impact on water
utilities and their ability to meet the needs of future generations. Weather patterns
induced by climate change will also radically impact future water demands which
both utilities need to build into their respective financial models.
In general, Scottish Water is meeting the needs of its consumers. WICS and
Scottish Water are working together alongside the Scottish Government to en-
sure they plan now for the future of their water industry to avoid any shock in-
creases in charges in the future. In contrast, Irish Water is struggling to meet the
needs of its consumers. The suggested rate of growth for the population is likely
to have significant impacts on water resources. Its ability to secure a viable
source of finance will be fundamental to its ability to future proof the water pro-
vision in Ireland.
Sources: Scottish Water, 2015 [5]; Scottish Water, 2017 [19]; Irish Water, 2018a [55]; Irish Water,
2018a [70]; Scottish Water, 2016 [71].
Figure 10. Chart showing capital expenditure per head of population.
DOI: 10.4236/jwarp.2019.118063 1079 Journal of Water Resource and ProtectionR. McDermott et al.
Sources: NERA, 2016 [24]; CER, 2016 [34]; CH2M Hill, 2014 [78]; CRU, 2018a [79]; Irish Water,
2016b [80]; Scottish Water, 2014a [81].
Figure 11. Chart showing capital expenditure in terms of maintenance and enhancement
2016-2021.
Sources: NRS, 2019 [51]; Population Pyramid, 2019 [82].
Figure 12. Historic and predicted population changes for Ireland and Scotland from 1980
to 2060.
5. Conclusions and Recommendations
Based on the comparison of the two companies, the data suggests that neither of
the two utilities is perfect. What is evident, throughout the study, is the success
of the relationship between Scottish Water and its Regulator WICS. As stated by
Byatt (2012) [44], the Regulator is only as successful as its relationship with the
company. This is evidenced in the regularity of its incomes and expenses over
the review period. One of the key lessons from the Scottish model was the com-
pany’s success at bringing the general public with them on the journey. Scottish
Water provides its customers with a quality service and charges for this essential
commodity which is accepted by the general public. This is a lesson that has not
DOI: 10.4236/jwarp.2019.118063 1080 Journal of Water Resource and ProtectionR. McDermott et al.
been realised in Ireland and water charges remain a source of contention with
the general public.
No direct parallels can be drawn between the finances of the two utilities. Irish
Water is dependent on the Irish Government as its main source of income via a
combination of grants, loans and shareholder capital contributions. This is a
vulnerability for Irish Water which is dependent on a buoyant economy to en-
sure funding for the operation and upkeep on the existing asset stock. In terms
of consumer charging, Irish Water has not yet established a successful source of
income from direct consumer charges. Based on the reaction of the general pub-
lic at the idea of charges and the unwillingness of politicians to champion the
cause in times of financial hardship, it is highly unlikely that charges will be im-
plemented anytime soon. Thus, Irish Water will need to explore alternative ave-
nues of funding and, to achieve this, there needs to be a detailed review of the
existing assets and proof of ownership for use as collateral against any future
loans. There are anecdotal stories in circulation of WTPs on third party land
which, if true, would render the assets value questionable as collateral. Expan-
sion of the shareholder base is another possibility for Irish Water; however, the
significant negative press, combined with failing to meet EC targets are issues
that need to be addressed. Scottish Water has no access to shareholder capital
contributions in the way that Irish Water has. Instead, Scottish Water collects
over 90% of its income from consumer charges supplemented by Government
borrowings only when necessary.
With respect to OpEx, Irish Water’s spend is significantly higher than that of
Scottish Water. This is likely to be a result of the scale of the Irish Water’s asset
base and increasing costs related to the SLAs (Irish Water, 2013) [22]. Scottish
Water’s ongoing efforts to reduce operational costs have been successful thus far
and, in recent years, have outperformed targets, building up cash balances and
deferring Government lending.
In terms of their capital expenditure, the two utilities have very different pri-
orities. Scottish Water has a balanced approach to capital maintenance and en-
hancement, whereas Irish Water spends most of its CapEx on enhancement of
its assets. Considering the ratio of assets between the two utilities, this is par-
ticularly interesting. Irish Water, which has for the most part more assets to
maintain, is spending significantly less in this area. This approach may yield
short term gains but may also result in problems in the future as the existing as-
set base comes to the end of its design life. Changing design standards and the
need to manage the natural environment will also prove problematic in the fu-
ture, for example, removal of antibiotics from wastewater discharges (Tretsi-
akova McNally et al., 2019) [83].
Even after almost 5 years in operation, very little is still known about the
quantity and conditions of water and wastewater assets in Ireland. However,
with approximately 63 WTPs and 24 wastewater agglomerations still not meet-
ing the necessary European standards, what is certain is that much work will be
DOI: 10.4236/jwarp.2019.118063 1081 Journal of Water Resource and ProtectionR. McDermott et al.
required in Ireland over the coming years to ensure that the utility meets the
necessary requirements of the EC and increased demand from projected rising
population figures.
The problems faced by the two utilities in their establishment are undeniably
similar and, from “a superficial glance”, Scottish Water could provide a suitable
example for Irish Water. Granted, Irish Water may indeed learn from the issues
faced by Scottish Water in its founding years and how they dealt with them. Irish
Water and Scottish Water are now at two completely different stages of matur-
ity. From a review of the related literature, Irish Water has indeed tried to
achieve “too much, too soon” as Deputy Gallagher and O’Leary have suggested
(O’Leary, 2018 [2]; Donegal Now, 2016 [3]). This may be aggravated by its in-
tention to model itself on a more mature utility provider and the starkly differ-
ent income models that each company uses.
Based on the analysis conducted, both utilities differ significantly in terms of
asset inventory legacy, conditions of operation and the cultural attitudes regard-
ing water charges. Irish Water needs to have achievable targets that are fully risk
assessed. For example, the campaign to reduce water usage is important as, in
certain conditions, reduced water usage in dwellings can cause an increased
number of sewer blockages which, therefore, can impact negatively on public
health (McDermott et al., 2019) [84].
The Irish Government has not enacted legislation to rule out the possibility of
the privatisation (or partial privatisation) of Irish Water. The bill tabled by Joan
Collins TD in Dail Eireann proposed a referendum to amend Article 28 of the
Constitution (Kelly, 2018) [85]. Whilst the bill has been passed, the constitu-
tional changes called for by Deputy Collins have not been made.
The future sustainability and financial viability of Irish Water are threatened
by funding sought by other vital public services including health, education and
housing. With these competing services and factors such as the increasing and
ageing population, one is compelled to ask how Irish Water can achieve efficien-
cies. There are several areas where further research is required—examples are as
follows:
1) Unaccounted for Water (UFW): Irish Water must explore a reduction in
UFW through specific engineering interventions such as mains rehabilita-
tion/replacements, leakage reduction programme and behavioural change cam-
paigns.
2) The use of Gravity in Design: Design making decisions should look for a
gravity flow approach, where possible, to reduce or eliminate pumping costs for
treatment and distribution of water intended for human consumption. The cost
of pump provision, maintenance and replacement creates costs along with in-
creasing the carbon footprint associated with the process. ATV advertisement by
Irish Water (2019) [86] may result in some consumers having a better apprecia-
tion of water, highlighting that every drop of water supplied must be collected,
treated and pumped through a vast network of pipes. However, the reference to
DOI: 10.4236/jwarp.2019.118063 1082 Journal of Water Resource and ProtectionR. McDermott et al.
the word “pumped” in the advert is not reflective on the overall network as there
are numerous scenarios where water does not have to be pumped through the
pipe delivery network. Nonetheless, smart designs are required to reduce
pumping which can help reduce costs and carbon footprints.
3) Value Engineering: there is a wide variety of solutions available to deal with
design briefs, for example, where the use of low-pressure sewer systems is being
considered alternatives to “grinder pumping stations” should be considered
through value engineering and whole-life costings.
4) Water Conservation: Sewer blockages are on the increase whilst water
closet (WC) flush volumes are on the decrease (McDermott et al., 2019) [84].
Consequently, lower flush volumes reduce solids transfer in sewers. Therefore,
sewer design standards need to be revised to keep up with water conservation.
5) Climate change: The storage and treatment of water will prove challenging
to a utility which has an antiquated network, which in many locations is reach-
ing the end of its useful design life. Studies could be undertaken to see how this
critical factor will impact the spend and maintenance profile of the company.
6) Stress testing the revenue stream: The proposed financial models that un-
derpin the current development plans should be tested for varying income sce-
narios including future financial recessions. As it stands, Irish Water has re-
cently been ordered to cut costs by €100 million (Brennan, 2019) [87].
Conflicts of Interest
The authors declare no conflicts of interest regarding the publication of this pa-
per.
References
[1] Department of the Environment, Community and Local Government (2015) Paper
1—Overview of the Water Sector in Ireland.
https://www.cso.ie/en/media/csoie/newsevents/documents/irishwater/1overviewoft
hewatersectoriireland.pdf
[2] O’Leary, J. (2018) How (Not) To Do Public Policy: Water Charges and Local Prop-
erty Tax. Whitaker Institute. NUI Galway.
[3] Donegal Now (2016) Donegal TD Says Irish Water Is “a Failed Entity”.
https://www.donegalnow.com/news/donegal-td-says-irish-water-is-a-failed-entity/8
8716
[4] Scottish Government (2018) Scotland: The Hydro Nation Annual Report 2018.
https://www.gov.scot/publications/scotland-hydro-nation-annual-report-2018/
[5] Scottish Water (2015) Annual Report and Accounts 2014/15. Scottish Water, Dun-
fermline, UK.
[6] Price Waterhouse Coopers (PWC) (2011) Irish Water: Phase 1 Report.
https://www.housing.gov.ie/sites/default/files/migrated-files/en/Publications/Enviro
nment/Water/FileDownLoad%2C29193%2Cen.pdf
[7] Northern Ireland Assembly (NIA) (2014) An Examination of Models within the
Water and Sewerage Industry in the UK and Republic of Ireland. Northern Ireland
Assembly.
DOI: 10.4236/jwarp.2019.118063 1083 Journal of Water Resource and ProtectionR. McDermott et al.
[8] Irish Water (2014) Scottish Water Executive & Irish Water Management Team,
Meeting Agenda.
https://www.whatdotheyknow.com/request/249964/response/623677/attach/html/4/
Untitled.pdf.html
[9] O’Regan, M. (2016) Irish Water Splashes €5m on Expert Advice.
https://www.independent.ie/irish-news/irish-water-splashes-5m-on-expert-advice-3
5284262.html
[10] Commission for Regulation of Utilities (CRU) (2019) Irish Water’s Household
Water Conservation Proposal (Excess Use Charges) CRU Consultation Paper
(CRU/19/024). Dublin.
[11] Citizens Information (2016) Household Water Conservation Charge.
http://www.citizensinformation.ie/en/environment/water_services/water_charges.ht
ml
[12] Finn, C. (2016) Water Meters Are Not the New e-Voting Machines: They Cost a Lot
More.
https://www.thejournal.ie/e-voting-machines-water-meters-3114507-Dec2016/
[13] Scottish Water (2019) Unmetered Charges 2018-2019.
https://www.scottishwater.co.uk/you-and-your-home/your-charges/2018-19-charge
s/2018-19-umc
[14] Utility Week (2018) Home Truths: Scots Mark Decade of Water Competition. Fav-
ersham House Ltd., Wood St, East Grinstead.
[15] Water Industry Commission for Scotland (WICS) (2010) Competition in the Scot-
tish Water Industry. Achieving Best Value for Water and Sewerage Customers.
https://www.watercommission.co.uk/UserFiles/Documents/Competition%20report
%20-%20final.pdf
[16] RPS & Veolia Water (2010) The Plan. Water Supply-Project Dublin Region.
https://www.dublincity.ie/sites/default/files/content/WaterWasteEnvironment/Wat
erSupplyProjectDublinRe-
gion/WaterSupplyProjectDublinRegion/Documents/The%20Plan.pdf
[17] Blacklocke, S., Bruen, M., Earle, R., Kelly-Quinn, M., O’Neill, E., O’Sullivan, J. and
Purcell, P. (2014) Dublin Ireland: A City Addressing Challenging Water Supply,
Management, and Government Issues. Ecology and Society, 19, 10.
https://doi.org/10.5751/ES-06921-190410
[18] Fitzgerald, J. (2018) Irish Water Split from Ervia Inevitable to Protect Government
Accounts.
https://www.irishtimes.com/business/economy/irish-water-split-from-ervia-inevita
ble-to-protect-government-accounts-1.3570472
[19] Scottish Water (2017) Annual Report and Accounts 2016/17. Scottish Water, Dun-
fermline, UK.
[20] Cuthbert J.R. (2018) Inter-Generational Equity and the Strategic Review of Water
Charges in Scotland. Fraser of Allander Economic Commentary, 42, 27-35.
[21] Kennelly, J. (2018) Transforming the Water Industry in Ireland: A Local Authority
Perspective. Engineers Journal.
http://www.engineersjournal.ie/2018/10/02/transforming-water-industry-ireland-lo
cal-authority-perspective/
[22] Irish Water (2013) Irish Water. County Council Service Level Agreement.
https://www.housing.gov.ie/sites/default/files/migrated-files/en/Publications/Enviro
nment/Water/FileDownLoad%2C35140%2Cen.pdf
[23] Brennan, M. (2016) Irish Water Workers Cost Twice as Much as Staff in NI. Sunday
DOI: 10.4236/jwarp.2019.118063 1084 Journal of Water Resource and ProtectionR. McDermott et al.
Business Post.
https://www.businesspost.ie/news/irish-water-workers-cost-twice-as-much-as-staff-
in-ni-336348
[24] NERA (2016) IW IRC2 (2017-2018) Look forward Submission Assessment. Pre-
pared for the Commission of Energy Regulation (CER).
https://www.cru.ie/wp-content/uploads/2016/07/CER16269-NERA-Review-of-Irish
-Water-costs-2017-to-2018.pdf
[25] Finn, C. (2017) Irish Water: We Did Not Waste €70m on Consultants. The Journal.
https://www.thejournal.ie/irish-water-consultants-3183868-Jan2017/
[26] Duffy, R. (2014) Fianna Fáil Attacks “Gold-Plated Bonus Culture” at Irish Water as
Costs Are Revealed. The Journal.
https://www.thejournal.ie/irish-water-uk-comparison-1613268-Aug2014/
[27] Hutcheon, P. (2019) Trio of Scottish Water Executives Take Home £225,000 in Bo-
nuses. The Herald.
https://www.heraldscotland.com/news/17523139.trio-of-scottish-water-executives-t
ake-home-225000-in-bonuses/
[28] Commission for Energy Regulation (CER) (2017) Irish Water’s Capital Investment
Outputs 2016.
https://www.cru.ie/wp-content/uploads/2017/07/CER17120-Irish-Waters-Capital-I
nvestment-Outputs-2016.pdf
[29] Irish Water (2015) Irish Water Business Plan. Transforming Water Services in Ire-
land to 2021. https://www.water.ie/docs/Irish-Water-Business-Plan.pdf
[30] Scottish Government (2018) Investing in and Paying for Your Water Service from
2021. An Invitation to Provide Your Views.
https://www.gov.scot/publications/investing-paying-water-services-2021/
[31] Dublin City Council (2010) Environmental Report of the Dublin City Development
Plan 2011-2017: Strategic Environmental Assessment (SEA). Dublin City Council,
Dublin, Ireland.
http://www.dublincity.ie/sites/default/files/content//Planning/DublinCityDevelopm
entPlan/Documents/Dev_PlanEnvironmentalReport.pdf
[32] Central Statistics Office (2018) Census 2016 Report: Population Classified by Area.
Central Statistics Office, Dublin, Ireland.
https://www.cso.ie/en/csolatestnews/presspages/2017/census2016profile2-populatio
ndistributionandmovements/
[33] Audit Scotland (2005) Overview of the Water Industry in Scotland.
https://www.audit-scotland.gov.uk/docs/central/2005/nr_051013_water_overview.p
df
[34] Commission for Energy Regulation (CER) (2016) Irish Water Second Revenue
Control 2017-2018. Consultation Paper.
https://www.cru.ie/wp-content/uploads/2016/07/CER16267-Consultation-on-Irish-
Water-Revenue-for-2017-to-2018.pdf
[35] Utility Week (2017) Chief Executive’s View: Douglas Millican, Scottish Water. Fav-
ersham House Ltd., Wood St, East Grinstead.
[36] Water & Wastewater Treatment (W & WT) (2019) Transient Detection Helping
Scottish Water Prevent Bursts.
https://wwtonline.co.uk/news/transient-detection-helps-scottish-water-predict-burs
ts
[37] O’Brien, C. (2016) Irish Water to Spend €370m Replacing Lead Pipes in Areas
across the Country. The Liberal.
DOI: 10.4236/jwarp.2019.118063 1085 Journal of Water Resource and ProtectionR. McDermott et al.
https://theliberal.ie/irish-water-to-spend-e370m-replacing-lead-pipes-in-areas-acro
ss-the-country/
[38] European Commission (EC) (1998) Council Directive 98/83/EC of 3 November
1998 on the Quality of Water Intended for Human Consumption. Official Journal
of the European Communities, L330, 32-53.
https://eur-lex.europa.eu/LexUriServ/LexUriServ.do?uri=OJ:L:1998:330:0032:0054:
EN:PDF
[39] European Commission (EC) (1991) Council Directive 91/271/EC of 21 May 1991
Concerning Urban Waste Water Treatment. 40-52.
https://eur-lex.europa.eu/legal-content/EN/TXT/?uri=celex:31991L0271
[40] EPA (2018) Drinking Water Report for Public Supplies 2017. Environmental Pro-
tection Agency, Wexford, Ireland.
[41] EPA (2018) Urban Waste Water Treatment in 2017. Environmental Protection
Agency, Wexford, Ireland.
[42] Brady, J. and Gray, N.F. (2017) Reform of the Irish Water Sector: Opportunities and
Challenges. Proceedings of the Institution of Civil Engineers-Water Management,
170, 165-174. https://doi.org/10.1680/jwama.15.00106
[43] Dickie, V.A. and Sawkins, J.W. (2001) Affordability of Scottish Water and Sewerage
Charges. Quarterly Economic Commentary, 26, 39-47.
[44] Byatt, I. (2012) The Regulation of Water Services in the UK. Utilities Policy, 24,
3-10. https://doi.org/10.1016/j.jup.2012.07.003
[45] Hendry, S. (2016) Scottish Water: A Public-Sector Success Story. Water Interna-
tional, 41, 900-915. https://doi.org/10.1080/02508060.2016.1212961
[46] KPMG (2018) Annual Audit Report to the Members of Scottish Water and the
Auditor General for Scotland.
https://www.audit-scotland.gov.uk/uploads/docs/report/2018/aar_1718_scottish_wa
ter.pdf
[47] OFX (2019) Yearly Average Rates.
https://www.ofx.com/en-gb/forex-news/historical-exchange-rates/yearly-average-ra
tes/
[48] Irish Water (2017) Irish Water Financial Statements as at 31 December 2016.
http://www.ervia.ie/site-files/docs/who-we-are/iw_financial_statements_2016.pdf
[49] Scottish Water (2018) Annual Report and Accounts 2017/18.
https://docs.google.com/viewerng/viewer?url=www.scottishwater.co.uk/-/media/Sc
ottishWa-
ter/Document-Hub/Key-Publications/Annual-Reports/230718ScottishWaterAnnual
Report1718.pdf
[50] IFRS Foundation (2017) Who Uses IFRS Standards?
https://www.ifrs.org/use-around-the-world/use-of-ifrs-standards-by-jurisdiction/#p
rofiles
[51] National Records of Scotland (NRS) (2019) Population of Scotland.
https://www.nrscotland.gov.uk/statistics-and-data/statistics/scotlands-facts/populati
on-of-scotland
[52] Worldometers (2019) Ireland Population Live
http://www.worldometers.info/world-population/ireland-population/
[53] Statista (2017) Ireland: Urbanisation from 2017 to 2017.
https://www.statista.com/statistics/455844/urbanization-in-ireland/
[54] National Statistics (2011) Rural Scotland Key Facts 2011. People and Communities,
DOI: 10.4236/jwarp.2019.118063 1086 Journal of Water Resource and ProtectionYou can also read