STATE OF INDIAN RAILWAYS - PRS
←
→
Page content transcription
If your browser does not render page correctly, please read the page content below
STATE OF INDIAN RAILWAYS

        Prachee Mishra

        September 2018

                  Business as usual may be
                  an unsustainable prospect
                  for Railways

                  Railways finances and
                  infrastructure investment
                  are stuck in a vicious cycle

                  In addition, the
                  organisational structure of
                  Railways needs an
                  overhaul
              1
INSIGHTS
Business as usual may be an unsustainable prospect for Railways
Railways’ operating ratio has consistently been higher than 90% in the past several years, which
indicates that its capability to generate operational surplus is low. Further, its expenditure on staff and
pension has been increasing. Consequently, capacity growth is increasingly being funded through
borrowings. However, an increased reliance on borrowings may further worsen the financial situation
of Railways.
Improving operational surplus through fare hikes will be difficult for Railways because:
(i) Railways’ freight rates are already higher Figure 1: Railways has been losing traffic share
than other modes of transport for several 100%
commodities. Consequently, it has been
80%
losing out on the FMCG and automobile
markets (which are preferring roads). The 60%
share of Railways in total freight traffic
has declined from 89% in 1950-51 to 30% 40%
in 2011-12. Further, the freight basket is
limited to certain bulk commodities, and 20%
heavy dependence on coal transport poses 0%
a risk to the business. 1950-51 1978-79 1986-87 2007-08
(ii) Upper class fares face competition from Railways Highways Others
low cost airlines and AC bus fares. Any
further increase in upper class fares means Railways will lose traffic to other modes of travel,
which are either faster or provide better last mile connectivity.
(iii) Second class passenger traffic which contributes to 67% of the total passenger revenue,
continues to be cheaper than both road and air travel. However, it may be difficult to increase
fares as these services are used by the relatively poorer section of society. The passenger
business made losses of about Rs 33,000 crore in 2014-15, which are classified as social service
obligations. The question is who should bear this subsidy – Railways, or the central government;
or in case of suburban rail - the state or the local government.
Potential ways out from the current scenario could be to invest in: (i) Dedicated Freight Corridors that
could bring back freight traffic, and (ii) high speed trains which could help improve passenger
revenue. These services could be priced higher side than other modes of travel, but they would
provide superior services. The challenge would be to make these services cost effective for the users.
Railways finances and infrastructure investment are stuck in a vicious cycle
Poor finances of Railways had led to low investment in infrastructure. Low investment means
Railways’ infrastructure and services take a hit (resulting in low speed, delays, and safety issues).
Poor infrastructure and services result in loss of remunerative business for Railways which leads to
further deterioration of finances. This has become a vicious cycle for Railways.
The rail network currently faces huge capacity constraints, and the high density network (network that
connects metros) has already reached saturation. With high levels of capacity utilisation, and the
introduction of new trains, trains tend to slow down, and affect the quality of services.
In addition, the organisational structure of Railways needs an overhaul
The organisational structure of Railways needs an overhaul to create a structure that is more
conducive for nimble decision making, and is more accountable. Currently, decision making in
Railways is centralised. The Railway Board has the powers of policy making, operations, and
regulation. Railway zones have very limited powers with regard to raising their own revenue.
Therefore, they are unable to contribute more effectively towards improving Railways’ revenue.
Further, apart from its core function of running trains, Railways also engages in peripheral activities
such as running schools, and hospitals, staff housing, catering, and security.
1INTRODUCTION
Indian Railways has the fourth largest rail network in the world after the United States, China and
Russia.1 The entire infrastructure is managed by the Railways Board, and it has a monopoly in
providing rail services in India.
However, in the last few decades, traffic has been moving to other transport modes such as roads and
air, which has led to declining rail traffic, and consequently declining revenue generation for the
Railways. Deteriorating finances of the Railways have translated into lower investment in
infrastructure, poor infrastructure maintenance, and poor services. Poor infrastructure has also had
serious implications in the form of train accidents.
Several questions have also been raised about the efficiency of the Railways in terms of the human
resources it employs, and their capacity. Further, the decision making in Indian Railways has been
mostly centralised, with the zones and divisions not having much financial autonomy.
Recently, the Comptroller and Auditor General of India conducted a compliance audit for the year
2016-17, which has been tabled in Parliament. In this context, the note looks at the Railways’
finances and challenges to financing, the Railways’ infrastructure, and the current organisational
structure of the Railways and the reforms suggested to restructure it.
RAILWAYS’ FINANCES
Indian Railways is financed through: (i) its own internal resources (freight and passenger revenue, and
leasing of railway land), (ii) budgetary support from the central government, and (iii) extra budgetary
resources (primarily borrowings but also includes institutional financing, public private partnerships,
and foreign direct investment).2 Railways’ working expenses (salaries, staff amenities, pension, asset
maintenance) are met through its internal resources. Capital expenditure (procurement of wagons,
station redevelopment) is financed through extra budgetary resources (58%), the budgetary support
from central government (33%), and Railways’ own internal resources (9%) (for the year 2018).
Receipts
Internal Resources Budgetary support Extra Budgetary Resources
Expenditure
Revenue Expenditure Capital Expenditure
In the last few years, the growth of Railways’ transportation business has been declining, and
consequently, its ability to generate its own revenue has been on a decline. On the other hand,
Railways’ expenditure on salaries has been gradually increasing with a significant jump every few
years due to Pay Commission revisions. There is an increasing expenditure on pension too, which is
unproductive, as this does not generate any revenue for the Railways. The pension bill may increase
further in the next few years, as about 40% of the Railways staff was above the age of 50 years in
2016-17.3 However, employees who joined since January 2004 are part of the contributing benefit
scheme under the National Pension Scheme. The pension bill will start tapering off once these
persons start retiring around 2040.
A decline in the growth of internal revenue generation has meant that Railways has been funding its
capital expenditure through budgetary support from the central government and borrowings. While
the support from central government has mostly remained consistent, Railways’ borrowings have
2been increasing. An increased reliance on borrowings could further exacerbate the financial situation
of Railways.4,5 In the following section we discuss each of these financial components.
Table 1: Overview of Railways’ finances (in Rs crore)
2012-13 2013-14 2014-15 2015-16 2016-17 2017-18 2018-19
RE BE
Receipts
1 Internal Resources 126,180 143,214 161,017 168,380 165,382 187,425 201,090
2 Budgetary Support 24,132 27,033 30,121 37,609 45,232 40,000 53,060
3 Extra Budgetary Resources 15,142 15,085 11,044 39,066 52,579 69,100 81,940
4 Total Receipts (=1+2+3) 165,454 185,332 202,182 245,055 263,193 296,525 336,090
Expenditure
5 Total Revenue Expenditure 117,914 139,473 153,352 157,874 160,469 181,000 188,100
6 Total Capital Expenditure 50,383 53,782 58,718 93,520 109,934 120,000 146,500
7 Total Expenditure (=5+6) 168,297 193,255 212,070 251,394 270,404 301,000 334,600
8 Operating Ratio 90.2% 93.6% 91.3% 90.5% 96.5% 96% 92.8%
Note: RE is revised estimates, BE is budget estimates.
Sources: Railways budget documents; PRS.
Railways: Sources of revenue
Internal Resources
Railways earns its internal revenue primarily from passenger and freight traffic. In 2016-17 (latest
actuals), freight and passenger traffic contributed to about 63% and 28% of the internal revenue
respectively. In 2018-19, Railways expects to earn 61% of its internal revenue from freight and 26%
from passenger traffic. The remaining 13% will be earned from other miscellaneous sources such as
parcel service, coaching receipts, and platform tickets.
Table 2: Railways: sources of internal revenue (in Rs crore)
2012-13 2013-14 2014-15 2015-16 2016-17 2017-18 2018-19
RE BE
1 Gross traffic receipts 123,733 139,558 156,711 164,334 165,292 187,225 200,840
(=2+3+4)
2 Freight revenue 85,263 93,906 105,791 109,208 104,339 117,500 121,950
3 Passenger revenue 31,323 36,632 42,190 44,283 46,280 50,125 52,000
4 Other traffic sources 7,147 9,020 8,730 10,843 14,673 19,600 26,890
5 Miscellaneous receipts 2,448 3,656 4,307 4,046 90 200 250
6 Internal Revenue (=1+5) 126,180 143,214 161,017 168,380 165,382 187,425 201,090
Note: RE is revised estimates, BE is budget estimates. Till 2015-16, miscellaneous receipts included a component on
subsidy from general revenues towards dividend relief and other concessions.
Sources: Railways budget documents; PRS.
Freight traffic: Railways generates most of its freight revenue from the transportation of coal (43%),
followed by cement (8%), food-grains (7%), and iron and steel (7%) (see Figure 2). It mostly
transports bulk freight, and the freight basket has mostly been limited to include raw materials for
certain industries such as power plants, and the iron and steel plants. In 2018-19, Railways expects to
earn Rs 1,21,950 crore from goods traffic.
3Figure 2: Share of freight volume and revenue in 2016-17 (in %)
Raw materials for steel plants except iron
Container Service
Fertilisers
Petroleum and Lubricants
Other Goods
Foodgrains
Pig Iron and Finished Steel
Iron Ore
Cement
Coal
0% 10% 20% 30% 40% 50%
Volume Revenue
Sources: Statement of Revenue Receipts and Expenditure 2018-19, Ministry of Railways; PRS.
Passenger traffic: Passenger traffic is broadly divided into two categories: suburban and non-
suburban traffic. Suburban trains are passenger trains that cover short distances of up to 150 km, and
help move passengers within cities and suburbs. Majority of the passenger revenue (94% in 2017-18)
comes from the non-suburban traffic (or the long-distance trains).
Within non-suburban traffic, second class (includes sleeper class) contributes to 67% of the non-
suburban revenue. AC class (includes AC 3-tier, AC Chair Car and AC sleeper) contributes to 32%
of the non-suburban revenue. The remaining 1% comes from AC First Class (includes Executive
class and First Class).
Flexi-fare system: Over the years, passenger traffic and consequently passenger revenue have been
on a slow decline. In order to rationalise fares, and improve passenger revenue, in September 2016,
the Ministry of Railways introduced a flexi-fare system for first and AC class passenger traffic in
Shatabdi, Rajdhani and Duronto trains.6 The Comptroller and Auditor General of India (CAG) (2018)
notes that this system was introduced irrespective of the demand and occupancy of these trains and
classes.7 The system resulted in a decrease in occupancy in almost all the classes. The CAG also
noted that the classes where flexi-fare was introduced, the occupancy was already low. Further, in
AC 3-tier (one of the most profitable classes), the vacancy in berths increased from 0.66% to 4.46%
post implementing the flexi-fare system.7 However, while the number of passengers carried declined
by 2.65% post implementation of flexi-fares, the revenue increased marginally by Rs 552 crore.7
The CAG also noted a change in passenger preferences. Passengers preferred traveling by mail or
express trains that were cheaper, over the Rajdhani/ Shatabdi/ Duronto trains, despite higher travel
time. Passengers expected better quality of services commensurate with the enhanced fares.
Budgetary support from central government
The central government supports Railways in order to expand its network and invest in capital
expenditure. Until recently, this budgetary support from the central government used to be the
primary source of funds for capital expenditure for Railways (51% in 2014-15). However, post 2015-
16, over 56% of the capital expenditure is being met through borrowings, and external investments.
In 2018-19, the gross budgetary support from central government, towards capital expenditure, is
proposed at Rs 53,060 crore. The central government also reimburses Railways for the operating
losses made on strategic lines, and for the operational cost of e-ticketing to IRCTC (Rs 2,028 crore in
2018-19).
Extra Budgetary Resources (EBR)
Extra Budgetary Resources (EBR) include market borrowings such as financing from banks,
institutional financing, and external investments. External investments in Indian Railways could be in
the form of public private partnerships (PPPs), joint ventures, or market financing by attracting
4private investors to potentially buy bonds or equity shares in Railways. Railways mostly borrows
funds through the Indian Railways Finance Corporation (IRFC). IRFC borrows funds from the
market (through taxable and tax-free bond issuances, term loans from banks and financial
institutions), and then follows a leasing model to finance the rolling stock assets and project assets of
Indian Railways.
In the past few years, borrowings have increased sharply to bridge the gap between the available
resources and expenditure. As mentioned earlier, majority of the Railways’ capital expenditure was
met from the budgetary support from central government. In 2015-16, this trend changed with
majority of Railways’ capital expenditure being met through EBR. In 2018-19, Rs 81,940 crore is
estimated to be raised through EBR.
Other sources of revenue for Railways
Public Private Partnerships (PPPs): In the last few Budgets, the Railways Ministry has announced generating revenue
through PPPs. However, the Ministry has not been able to generate much revenue through this stream. While there are
a few private freight train operators, they are limited due to a lack of clear regulatory frameworks.
The Kelkar Committee on Revising the PPP model, in 2015, had recommended that relatively simpler PPP projects can
be commenced in Railways to build market credibility initially.8 Projects could include redevelopment of existing assets,
development of new stations, or maintenance and development of tracks. However, better implementation of such PPP
projects would require the presence of an independent regulator in the sector. In May 2017, the Ministry of Railways set
up the Rail Development Authority, with the approval of the Union Cabinet, through a notification.
Joint Ventures (JVs): JVs in Railways include JVs between the Ministry of Railways and (i) state governments for
suburban Railways (e.g., Mumbai Railway Vikas Corporation Limited is a JV between Ministry of Railways and
government of Maharashtra); (ii) state governments for local Railways (e.g., Hassan Mangalore Railway Corporation is a
JV between the Ministry and government of Karnataka); and (iii) local companies (e.g., between South Eastern
Coalfields, government of Chhattisgarh, and Railways Ministry).
In December 2015, Cabinet approved the formation of joint ventures between Ministry of Railways and state
governments for rail infrastructure projects.9 This was to ensure (i) greater participation by states in the decision making
process for railway projects, and (ii) speeding up of the process of getting approvals for such projects. The initial paid up
capital of the Ministry of Railways for each state was to be limited to Rs 50 crore.
Use of assets: Railways also generates some resources by leveraging its assets such as selling right-of-way, and
commercial development of real estate. For example, RailTel sells the optic fibre cable running along railway right-of-
way to telecom companies. Railways has also generated resources by auctioning off land in Mumbai.
Foreign Direct Investment (FDI): The central government allowed FDI in Railways in select activities in August 2014. 10
Earlier, FDI was prohibited in all Railways transport except mass rapid transit. This has been changed to allow 100% FDI
in activities such as: (i) suburban corridor projects through Public Private Partnerships; (ii) high speed train projects; (iii)
dedicated freight lines; (iv) rolling stock; (v) passenger terminals; (vi) mass rapid transit systems, etc. Between April
2014 and December 2017, Railways has seen an FDI equity inflow of USD 389.83 million.11
Railways Expenditure
In 2018-19, Indian Railways plans to spend most of its working expenses on staff (41%) and pension
(25%), followed by fuel (16%). Most of the remaining expenditure is towards the depreciation and
safety funds. In 2018-19, the total revenue expenditure is estimated at Rs 1,88,100 crore.
Staff wages and pension
Staff wages and pension together comprise nearly two-thirds of Railways expenditure. As on March
31, 2017, Railways had around 13 lakh employees.12
For 2018-19, the expenditure on staff is estimated at Rs 76,452 crore, and allocation to the Pension
Fund is estimated at Rs 47,600 crore. Together, these constitute about 66% of the Railways’
estimated expenditure in 2018-19.
5Table 3: Railways' expenditure (in Rs crore)
2012-13 2013-14 2014-15 2015-16 2016-17 2017-18 2018-19
RE BE
1 Total Revenue Expenditure 117,914 139,473 153,352 157,874 160,469 181,000 188,100
(=2+6+7))
2 Total working expenses 111,572 130,321 142,996 147,836 159,030 179,300 186,000
(=3+4+5)
3 Ordinary Working Expenses 84,012 97,571 105,996 107,736 118,830 130,200 138,000
4 Appropriation to Pension Fund 20,710 24,850 29,225 34,500 35,000 44,100 47,500
5 Appropriation to Depreciation 6,850 7,900 7,775 5,600 5,200 5,000 500
Reserve Fund
6 Miscellaneous expenditure 993 1,144 1,183 1,315 1,440 1,700 2,100
7 Dividend payable to central 5,349 8,009 9,174 8,723 - - -
government
8 Total Capital Expenditure 50,383 53,782 58,718 93,520 109,934 120,000 146,500
9 Total Expenditure (=1+8) 168,297 193,255 212,070 251,394 270,404 301,000 334,600
Note: RE is revised estimates, BE is budget estimates.
Sources: Railways budget documents; PRS.
Employee efficiency is low and expenditure on staff is high
Railway staff productivity is measured in terms of transport output (NTMK+PKM in millions) per
employee. A higher ratio indicates efficient
transport of freight/passenger. The NTDPC Pay Commission revisions
had noted that over the years, staff
The Committee on Restructuring Railways (2015) observed
productivity has improved from 0.23 in
that during the implementation of the Sixth Pay Commission,
1980-81 to 1.2 in 2010-11. The
Railways had healthy fund balances of about Rs 20,000 crore.
productivity has increased due to increase in
Further, the Ministry had anticipated the additional expenditure
transport volumes due to improved and made a provision of Rs 750 crore in ordinary working
operations and a reduction in the number of expenses and Rs 500 crore in the pension fund in the year
employees from 16.5 lakh in 1990-91 to 2008-09.1 In comparison, with the Seventh Pay Commission,
13.2 lakh in 2010-11. However, the there were no such prior provisions and the organisation did
productivity is low compared to countries not have any reserves to meet the financial impact.
such as Russia and China (see Table 4).
The Committee on Restructuring Railways (2015) had observed that the expenditure on staff is
extremely high and unmanageable. This expense is not under the control of Railways and keeps
increasing with each Pay Commission
revision.1 Further, employee costs Table 4: Railways international comparison
(including pensions) is one of the key (2008)
components that reduces Railways’ ability Country Million traffic Route km Route km
to generate surplus, and allocate resources units per million per square
1 (PKM+NTKM) population km area
towards operations.
per employee
The Committee had also recommended USA 15.3 747.4 23.6
unifying and streamlining the recruitment Russia 2.6 598.1 4.9
process, and rationalising the manpower.1 Japan 2.2 157.5 53.0
In addition, the Committee noted the France 2.1 466.5 54.2
importance of planned job rotation and China 1.6 45.5 6.4
training, for developing competencies in
India 0.9 55.2 19.3
relevant areas.1 This would help
Germany 0.7 410.9 94.9
employees think about the larger
Note: USA data is for AAR Class 1 and Amtrak.
organisational goals and objectives instead Sources: Indian Railways Vision 2020; PRS.
of working in silos. The Committee had
also recommended making the organization more business oriented, amenable to private participation
and retain an optimal level of functional specialization within it.1 It also recommended that a
Performance Assessment System should be rolled out to rationally differentiate the performance,
6capability and aptitude of the employees and rate their performance. Note that the Union Cabinet had
approved productivity linked bonus for eligible non-gazetted railway employees (excluding Railway
Police Force personnel) in September 2016.13 The bonus was equivalent to 78 days’ wages for the
financial year 2015-16.
Fuel and electricity
In the last few years, Railways has been spending between 16% - 19% of its revenue expenditure on
fuel. In 2018-19, the expense on fuel and electricity is estimated to be Rs 30,328 crore, which is
about 16% of revenue expenditure.
In 2015-16, due to the fall in fuel prices, the expenditure on fuel was lower by around 5% from the
expenditure in 2014-15. Since then, Railway’s expenditure on fuel has been increasing gradually.
Recently, with fuel prices increasing, it remains to be seen how it will affect Railways’ expenditure.
Depreciation Reserve Fund (DRF)
Appropriation to the DRF is intended to finance the costs of new assets replacing old ones.5 In the
last few years, appropriation to the DRF has decreased significantly. In 2016-17, appropriation to the
DRF was Rs 5,200 crore. This means that Railways spent Rs 5,200 crore towards its depreciating
assets in 2016-17, as compared to Rs 7,775 and Rs 5,500 in 2014-15 and 2015-16 respectively.
Under-provisioning for the DRF has been observed as one of the reasons behind the decline in track
renewals, and procurement of wagons and coaches.5
Table 5: Break up of revenue expenditure (% share)
2012-13 2013-14 2014-15 2015-16 2016-17 2017-18 2018-19
RE BE
Staff cost 34% 33% 30% 36% 43% 40% 41%
Pension fund 17% 17% 18% 22% 22% 24% 25%
Fuel 18% 19% 18% 17% 18% 16% 16%
Lease charges 4% 4% 4% 5% 5% 5% 5%
Depreciation Reserve Fund 5% 6% 5% 4% 3% 3% 0%
Dividend 4% 6% 6% 6% 0% 0% 0%
Note: RE – Revised Estimates, BE – Budget Estimates.
Sources: Railways Budget documents; PRS.
In 2018-19, appropriation to the DRF is estimated at Rs 500 crore, 90% lower than the revised
estimates of 2017-18 (Rs 5,000 crore). Provisioning Rs 500 crore towards depreciation might be an
extremely small amount considering the scale of infrastructure managed by the Indian Railways. 14
The Standing Committee on Railways (2015) had observed that appropriation to the DRF is obtained
as a residual after payment of the dividend and appropriation to the Pension Fund, instead of the
actual requirement for the replacement of assets.5 Further, in 2017-18, the Railways’ contribution
towards its new safety fund, the Rashtriya Rail Sanraksha Kosh (Rs 5,000 crore) was advanced
entirely from the DRF. The Standing Committee on Railways (2018) had noted that transferring
funds from DRF to the Rail Sanraksha Kosh, does not allow for replacement and repair of
depreciating assets. It shows a lack of vision and poor way of utilising and appropriating valuable
resources.14
Rashtriya Rail Sanraksha Kosh
In Union Budget 2017-18, the Rashtriya Rail Sanraksha Kosh was created to provide for passenger
safety in Railways. Typically, the safety fund is used towards elimination of unmanned level
crossings, and improving and modernising signalling systems. It was to have a corpus of Rs one lakh
crore over a period of five years (Rs 20,000 crore per year). The central government was to provide a
seed amount of Rs 1,000 crore, and the remaining amount would be raised by the Railways from their
own revenues or other sources.
7For the year 2017-18, Rs 20,000 crore was allocated to the Rail Sanraksha Kosh. Of this, Rs 15,000
crore was to be contributed from gross budgetary support, and the remaining Rs 5,000 crore was to be
contributed by Railways. With the Railways struggling to meet its expenditure and declining internal
revenues, it is unclear how Railways will continue to fund the Rail Sanraksha Kosh.
The Standing Committee on Railways (2018) noted that by the end of January 2018, the expenditure
out of the Rail Sanraksha Kosh was Rs 10,709 crore (about 50% of the allocation). It observed that if
funds from the Kosh cannot be utilised well, then the purpose of having a dedicated safety fund
becomes futile.
Dividend
Railways used to pay a return on the budgetary support it received from the government (GBS) every
year, known as dividend. The rate of this dividend was determined by the Railways Convention
Committee, and was about 5% in 2016-17.5 Various Committees had observed that the system of
receiving support from the government and then paying back dividend was counter-productive.1,5 It
was recommended that payment of dividend can be avoided till the financial health of Railways
improves. In September 2016, along with the budget merger, the requirement to pay dividend to the
central government was removed. The last dividend amount paid was in 2015-16, which was Rs
8,723 crore.
Post the dividend waiver, the Standing Committee on Railways (2017) had noted that part of the
benefit from dividend is being utilised to meet the shortfall in the traffic earnings of Railways.3 It had
noted that this defeats the purpose of removing the dividend liabilities since they are not getting
utilised in creating assets or increasing the net revenue of Railways.
Merging of the Railways Budget with Union Budget
The Railways Budget was separated from the Union Budget in 1924. While the Union Budget looks at the overall
receipts and expenditure of the central government, the Railways Budget looked at the revenue and expenditure of the
Indian Railways. The separation of the Budgets was done to ensure that the central government receives an assured
contribution from the Railways’ revenues (known as dividend), since the proportion of Railways Budget as compared to
the Union Budget was much higher then.15 However, in the last few years, Railways’ finances have deteriorated and it
has been struggling to generate enough surplus to invest in improving its infrastructure.
In September 2016, the Union Cabinet announced the merger of the Railways Budget with the Union Budget.
Consequently, there was no separate budget for the Railways for 2017-18. It was tabled and discussed in Parliament,
similar to the demand for grants of other ministries. All proposals under the Railways Budget are now presented under
the Union Budget. Further, Railways continues to maintain its autonomy and financial decision making powers.
Revenue Surplus and Operating Ratio
Railways’ surplus is calculated as the Figure 3: Operating Ratio
difference between its total internal revenue
93.6%
96.5%
96.0%
92.8%
91.3%
90.5%
90.2%
and its revenue expenditure (this includes
working expenses and appropriation to 250,000 100%
pension and depreciation funds). Operating 200,000 80%
Rs crore
Ratio is the ratio of the working expenditure 150,000 60%
(expenses arising from day-to-day
100,000 40%
operations of Railways) to the revenue
50,000 20%
earned from traffic. Therefore, a higher
ratio indicates a poorer ability to generate - 0%
2018-19 BE
2012-13
2013-14
2015-16
2016-17
2017-18 RE
2014-15
surplus that can be used for capital
investments such as laying new lines, or
deploying more coaches.
In the last decade, Railways has been Gross traffic receipts Total working expenses
struggling to generate higher surplus. Operating Ratio (RHS)
Consequently, the Operating Ratio has
consistently been higher than 90% for the Note: RE – Revised Estimates, BE – Budget Estimates.
Sources: Railways Budget documents; PRS.
last 10 years.
8In 2016-17, the ratio worsened to 96.5% which is the highest since 2000-01, when the ratio was
98.3%.16 For the same year, if the actual expenditure on pension payments were to be considered, the
Operating Ratio would worsen to 99.5%. In 2018-19, Railways expects to generate a revenue surplus
of Rs 12,990 crore, with an Operating Ratio of 93%.
Issues with financing
Railways’ ability to generate its own revenue has been slowing
The growth rate of Railways’ earnings from its core business of running freight and passenger trains
has been declining. This is due to a decline in the growth of both freight and passenger traffic (see
Figure 4).
Freight traffic growth has been declining, and is limited to a few items
Growth of freight traffic has been declining over the last few years. Growth in freight traffic has
declined from around 8% in the mid-
2000s to a 4% negative growth in mid- Figure 4: Volume growth for freight and passenger
2010s, before an estimated recovery traffic
to about 5% now. 14%
12%
The NTDPC had noted that freight 10%
services are run with a focus on 8%
efficiency instead of customer 6%
satisfaction. The rail network’s 4%
capacity is severely constrained due to 2%
0%
which trains tend to slow down, -2%
affecting the quality of services. -4%
Further, Indian Railways does not -6%
have an institutional arrangement to -8%
2018-19 BE
2012-13
2013-14
2014-15
2005-06
2006-07
2007-08
2008-09
2009-10
2010-11
2011-12
2015-16
2016-17
2017-18 RE
attract and aggregate traffic of smaller
parcel size.21 Therefore, it has been
losing out on high potential markets
such as FMCGs, hazardous materials, % Growth in freight volume % Growth in passenger volume
or automobiles and containerised
cargo. Most of this traffic is Note: RE – Revised Estimates, BE – Budget Estimates.
Sources: Railways Budget documents; PRS.
transported by roads.
The freight basket is also limited to a few commodities, most of which are bulk in nature (see Figure
2). For example, coal contributes to about 43% of freight revenue and 25% of the total internal
revenue. Therefore, any shift in transport patterns of any of these bulk commodities could affect
Railways’ finances significantly.
For example, if new coal based power plants are set up at pit heads (source of coal), then the need for
transporting coal through Railways would decrease. If India’s coal usage decreases due to a shift to
more non-renewable sources of energy, it will reduce the amount of coal being transported. Such
situations could have a significant adverse impact on Railways’ revenue.
In order to improve freight revenue, in 2016-17, the Railways Ministry had proposed expanding the
freight commodities basket, and reviewing the freight tariff policy. In 2017-18, the Railways Ministry
implemented several policies such as: (i) liberalising automatic freight rebate scheme in empty flow
directions (routes with low freight traffic), (ii) getting into long term tariff contracts with key freight
customers, and (iii) introducing double stack dwarf containers as a new delivery model to increase
loadability of trains. However, in both years, the freight traffic and revenue was lower than the
budget estimates.
Freight traffic cross-subsidises passenger traffic
In 2014-15, while Railways’ freight business made a profit of about Rs 44,500 crore, its passenger
business incurred a net loss of about Rs 33,000 crore.17 The total passenger revenue during this
period was Rs 49,000 crore. This implies that losses in the passenger business are about 67% of its
9revenue. Therefore, in 2014-15, for every one rupee earned in its passenger business, Indian Railways
ended up spending Rs 1.67.17
These losses occur across both suburban and non-suburban operations, and are primarily caused due
to: (i) passenger fares being lower than the costs, and (ii) concessions to various categories of
passengers. According to the NITI Aayog, about 77% to 80% of these losses are contributed by non-
suburban operations (long-distance trains). Concessions to various categories of passengers
contribute to about 4% of these losses, and the remaining (73-76%) is due to fares being lower than
the system costs.
The NITI Aayog (2016) had noted that
Railways ends up using profits from its Passenger versus freight rates in other countries
freight business to provide for such In several countries, passenger fares are either higher or almost
losses in the passenger segment, and also equal as freight rates. However, in India, the ratio of passenger fare
to manage its overall financial to freight rate is about 0.3.
situation.17 Such cross-subsidisation has
Figure 5: Ratio of average passenger fare to average
resulted in high freight tariffs. The
freight rates (PKM/NTKM)
NTDPC report (2014) had noted that, in
1.4 1.3
India, the average freight revenue per 1.2
NTKM is one of the highest in the world, 1.1
second only to Germany. In comparison, 0.9 0.9
the average realisation per PKM is one of 0.7
the lowest in the world.
0.4
0.3 0.3 0.3
Higher freight tariffs could be counter- 0.2
0.1 0.1
productive towards growth of traffic in
the segment. The NTDPC report had
China
France
Austria
Malaysia
Greece
Vietnam
Thailand
India
Srilanka
Pakistan
Bangaladesh
Philippines
Indonesia
Korea
also noted that due to such high tariffs,
freight traffic has diverted to other
modes of transport. The higher cost of
freight segment is eventually passed on
to the common public in the form of Sources: NTDPC India Transport Report 2013; PRS.
increased costs of electricity, cement,
steel, etc.17 The NITI Aayog (2016) had recommended that Railways should also consider ways to
rationalize goods tariff distortions.
Various experts have recommended rationalising both freight and passenger fares. One of the ways
could be to price passenger fares closer to cost, thereby increasing these fares. However, in a
competitive market where the demand for transport is elastic, Railways can only increase fares up to a
certain limit depending on competition.17 Recently air fares have become competitive as compared to
Railway fares. The CAG (2018) has noted that post implementation of flexi-fare, air fares were
cheaper than the respective train fares for several routes.7 When compared to the time taken and the
cost of premier trains, air fare becomes a cheaper and preferable mode of travel.7
Losses made by passenger business are classified as social service obligations
In 2014-15, the passenger business incurred a loss of about Rs 33,000 crore.17 Railways classifies
these losses as the social service obligations of its passenger business. As mentioned earlier, these
obligations include: (i) pricing tickets at fares lower than costs, and (ii) passenger concessions (such
as cheaper tickets for senior citizens, army veterans).17
Three issues arise from such classification. First, it is not clear whether this figure hides any
operational inefficiencies. The Committee on Restructuring Railways had noted that the methods of
calculating the cost of running passenger business are not scientific and accurate.1 Therefore, it is
difficult to compute accurately the levels of under-recoveries. The calculation of social costs does not
factor the efficiency of the various expenditures (whether fuel consumption is optimal, whether
maintenance practices and costs are reasonable, etc.).1 The calculation also does not factor in
Railways’ potential to leverage existing assets (such as stations, land banks) that could increase its
revenue sources.
10Second, inefficiency in Railways’ fare structure may also be a factor contributing to the losses in the
passenger service business.17 The NITI Aayog had suggested that Railways can price passenger fares
as per the prevalent market rates in corresponding transport modes. The CAG (2018) had noted that
there is no justification for the Railways for not fully recovering the cost of passenger services in case
of 1AC, 2AC, and First Class travel.16
Third, this raises the question whether Railways should bear these social obligations, when it works as
a commercial department under the government. The NITI Aayog (2016) had noted that there is lack
of clarity on the social and commercial objectives of Railways. The Committee on Restructuring
Railways (2015) had noted that several decisions on the Indian Railways such as increase in fares,
introduction of new trains, and provision of halts are not taken on the basis of commercial
considerations. The central government reimburses Indian Railways only for the investment in
national projects and strategic lines, such as those in Jammu and Kashmir and the north-eastern states.
It may be argued that rail transport services are being provided at lower prices since it is considered as
a public good. However, the question is who should bear the burden of running trains at fares lower
than the cost, or pay for the concessions? Should it be Indian Railways, or should the government
provide this amount through an explicit subsidy? Further for the suburban rail, and inter-city rail
within a state, should the subsidy be borne by the Indian Railways or the state or local governments.
Financing for roads and railways is skewed
Currently, Indian Railways bears all costs of buying its rolling stock, operations, and maintenance of
the entire infrastructure. Its capital costs are funded mostly by either the central government or
borrowings. Until 2015-16, the amount received from central government was in the form of a
perpetual loan.
In case of roads, highway expansion is funded through debt-free transfers from the Central Road Fund
(CRF). A portion of the Road and Infrastructure Cess collected on motor spirit and high speed diesel
(Rs 8/litre) is transferred to the non-lapsable CRF, and is earmarked for the development of both
national and state highways. This cess is collected from all motor-vehicle users, but could be used to
fund highways in a specific region of the country. Therefore, one may argue that highways receive a
general subsidy in the form of cess collected from users all over the country. Further, in case of
highways, most of them are constructed through public private partnerships, and the private player
collects toll that is used for maintaining that particular highway. However, in case of Railways,
revenue from ticketing may not be used towards the specific line from where the revenue is collected.
The question is should railway projects be subsidised by the government in a similar manner as
highways are. Since 2018-19, CRF (renamed as the Central Road and Infrastructure Fund) may be
used for development and maintenance of National Highways, state and rural roads, railway projects,
improvement of safety in railways, and other infrastructure.18
Railways’ accounting system does not create any distinction between the commercial and
social role of Railways
The current accounting system in Railways does not provide details of the cost of various activities
and services, such as introduction of new trains and scheduling of stops. It neither tracks assets nor
assesses liabilities. It also does not create any distinction between the commercial and social role of
Railways (such as running un-remunerative projects, subsidising passenger fares). Consequently, it is
difficult to compute the costs and benefits of any project or activity, or assess the costs of and returns
from various investments.
The Committee on Restructuring Railways had recommended switching to a commercial accrual-
based double entry accounting system. This would help distinguish between revenue and capital
expenditure, and present a complete picture of Railways’ debt and other liabilities. Additionally, it
will help determine the costs and viability of running a train. Some Railway divisions such as the
Jaipur and Ajmer divisions in the North Western Railways have started pilot projects to implement the
commercial accrual-based double entry accounting system.
11Such a system will also enable the different Railways zones across the country to function as separate
cost and profit centres, as their balance sheet will indicate the revenue and liabilities. This will make
them responsible for their own service delivery and revenue generation.
Railways’ ability to invest in capital expenditure has been declining
As discussed earlier, in the last few years, Figure 6: Financing of capital expenditure
Railways has been struggling to run its 100%
transportation business, and generate its
80%
own revenue. Further, with increasing
expenditure on staff and pension, 60%
Railways’ ability to invest in capital
40%
expenditure using its own resources has
been declining. The financial support 20%
from central government and borrowings
0%
have become the bigger sources of
2017-18 BE
2018-19 BE
2009-10
2010-11
2011-12
2012-13
2013-14
2014-15
2015-16
2016-17
2017-18 RE
investing in Railways infrastructure.
Figure 6 shows how the different revenue
sources contribute towards capital
expenditure. While the share of internal Budgetary Support Internal Resources
resources has declined, the share of gross Borrowings
budgetary support has remained constant, Note: RE – Revised Estimates, BE – Budget Estimates.
and there is increased reliance on Sources: Railways budget documents; PRS.
borrowings.
Consequently, dependence on market borrowings has been increasing
The share of borrowings (or extra budgetary resources) to fund Railways’ capital expenditure has
been increasing (see Figure 6). Since 2015-16, majority of the capital expenditure is getting funded
through borrowings. Various committees have noted that an increased reliance on borrowings will
further exacerbate the financial situation of Railways.1,5 It has been recommended that the cash flow
from investments should be more than the cost of borrowing to avoid getting into a debt trap.
Besides capital expenditure, Railways has been using market borrowings to fund its asset maintenance
as well.1 This was because decreasing support from the central government and the payment of
dividend leaves lesser funds with the Railways for the maintenance of assets. The Committee on
Restructuring Railways had recommended that funds borrowed from the market should be used
exclusively for capacity generation and should not be diverted for asset replacements.
12RAILWAYS INFRASTRUCTURE
Rail Infrastructure
Indian Railways has a multi-gauge, multi-traction system covering 67,368 km of route length (as on
March 2017).12 Of this 22,021 km has double and multiple tracks. 25,367 km of route length is
electrified (38%).12 India’s track density at 45.74 per sq km is comparable to the track density in the
United States but much lower than that of Germany, Russia, China or Canada.12
Railways runs about 13,300 passenger trains and 9,200 freight trains daily, covering around 7,200
stations.12 These trains carry 23 million passengers and around 3 million tonnes of freight every
day.12 Each kilometre of track caters to 19,133 people in India (as compared to 13,227 in China).12
Capacity constraints have been increasing, affecting the quality of services
The NTDPC had noted that the rail network faces huge capacity constraints and the current high
density network (network with the highest traffic, roughly identical to the network that connects
metros) has already reached saturation. In 2009-10, of the 212 sections on the high density network,
141 (66%) had line capacity utilisation exceeding 100%. A capacity utilisation of 80% is considered
optimum as smooth train operations requires some relaxation in the line capacity to absorb and
recover from any unanticipated disruptions.
The traffic flow on the rail network is also highly uneven and imbalanced. For example, passenger
trains utilise nearly 65% of the network capacity, but contribute to less than 30% of the revenue. The
golden quadrilateral and the diagonals connecting the four major metros (Delhi, Kolkata, Chennai,
and Mumbai) together constitute 16% of the network but account for around 50% of the freight and
passenger traffic.
Line capacity is severely constrained due to introduction of more trains over the years.19 Since
independence, while Railways’ route kilometres have increased by 23%, passenger and freight traffic
over the Railways network has increased by 1,344% per cent and 1,642% respectively.27 The
Committee on Restructuring Railways had noted that with high levels of capacity utilisation, and the
introduction of new trains, trains tend to slow down.
Capacity constraints and oversaturation in the network also affects Railways’ ability to meet customer
expectations. For example, speeds of freight trains have continued to remain between 25-30 kmph
over the last three decades. Indian Railways also does not operate heavy-haul freight trains on the
network, as the network is common to both freight and passenger trains. Indian trains carry a
maximum gross load of 5,400 tonnes as compared to 20,000-37,000 tonnes carried by trains in China,
South Africa, Brazil, and Australia.
The Expert Group for Modernisation of Indian Railways (2012) had noted that improving signalling
would substantially improve the safety of workers and passengers, and generate a 30% increase in
capacity and associated revenue potential.20 It had recommended implementing automatic block
signalling, providing communication based train controls, and establishing centralised maintenance
control centers.
Poor investment has resulted in a decline of Railways’ share across all transport modes
Within the overall transport sector, in the past few years, roads have consistently received a larger
chunk of the infrastructure investment. While historically Railways have received most of its funding
from the public sector, recently private sector investment has increased. In comparison, roads have
been receiving investments from both public and private sectors. The 12th Five Year Plan proposed to
encourage private investments in Railways.
13With investment levels being low, and a general Figure 7: Share of total freight traffic
decline in ability to generate more revenue, the 100%
quality of services has been declining. Further,
due to the cross-subsidisation by freight traffic, 80%
freight fares have been increasing.
60%
Consequently, Railways has been losing traffic
share to other modes of transport. 40%
The share of Railways in total freight traffic has
declined from 89% in 1950-51 to 30% in 2011- 20%
12 (see Figure 7).21 Between roads and rail,
0%
roads passenger traffic has increased from 32%
1950-51 1978-79 1986-87 2007-08
in 1950-51 to 90% in 2011-12, and rail passenger
traffic has decreased from 68% to 10%. Railways Highways Others
Sources: NTDPC India Transport Report 2013; PRS.
Railways versus Roads: Environmental sustainability
The National Transport Development Policy Committee (NTDPC) report of 2014 (Chair: Dr. Rakesh Mohan) also
compared the environmental and social sustainability of transport by road and railways and made certain observations.
Some of these are as follows:
Energy consumption: As compared to roads, Railways consume 75 per cent to 90 per cent less energy for freight
traffic and 5 per cent to 21 per cent less energy for passenger traffic.
Financial costs: Unit cost of rail transport was lower than road transport by about Rs 2 per NTKM and Rs 1.6 per
PKM (in the base year 2000).
Environmental damage: Rail transport emits 17 gram CO2 equivalent per PKM as compared to 84 gram per PKM in
case of road transport. Rail transport emits 28 gram CO2 equivalent per NTKM as compared to 64 gram per NTKM
in case of road transport.
The NTDPC recommended that a strategic decision should be made in terms of the relative allocation of resources
between rail and road, and accompanying pricing and taxation policies (see page 11 – subsection on comparing
financing of roads and rail). Such initiatives can then be used to move transport demand towards the desired share of
road and railways as mode of transport.
Train speeds on the Indian rail network
As mentioned earlier, while the rail network is fairly large as compared to other countries, trains on
the network are slower. The speed of freight trains has been around 25-30 kmph for a long time.22
The maximum permissible speed on Indian Railways is between 100 kmph to 160 kmph, and the
actual speed achieved is lower, in the range of 60-70 kmph. In comparison, in several developed
countries, the conventional trains have a maximum permissible speed of 200 kmph, while high speed
trains have speeds between 300-350 kmph.
Higher speed trains require dedicated tracks which could either be fenced or elevated tracks, and
hence require significant capital investment. Indian trains tend to be slower because of over-stretched
capacities of the trains, mixed traffic on the network and poor tracks. The superfast trains such as
Rajdhani, Duronto and Shatabdi also use the same tracks as the slow passenger trains and goods
trains, and hence are unable to reach their maximum speed.
Dedicated Freight Corridors
Dedicated Freight Corridors were planned on the western and eastern routes to augment the freight
carrying capacity of Railways. It involves construction of about 3,400 km of dedicated freight lines to
predominantly carry coal and steel on the eastern corridor and containers on the western corridor.
These freight lines will be connected to the coal mines and power plants on the eastern lines, and to
the ports on the western lines to help improve connectivity. The Eastern Dedicated Freight Corridor
(EDFC) is from Ludhiana to Dankuni (1,318 km from Ludhiana to Sonnagar, and 538 km from
Sonnagar to Dankuni).23 The Western Dedicated Freight Corridor (WDFC) is from Jawaharlal Nehru
Port Terminal to Dadri (1,504 km).23
14The estimated cost of the project is Rs 81,459 crore.23 The EDFC is funded by the World Bank, and
WDFC is funded by the Japan International Cooperation Agency (JICA), with some funding coming
from the Railways in the form of equity and some through PPPs. Till May 2018, Rs 38,465 crore has
been spent on construction of both the corridors.23 Both the corridors are targeted to be commissioned
by 2020.23 The financial and physical progress on EDFC and WDFC is 47% and 50% respectively.23
These corridors are designed for a speed of 100 kmph. This will increase the speed of freight trains
from the current 25 kmph, and reduce transit times by less than half of current levels.21 The carrying
capacity on these routes will also be higher, and wagons with higher capacity will also be introduced
on these routes. With freight trains shifting to these dedicated routes, this will free up the rest of the
routes for passenger trains and help improve their speeds.21
High Speed Rail
High Speed Rail is a distinct category of passenger rail system that operates with separate tracks and
rolling stock on separate tracks. The first high speed rail project being implemented in India is the
Mumbai-Ahmedabad High Speed Railway Corridor.24 It has a total proposed length of 508 km,
where train speeds are expected to be between 300-350 kmph with a total travel time between 2 and
2.5 hours. The project is expected to be completed by 2023.
The project is estimated to cost around Rs 1,10,000 crore.25 Of this amount, Rs 88,000 crore will
come from JICA, in the form of a concessional loan of 0.1%.24 The loan term period is 50 years with
a moratorium of 15 years.24 The remaining amount will be contributed by the special purpose vehicle,
the National High Speed Rail Corporation of India Limited which will implement the project.26
The NTDPC (2014) had noted that the demand for high speed services must be high in order to make
the investment in them socially profitable.21 These projects must target corridors that link densely
populated metropolitan areas which suffer from severe road congestion and have deficient air links. It
had recommended that in view of the poor financial situation of the Indian Railways, priority should
be given to dedicated freight corridors that are self-financing.21
Safety in Indian Railways
Under-investment in Railways leading to accidents
Safety has been one of the biggest concerns in the Indian Railways system. While the number of
accidents have gone down over the last few years, the number still remains above 100 per year. The
Standing Committee on Railways noted that slow expansion of rail network has put undue burden on
the existing infrastructure leading to severe congestion and safety compromises.27 Addition of new
passenger trains without providing additional resources (for operations and maintenance) and capacity
augmentation, can also compromise safety in the network.
The Standing Committee on Railways (2016) had noted that under-investment in Railways results in
more rail accidents.27 Avoiding such accidents in the future would also require significant
investments towards capital and maintenance of railways infrastructure. Safety works include
signalling, removal of level-crossings, and track modernisation or renewal. According to the High
Level Safety Review Committee (HLSRC) (Chair: Dr. Anil Kakodkar), the total financial implication
of the safety measures over a five-year period (2012-17) was likely to be around Rs one lakh crore.
According to the NTDPC, safety works on the entire railways network would cost Rs 2.5 lakh crore.
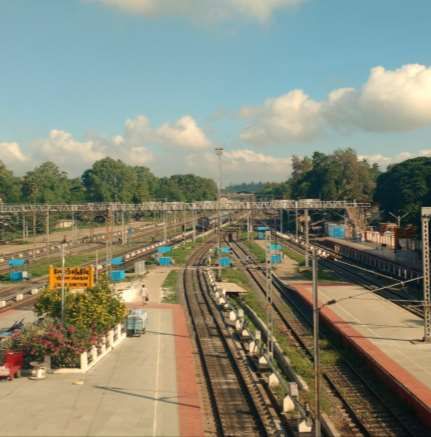
Causes of rail accidents
The number of rail accidents has declined from 325 in 2003-04 to 103 in 2016-17.28 The number of
railway accidents as per the cause are shown in Figure 8 below. In 2016-17, majority of the accidents
were caused due to derailments (75%), followed by accidents at level crossings (19%).
Derailments were also the second highest reason for casualties. The Standing Committee on Railways
(2016) had noted that one of the reasons for derailments is defect in the track or rolling stock.27 It also
noted that 4,500 km of track length should be renewed annually. However, between 2015-16 and
2018-19, the target for track renewal has been set between 2,500 km (in 2015-16) and 3,900 km (in
2018-19).14 The table below shows the track length renewed in the last three years.
15Table 6: Track renewals (in route kms)
2015-16 2016-17 2017-18 RE 2018-19 BE
Target Achievement Target Achievement Target Achievement Target
Track
Renewal 2,500 2,794 2,668 2,487 3,600 3,600 3,900
(RKM)
Note: RE is Revised Estimates, BE is Budget Estimates.
Source: Standing Committee on Railways, 2018; PRS.
The Standing Committee (2016) had recommended that Indian Railways should switch completely to
the Linke Hoffman Busch (LHB) coaches as they do not pile upon each other during derailments and
hence cause lesser casualties.27
Figure 8: Types of railway accidents
350 325
300
Number of accidents
250 234 234
195 194
200 177
165
150 141 131 131
121
118 107 104
100
50
0
2003-04
2004-05
2005-06
2006-07
2007-08
2008-09
2009-10
2010-11
2011-12
2012-13
2013-14
2014-15
2015-16
2016-17
Derailments Level crossing accidents Miscellaneous
Sources: Indian Railways Annual Reports; PRS.
Un-manned level crossings
Unmanned level crossings (UMLCs) continue to be the biggest cause of casualties in rail accidents.
As on April 1, 2017, there were 7,701 UMLC in the railway network.29 Between 2010 and 2013, the
Ministry fell short of meeting the targets to eliminate UMLCs. Further, the target of eliminating
UMLCs was reduced by about 50% in 2014-15.27 The Standing Committee on Railways had
recommended that audio-visual warnings should be implemented at level crossings to warn road users
about approaching trains. These may include Approaching Train Warning Systems, and Train
Actuated Warning Systems.27
Currently, Automatic Train Protection (ATP) Systems have been implemented in certain sections
(Delhi-Agra, Chennai Suburban, Mumbai Suburban, and Kolkata Metro).30 A Train Collision
Avoidance System (type of ATP system) is currently under trail in South Central Railways as a pilot.
Railway safety in other countries19
USA, UK, Ireland, Australia, and South Korea have dedicated statutory and independent institutions for rail safety.
Further, some countries such as USA (2008), Australia (2010) and UK (2003) also have Rail Safety Improvement Acts.
European countries have European Train Control System (ETCS), which creates a standardized train control system at
European level to address concerns on track–to-train transmission of information. USA has a Positive Train Control
system for command, control, communication and information. Besides a few track side identifiers, the train position and
speed are correlated with precision using GPS signals. This reduces the probability of collision between trains and works
all along the rail route. Japan rail mostly uses radio for track to train information exchange.
16You can also read