City of Winnipeg Community and Financial Trends - Selected Statistics on Local Demography, Development, and Municipal Finance
←
→
Page content transcription
If your browser does not render page correctly, please read the page content below

City of Winnipeg
Community and Financial
Trends
Selected Statistics on Local Demography, Development,
and Municipal Finance

Economic Research · June 2020

Community and Financial Trends Preface
As part of the City of Winnipeg’s budget documentation, a document outlining recent trends in the
city’s population, demographic, community, and financial changes is produced. This is done to
provide the public with current and historical information on the people that live here and the state of
our municipal finances, while also informing the City of Winnipeg’s Public Service to help guide the
development of fiscal policy in terms of revenue generation and expenditure. Understanding our
community and its needs are crucial in guiding the development and delivery of municipal services.

What is different this year is that at the time of this report’s writing, the entire world is experiencing an
unprecedented disruption due to the global health pandemic caused by Coronavirus disease 2019
(COVID-19). COVID-19 is an infectious disease discovered in December 2019 that is easily spread from
person to person, and is known to cause respiratory infections. 1 This disease spread rapidly across the
world in the months following its discovery, prompting most countries to adopt drastic measures to
limit the spread of the disease including closing boarders, quarantining cities, cancelling international
flights, and encouraging social distancing behaviors that would reduce human interaction for several
months.

These actions undertaken by governments across the world have had a significant impact on the
global economy. Across Canada, public health orders beginning towards the end of March 2020
required many non-essential businesses to close down across the country, leading to significant
disturbances in local labour markets and economies.

As this report is being written, all Canadian provinces are in varying states of emergencies, many non-
essential businesses are closed, and people are being actively encouraged to stay at home as much as
possible and to not gather with people outside their household. While it is too early to draw
conclusions on what impact COVID-19 will have, even early on it is clear that these measures will have
a significant impact on the global and local economy.

It is anticipated that the current and lasting effects of COVID-19 will have a real impact on the world,
and also right here in Winnipeg. It is not yet clear the scope and magnitude this pandemic will have on
global development in years to come, but it can be assumed that some of the trends that we’ve
observed historically may be disrupted or altered, at the very least for this year and perhaps the next.

As such, this report will aim to cover similar content as it has in years past, with added content in
some sections that will speculate on how COVID-19 may impact that particular topic over the short
term. While these comments will not be definitive given the evolving nature of the global epidemic, it
is hoped that they will provide some perspective on how our community and its needs may
potentially change both during the health and economic crisis and after, once recovery begins.

1
    World Health Organization. April 17, 2020. Q&A on Coronaviruses (COVID-19). Accessed April 27, 2020.

2       winnipeg.ca/infrastructure
Community Trends
Population
Population Growth
Prior to the 1990s, Winnipeg had historically seen strong population growth in most decades following
the Second World War. However, the growth in population from 1989 to 1999 slowed down
significantly to the point where Winnipeg was growing by an average of only 1,000 people per year.
Historically, the 1990s represented one of the slowest-growth decades in the City’s history.

This trend reversed beginning in the early 2000s primarily due to an increase in international
migration, and population
growth resumed at regular           City of Winnipeg Recent Population Growth
rates. By the end of the 2010s,     120,000
Winnipeg had experienced the
                                                                                             100,400
second largest growth in
population in a decade, with        100,000
population estimated to have
grown by over 100,000 people         80,000
from 2009 to 2019.

The figure on the right                60,000
compares the three most recent
                                                                             32,600
decades of population growth
                                       40,000
in Winnipeg and demonstrates
the significant difference in                           13,700
growth between the 1990s and           20,000
2010s.

The figure on the following                -
page shows the estimated                           1989 to 1999          1999 to 2009           2009 to 2019
growth of Winnipeg’s
population beginning in 1879. Source: Statistics Canada, Table 17-10-0142-01, Population Estimates, July 1, by
The estimated population at      census subdivisions, 2016 boundaries; Manitoba Bureau of Statistics; City of
the end of each decade is        Winnipeg Calculations.
reported in the data labels (in  Note: Population growth by decade is calculated using the previous year of the
thousands). Based on this        given decade as the base year. (E.g. growth for 1990 to 1999 compares population
data, it is estimated that the   in 1989 to population in 1999).
City of Winnipeg experienced
the largest decade of growth from 1949 to 1959, growing by an estimated 105,000 people over the
course of 10 years. By comparison, Winnipeg grew by an estimated 100,400 people from 2010 to 2019,
representing the second largest decade of growth in Winnipeg’s history.

3   winnipeg.ca/infrastructure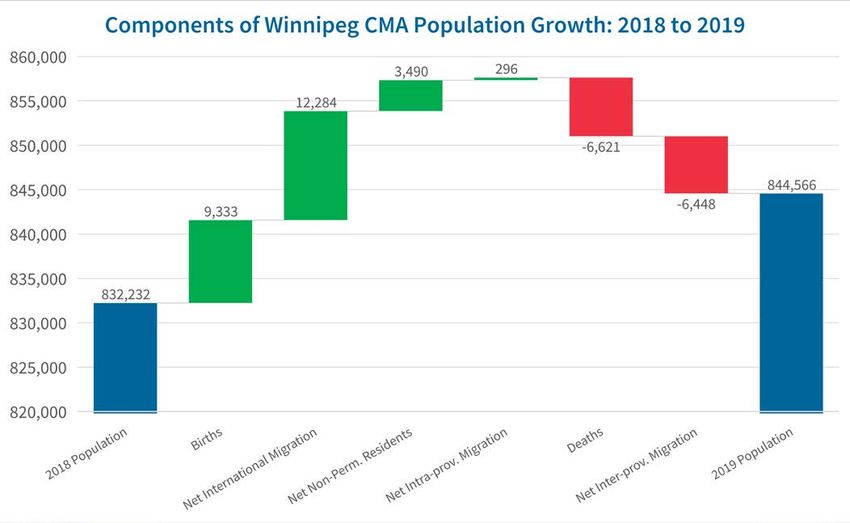
City of Winnipeg Population Estimates - 1879 to 2019
                                                                                                              764
    800,000
                                                                                                       664
    700,000                                                                              617    631
                                                                                  571
    600,000                                                                530
    500,000                                                         452

    400,000                                                  348
                                              283     303
    300,000                            215
    200,000                     125
    100,000        25     44
               9
         -
              1879 1889 1899 1909 1919 1929 1939 1949 1959 1969 1979 1989 1999 2009 2019

Source: Statistics Canada, Table 17-10-0142-01, Population Estimates, July 1, by census subdivisions, 2016
boundaries; Manitoba Bureau of Statistics; City of Winnipeg Calculations.

While Winnipeg has grown
significantly over the past       Distribution of Manitoba's Population
decade, it has also been          Growth - 2009 to 2019
the primary centre of
population growth within               City of Winnipeg
                                            100,400                                               Metropolitan
the province of Manitoba.                                                                        Region Outside
                                             62%
                                                                                                   Winnipeg
The chart on the right
                                                                                                     14,700
shows that while Manitoba
                                                                                                      9%
grew by around 161,000
people from 2009 to 2019,
the majority of this growth
(62 per cent) was
concentrated within the                                                                     Rest of
City of Winnipeg. Another 9                                                                Manitoba
per cent of this growth                                                                     45,800
occurred within the                                                                          29%
metropolitan area                   Source: Statistics Canada, Table 17-10-0142-01, Population estimates, July 1,
surrounding Winnipeg, and           by census subdivision, 2016 boundaries; Statistics Canada, Table 17-10-0135-
the remaining 29 per cent of        01, Population estimates, July 1, by census metropolitan area and census
growth occurred across the          agglomeration, 2016 boundaries; Statistics Canada, Table 17-10-0005-01,
rest of the province.               Population estimates on July 1st, by age and sex

4     winnipeg.ca/infrastructure
In the short term over the next 5 years, the City of Winnipeg’s population is forecasted to increase by
over 55,000 people, growing from 763,900 in 2019 to 819,200 in 2024. This represents a compound
annual growth rate of 1.4 per cent which is slightly less than the forecasted rate for the Metropolitan
Area of 1.5 per cent.
Overall, the Province of Manitoba is expected to add 83,600 people over the same time period,
representing a compounded growth rate of 1.2 per cent. Keeping in-line with what has been observed
over the past decade, 66 per cent of Manitoba’s population growth is expected to take place within
the City of Winnipeg.
City of Winnipeg and Census Metropolitan Area (CMA)
Population Forecast
950,000 909,900
900,000 844,600
850,000 819,200
800,000 763,900
750,000
675,100
700,000
650,000 625,200
600,000
1991 1993 1995 1997 1999 2001 2003 2005 2007 2009 2011 2013 2015 2017 2019 2021f 2023f
City of Winnipeg Forecast City of Winnipeg CMA Forecast CMA
Source: Statistics Canada, Table 17-10-0142-01, Population estimates, July 1, by census subdivision, 2016
boundaries; Statistics Canada, Table 17-10-0135-01, Population estimates, July 1, by census metropolitan area and
census agglomeration, 2016 boundaries; Conference Board of Canada, Metropolitan Outlook 1 Data – Winter 2020
Note: Forecast was produced prior to the COVID-19 pandemic.
Population Growth Summary by Region
Average Compounded
2019 2024f
Region Annual Annual
Population Population
Growth Growth Rate
City of Winnipeg 763,900 819,200 11,060 1.4%
Winnipeg Census Metropolitan Area (CMA) 844,600 909,900 13,060 1.5%
Manitoba 1,369,500 1,453,100 16,720 1.2%
5 winnipeg.ca/infrastructureWhile Winnipeg has shown strong population growth over the last decade, this trend was observed
among many other major Canadian cities as well. The graph below shows the total population growth
across major Canadian municipalities from 2009 to 2019 along with the percentage growth displayed
above each bar. While Winnipeg’s total population grew more than many other municipalities such as
the City of Vancouver, City of Saskatoon, Halifax Regional Municipality, and the City of Hamilton, other
municipalities such as the City of Toronto, City of Calgary, City of Edmonton, and City of Ottawa have
grown more.
Population Growth Across Major Canadian Municipalities,
2009 to 2019
12%
350,000 316,700
300,000 21%
25%
250,000 227,400
208,000
9% 16%
200,000
150,400 145,200
15%
150,000
100,400 11% 25%
100,000 70,700 12% 6% 9% 23% 7%
55,300 46,600 46,400 45,500 44,800 15%
34,800
50,000 12,100
0
Source: Statistics Canada, Table 17-10-0142-01, Population estimates, July 1, by census subdivision, 2016
boundaries. Please note that these population growth figures represent population growth across city
municipalities, not Census Metropolitan Areas (CMA).
International Migration by Year for the Winnipeg CMA
Net International Migration Net non-permanent residents
20,000
15,000
10,000
5,000
0
2002 2003 2004 2005 2006 2007 2008 2009 2010 2011 2012 2013 2014 2015 2016 2017 2018 2019
Source: Statistics Canada, Table 17-10-0079-01, Components of population growth by census metropolitan area,
age group and sex, annual, based on the SGC 2011 (inactive); Statistics Canada, Table 17-10-0136-01, Components
of population change by census metropolitan area and census agglomeration, 2016 boundaries
6 winnipeg.ca/infrastructureLike most Canadian cities, Winnipeg’s population growth is primarily driven by international immigration which has steadily increased since the early 2000s as evidenced in the figure above. A significant component of this is under the Provincial Nominee Program (PNP). Of those immigrating to Manitoba under the Provincial Nominee Program, approximately 71 per cent intend on settling in Winnipeg. 2 As international immigration drives population growth, this in turn, has an influence on major trends. Another important trend to highlight is how Winnipeg’s population tends to grow on a yearly basis. The waterfall chart below shows how Winnipeg grew from 2018 to 2019. Overall, 37 per cent of our growth in population came from births and 48 per cent came from net international migrants. With respect to population loss, 51 per cent was due to deaths and 49 per cent was due to people leaving Winnipeg for other provinces. Source: Statistics Canada, Table 17-10-0136-01, Components of population change by census metropolitan area and census agglomeration, 2016 boundaries The above chart demonstrates that Winnipeg experiences significant net population loss from individuals moving to other provinces in Canada (net interprovincial migration). In fact, from 2018 to 2 Province of Manitoba, Immigrate Manitoba. 2018. MPNP Annual Report – 2018. Intended Destination in Manitoba. Accessed April 28, 2020. 7 winnipeg.ca/infrastructure
2019, Winnipeg had the largest net loss in population from interprovincial migration out of all 35
Census Metropolitan Areas in Canada. 3

Further analysis shown in the following figures illustrates that largest group of individuals leaving
Winnipeg for other provinces are those aged 20 to 39, and the split across genders is roughly the same.
Further, the primary cities that Winnipeggers move to outside of Manitoba are Toronto, Vancouver,
Calgary, Edmonton, and Ottawa in that order.

        Age and Gender Distribution of Individuals Migrating from
        Winnipeg to Other Provinces, 2018 to 2019
                                                      Females     Males

    30%
                                                      25%
    25%                                    22%

    20%
    15%                   11%      11%                                   12%   11%
    10%
                                                                                               4%         3%
       5%
       0%
                          0 to 19 years    20 to 39 years            40 to 59 years         60 years and older

      Source: Statistics Canada, Table 17-10-0136-01, Components of population change by census metropolitan area
      and census agglomeration, 2016 boundaries

            Top 5 Census Metropolitan Areas for Interprovincial Out-
            migrants leaving Winnipeg for other provinces, 2017 to 2018
                  2,500
                                 2,013
                  2,000
    Individuals

                                            1,405
                  1,500
                                                                 1,137
                  1,000                                                               865
                                                                                                        612
                   500

                     -
                                Toronto   Vancouver             Calgary        Edmonton        Ottawa - Gatineau
Source: Statistics Canada, Table 17-10-0141-01, Interprovincial and intraprovincial migrants, by census
metropolitan area and census agglomeration of origin and destination, 2016 boundaries
Note: 2017/2018 is the latest data available for this table at this time.

3
 Statistics Canada, Table 17-10-0136-01, Components of population change by census metropolitan area and census
agglomeration, 2016 boundaries.

8                 winnipeg.ca/infrastructure
Population Growth: Implications of COVID-19
Like many major Canadian cities, Winnipeg has experienced significant growth in population, much of
which is due to international migration. For municipalities, a growing population has an affect on city
planning and finances. Population growth leads to the demand for housing and employment lands,
which in turn requires cities to expand their infrastructure to accommodate new dwelling units and
workplaces, and to also increase the provision of public goods such as safety and transportation
services to maintain existing levels of service.
With much of Winnipeg’s population growth being driven by international migration, the world-wide
closure of international boarders, cancelation of international flights, stay-at-home orders, and social
distancing measures may have a real impact on this source of growth. For the short term,
international migrants destined for Winnipeg may have to stay within their country until the pandemic
subsides, borders reopen, and international travel is once again permitted. Further, an increase in
unemployment may mean that demand for labour from international migration may reduced. This
has the potential to reduce the growth in Winnipeg’s population in the near-term, and it is too early to
speculate on the long-term implications of COVID-19 on population growth.
In a May 2020 publication from RBC Economics, the authors note that while Ottawa had set a target of
370,000 new permanent residents from immigration for 2020, the impact of COVID-19 on immigration
trends based on data as of March could mean the target falls short by 170,000, or 46 per cent, by the
end of the year. 4 In 2019, there were over 12,000 net international migrants that moved to the
Winnipeg CMA, so if a 46 per cent reduction was experienced locally, that would mean net
international migration to Winnipeg could be reduced by around 5,500 individuals, resulting in net
growth from international migrants of approximately 6,500 by the end of 2020.
On the other side of the spectrum, the figures above have shown that people leaving Winnipeg for
other provinces puts significant downward pressure on local population growth. The effects of the
COVID-19 pandemic may temporarily limit the outflow of locals leaving Winnipeg for other
jurisdictions in the short-term.
With respect to births and deaths, there are a variety of factors that COVID-19 may influence that
affect these components of population growth. Uncertainty among people in regards to their income
and employment status may alter the timing of family planning ultimately affecting the birth rate,
while a reduction in car travel, stay-at-home orders, and COVID-19 itself may affect the death rate.
Potential Effect of COVID-19 on City of Winnipeg Population Growth
Variable Potential Effect
Births Uncertain
Deaths Uncertain
International in-migration Temporary Decrease
Intra-provincial out-migration Temporary Decrease
4
Source: Royal Bank of Canada (RBC) Economics. May 29, 2020. COVID-19 Derails Canadian Immigration. Accessed May 29,
2020.
9 winnipeg.ca/infrastructureDemographics
One of the results of international migration is that the proportion of Winnipeg’s population that is
composed of visible minorities has risen significantly. In 2001, 13 per cent of Winnipeg’s population
belonged to a visible minority group and by 2016, this value had risen to 28 per cent, now representing
over 193,000 people. 5 The largest group of visible minorities in Winnipeg is the Filipino community,
which totaled over 73,000 people in 2016.
Population that is Visible Distribution of Visible Minorities - 2016
Minority, 2001 and 2016
30% 28%
25% Filipino
33%
20% Other
22% Latin
15% 13% American
3%
10% South
Southeast
Asian
5% Black Asian
17%
12% 4%
0% Chinese
2001 2016 9%
Source: Statistics Canada, 2001 and 2016 Census of Population.
Note: Data is representative of city (CY) municipal boundaries.
This trend is not unique to Winnipeg as many cities in Canada have seen a significant increase in the
proportion of the population that is visible minority. The chart below shows what proportion of the
population was visible minority in 2001 and in 2016 across major cities in Canada.
Percent of Population that is Visible Minority across Canada -
2001 vs. 2016
2001 2016
60% 51% 51%
48%
50% 42%
36% 36% 33%
40% 27% 26%
30% 19% 19% 18% 19% 19% 19%
20% 15% 13% 14% 11%
11% 9% 7%
6% 5%
10%
0%
Source: Statistics Canada, 2001 and 2016 Census of Population.
5
Source: Statistics Canada 2001 and 2016 Census of Population. Data representative of city (CY) municipal boundaries.
10 winnipeg.ca/infrastructureWith respect to Indigenous peoples, Winnipeg has the largest Indigenous population in Canada out of
all major cities. In 2016, over 84,000 people identified as Indigenous representing over 12 per cent of
Winnipeg’s overall population. 6
Indigenous Populations across Canada - 2016
100,000
84,300
80,000
60,000 50,300
35,200
40,000 27,300 23,100 23,000
20,900 15,700
20,000 13,900 12,100 12,000
7,300 3,800
0
Source: Statistics Canada, 2016 Census of Population.
Furthermore, the Indigenous population in Winnipeg is growing significantly faster than the non-
Indigenous population, and this is illustrated in the chart below on the left. For example, between
2011 and 2016, the Indigenous population grew by 16.5 per cent while the non-Indigenous population
grew by 4.9 per cent. 7 In terms of their identity, as at the 2016 census, 54 per cent of Winnipeg’s
Indigenous population identified as Métis, 44 per cent identified as First Nations, and 2 per cent
identified as Inuk (Inuit) or other/multiple. 8
Winnipeg Population Change by Group Distribution of Indigenous Population
by Identity - 2016
Indigenous Population Non-Indigenous Population
18% 16.5%
16%
13.5%
14% First
12% Nations
10% 36,840
44%
8%
6% 4.9%
Métis
4% 2.8%
45,635
2% 54%
0% Inuit, Other
2006 to 2011 2011 to 2016 & Multiple
1,830
Source: Statistics Canada, 2011 and 2016 Census of Population. 2%
6
Source: Statistics Canada 2016 Census of Population
7
Source: Statistics Canada 2006, 2011, and 2016 Census of Population
8
Source: Statistics Canada 2016 Census of Population
11 winnipeg.ca/infrastructureCity of Winnipeg Population Pyramid - 2019
% Male % Female
85 and over
80-84
75-79
70-74
65-69
60-64
55-59
50-54
45-49
40-44
35-39
30-34
25-29
20-24
15-19
10-14
5-9
0-4
10% 8% 6% 4% 2% 0% 2% 4% 6% 8% 10%
Source: Statistics Canada, Demography Division, customized for City data.
Immigrants have changed the demographic profile of our population in more ways than simply the
percentage of visible minorities; it has also changed the overall age distribution of our population. In
the late 1990s there were concerns that the largest share of our population at the time, baby boomers,
would leave the workforce and be replaced by a smaller share of people of younger age; however, as a
result of immigration, this concern has been alleviated.
Indeed, the largest share of population is now those between the ages 25 to 29 at 8 per cent which
currently reflects over 60,000 individuals. 9 The table on the following page provides a detailed
breakdown on the distribution of Winnipeg’s population by age and gender in 2019.
9
Source: Statistics Canada, Demography Division, customized for City data
12 winnipeg.ca/infrastructureExpected Population Growth over the next: 10
Region 10 Years (2015-2025) 25 Years (2015-2040)
Winnipeg CMA 117,900 272,900
City of Winnipeg 96,900 204,200
Rest of CMA 20,900 59,500
City of Winnipeg – Long Run Population Forecast
1,100,000 1,055,500
1,050,000
1,000,000
950,000
900,000
922,600
850,000
800,000
750,000
700,000 Winnipeg - City Winnipeg - CMA
650,000
600,000
2017
2018
2019
2020
2021
2022
2023
2024
2025
2026
2027
2028
2029
2030
2031
2032
2033
2034
2035
2036
2037
2038
2039
2040
Source: City of Winnipeg 2016 Population Forecast
Note: Forecast was produced prior to the COVID-19 pandemic.
As a consequence of strong population growth from 2015 to 2040, over the 25 year forecast completed
in 2016, the City of Winnipeg census metropolitan area is expected to increase its population to just
over 1 million; an increase of 272,900. 75% of the CMA growth is expected to be within the City of
Winnipeg, or 204,200 additional people from 2015 to 2040.
10
Source: City of Winnipeg 2016 Population Forecast
13 winnipeg.ca/infrastructureCity of Winnipeg Population by Age – 2019 11
Age Total Females Males
0-4 42,110 20,764 21,346
5-9 43,175 21,097 22,078
10-14 41,296 20,390 20,906
15-19 46,586 22,431 24,155
20-24 57,064 26,795 30,269
25-29 60,723 29,498 31,225
30-34 59,386 29,562 29,824
35-39 56,393 28,297 28,096
40-44 50,561 25,213 25,348
45-49 47,433 23,828 23,605
50-54 46,015 23,395 22,620
55-59 49,770 25,174 24,596
60-64 44,045 22,549 21,496
65-69 37,747 19,865 17,882
70-74 29,904 16,124 13,780
75-79 19,907 11,052 8,855
80-84 14,216 8,362 5,854
85 and over 17,591 11,851 5,740
Total 763,922 386,247 377,675
Demographics: Implications of COVID-19
The demographics of a city are largely a function of it’s existing population. As such, it is not
anticipated that the COVID-19 pandemic will have a significant influence on the demographic
composition of Winnipeg’s population.
One minor influence to consider is the impact of reduced international migration. Individuals coming
from abroad to live in Winnipeg will increase its diversity, and based on their younger age, tend to
bring down the average age in Winnipeg. A temporary reduction in international in-migrants may lead
to a slower rate of population diversification, though if immigration resumes at regular rates shortly
after the pandemic subsides, the effect would likely be insignificant.
11
Source: Statistics Canada, Demography Division, customized for City data
14 winnipeg.ca/infrastructureResidential Housing and Commercial Market
A Decade of Investment
Over the last decade, the City of Winnipeg has experienced substantial levels of building construction
investment. It is estimated that between 2010 and 2019, over $16 billion has been invested in the local
building stock, from new structures, renovations, and additions. The two heatmaps below visualize
where and how much residential and non-residential investment has occurred over the last ten years.
For residential building investment which has totalled approximately $8.7 billion since 2010, the
majority of investment has taken place in downtown, Osborne, South Tuxedo, and greenfield
Residential Building Investment: Heatmap of Total Construction Value
From 2010 to 2019 (Darker Blue = More Dollars of Investment)
Source: City of Winnipeg Property, Planning &
Development Department
Mapped using kepler.gl website
15 winnipeg.ca/infrastructuredevelopments like Waverley West. While some of the residential investment has been in new and
emerging communities further from Winnipeg’s downtown, the map below makes it clear that
downtown has also seen very strong residential investment over the last decade.
The hexbin map below visualizes the total amount of dwelling units added (in 0.25 km2 blocks)
between 2010 and 2019. The darker and taller the block, the more units that have been added to that
specific area over the last ten years.
Volume of New Residential Dwelling Units: Hexbin Map of Dwelling Units Added
From 2010 to 2019 (Darker Blue & Taller = More Units Added)
Source: City of Winnipeg Property, Planning &
Development Department
Mapped using kepler.gl website
The above map shows that the number of units added strongly correlates with the dollar volume of
investment. Moreover, both new and emerging communities and the downtown area have seen
significant increases in dwelling units added over the last ten years.
16 winnipeg.ca/infrastructureFor non-residential building investment that has totalled an estimated $7.8 billion since 2010, a
slightly different pattern emerges. Over the last decade, the majority of non-residential construction
has been concentrated in downtown Winnipeg, Health Sciences Centre, South Tuxedo, the University
of Manitoba, Kildonan Crossing, the airport, and the Polo Park area.
Non-Residential Building Investment: Heatmap of Total Construction Value
from 2010 to 2019 (Darker Orange = More Dollars of Investment)
Source: City of Winnipeg Property, Planning &
Development Department
Mapped using kepler.gl website
17 winnipeg.ca/infrastructureInvestment Across Canada in 2019
In 2019, investment in building construction totalled approximately $2.1 billion in the City of
Winnipeg, the highest on record. 12
While data for other municipalities is not available, comparisons can be made at the Census
Metropolitan Area (CMA) level. Per-capita analysis in the graph below shows that for 2019, the
Winnipeg CMA ranked fifth highest out of 12 major metropolitan regions in Canada for total building
investment per capita, at $2,961 per person.
In more detail, Winnipeg ranked 7 out of 12 on residential investment at $1,523 per person, and was
ranked first for non-residential investment at $1,438 per person.
In recent years, Winnipeg has continued to see significant investment in both residential and non-
residential development, much of which may be a result of a growing population which drives the
demand for residential, employment, commercial, recreational, and educational space.
Per-Capita Investment in Building Construction by CMA - 2019
Total Residential Investment per Capita - 2019 Total Non-Residential Investment per Capita
$5,000
$4,500
$1,404
$4,000
$3,500
$1,233
$3,000
$2,936 $883 $1,238 $1,438
$2,500 $1,310 $1,304 $1,107
$553 $1,312
$2,000 $2,290 $934
$2,149
$1,941
$1,500 $1,728 $1,042
$1,523 $1,483 $1,565
$1,413 $1,369
$1,000 $1,104
$500
$596
$0
Source: Statistics Canada, Table 34-10-0066-01, Building permits, by type of structure and type of work; Statistics
Canada, Table 17-10-0135-01, Population estimates, July 1, by census metropolitan area and census
agglomeration, 2016 boundaries
12
Source: City of Winnipeg Property, Planning, and Development Department
18 winnipeg.ca/infrastructureHousing Starts
As population increases in our city, so does the demand for dwellings which are referred to as housing
starts. The following chart compares yearly population growth (left axis) to the volume of housing
starts (right axis) in the City of Winnipeg.
Winnipeg Population Growth versus Housing Starts
1990 to 2019 Annual Population Change (Left Axis) Housing Starts (Right Axis)
18,000 9,000
Year-over-year Population Growth
7,000
13,000
Housing Starts
5,000
8,000
3,000
3,000
1,000
-2,000 -1,000
1990 1992 1994 1996 1998 2000 2002 2004 2006 2008 2010 2012 2014 2016 2018
Source: Canadian Mortgage and Housing Corporation (CMHC) Starts and Completions Survey; Statistics Canada,
Table 17-10-0142-01, Population estimates, July 1, by census subdivision, 2016 boundaries
It’s also important to note that while the volume of housing starts has been increasing to meet the
growth in population, the type of dwellings constructed has also changed. Compared to the early
1990s, the proportion of housing that was built that were multi-residential units has significantly
increased; in 1990, multi-residential units accounted for 13 per cent of housing starts and in 2019, they
accounted for 72 per cent.
Winnipeg Housing Starts by Type
1990 to 2019
Single Semi-Detached Row Apartment
6,000
5,000
4,000
3,000
2,000
1,000
0
1990
1991
1992
1993
1994
1995
1996
1997
1998
1999
2000
2001
2002
2003
2004
2005
2006
2007
2008
2009
2010
2011
2012
2013
2014
2015
2016
2017
2018
2019
Source: Canadian Mortgage and Housing Corporation (CMHC) Starts and Completions Survey
19 winnipeg.ca/infrastructureHousing Characteristics
Over the course of Winnipeg’s history, as population has changed so too has housing growth and
preferences. For example, peak dwelling construction occurred from the 1950s to the 1980s. The first
two peaks in the 1950s and 1960s were influenced by the Greatest Generation, or by soldiers returning
from the Second World War and then ten years after purchasing their homes. The next big wave
occurred in the 1970s and
1980s when The Greatest Average Single Family House Size by Decade
Generations’ children,
the baby-boomers, Built
purchased their homes. 1,800
1,700
Home Size (Sq.Ft.)
Generations influence 1,600
not only the number of 1,500
homes, but also the type 1,400
– in other words, their 1,300
household preference. 1,200
Societies’ preferences are 1,100
influenced by prevailing 1,000
tastes and affordability,
and this can be seen by
studying living area size
over Winnipeg’s past. For
example, for homes in Source: City of Winnipeg Assessment Parcels via Open Data Portal; City of
Winnipeg’s housing stock Winnipeg Calculations
that still exist and were Single Family House Construction by
built in the 1910s, their size
Decade Built
averaged 1,238 square feet
and in the 1940s, they 35,000
Single Family Homes Built
averaged 1,083 square feet. 30,000
These two decades 25,000
contained some of the 20,000
smallest home builds in 15,000
Winnipeg’s history, 10,000
coinciding with the same 5,000
time periods as the First 0
World War and Second
World War, respectively.
Over time, as population
and preferences have
changed, the average size
Source: City of Winnipeg Assessment Parcels via Open Data Portal; City of
of a single-detached home has Winnipeg Calculations
increased from about 1,083
square feet in the 1940s to nearly 1,751 square feet in the 2010s, an increase of over 62 per cent.
Trends across decades in both housing size and housing construction volume are shown in the charts
to the right.
20 winnipeg.ca/infrastructureWhile the volume and type of housing being built in Winnipeg has evolved over time, so has the
location where the development takes place. The chart below shows how the average distance from
downtown for all dwelling units built in a given year has changed since 1900 (using the Portage and
Main intersection as a reference point).
This chart shows that for homes built from the 1900s to the 1950s, their average distance from Portage
and Main was around 2 to 6 kilometers. From the 1950s to the 1970s, a significant outward shift
occurred and the average distance from downtown for these dwellings increased from 6 to 9
kilometers from downtown. Since the mid-1970s, the average distance from downtown for dwelling
construction has remained relatively stable, and typically occurs between 8 to 10 kilometers from
downtown.
Average Dwelling Distance from Portage and Main by Year Built
1900 to 2019
12
Distance from Portage & Main (Kilometers)
10
8
6
4
2
0
1900 1909 1918 1927 1936 1945 1954 1963 1972 1981 1990 1999 2008 2017
Year Dwelling was Built
Source: City of Winnipeg Assessment Parcels via Open Data Portal; City of Winnipeg calculations
Housing Prices
On the subject of housing prices, Winnipeg continues to be one of the most affordable major housing
markets in Canada for both single-family detached homes and condominium dwellings.
According to RBC Economic Research’s March 2019 Housing Trends and Affordability report, as of the
fourth quarter of 2018 Winnipeg was ranked as the fifth most affordable housing market in Canada,
and the third most affordable major city housing market. 13 In the table below, RBC’s Q4 2018 housing
affordability measure provided for various dwelling categories. This measurement shows the
proportion of median pre-tax household income required to service the cost of mortgage payments,
utilities, and property taxes based on the average market price of a home in that city. It illustrates that
in Winnipeg, it would take approximately 33 per cent of a median household’s pre-tax income to
service an average single-family detached home’s mortgage payment, property tax payment, and
utility bill.
13
Source: Royal Bank of Canada (RBC) Economics. March 2019. Housing Trends and Affordability, March 2019.
21 winnipeg.ca/infrastructureRBC Housing Affordability (Q4, 2018) 14
Aggregate of all Single-family Condominium
Market
categories Detached Apartment
Québec 29.1% 30.9% 22.4%
Regina 29.5% 30.7% 23.0%
Winnipeg 31.6% 33.3% 22.7%
Halifax 31.9% 33.2% 33.3%
Saskatoon 33.4% 35.4% 20.0%
Edmonton 34.8% 37.5% 23.3%
Calgary 40.3% 44.4% 25.4%
Ottawa 40.6% 45.0% 27.2%
Montréal area 44.5% 45.7% 35.7%
Victoria 60.0% 65.9% 39.0%
Toronto area 66.1% 79.1% 42.0%
Vancouver area 84.7% 115.5% 52.5%
While Winnipeg’s housing market continues to remain stable and affordable, like most other cities in
Canada, Winnipeg experienced significant housing price increases throughout the mid-2000s and
2010s. The chart below shows how the average selling price of a home (excluding condos and
apartment dwellings) has changed in Winnipeg from 1990 to 2019. 15 Compared to 1990, in 2019 the
average selling price of a home in Winnipeg has increased 298 per cent.
Winnipeg Average Home Selling Price
1990 to 2019
$325,700
$350,000
$300,000
$250,000
Selling Price
$200,000
$150,000
$81,800
$100,000
$50,000
$0
1990
1991
1992
1993
1994
1995
1996
1997
1998
1999
2000
2001
2002
2003
2004
2005
2006
2007
2008
2009
2010
2011
2012
2013
2014
2015
2016
2017
2018
2019
Source: Winnipeg Realtors and the Canadian Real Estate Association; City of Winnipeg calculations
Note: Excludes condo sales.
14
Source: Royal Bank of Canada (RBC) Economics. March 2019. Housing Trends and Affordability, March 2019.
15
Source: Winnipeg Realtors, the Canadian Real Estate Association, and City of Winnipeg calculations Note: Includes single
family (attached and detached), mobile, duplex, and townhouse dwellings.
22 winnipeg.ca/infrastructureWinnipeg's Rental market: Average Rent and Vacancies
1990 to 2019 Average Monthly Rent (Left Axis) Vacancy Rate (Right Axis)
$1,200 6.4% 7%
$1,076
$1,000 6%
Avg. Monthly Rent
5%
Vacancy Rate
$800
4%
$600
3%
$400
3.0% 2%
$462
$200 1%
$0 0%
1990
1991
1992
1993
1994
1995
1996
1997
1998
1999
2000
2001
2002
2003
2004
2005
2006
2007
2008
2009
2010
2011
2012
2013
2014
2015
2016
2017
2018
2019
Source: Canadian Mortgage and Housing Corporation (CMHC) Rental Market Survey.
Data is representative of total units.
On the subject of residential rental units, vacancy rates in Winnipeg remain low at 3 per cent and
average monthly rent was $1,076 in 2019. Trends in Winnipeg’s rental prices and vacancy rates are
shown in the graph above.
When comparing Winnipeg’s rental market at a national level, the average rents of one-bedroom
apartments in Winnipeg ranked in the lower half in 2019, and was comparable to most cities across
Canada excluding Toronto, Vancouver, and cities in Quebec. 16
Average Monthly Rent Across Canada
One Bedroom Units, 2019
$1,600
$1,385 $1,363
$1,400
$1,130 $1,082
$1,200 $1,029 $1,027 $968 $962 $934 $930
$1,000 $794 $763
$800
$600
$400
$200
$0
Source: Statistics Canada, Table 34-10-0133-01, Canada Mortgage and Housing Corporation, average rents for
areas with a population of 10,000 and over.
16
Source: Statistics Canada, Canada Mortgage and Housing Corporation, average rents for areas with a population of 10,000
and over. Values represent the combined average rent of one and two bedroom apartments in apartment structures of six
units and over, for Census Metropolitan Areas.
23 winnipeg.ca/infrastructureCommercial Market
Concerning commercial vacancy rates, Winnipeg has among the lowest overall office vacancy rates
and industrial space availability rates in Canada. 17 Compared to a Canadian average office vacancy
rate of 12.1 per cent and industrial availability rate of 4.6 per cent, Winnipeg’s overall office vacancy
and industrial availability rates in the fourth quarter of 2019 were 9.9 per cent and 3.6 per cent,
respectively. The graph below compares Winnipeg to other major office and industrial markets in
Canada.
Office and Industrial Vacancy Rates across Canada - Q4 2019
Office - Overall Vacancy Industrial - Overall Availability
30%
24.7%
25%
19.5%
20%
15.5%
15%
9.9% 10.7%
8.2% 8.8%
10% 6.7% 6.7%
6.3%
5% 3.7% 2.8% 3.6% 2.7%
2.4% 1.4%
0%
Vancouver Toronto Ottawa Winnipeg Montréal Halifax Edmonton Calgary
Source: CBRE, Canada Q4 2019 Quarterly Statistics
One interesting feature of Winnipeg’s commercial office market is that a very high proportion of office
space is concentrated in the downtown area. The chart below shows that according to CBRE, of most
major cities in Canada, Winnipeg has the highest proportion of commercial office space in downtown
versus the suburban areas; 72 per cent of the existing office space in Winnipeg is centrally located. 18
Proportion of Commerical Office Space located Downtown -
Q4 2019
80% 72%
62% 62% 59%
60% 53% 50%
46%
41%
40%
20%
0%
Winnipeg Calgary Edmonton Montréal Toronto Vancouver Ottawa Halifax
Source: CBRE, Canada Q4 2019 Quarterly Statistics
17
Source: CBRE. 2019. Canada Q4 2019 Quarterly Statistics
18
Source: CBRE. 2019. Canada Q4 2019 Quarterly Statistics.Net rentable area used as comparison unit.
24 winnipeg.ca/infrastructureHousing and Commercial Market: Impacts of COVID-19 It is still too early to have an accurate understanding of the effect COVID-19 will have on Winnipeg’s real estate market, though some speculation can be made based on preliminary information. On the residential side, social distancing measures will likely result in a lower volume of homes being listed for sale while these public health measures are in place. While a lower supply of homes for sale on the market would put upward pressure on prices if demand remained the same, it is probable that there are fewer home buyers looking to move over the course of the pandemic. At a national level, the Canada Mortgage and Housing Corporation forecasts that housing prices in Canada could, on average, decline by 9 per cent to 18 per cent over the short term due to the high level of Canadian household indebtedness prior to COVID-19 and higher unemployment caused by the pandemic. 19 Whether or not this will hold true for the local market in Winnipeg remains to be seen as Winnipeg’s housing price-to- income ratios are much smaller compared to other major markets like Toronto and Vancouver. Uncertainty surrounding many individual’s employment or income status, business closures, and reductions in intra-provincial travel are sure to reduce the amount of people looking to move dwellings during the pandemic. As such, when a reduced supply is met with reduced demand, it is uncertain what effect this will have on price as it will depend on which force is larger in magnitude. The effect on home prices will only become apparent towards the end of 2020. It is also likely that if COVID-19 were to lead to slower housing activity in the short term, once the pandemic has subsided and an effective vaccine or treatment developed, activity should resume in proportion to the speed at which the general economy recovers. Temporarily, it is expected that while housing construction is considered an essential business and can continue to operate, potentially lower population growth and a global economic slowdown could depress housing starts temporarily. On the commercial and industrial market side, similar global macroeconomic headwinds could slow the development of non-residential real estate in Winnipeg in the interim. For vacancy rates, COVID-19 may have a lasting impact on office workers desire to work from home, and may lead some firms to reduce their overall need for office space thereby reducing their expenses. On the industrial side, some may advocate for moving manufacturing activities closer to local markets which could reduce industrial availability, but conversely a global economic downturn could simultaneously reduce demand for industrial space. The overall effect this will have on societal preferences for office and industrial space are uncertain at this time. Potential Effect of COVID-19 on City of Winnipeg Housing and Commercial Market Variable Potential Effect Housing Prices Uncertain Housing Starts Temporary Decrease New Commercial Construction Starts Temporary Decrease Office Vacancy Rates Uncertain Industrial Availability Rates Uncertain 19 Source: Canada Mortgage and Housing Corporation (CMHC). May 19, 2020. Supporting Financial Stability During the COVID- 19 Pandemic. Speaking Notes for Evan Siddall to the Standing Committee on Finance, Ottawa, Ontario. 25 winnipeg.ca/infrastructure
Economic Trends
Labour Force
Winnipeg’s economy is highly diverse, with many types of industries being well represented in the
City. The table below summarizes the most current employment by sector in the Winnipeg CMA.

 Sector                                                                                Employment – 2019          Distribution (%)
 Health care and social assistance                                                                69,900                      16%
 Wholesale and retail trade                                                                       60,800                      14%
 Manufacturing                                                                                    43,400                      10%
 Educational services                                                                             36,200                        8%
 Construction                                                                                     31,800                        7%
 Accommodation and food services                                                                  30,900                        7%
 Transportation and warehousing                                                                   30,400                        7%
 Finance, insurance, real estate, rental and leasing                                              27,700                        6%
 Public administration                                                                            27,200                        6%
 Professional, scientific and technical services                                                  23,800                        5%
 Other services (except public administration)                                                    18,800                        4%
 Business, building and other support services                                                    17,900                        4%
 Information, culture and recreation                                                              17,300                        4%
 Utilities                                                                                         4,700                        1%
 Agriculture                                                                                       3,000                        1%
 Forestry, fishing, mining, quarrying, oil and gas                                                 1,000
The chart above shows how employment has changed in Winnipeg’s 8 largest industries since 2001.
Overall, total employment in Winnipeg has increased by 22 per cent since 2001 (not shown). In
contrast, employment in the construction industry has nearly doubled, expanding by 99 per cent. The
second largest expansion in employment has occurred in the healthcare and social assistance
industry.

Of the 16 major industries, all but two have experienced an increase in employment since 2001. The
largest industry to experience a decline in employed is the manufacturing industry, which has
experienced a decline of approximately 7,100 jobs since 2001 (-14%). The other industry to experience
loss in the Winnipeg CMA is the agricultural industry, which has experienced a decline of 200 jobs (-
6%), though this value is marginal and it is not known if this loss is statistically significant.

 Distribution of Employment Across Select Cities, 2019
                                  Winnipeg    Montréal    Toronto     Calgary    Vancouver

        18%
        16%
        14%
        12%
        10%
         8%
         6%
         4%
         2%
         0%

Source: Statistics Canada, Table 14-10-0098-01, Employment by industry, annual, census metropolitan areas

The graph above compares the distribution of employment across all industries in Winnipeg versus
select Canadian cities. Overall, the distribution of employment in Winnipeg looks very similar to most
other cities, with a few exceptions:

     1. Winnipeg’s employment in healthcare and social assistance is higher, and represents 16% of
        the workforce versus a 12% average in the cities listed above
     2. Winnipeg’s employment in Professional, Scientific, and Technical services is significantly less,
        and represents only 5% of employment whereas it represents an average of 11% in the cities
        above.

27    winnipeg.ca/infrastructure
Over the last 2 decades, Winnipeg’s unemployment rate has tended to remain below national rates,
but in recent years has begun trending upwards slightly while the national rate has trended
downwards. For a brief period in 2018, the local rate of unemployment was higher than the national
rate (6.3% versus 5.8%, respectively), but in 2019 Winnipeg’s unemployment rate once again dipped
below the national rate.
Unemployment Rates in Winnipeg (CMA) and Canada
2001 to 2019
Winnipeg Canada
10%
5.7%
Unemployment Rate
8%
6%
4%
5.3%
2%
0%
2001 2004 2007 2010 2013 2016 2019
Source: Statistics Canada, Table 14-10-0096-01, Labour force characteristics by census metropolitan area, annual;
Statistics Canada, Table 14-10-0090-01, Labour force characteristics by province, territory and economic region,
annual
The participation rate in Winnipeg, which indicates what percentage of the working-age population is
either employed or looking for work, declined from 68.2 per cent in 2018 to 67.4 per cent in 2019, but
still remains in-line with most other major Canadian cities. The charts below compare the
participation and unemployment rates across major Canadian cities for 2019.
Unemployment Rates, 2019 Participation Rates, 2019
Québec 3.1% Hamilton 65.1%
Hamilton 4.3% Montréal 66.5%
Vancouver 4.6% Toronto 66.7%
Ottawa 4.7% Winnipeg 67.4%
Regina 5.3% Vancouver 68.0%
Winnipeg 5.3% Halifax 68.3%
Montréal 5.7% Québec 68.9%
Halifax 5.8% Ottawa 69.3%
Saskatoon 5.9% Saskatoon 69.4%
Toronto 6.0% Regina 70.8%
Calgary 7.1% Edmonton 72.0%
Edmonton 7.3% Calgary 73.7%
0% 2% 4% 6% 8% 59% 64% 69% 74%
Source: Statistics Canada, Table 14-10-0096-01, Labour force characteristics by census metropolitan area. Data is
representative of those aged 15 years and over.
28 winnipeg.ca/infrastructureGross Domestic Product (GDP)
In 2019, Winnipeg CMA’s real gross domestic product (GDP) totalled $43.8 billion. 20 This represents a
real growth rate of 1.9 per cent compared to the previous year. The pie chart on the right shows the
composition of
Winnipeg’s GDP by Composition of Winnipeg CMA's GDP, 2019
industry. Overall, the
Finance and Insurance
sector is the biggest
Prof. & Science
contributor to 4%
Other
Winnipeg’s GDP at 22 Sectors
Primary and Util. 8% Finance &
per cent, followed by 5% Insurance
manufaturing, public 22%
administration, Retail Trade
6%
healthcare, and social
assistance, and
transportation and Wholesale
warehousing. Trade Mfg.
6% 10%
Education
Compared to other 6%
Canadian cities,
Winnipeg’s GDP growth Public Admin.
9%
of 1.9 per cent from Healthcare &
2018 to 2019 was in the Construction Social
middle, and above 7% 9%
Transp. &
Canada’s overall Warehousing
growth of 1.4 per cent. 8%
In normal years, this
section would also Real GDP Growth Across Canada, 2018 to 2019
include information 3.5% 3.0% 2.9%
on the latest GDP 3.0% 2.6%
Canada: 1.4%
forecast for Winnipeg 2.5% 2.1% 2.1% 1.9%
Real GDP Growth
1.8% 1.6%
but as explained in 2.0%
the section below, this 1.5%
1.0% 0.6%
has been omitted due 0.4% 0.3%
0.5%
to the uncertainty
0.0%
generated by the
-0.5%
COVID-19 pandemic. -1.0%
-1.5% -0.9%
Source: Conference Board of Canada, Metropolitan Outlook 1 – Winter 2020
Source: Conference Board of Canada, Metropolitan Outlook 1 – Winter 2020. Values are for the Winnipeg Census
20
Metropolitan Area (CMA).
29 winnipeg.ca/infrastructureWinnipeg’s Economy: Potential Effects of COVID-19 The effect of the COVID-19 pandemic on the global, Canadian, and Winnipeg regional economy has been and will continue to be significant. In Manitoba, many businesses scaled back their operations or ceased entirely towards the end of March 2020, and while efforts are being made to re-open the economy in controlled steps in a way that aims to minimize the risk of a second wave, the economic damage has already been dealt. As of the first week of May 2020, over 7.5 million Canadians have applied for the Canada Emergency Response Benefit (CERB), which is a weekly payment of $500 for up to 16 weeks provided by the Federal Government to individuals who have stopped working because of reasons related to COVID- 19. 21 This in and of itself is a strong indicator of a significant reduction in business activity which will translate to temporarily higher unemployment rates and lower output for many industries. In the Bank of Canada’s April 2020 Monetary Policy report, the Central Bank notes that COVID-19 will cause a sharp and sudden contraction in global economic activity and that a sharp reduction in oil prices will add additional severity to the inevitable economic downturn in Canada. 22 Further, the Bank notes that there are many unknowns on how the pandemic will develop and what the full effect will be over the next few months leading to significant uncertainty when trying to predict the pandemic’s affect on economic output, inflation, and time to recovery. While many organizations including the City of Winnipeg continue to produce economic forecasts to estimate the short-run impact the pandemic will have, these forecasts continue to be updated as new information becomes available. This means that any forecasts that would be provided in this iteration of Community Trends would be outdated by the time it was published. Therefore a qualitative commentary is provided instead: it is clear that COVID-19 will cause significant negative short-run effects on our local economy, leading to lower employment rates as economic activity declines and lower participation rates as individuals who cannot find employment drop out of the labour force; this will no doubt cause a decline in GDP. Finally, the speed at which the economy recovers is also unknown and will be dependant on a variety of factors. It is likely that COVID-19 will prevent a full economic recovery and return to pre-pandemic levels until an effective vaccine or preventative method can be developed and widely distributed. Over the long term, it is possible that the pandemic may have significant long-term implications on both the local and global economy. No matter the case, COVID-19 will have a significant impact but it is too early to speculate until more data becomes available in the coming months. Potential Effect of COVID-19 on City of Winnipeg Regional Economy Variable Potential Effect GDP Growth Temporary Decrease Employment Rate Temporary Decrease Participation Rate Temporary Decrease 21 Source: Government of Canada, Employment Insurance Benefits website. 2020. Canada Emergency Response Benefit Statistics. Data as of May 5, 2020. Website accessed May 7, 2020. 22 Source: Bank of Canada. 2020. Monetary Policy Report, April 2020 30 winnipeg.ca/infrastructure
Financial Trends
The Multi-year Budget
Prior to the City of Winnipeg’s 2020 multi-year budget process, the City had a structural deficit in its
operating budget. A structural deficit is a deficit that results from a persistent and underlying
imbalance between budgetary revenues and expenditures.

At the end of the 2019 budget process, a $105 million operating budget deficit was projected for 2020
and a $132 million deficit was projected for 2021. 23 The 2020 multi-year budget process eliminated
these deficits and balanced the budget such that operating expenditures would equal operating
revenues for 2020 through to 2023. The 2020 multi-year process balanced the budget primarily
through expenditure management and reduction, both in day-to-day operating costs and in reduced
amounts of operating funds going towards the capital budget (cash to capital).

The graph at the bottom of this page shows the compound annual growth rate of operating budgets
by department net of capital-related expenditures from 2015 to 2019, and compares it to the 2019 to
2023 compound annual growth rate resulting from the multi-year process. 24 Every major department,
with the exception of Community Services and Property, Planning, and Development, is anticipated to
experience a lower compound annual growth rate in their operating budget over the next five years.

     Compound Annual Growth Rate in Operating Budgets Net of
     Capital-related Expenditures,
     Before and After Multi-year Budget *
                                                   2015 to 2019         2019 to 2023
     8%
            6.5%
     6%                  4.8%
                                      3.5%        3.4%
     4%                                                          2.9%          2.7% 2.5%
                                          2.1%            2.0%                              2.4%
                                                                                                               1.7%
     2%                                                                                         0.7%       0.7%           0.3%
     0%

     -2%
                                                                    -2.1%                                             -2.0%
     -4%        -2.5%                                 †
                              -3.0%                                                                    †
             Utilities   All Other       Fire      Police         SOAs          Transit    Public Works     Comm.       PP&D
                          Depts.      Paramedic    Service                                                  Servs.
                                       Service

Source: City of Winnipeg Tax-Supported Operating Budgets (Adopted), 2009 to 2020 (including projections).
* Note: Operating Budgets exclude all capital-related expenditures including transfer to capital, transfer to
regional and local street reserve, frontage levies, dividend transfers, and debt and finance charges.
† Note: Public Works expenditures exclude transfers to regional and local street reserve, and frontage levies.

23
  Source: City of Winnipeg, 2019 Adopted Budget, Operating and Capital, pg. 3-3.
24
  Source: City of Winnipeg Adopted Budgets. For the purposes of this chart, departmental operating budgets exclude all
capital-related expenditures including transfers to capital, local and regional street renewal, frontage levy, and debt and
finance charges.

31         winnipeg.ca/infrastructure
Similarly, cash to capital has also been constrained for the foreseeable future, reducing the amount of
tax-supported operating funds devoted to capital projects as seen in the graphs below, but this
reduction in cash has been partially offset with an increase in debt financing.
Cash to Capital History and Forecast
2000 to 2027
$90
Millions
$80
$70
$60
$50
$40
$30
$20
$10
$0
2000
2001
2002
2003
2004
2005
2006
2007
2008
2009
2010
2011
2012
2013
2014
2015
2016
2017
2018
2019
2020
2021f
2022f
2023f
2024f
2025f
2026f
While the multi-year process has enabled the City of Winnipeg to achieve a balanced tax-supported
operating budget over a four-year cycle until 2023, in its original form this was achieved by carrying
over budgetary surpluses in 2020 and 2021 to fill the gap caused by budgetary deficits in 2022 and
2023. Therefore, beginning in 2024, the budget cycle will begin with an estimated $22.6 million deficit,
though budgetary adjustments between now and then could alter this value.
Tax Supported Operating Budget Projections - 2020 to 2030
Expenditures - Historical Averages Adopted Budget
Expenditures - Current Targets in Maintained Revenue Forecast
$1,650 Source: City of Winnipeg calculations.
Millions
$1,550
$1,450
$1,350
$1,250
$1,150
$1,050
$950
$850
$750
2008 2010 2012 2014 2016 2018 2020 2022 2024 2026 2028 2030
Source: City of Winnipeg calculations
32 winnipeg.ca/infrastructureThe chart above shows the historical tax-supported operating budget, and forecasts the revenue (dotted blue line) until 2030. Two expenditure scenarios are also provided: the solid red line shows how expenditures may grow on the assumption that the current budgetary targets set in the 2020 budget cycle are maintained through to 2030, and the dotted red line shows how expenditures may grow if those targets are relaxed beginning in 2024 and historical average growth rates are allowed to resume. If the current budgetary targets are maintained until 2030, the tax-supported operating deficit is estimated to be approximately $20.9 million at the end of the decade. If the historical average growth rates resume in 2024, the deficit is anticipated to be $93.8 million by 2030. These projections are made on the assumption that revenue will continue to grow at current rates and property tax increases will remain at 2.33 per cent per year. The Impact of COVID-19 on Municipal Finances The multi-year budget was developed and adopted prior to the COVID-19 outbreak in Canada. In general, the establishment of a balanced four-year budget required careful and prudent financial planning, along with carrying over surplus funds from the first two years to cover budgetary shortfalls in the last two years. The escalation of the pandemic in March of 2020 has had a significant effect on the financial state of municipalities all across Canada. To date, the City of Winnipeg has taken significant measures to help protect its financial position such as ordering a reduction in discretionary spending, temporary lay- offs in certain departments, freezing fleet purchases, instituting a general hiring freeze, advancing the issuance of planned debentures, all while carefully monitoring the short-run impacts COVID-19 will have on both liquidity and the financial stabilization reserve. Measures have also been taken to try and reduce the financial impact COVID-19 will have on local citizens and businesses by allowing property and business taxes to be deferred without penalty for several months for those who may require such assistance. Like many municipalities across Canada, the City of Winnipeg is legally obligated to balance its operating budget each year and cannot run a deficit, which adds additional pressure to municipal finances as any drop in revenue from reduced user fees or non-payment of taxes may need to be met with an near proportional reduction in expenditure. As of March 31, 2020, the City of Winnipeg anticipates a projected shortfall in consolidated revenue of $53.8 million as a result of COVID-19. 25 This includes a projected deficit of $25.8 million in the tax- supported budget from items such as a decline in recreation user fees or law enforcement revenues, and a projected deficit in Transit of $26.1 million from reduced transit ridership and the associated fares. Over the long term, the full extent and implications of COVID-19 are unknown as there are too many uncertainties at this time. Consequently, COVID-19 may have an impact on the position of the multi- year budget and measures may need to be taken to restore balance. 25 Source: City of Winnipeg June 12, 2020 Standing Policy Committee on Finance Agenda. Agenda Item No. 5, Financial Status and Forecast Report to March 31, 2020. 33 winnipeg.ca/infrastructure
You can also read