Brighton & Hove City Snapshot - Summary of Statistics 2014 - Compiled by the Corporate Policy and Research Team at Brighton & Hove City Council
←
→
Page content transcription
If your browser does not render page correctly, please read the page content below
Brighton & Hove City Snapshot
Summary of Statistics 2014

Compiled by the Corporate Policy and            Brighton & Hove
Research Team at Brighton & Hove City Council   Connected

Brighton & Hove City Snapshot – Summary of Statistics 2014

About this                                                                                                Our population
summary report                                                                                            Our population has grown. In the 2011 census
                                                                                                          the resident population of Brighton & Hove was
This summary report aims to provide an accessible
                                                                                                          estimated at 273,369 people, an increase of 25,552
overview of our city, its characteristics and key
                                                                                                          since the 2001 census. The latest estimate, for 2012,
issues for our residents. It draws on a wealth of
                                                                                                          is 275,800 residents with further growth projections
information from different sources. This is the
                                                                                                          of 5.1 per cent by 2021, which would take the
statistical evidence on which our plans are based.
                                                                                                          resident population to 289,900.
A full report is available which provides more detail
                                                                                                          Our city has an unusual age distribution
about the issues and also references all the sources
                                                                                                          compared to both the national and regional
used so that readers can investigate topics in more
                                                                                                          profiles: we have fewer children and old residents,
depth. This summary aims to provide a snapshot of
                                                                                                          but a clear swell in the proportion of adults aged
the big picture.
                                                                                                          20-44 years.
                                                                                                          There is a substantial student population in
About our city                                                                                            the city; at the time of the 2011 census full time
From a tiny fishing village, called Bristelmestune in                                                     students aged over 16 years accounted for 14 per
the Domesday Book of 1086, Brighton & Hove has                                                            cent of the population living in the city (32,920).
grown to be a fashionable destination and home to                                                         The average proportion of the population who are
more than a quarter of a million people. Located on                                                       students is eight per cent in the South East and
the south east coast of England and bound by the                                                          England. Our two universities have 34,678 students
South Downs National Park to the north, our city                                                          registered studying full or part-time, with just over
has an extraordinary mix of natural and manmade                                                           a fifth of these originating outside of the UK.
assets. Our city is renowned for its vibrancy, culture                                                    We also host a large number of short-stay foreign
of tolerance, its independent shops and businesses,                                                       students attending one of the many language
historic lanes, array of pubs, clubs and restaurants,                                                     schools in the city.
its varied festivals and events, stunning architecture
and 13 kilometres of coastline.

   Age Profile, 2011 census
  10%                                                                                                                                                                             Brighton & Hove
                                                                                                                                                                                  South East
    8%                                                                                                                                                                            England
    6%
    4%
    2%
    0%
           0 to 4

                    5 to 9

                             10 to 14

                                        15 to 19

                                                   20 to 24

                                                              25 to 29

                                                                         30 to 34

                                                                                    35 to 39

                                                                                               40 to 44

                                                                                                          45 to 49

                                                                                                                     50 to 54

                                                                                                                                55 to 59

                                                                                                                                           60 to 64

                                                                                                                                                      65 to 69

                                                                                                                                                                 70 to 74

                                                                                                                                                                            75 to 79

                                                                                                                                                                                       80 to 84

                                                                                                                                                                                                  85 to 89

                                                                                                                                                                                                             90 plus

         Age range
                                                                                                          1
Brighton & Hove City Snapshot – Summary of Statistics 2014

The 2011 census estimated that 84 per cent of
our city’s usual residents were born in the UK
                                                               Our neighbourhoods
and 16 per cent were non-UK born. Over half                    Brighton & Hove consists of 21 wards. Eight
(54 per cent) of our non-UK born residents arrived in          wards have seafront boundaries and ten wards have
the UK between 2001 and 2011. Of those 23,186                  areas within and/or share a boundary with the South
non-UK born residents who arrived in the UK                    Downs National Park. Rottingdean Coastal shares a
between 2001 and 2011, Europeans accounted for                 boundary with both.
50 per cent.
                                                               Residents have a high level of satisfaction with
Brighton & Hove has the smallest household                     their local neighbourhood. More than nine out of
size in the South East. However, our average                   ten residents (92 per cent) are very or fairly satisfied
household size has increased from 2.1 (in 2001)                with their local area as a place to live; this compares
to 2.2 (in 2011), and is therefore getting closer to           to a Great Britain average of 85 per cent.
the 2.4 average household size found in both the
South East and England.                                        One in five residents is dissatisfied with road
                                                               safety in their street. Dissatisfaction is highest
Over a third, 36 per cent, of our households                   among parents (25 per cent).
(44,294) comprise only one person, compared to
30 per cent nationally. This is driven by the relatively       Residents from different backgrounds get on
high proportion of single person households where              well together. More than nine out of ten residents
the occupant is aged under 65.                                 (92 per cent) agree that their local area is a place
                                                               where people from different backgrounds get on
                                                               well together.
                                                               Residents treat each other with respect and
                                                               consideration. Just under one in five residents
                                                               (18 per cent) think, in their local area, people not
                                                               treating each other with respect and consideration is
                                                               a problem.

                                                           2
Brighton & Hove City Snapshot – Summary of Statistics 2014

Brighton & Hove has some of the highest
population density levels in the South East.
                                                         Our diversity
Brighton and Hove has a population density               We have an even gender balance, with
of 33.1 persons per hectare, seven times higher than     50 per cent males and 50 per cent females.
that for the South East (4.5 persons per hectare).
                                                         Our city had the highest number of people
At 315 persons per hectare, the most densely             in same-sex civil partnerships at the time of
populated neighbourhood in the city is the area          the 2011 census, with 2,346 residents aged over
between Western Road and Lansdowne Road in               16, or one per cent, reporting living in a same-sex
Hove, bounded by York Road to the east and by            civil partnership. This is five times higher than the
Lansdowne Street to the west. This area is also the      proportion found in both the South East (0.2 per
most densely populated area in the South East.           cent) and England (0.2 per cent). Our best estimate
                                                         of the number of lesbian, gay and bisexual residents
In terms of who lives where:
                                                         is 11-15 per cent of the population aged 16 or
• BME communities are generally concentrated in         more. It’s difficult to accurately gauge how many
   neighbourhoods in the city centre                     residents are lesbian, gay or bisexual as there is no
                                                         census of the city’s residents where a question about
• The student population is generally concentrated      sexual orientation is asked and good practice is to
  in wards adjacent to the Lewes Road                    provide respondents to surveys with a choice of
• Families are predominantly found to the east and      whether to state their sexuality.
   north of the city                                     We have very little information about transgender
• Single person households tend to be in the city       residents in the city, although work is underway to
   centre coastal wards.                                 address this.
                                                         Brighton & Hove’s Black & Minority Ethnic
                                                         (BME) population is increasing. At the time of
                                                         the 2001 census 12 per cent of our city’s population
                                                         (29,683 people) were from a BME background
                                                         (defined as anyone who is not White UK/British). By
                                                         the 2011 census 20 per cent were (53,351 people).

  Brighton & Hove bme population as a proportion of the total population
                                                                                                         19.5%
     All Black & Minority Ethnic Groups                                                                  12%
                           Other White                           7.1%
                                                                 4.6%
                                                          4.1%
                  Asian / Asian British                   2.4%
         Mixed / multiple ethnic group                  3.8%
                                                        1.9%
                                                 1.5%
   Black/African/Caribbean/Black British         0.8%
                                                 1.4%                                  2011
                             White Irish         1.6%
                                              0.8%                                     2001
                                  *Arab
               *Gypsy or Irish Traveller      0.1%                              Source: 2011 and 2001 Census
                                              0.7%                             * not recorded by the
               Any other ethnic group         0.6%                                2001 Census

                                                         3
Brighton & Hove City Snapshot – Summary of Statistics 2014

The largest increase in the number of people in an
ethnic category is in the Other White category. The
                                                             Our older people
number of people in this category has risen by 8,041         Brighton & Hove has a lower proportion of
people to 19,524.                                            older people - defined here as aged 65 years
                                                             or over - than either the regional or national
For one in 12 residents (21,833 or 8.3 per cent)
                                                             average. It is only at 90 years or above that we
aged over three years English is not their main              align with these averages. The number of older
or preferred language. Arabic is the most widely             people has declined over the last 12 or so years
spoken language in the city after English, with 0.8          from 40,450 people in the 2001 census to 35,692
per cent of residents (2,226 people) using it as their       people as of the 2011 census, a decrease of 12
main or preferred language.                                  per cent. However, according to 2012 population
One in six residents (44,569 people or 16.3                  estimates, older people still comprise a significant
per cent) is disabled or has a long term health              minority of our community, accounting for 13.3 per
problem that limits their day-to-day activities              cent (36,684 people) of all residents, and predicted
to some degree.                                              to increase to 13.8 per cent (39,982 people) by
                                                             2021, at which point approximately 7,200 of these
Recent data indicates that, for every 1,000                  residents will be aged 85 years or more.
residents (aged 18-64), about four of them
are known by the Local Authority to have a                   Of the 121,540 households in Brighton & Hove,
learning impairment. This is on a par with the               12 per cent (14,468 households) are occupied by
England average.                                             people aged 65 years or more, who live alone.

More than two out of five city residents (42                 Older people are more likely to feel unsafe after
per cent) stated that they had no religion in                dark. While only one per cent of older people feel fairly
response to the 2011 census, significantly higher            or very unsafe in their local area and the city centre
than in the South East (28 per cent) and England (25         during the day, a quarter of older people (24 per cent)
per cent) and an increase on 27 per cent recorded            feel unsafe in the local area after dark and half (52
in 2001. The largest religious group is Christian at         per cent) feel unsafe in the city centre after dark. This
43 per cent. Muslims are the largest non-Christian           compares to only nine per cent of 18 to 44 year olds
religious group in the city at two per cent.                 feeling unsafe in their local area after dark and 17 per
                                                             cent feeling unsafe in the city centre after dark.

                                                         4
Brighton & Hove City Snapshot – Summary of Statistics 2014

In their own home older people feel safe with                Around nine per cent of people aged 65 or
99 per cent feeling very or fairly safe during the day       over were thought to suffer with some form
and 98 per cent feeling very or fairly safe after dark.      of depression in 2012. Over 3,000 older people
                                                             in our city are thought to live with depression and
In the 65 years plus age group over half of                  around 1,000 of these are thought to have severe
residents (54 per cent or 19,158 people) report              depression. These numbers are projected to rise to
finding their day-to-day activities limited either           3,400 older people with depression, with 1,100
a little (26.8 per cent) or a lot (26.9 per cent).           with severe depression by 2020.
This is similar to the picture in England (53 per cent
limited a little or a lot) but slightly higher than in the
South East (50 per cent).
Predictably, need for health services increases
                                                             Our children and
broadly in line with age, and those aged 65                  young people
years or more were more likely than any other                Our city has proportionally fewer children
age group to have used either their GP or their              and young people aged under 19 years
local NHS hospital in the previous year. They                (21 per cent) than the regional and national
were also the age group most satisfied with these
                                                             averages (24 per cent each). The latest available
services, with 70 per cent satisfied with the GP
                                                             data estimated that in 2012 we had 58,600
(compared to 56 per cent on average) and 58 per
                                                             children and young people living in our city. The
cent satisfied with their local hospital (compared to
                                                             number of children and young people living here is
42 per cent on average).
                                                             predicted to reach 62,000 by 2021, an increase of
It’s estimated that, in 2013, around 3,000                   approximately 5.8 per cent over the 2012 figure,
people aged 65 years or more in Brighton                     however the proportion is predicted to remain
& Hove lived with dementia. The number is                    static at 21 per cent.
predicted to increase to 3,900 older people living           The 2011 census estimates that a quarter
with dementia by 2030. In 2012 dementia was the              (29,809) of the city’s households have one or
main cause of death for 113 people, approximately
                                                             more dependant children living in them.
five per cent of all deaths.

                                                             5
Brighton & Hove City Snapshot – Summary of Statistics 2014

Twenty two per cent (13,018) of our 0-19 year                 • 361 per 10,000 children in Brighton & Hove were
olds were from BME (non White UK/British)                        identified as being in need compared to 263 per
backgrounds in 2011. However, the incidence of                   10,000 in the South East and 332 per 10,000 in
0-19 year olds across different ethnic groups ranges             England as at 31 March 2013.
widely, so while only seven per cent of our White
                                                              • 331 children were the subject of a child protection
Irish population are 0-19 years old, 50 per cent of
                                                                 plan in 2012/13 and the rate was 66 per 10,000
our Mixed/multiple ethnicity population are.
                                                                 children compared to 37.9 per 10,000 in the
At the time of the most recent (2011) Child                      South East and 46 per 10,000 in England.
Poverty Index, 19.6 per cent of our city’s
                                                              • 445 children were looked after in 2012/13 and
dependant children were living in poverty.
                                                                 the rate was 88 per 10,000 children, compared to
Whilst this is in line with the national average (20.1
                                                                 47 per 10,000 children in the South East and
per cent), it is some way in excess of the regional
                                                                 60 per 10,000 children in England.
average (14.6 per cent). The proportion of children
in the city receiving free school meals is generally
accepted as a proxy for child poverty. Whilst our
city’s percentage in 2013 (16.1 per cent) is similar to
that for England (15.1 per cent), it remains higher
than that for the South East region (10.1 per cent).
We have high rates of children in need, in care
and with child protection plans. A child in need
is one who has been referred to children’s social
care services, and who has been assessed, usually
through an initial assessment, to be in need of social
care services.

                                                          6
Brighton & Hove City Snapshot – Summary of Statistics 2014

Educational attainment at Key Stages 1, 2 and 4 (Years 2, 6 and 11) are above the England
averages in 2013.

Attainment in 2012/13 at Key Stages 1, 2 and 4

                                                      % achieving expected Level 2
                                     Reading                   Writing             Maths
Key Stage 1          Brighton & Hove 90%                       86%                 93%
                     England         89%                       85%                 91%

                                                      % achieving expected Level 4
Key Stage 2          Brighton & Hove                            79%
                     England                                    76%

                                 % achieving 5 or more GCSEs graded A*-C inc. English & Maths
Key Stage 4          Brighton & Hove                      62%
                     England                              60%

The attainment gaps have narrowed at Key Stages 1 and Key Stage 2 but, at Key Stage 4,
the gap has been widening since 2009. Attainment gaps measure the difference in performance
between children eligible for free school meals and those children whose parents/carers are considered
able to pay for school lunches. Closing the gap in educational achievements between less advantaged
pupils and those from more affluent families is a priority.
The attainment gaps in Brighton & Hove are in line with England averages at Key Stage 1, but drift
further from the England averages through the Key Stages.

                                                  7
Brighton & Hove City Snapshot – Summary of Statistics 2014

  Attainment gaps between children eligible for Free School Meals and children not eligible
  in 2012/13 at Key Stages 1, 2 and 4
                                              attainment gap: expected Level 2
                                      Reading            Writing             Maths
  Key Stage 1        Brighton & Hove 12%                 16%                 10%
                     England          12%                15%                 9%

                                                     attainment gap: expected Level 4
  Key Stage 2          Brighton & Hove                           25%
                       England                                   19%

                                  attainment gap: 5 or more GCSEs graded A*-C inc English & Maths
  Key Stage 4          Brighton & Hove                        37%
                       England                                27%

 There were 460 young people not in education, employment or training (NEET) in winter
 2012/13. During November and December 2012 and January 2013, on average 6.7 per cent of the
 city’s young people with the academic age 16 to 18 were NEET.
 According to census 2011 data 3.9 per cent (1,755) of our 0-15 year olds’ day to day
 activities were limited a little or a lot because of a long standing health problem or disability.
 The picture in Brighton & Hove is similar to the picture in the South East and England, where 3.6 per
 cent and 3.7 per cent of 0-15 year olds day to day activities were limited. In 2013, 3.2 per cent (1,420)
 of our 0-15 year olds were in receipt of Disability Living Allowance. This is a slightly higher proportion
 than in the South East (2.9 per cent) and in England (3.0 per cent).

                                                     8
Brighton & Hove City Snapshot – Summary of Statistics 2014
A relatively high proportion of our pupils In 2012, 85 per cent of students aged 11-14
have Special Educational Needs (SEN). In 2013, years reported that they had never tried
20 per cent of pupils (7,213) had SEN without a cigarette.
statements, compared to 16 per cent in England
and 16.3 per cent in the South East. Also in 2012, the majority, 80 per cent, of
students aged 14-16 years reported that they
Results from the Brighton & Hove Safe and had not had sex.
Well at School Survey 2012 show that there
has been a significant fall in the proportion of The majority of 11-14 year olds (65 per cent)
pupils saying they have been bullied, from and the minority (21 per cent) of 14-16 year
26 per cent in 2005 to 14 per cent in 2012. olds have never tried a whole alcoholic drink.
The most common type of bullying experienced by Whilst 66 per cent of 14-16 year olds said they did
11-16 year olds was verbal bullying (name calling / not drink alcohol in the previous week, 38 per cent
teasing) and the most commonly perceived reason of those who had ever drunk alcohol said they ‘drink
for being bullied was to do with appearance. to get drunk’ often or every time they drink. This is
an increase on 23 per cent in 2010.
Over three quarters of pupils, 78 per cent,
reported that they enjoyed coming to school. Just over three quarters of 14-16 year olds
Levels of happiness, anxiety, enjoying coming (77 per cent) said they had never taken
to school and thinking that ‘my school helps non-prescribed drugs in response to the
me to get on with others including people from 2012 Safe and Well at School survey, although
different religious and cultural backgrounds’ are all 18 per cent had tried Cannabis.
significantly associated with age, with older age Teenage conception rates in the city are below
groups reporting lower emotional well-being. the national average, although still above the
Proportionally fewer of our four and five year regional average. In 2011 we had 29 teenage
olds are obese compared with the South East conceptions per 1,000 teenage girls aged 15-17
and England. In 2012/13, 7.4 per cent of reception years, compared to 31 per 1,000 girls nationally and
year pupils were obese, significantly better than in 26 per 1,000 in the South East region.
England (9.3 per cent) but similar to the South East
(7.9 per cent).
9Brighton & Hove City Snapshot – Summary of Statistics 2014
There were 543 young carers in the city Twenty-nine per cent (8,637) of our 29,809
aged up to 16 years according to the 2011 households with dependant children are
census. Young carers provide care, assistance lone-parent households. This marks a significant
or support to another family member, friend or increase compared to 2001 (an additional 24 per
neighbour. The vast majority of young carers in cent or 1,674 households). Proportionally, the
Brighton & Hove, 84 per cent (456 young people), number of lone-parent households in the city is
provided care for between one and 19 hours a similar to that found in the South East and England.
week. Ten per cent (53 young people) provided care A high percentage of our children (73 per cent,
for between 20 and 49 hours a week and six per 7,150 children) who are living in poverty live in
cent (34 young people) provided care for 50 or lone-parent families, which are largely (88 per cent)
more hours per week. headed by women. And the majority (78 per cent)
of all families living in poverty are not in work.
There were comparatively few first time
entrants to the criminal justice system in
2012/13, and the trend is decreasing. In 2012/13
there were 81 first time entrants to the criminal Our health and
justice system aged between 10 and 17 years old.
This marks a significant reduction from a high of wellbeing
252 in 2008/09. The rate per 100,000 was 382, Male life expectancy in Brighton & Hove is
compared to 446 in the South East and slightly lower than the national average and
514 nationally. female life expectancy is the same as the
national average. Life expectancy tells us how
long a baby born today would be expected to live if
Our families they experienced the current mortality rates of the
area they were born in throughout their lifetime.
The number of families in the city has In 2010-12 a female living in our city could expect
increased. In 2011 there were 29,809 households to live to be 83 years; males could expect to live
in the city with one or more dependant child, an 78 years and 36 weeks, compared to 79 years and
increase of nearly 4,000 since 2001. ten weeks nationally.
10Brighton & Hove City Snapshot – Summary of Statistics 2014
Mortality rates (death rates) for the most For more than one in twenty residents
common causes of death are higher in our (20,445 people, seven per cent) their day to
city than in the region. The commonest causes day activities are ‘limited a lot’ due to a long
of death within the city are cancers, circulatory term health problem or being disabled. For a
diseases, respiratory diseases and digestive diseases further 24,124 residents (nine per cent) their day
(including liver diseases). In 2012 there were a total to day activity is limited a little. This is similar to the
of 2,137 deaths of Brighton & Hove residents. The proportions found in the South East and England.
main causes of death were cancer (31 per cent),
followed by circulatory conditions (27 per cent), Nearly one in ten residents (23,987 people,
respiratory conditions (12 per cent). However one in 8.8 per cent) provided unpaid care to a family
twenty deaths in the city was not caused by disease member, friend or neighbour who had either
– these are predominantly accidents or suicide. a long term illness or impairment or problems
related to old age at the time of the 2011
There is a clear relationship between life census. Some 4,716 people, nearly two per cent of
expectancy and deprivation; the higher the the total population, provide more than 50 hours a
deprivation, the lower the life expectancy. In week of unpaid care.
Brighton & Hove this means that males living in the
most deprived areas of the city can expect to live ten We have a large number of people with mental
years and 31 weeks less than males living in the least health needs together with a large number
deprived areas. For females the difference is six years of people at increased risk of mental health
and 31 weeks. problems. This is true for both common problems
• Coronary heart disease, lung cancer, chronic and severe mental illness. Regarding severe mental
cirrhosis of the liver, suicide and undetermined illness, the city has a higher prevalence of people
injury and other accidents are the major (1.1 per cent) on a GP register for psychoses or
contributors to the gap in life expectancy between severe mental illness than England (0.8 per cent). In
the most and least deprived areas for men. 2011/12, 3,335 people (all ages) were included on
these registers. Regarding common mental health
• Coronary heart disease and other cardiovascular
problems, in 2011/12, 13 per cent of people aged
diseases are the biggest contributors to the
18 years or over (31,044 adults) were included on
life expectancy gap for women, followed by
a GP register for depression; the figure for England
lung cancer, other cancers and suicide and
was 12 per cent.
undetermined injury.
Provision of unpaid care in Brighton & Hove, 2011 census
Number of people % of total population
All persons providing unpaid care 23,967 8.8%
Provides 1 to 19 hours 16,401 16.0%
Provides 20 to 49 hours 2,850 1.0%
Provides 50 or more hours 4,716 1.7%
11Brighton & Hove City Snapshot – Summary of Statistics 2014
We had the tenth highest suicide rate in Our childhood immunisation rate is low.
England between 2009 and 2011 at 11.1 per Brighton & Hove has the second lowest childhood
100,000 members of the population, compared to immunisation uptake rates in the South East Coast
7.9 in England. and was significantly below the national average on
all the immunisation indicators in the Public Health
Between 2006 and 2008, one in five or 20 per Outcomes Framework in 2010/11 and 2011/12.
cent of adults in the city were estimated to be However in 2012/13 MMR immunisation uptake
obese with a Body Mass Index of 35 or more rates were similar to England and HPV significantly
compared to the England average of 24 per cent. above England.
We have a similar incidence of all cancers to the Looking at 25 key alcohol related harm health
England average. For every 100,000 members of indicators, our city performed significantly worse
the population 388 of our residents were diagnosed than the national average for 14 of them in
with cancer between 2008 and 2010 compared to 2012. We performed better than the national average
387 in England. But the mortality rate from all cancers on only one measure; mortality from land transport
in under 75 year olds between 2008 and 2010 was accidents.
higher in Brighton & Hove than in England, at 120
per 100,000 members of the population, compared Male adult deaths that are directly attributable
to 110 in England. The mortality rate from cancer is to alcohol, at 23 per 100,000 members of
higher in more deprived areas and the gap with more the population, were almost double the rate
affluent areas is widening. in England at 13 and more than double the
regional average of ten in 2008-2010. National
We have a very high rate of breast-feeding data reveals that alcohol related deaths are higher in
initiation and continuation. Of our new mothers areas of deprivation.
in 2011/12 86 per cent initiated breast-feeding
compared to the England average of 74 per cent. Most respondents to the 2012 Health Counts
Furthermore, at 6-8 weeks after birth 76 per cent of Survey (60 per cent) had never taken drugs
mothers in Brighton & Hove are still breastfeeding not prescribed to them or not available at a
their babies, compared to the England average of chemist. However, 17 per cent of Brighton & Hove
47 per cent. respondents said they had taken drugs in the last
year compared with nine per cent across England
Breast-feeding rates among new mothers, 2011/12
86%
Initiated
74%
76%
After 6-8 weeks
47%
Brighton & Hove
England
12Brighton & Hove City Snapshot – Summary of Statistics 2014
and Wales. Forty per cent of respondents said they
had ever taken non-prescription drugs.
Our homes
At the time of the 2011 census, only 53 per cent
The Brighton & Hove Substance Misuse (drugs) of our 121,540 households were owner-occupied,
Needs Assessment 2013-14 indicates that there meaning that our city is below-average in this
were 1,582 clients in drug treatment in the city respect when compared to the South East region
during 2012. A third of this client group have been (68 per cent) or to England (63 per cent). A high
in treatment for over four years. proportion of our households (28 per cent or
With 20 deaths, we had the seventh highest 34,081) in fact, the second highest proportion
rate of drug related deaths of all English local outside of London, were in the private rented sector.
authorities in 2011. This was a rate of 8.8 per Half of our city’s housing stock consists of flats,
100,000 people aged 16 or over, falling from a peak maisonettes or apartments, which tend to be a fairly
of 32.6 per 100,000 in 2000 (67 deaths). even mix of purpose-built vs converted properties.
Almost a quarter, 23 per cent, of adults in Our housing is unaffordable for the majority of
the city smoke, significantly higher than the residents. The Council’s Assessment of Affordable
England average (20 per cent). Smoking remains Housing Need Report 2012 has identified that
the main cause of premature illness and preventable almost 88,000 households in Brighton & Hove
death with over a quarter of all cancers attributable (72 per cent) cannot afford market housing (either
to tobacco use. to buy or rent) without some form of subsidy or
spending a disproportionate level of their income on
We had the highest rates of common sexually
housing costs.
transmitted infections (Chlamydia, gonorrhoea,
syphilis, herpes and warts) outside of London The minimum household income required to
in 2012. Our rate was 1,837 per 100,000 population afford entry level market housing is £42,000
compared to 804 per 100,000 across England. per annum, against a median household
income of £28,240 and an average household
We had the ninth highest HIV prevalence in
income of £37,000.
England in 2012 at 7.8 per 1,000 people aged
15 to 59 years compared with 2.1 in England, the
highest prevalence outside London.
13Brighton & Hove City Snapshot – Summary of Statistics 2014
Land Registry figures for December 2013 show In 2012, the Brighton & Hove Local Housing
that the average cost of buying a home in the Investment Plan reported that roughly a
city is now £240,948. This is an increase of third – approximately 38,000 homes – of our
5.5 per cent since December 2012. total housing stock did not meet the Decent
Homes standard.
Rental costs in the city increased by 4.3 per cent
between December 2012 – December 2013. To We have a comparatively high proportion of
rent a one bedroom flat costs an average of £811 people who have housing needs. Compared to
per month. The rental cost of rooms, studios and the South East region, during 2012/13 residents in
two bed flats have also seen annual increases of Brighton & Hove were nearly three times as likely
between two and seven per cent. to be in a position where they needed to make a
homeless application and nearly three times as likely
In 2011 approximately 14,500 (12 per cent) of to be accepted as homeless and in priority need.
households in Brighton & Hove were calculated
to be in fuel poverty, slightly above the national In 2012/13 there were a total of 1,267 homeless
level (11 per cent). Fuel poverty is experienced across applications received by the council. Of the
the city but there are particular concentrations in applications received 1,108 proceeded to the point
parts of the city. Rates of fuel poverty range from as of decision and of those, 506 (46 per cent of all
few as 1 in 25 households (four per cent) in parts of decisions, equating to four out of every 1,000
North Portslade to nearly 1 in 5 households (19 per households) were accepted as being unintentionally
cent) in some parts of Patcham. homeless and in priority need.
The energy efficiency of our council housing There were nearly 17,200 households on the
has been improving steadily over the last Housing Register waiting for social housing
decade. Standard Assessment Procedures, also at the beginning of October 2013, an annual
known as SAPs, are the way in which government increase of 19 per cent. The figure reflects the
assesses home energy ratings. Dwellings are rated level of housing need in the city. This compares
from 0 to 100, with 0 being very inefficient and with around an average of only 775 social housing
100 highly efficient. The average SAP rating for our vacancies each year over the last few years, of which
council stock was 61.9 in December 2012 and 62.5 around half tend to be one bed flats.
in April 2013.
Housing tenure, 2011 census
Owned Owned Shared Rented Other Private Other Living
with a social landlord private rent
outright mortgage owner- from
ship council rented or letting rented free
or loan agency
Brighton 23% 30% 1% 10% 5% 28% 2% 1%
& Hove
South East 33% 35% 1% 6% 8% 15% 2% 1%
England 31% 33% 1% 9% 8% 15% 1% 1%
14Brighton & Hove City Snapshot – Summary of Statistics 2014
Rough sleeping remains an issue in the city. principal roads classified as requiring maintenance
Although we saw a dramatic decline in numbers was four per cent, the same as the year before.
from 66 people in March 2001 to just 14 in
Autumn 2010, in recent years the numbers have In 2013 the National Highways and Transport
again risen. At the count in Autumn 2013 there survey found our residents were least satisfied
were 50 rough sleepers. with highway condition closely followed by
traffic levels and congestion. In the same survey
Over the past few years there has been a satisfaction with public transport (buses) was
steady increase in the number of households in ranked the second highest scoring against
temporary accommodation. On 31 March 2013 70 other authorities.
the number of households staying in temporary
accommodation was 1,064, compared to 498 on At the time of the 2011 census, car and van
31 March 2008. ownership was relatively low, with almost
two out of five households (38.2 per cent) not
owning a car or van. The total number of cars
and vans increased by 4,348 to 104,397 between
Our transport & the 2001 and 2011 censuses. However, due to an
infrastructure increase in the number of households we now have
an average of 0.86 cars per household compared to
Our city is a regional transport hub with 0.87 in 2001.
good road and rail links to London and to
Less than two out of five Brighton & Hove
adjoining cities and towns along the
residents (37.2 per cent) drove a car to work at
south coast, London Gatwick and London City
the time of the 2011 census. This is considerably
airports, as well as the two ports of Shoreham
less than in the South East (60.8 per cent) and in
and Newhaven.
England (57.0 per cent). Brighton & Hove now ranks
In 2012/13 highway condition surveys second in the South East for the percentage of
indicated that seven per cent of our A roads people who travel to work by bus, minibus or coach.
were in the category of ‘maintenance should Almost double the national and regional averages
be considered’ showing a slight deterioration from of residents walk to work in our city, and we have
six per cent the year before. The proportion of non comparatively high cycling to work rates.
15Brighton & Hove City Snapshot – Summary of Statistics 2014
Managing demand for parking within the city
with an increasing population and over eight
Our community safety
million people visiting the city each year is a The number of crimes per resident, our crime
significant challenge. There are 16 controlled rate, was higher than the England and Wales
parking zones covering over 750 streets and 11 average but just below the average rate
off-street car parks in the city. experienced by our city’s peers in 2012/13. The
total number of crimes per 1,000 residents was 86,
Road vehicles were the greatest contributing compared to 66 in England and Wales.
factor to poor air quality in Brighton & Hove in
2010 with the main pollutants being Nitrogen In 2012/13 there were 23,602 crimes recorded
Dioxide and particulates (PM10). by the police in Brighton & Hove, although not
all crimes are reported to the police. The table
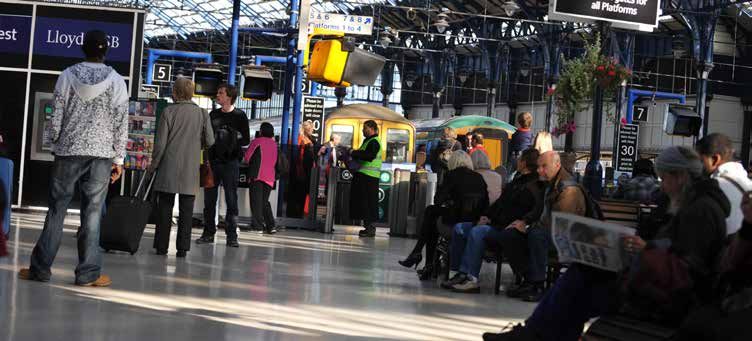
We have three rail lines which terminate on page 17 shows how total recorded crime breaks
at Brighton station, and eight rail stations in down to different crime groups.
the city. The total number of visits to all of our
stations was 22,137,906 in 2012 of which the
majority occurred at Brighton station, making it the
busiest station on the south coast between Kent and
Hampshire.
We have in the region of 19,000 street lights
of all different types and ages. Street lighting
accounts for around 20 per cent of Local Authority
energy consumption at the national level.
There were five fatalities on our roads in 2012,
one less than recorded in 2011 and 155 serious
casualties on the road, compared to 166 in 2011.
16Brighton & Hove City Snapshot – Summary of Statistics 2014
Police recorded total crime breakdown: In 2012/13, around a third (34 per cent) of
April 2012 to March 2013 assault patients attending Accident and
Emergency were not resident within our
Type of crime number % of all
city. Most violence against the person crimes are
crime
committed in central Brighton, which has the
Theft excluding vehicle 9,825 41% highest density of licensed premises and is the focal
Violence against the 4,150 18% point of the night-time economy.
person
Crimes of robbery were much fewer in
Criminal damage 3,005 13%
number in 2012/13 than in previous years at
Burglary 2,051 9% 257, accounting for just one per cent of our
Vehicle crime 1,739 7% crimes, and the trend in recent years has
Drug offences 1,231 5% been downwards.
Sexual offences 373 2% There were 373 sexual offences reported to
Robbery 257 1% the police in 2012/13, but we know this type
Other 971 4% of crime often goes unreported. In fact, using
national estimates about the level of under-reporting
Total police recorded 23,602
and 2011 census data, it is estimated that in the last
crime
year 2,953 women aged between 16 and 59 will
have experienced sexual assault in our city.
The number of violence against the person Domestic violence is also known to be
crimes has been reducing since 2006/07. under-reported, but even so, there were over
In 2012/13 there were 4,150 reported crimes, 3,400 crimes and incidents recorded by our
accounting for just less than a fifth of all crimes police in 2012/13. Domestic violence is defined
in our city. Our city has a poorer violence against as ‘any incident or threatening behaviour, violence
the person crime rate (12.8) per 1,000 resident or abuse between adults who are, or have been,
population than the England and Wales average intimate partners or family members, regardless of
(10.6), but is roughly the same as the average of gender or sexuality’.
our crime risk peers.
17Brighton & Hove City Snapshot – Summary of Statistics 2014
The police recorded 164 racist and seven Criminal damage is one of the most prolific
religiously motivated hate incidents and crimes types of crimes. However, following a long term
in 2012/13. increase up to 2006/07, offences recorded by the
police have declined steeply from 6,155 crimes in
In response to a local survey conducted with 2006/07 to 2,735 in 2013/14. The highest density
the lesbian, gay, bisexual and transgender of criminal damage offences was in the city centre.
community in 2012, 23 per cent of respondents Criminal damage is costly on account of the high
reported they had experienced a hate incident numbers of offences.
or crime due to their sexual or gender identity
in the past 12 months. People tend to feel less safe in the city centre
than they do in their local area, especially
The number of vehicle crimes per head in after dark. City Tracker survey respondents’ overall
2012/13 was on a par with the average in feelings of safety during the daytime were broadly
England and Wales as a whole. There were seven similar; 96 per cent or more said they felt very or
vehicle crimes per 1,000 members of the population fairly safe in their local area or outside in the city
in both Brighton & Hove and England and Wales. centre during the daytime in 2013. However, the
Compared to our peers we’re slightly better than proportion decreased to 80 per cent feeling very or
average. There are more vehicle crimes in the city fairly safe in their local area after dark (compared to
centre where parking is denser and there are fewer 77 per cent at the GB level) and to 63 per cent in
options for off-street residential parking. the city centre.
In terms of domestic burglaries per number of
residents, Brighton & Hove was in line with Our environment
England and Wales levels in 2012/13. There Climate projections are telling us that we will
were four domestic burglaries per 1,000 residents, experience hotter drier summers, warmer
as there were for England and Wales. Areas with a wetter winters, and disruption in usual
higher density of domestic burglaries were Seven weather patterns and more frequent or intense
Dials, Brunswick and Montpelier, as well as Central weather events (e.g. heat waves, droughts,
Hove, Kemp Town, Roundhill, London Road and the storms, sea surges and flooding) and continued
Triangle areas. rising sea levels.
NO. of police recorded instances of criminal damage in Brighton & Hove
7000
6000
Recorded Crime
5000
4000
3000
2000
2006/07 2007/08 2008/09 2009/10 2010/11 2011/12 2012/13 2013/14
Year
18Brighton & Hove City Snapshot – Summary of Statistics 2014
By 2011 Carbon Dioxide (CO2) emissions per use and leaking sewers. Our drinking water goes
resident from energy and fuel consumption through extensive treatment processes before it
have reduced by 23.2 per cent since 2005, when reaches our taps to ensure it is clean and safe.
a new baseline was set for CO2 emissions in
There has been a considerable improvement in
each local authority area.
the quality of bathing water along our coast
Monitoring at city centre roadside sites over the last 20 years. In October 2013, according
strongly suggests that Nitrogen Dioxide to the most recent weekly classification, all four of
(NO2) concentrations have not improved at our beaches which are monitored were rated ‘higher
these locations in the past ten years. However standard’. This is the highest classification for bathing
continuous analysis of outdoor air indicates a long water quality. The beaches assessed are Saltdean,
term improvement in Nitrogen Dioxide outside of Brighton Kemptown, Brighton Central and Hove.
the Air Quality Management Area, which is most of
Household waste collected that is not sent
the city.
for reuse, recycling or composting increased
There are 910 properties in the city at risk of slightly in 2012/13 to 590.9kg per household,
flooding from the sea. This is 0.6 per cent of a 1.7 per cent increase compared to the
the total properties (136,893 residential and 9,605 previous year. However this is still 4.3 per cent
commercial) in the city. The majority of properties at lower than the five year high seen in 2009/10 of
risk can be found within Brighton Marina, and the 617.4 Kg per household.
coastal flood risk is quite low.
Our total recycling and composting rate in
The South East region is considered to 2012/13 was 26.8 per cent compared against
be water-stressed and locally our area is the national average of 41.6 per cent.
vulnerable to short term drought events. This is
because the city is supplied entirely by chalk aquifer Sites of Special Scientific Interest are the
groundwater sources. The current assessment country’s very best wildlife and geological sites
of quantity is poor due to the amount of water and we have two within the city (Marina to
abstracted. The quality is good, however at ‘risk Newhaven Cliffs and Castle Hill). These are rated
of deterioration’ largely as a result of nitrate and as being in ‘favourable condition’ which means that
pesticide contamination through farm practices, the land is being adequately conserved for their
but also highway, municipal and domestic pesticide special qualities.
19Brighton & Hove City Snapshot – Summary of Statistics 2014
We have eight Local Nature Reserves spanning
8.2 per cent of the land within the city. These
Our culture and leisure
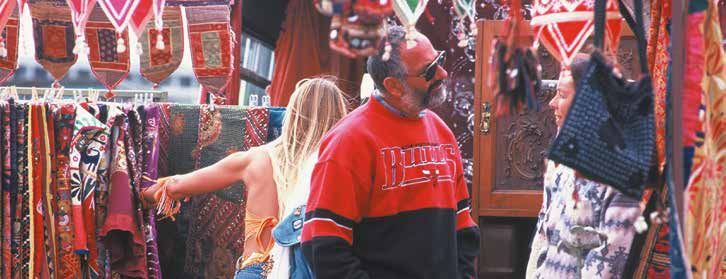
are important areas for wildlife, geology, education Brighton & Hove attracted some eight and
or public enjoyment and provide access to the a half million visitors in 2011, generating
natural environment close to where people live. In significant income for the city. The city’s cultural
addition, we have 62 wildlife sites across the city draw, varied attractions along 13 kilometres of
which are important in a local context and have seafront and its distinctive retail offer attract UK
significant nature conservation value. and overseas visitors alike. In 2011 tourists were
estimated to have spent £696,470,000 in our city,
Beachy Head West, the chalk shelf lying and a further £26,134,000 was estimated to have
offshore between Eastbourne and Brighton been spent by residents hosting friends and relatives
Marina, was designated a Marine Conservation staying here.
Zone in November 2013, one of just 27
nationwide. It contains some of the best examples The Grade 1 listed Royal Pavilion, the Prince
of chalk habitat in the South East region. Here Regent’s ‘pleasure palace’, completed in 1823,
the chalk reefs and gullies support specialised is one of our most distinctive assets, attracting
communities of animals and seaweeds. Additionally, 343,198 visitors in 2012/13. Over nine in ten
the sites are known to support the rare short- visitors, 91 per cent, thought their visit to the Royal
snouted seahorse. Pavilion was excellent or good.
Six of the city’s 36 parks and recreation grounds Our museums; Brighton, Hove, Booth & Preston
of significance in the city were awarded Green Manor, all receive high levels of praise in
Flags in 2013, up from five in 2010. This is in customer satisfaction surveys. The percentages
recognition of their environmental standards and the of visitors who rated their visits as good or excellent
service they provide for their communities. in 2012/13 were:
Booth Museum 84 per cent
Brighton Museum & Art Gallery 75 per cent
Hove Museum 78 per cent
Preston Manor 93 per cent
20Brighton & Hove City Snapshot – Summary of Statistics 2014
Almost half of residents surveyed (49 per cent) accurately the contribution of these events to our
in the annual City Tracker survey in autumn economy but as an example, the Brighton & Hove
2013 said that they had visited a museum in Food and Drink Festival’s Big Sussex Market, over
the last 12 months. Easter 2012 weekend, attracted 57,000 visitors.
Over half of residents surveyed (53 per cent) We have 12 community libraries and a central
in the annual City Tracker said that they had Library for Hove, with the award-winning
attended a creative, artistic, theatrical or Jubilee Library at the heart of the network.
musical event in the last 12 months. Our Jubilee Library is considered the sixth most
successful in the country when judged by visits
The Brighton Dome and Festival reached made to the library in person. In 2012/13 there were
522,057 people in 2012/13. Over 250,000 people 1,702,324 visits to our libraries, with nearly a million
attended ticketed events while thousands more of these visits being to Jubilee.
attended free events, digital streamed events,
conferences and private events or engaged with We have a rich architectural heritage with a
the Dome and Festival via social media. There were high proportion of listed buildings. There are
ticket sales worth £4,335,515. over 3,360 listed buildings in the city, 14 per cent
of which (476) are grade I & II*. This is more than
First held as a low key event in 1973 Brighton double the national average of six per cent.
Pride attracted an estimated 160,000 visitors in
2013. Brighton Pride is an opportunity for lesbian, Satisfaction with our parks and open spaces,
gay, bisexual and transgender people of different including access to the South Downs, is very
ages and backgrounds to come together and for the high; 91 per cent of respondents to the 2013
city to celebrate the diversity of our residents. City Tracker were either very or fairly satisfied.
The 2012 Health Counts survey showed that
Throughout the year we host a variety of just over half the survey population (54 per cent)
outdoor events, ranging from motor rallies reported using parks and open spaces in the city at
on Madeira Drive to harvest food festivals least once a week.
in New Road, to the more quirky Colour Run
and Paddle Round the Pier. It’s difficult to gauge
21Brighton & Hove City Snapshot – Summary of Statistics 2014
We benefit from the South Downs National • Preston Manor grounds, including Preston Park &
Park, one of Britain’s 15 ‘Breathing Spaces’, The Rockery Grade II
and its 1,600 square kilometres of diverse • Woodvale Cemetery Grade II
landscapes and outstanding natural beauty.
There are over 500 sports clubs in the city
Of our 98 parks and public open spaces, six catering for a wide range of sports at all
have green flag awards, and six are listed as levels, from grass roots participation to elite
being of historic interest. competition. During the two week long Takepart
Festival of Sport in 2013 there were 454 events,
Parks with green flag awards are:
showcasing sports clubs and other providers in the
• Easthill Park city, and 60,000 attendances.
• Hove Park The council’s eight leisure centres and two golf
• Preston Park courses attracted approximately 1.5 million
• Kipling Gardens visits in 2012/13. This included 35,000 free swims
• Stoneham Park as part of the Free Swimming Scheme, which has
• St Ann’s Well Gardens been extended to include children aged 12-16 years,
as well as those aged 11 years and under.
Parks of historic interest are:
• Stanmer Park (including the farmland estate & Our business and
Coldean Wood) Grade II
• Kemp Town Enclosures (including Dukes Mound)
enterprise
Grade II Our Gross Value Add (GVA) per head was lower
• Queens Park Grade II than the South East and UK averages in 2012,
• The Royal Pavilion Estate Grade II as it was in 2011. Gross Value Add is a measure
of the value of goods and services produced in an
area on a per person basis. In 2012 the GVA of the
Brighton & Hove economy was £20,712 per head.
This compares to £23,221 across the South East and
£21,674 in the UK overall.
22Brighton & Hove City Snapshot – Summary of Statistics 2014
In 2012 there were 13,563 businesses in the of local GVA, equivalent to around £180m. The
city. Between 2009 and 2012 the business base of Creative, Digital and IT sectors are also significant
the city grew by 295 companies, to reach a total of in the city, and recent research has shown that the
13,563 VAT and PAYE registered companies, and the sector is now worth an estimated £713m to
employment base grew by 6,120 jobs. the economy.
Businesses in the city are, on average, smaller
in terms of employee numbers than the
national average. In fact 86 per cent of our Our employment
businesses were small or micro level, employing less
than ten people in 2010.
and skills
Our city has a strong entrepreneurial culture, Brighton & Hove’s unemployment rate is
reflected by high levels of business start- broadly in line with the Great Britain average
ups compared with other cities. In fact new although higher than the South East rate. For
business formation is the highest on record the period January 2013 to December 2013 our
since 2004, with 1,620 new enterprises unemployment rate, that is, the percentage of
registered in 2012. Per 10,000 people we had the working age population who were not able
58.7 new businesses in 2012. Business deaths have to get a job but who would like to be in full time
risen on the 2011 figure but are lower than the employment was 7.6 per cent (11,200 people),
2009 level, when deaths exceeded births, and lower compared to the Great Britain rate of 7.5 per cent
than 2010. and a South East rate of 5.7 per cent.
A much higher proportion of our GVA comes Overall worklessness, defined as the number
from art and cultural services than in the of people unemployed (aged 16 or over) plus
UK. Around 1.4 per cent of GVA in the city the number of people ‘economically inactive’
(£76,160,000) comes from these services, compared (aged 16 to 64) increased by 800 to 51,600
to 0.4 per cent nationally. International Education people between 2012 and 2013. This represents
and Languages are increasingly important, and have 30 per cent of the working age population in
been estimated to be worth just under 3.5 per cent
23Brighton & Hove City Snapshot – Summary of Statistics 2014
Brighton & Hove, which is in line with the Great We have a large self-employed working
Britain rate of worklessness, although higher than population. In 2011 our self employment rate
the rate in the South East (26 per cent). Economic among 16 to 74 year olds in employment was 19
inactivity is the larger component of worklessness per cent compared to 16 per cent in the South East
relative to unemployment. and 15 per cent in England. Self employment is
highest among those working in construction (55
We had a slightly lower rate of people claiming per cent) and those in professional, scientific and
key out of work benefits than the national rate technical activities (36 per cent).
but a higher rate than the region. In August
2013, 10.3 per cent of residents aged 16 to 64 We have a large part time working population.
(19,990 people) were claiming key out of work In 2011 nearly a third of our working population
benefits compared to 10.9 per cent in Great Britain aged over 16 was working part time (32 per cent)
and 7.6 per cent in the South East. compared to 29 per cent in both the South East and
England. This rises to more than two in five working
Wholesale and retail trade (19,167 people, women (44 per cent) compared to only one in five
14 per cent), human health and social work working men (20 per cent).
(18,799 people, 13 per cent) and education
(17,332 people, 12 per cent) are the industries Residents’ wage levels are not as high as in
employing the greatest number of city the South East, but are higher than in Great
residents. Two out of five (39 per cent) of all Britain. In 2013, the median weekly pre-tax pay for
residents who work are employed in one or other of a full time working resident was £529.10 per week,
these sectors. over £30 a week less than the South East median
of £559.70, but £11 more than the Great Britain
Between 2009 and 2012 the city generated median of £518.10.
a net increase of 6,120 jobs. This represents an
increase of five per cent compared to only one per The median wage of Brighton & Hove residents
cent across both the South East and England. is higher than the median wage of people
There was a net loss of 2,237 public sector jobs working in the city. In 2013 while the median
(9.5 per cent) and a net gain of 8,457 private sector weekly gross pay of a city resident was £529.10 the
jobs (9.1 per cent). median weekly gross pay of an employee working in
Brighton & Hove was £64 lower at £465.40.
24Brighton & Hove City Snapshot – Summary of Statistics 2014
Brighton & Hove residents are well educated There are ten major developments currently
compared to the South East and England. For under construction in the city. These include the
over a third of residents aged 16 and over (84,423, redevelopment of the Gala Bingo Hall in Hove, Park
37 per cent) their highest level of qualification is House on Old Shoreham Road, The Open Market,
Level 4 (NVQ level 4, Higher National Diploma, The former Royal Alexandra Hospital, Site J at
degree or higher degree) or better. This compares Brighton Station, The British Engineerium, William
to 30 per cent in the South East and 27 per cent in Moon Lodge nursing home and a care home on
England. There are also proportionally fewer people Carden Avenue.
in the city with no formal qualifications (16 per cent
36,775 people) compared to the South East (19 per In 2012/13 business floor space in the city
cent) and England (23 per cent). decreased by 8,364 square metres. Despite net
gains in mixed use, the overall floorspace has been
reduced, mainly from changes of use of office space
into residential and non-residential institutions.
Our investment and In 2012/13 there was also a net loss of 1,766
development square metres of retail floorspace but a net
gain of 2,812 square metres of restaurant
In 2012/13 there was a small increase in the
floorspace.
number of planning applications registered
compared to 2011/12, bucking the trend that Residents consistently rate the top priorities for
might be expected in the current financial local authority investment as being education,
climate. The number of applications registered in refuse collection & recycling and children’s
2012/13 was 3,272, a slight increase on the 3,168 social care. Every year when the budget and council
registered in the previous year, but not back to the tax is set, the council asks residents what the local
high level received in 2010/11 of 3,412. authority’s priorities for spending should be. Since
2008 the same priorities have been put forward.
In 2012/13 there were 41 major applications,
defined as applications for residential units
of ten or more homes or for non-residential
floorspace of more than 1,000 square metres.
25Brighton & Hove City Snapshot – Summary of Statistics 2014
Our participation Older people are represented through the
Older People’s Council, an independent body
Half of respondents to the 2013 annual elected every four years by residents who are over
City Tracker survey agreed that they could 60 years. There are nine elected and two co-opted
influence decisions affecting their local area. members who look after the interests of older
people in the city, making sure they are treated with
Over a third, 35 per cent, of respondents to respect and have access to services.
the City Tracker 2013 reported that they had
provided some kind of unpaid help in the last
12 months. Our resilience
The voice of young people across Brighton Our city is a designated high risk flood area.
& Hove is represented through the Brighton & A major area of concern for the city as a coastal
Hove Youth Council and various other community is the possibility of coastal/cliff erosion
specialist groups. The youth council comprises and flooding as a result of heavy rain storms. This
elected and nominated residents aged eleven to can affect water supplies as well as the fresh water
19 years (up to 25 with special needs) who represent and coastal eco-systems.
the diversity of young people in the city, being
drawn from youth groups, schools and colleges Due to our coastal location we are at a
across the city. naturally higher risk of experiencing coastal
pollution. The English Channel is a major
Their top three priority issues are: international transport route for many products,
1) The local environment including oil. One of the risks to Sussex is the
potential for a shipping accident which could cause
2) Improving access, publicity and collaboration of
oil or other hazardous cargo to be released into the
activities for young people
sea and then washed up on the shoreline.
3) Transport
26You can also read