Evaluation of the Precision of Ancestry Inferences in South American Admixed Populations - Frontiers
←
→
Page content transcription
If your browser does not render page correctly, please read the page content below
ORIGINAL RESEARCH
                                                                                                                                                 published: 21 August 2020
                                                                                                                                            doi: 10.3389/fgene.2020.00966

                                              Evaluation of the Precision of
                                              Ancestry Inferences in South
                                              American Admixed Populations
                                              Vania Pereira 1 , Roberta Santangelo 1 , Claus Børsting 1 , Torben Tvedebrink 2 ,
                                              Ana Paula F. Almeida 3 , Elizeu F. Carvalho 3 , Niels Morling 1 and Leonor Gusmão 3,4*
                                              1
                                                Section of Forensic Genetics, Department of Forensic Medicine, Faculty of Health and Medical Sciences, University
                                              of Copenhagen, Copenhagen, Denmark, 2 Department of Mathematical Sciences, Aalborg University, Aalborg, Denmark,
                                              3
                                                DNA Diagnostic Laboratory, State University of Rio de Janeiro, Rio de Janeiro, Brazil, 4 Instituto de Investigação e Inovação
                                              em Saúde, i3S, Institute of Molecular Pathology and Immunology of the University of Porto (IPATIMUP), Porto, Portugal

                                              Ancestry informative markers (AIMs) are used in forensic genetics to infer
                                              biogeographical ancestry (BGA) of individuals and may also have a prominent role
                                              in future police and identification investigations. In the last few years, many studies
                                              have been published reporting new AIM sets. These sets include markers (usually
                                              around 100 or less) selected with different purposes and different population resolutions.
                                              Regardless of the ability of these sets to separate populations from different continents
                            Edited by:
                                              or regions, the uncertainty associated with the estimates provided by these panels and
                     Kenneth K. Kidd,         their capacity to accurately report the different ancestral contributions in individuals of
         Yale University, United States
                                              admixed populations has rarely been investigated. This issue is addressed in this study
                       Reviewed by:
                                              by evaluating different AIM sets. Ancestry inference was carried out in admixed South
                           Rick Kittles,
City of Hope National Medical Center,         American populations, both at population and individual levels. The results of ancestry
                         United States        inferences using AIM sets with different numbers of markers among admixed reference
               Francesco Montinaro,
           University of Tartu, Estonia
                                              populations were compared. To evaluate the performance of the different ancestry
                 *Correspondence:
                                              panels at the individual level, expected and observed estimates among families and
                    Leonor Gusmão             their offspring were compared, considering that (1) the apportionment of ancestry in the
          leonorbgusmao@gmail.com
                                              offspring should be closer to the average ancestry of the parents, and (2) full siblings
                   Specialty section:         should present similar ancestry values. The results obtained illustrate the importance
         This article was submitted to        of having a good balance/compromise between not only the number of markers and
Evolutionary and Population Genetics,
                                              their ability to differentiate ancestral populations, but also a balanced differentiation
               a section of the journal
                  Frontiers in Genetics       among reference groups, to obtain more precise values of genetic ancestry. This work
           Received: 31 May 2020              also highlights the importance of estimating errors associated with the use of a limited
           Accepted: 31 July 2020             number of markers. We demonstrate that although these errors have a moderate effect
         Published: 21 August 2020
                                              at the population level, they may have an important impact at the individual level.
                             Citation:
              Pereira V, Santangelo R,        Considering that many AIM-sets are being described for inferences at the individual
             Børsting C, Tvedebrink T,        level and not at the population level, e.g., in association studies or the determination of
 Almeida APF, Carvalho EF, Morling N
                                              a suspect’s BGA, the results of this work point to the need of a more careful evaluation
    and Gusmão L (2020) Evaluation
          of the Precision of Ancestry        of the uncertainty associated with the ancestry estimates in admixed populations, when
       Inferences in South American           small AIM-sets are used.
                Admixed Populations.
                Front. Genet. 11:966.         Keywords: population stratification, ancestry informative marker, Brazil, biogeographical ancestry, population
     doi: 10.3389/fgene.2020.00966            assignment

Frontiers in Genetics | www.frontiersin.org                                           1                                               August 2020 | Volume 11 | Article 966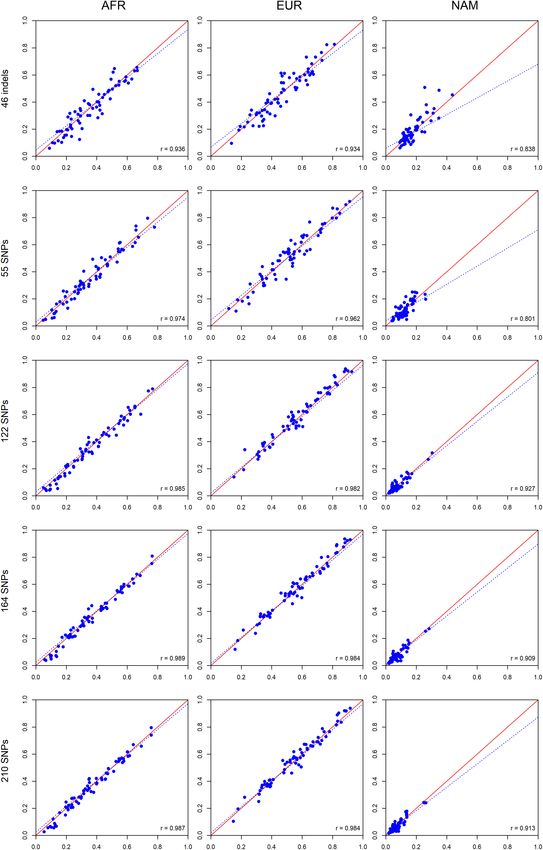
Pereira et al.                                                                                              Ancestry Inferences in Admixed Populations

INTRODUCTION                                                                  of origin using few markers can be highly influenced by the
                                                                              correct definition of contributing or reference populations. The
Patterns of human genetic variation have been thoroughly                      AIMs in use have always some degree of error associated
investigated to unveil past events and disclose historical affinities         when performing ancestry assignments, and one of the major
among populations. Although most of the genetic variation can                 challenges has been to select markers that minimize that error
be observed within populations, a significant fraction can still              rate, increasing the accuracy of the studies or inferences.
be used to distinguish human populations, particularly from                      In this work, we assessed ancestry with different sets of
different continents. For that purpose, markers in a wide range               markers (46 indels developed for capillary electrophoresis and
of evolutionary rates and modes of inheritance have been used,                165 SNPs included in the Precision ID Ancestry panel for
showing clear differences between populations from Eurasia, sub-              massively parallel sequencing). Parent-offspring data from 65
Saharan Africa, East Asia, America, and Oceania, even for small               families with mixed parentage were used. Since full-siblings
numbers of randomly selected markers.                                         have the same apportionment of common ancestry inherited
   In the last few years, many sets of Ancestry Informative                   from their parents, the most informative loci will be those
Markers (AIMs) including SNPs and indels have been described                  presenting the smallest degree of deviation between the observed
to address individual ancestry or to detect diversity patterns                and expected ancestry proportions. Data on the genetic profiles
between and within continental populations (Rosenberg et al.,                 of unrelated individuals from the Rio de Janeiro population
2002; Nassir et al., 2009; Galanter et al., 2012; Pereira et al., 2012;       considering the 210 AIMs are also reported.
Kidd et al., 2014; Phillips et al., 2014; Moriot et al., 2018; Cheung            We aimed to further investigate the factors that could
et al., 2019). To better capture the genetic differences among                cause differences in ancestry estimation and their impact
groups, these AIMs were selected to have large discrepancies                  when addressing ancestry at individual and population levels.
in allele frequencies between populations. However, carefully                 Ultimately, these parameters can be used to understand how
selected markers are required to distinguish close population                 to achieve more accurate estimations, namely in populations
groups or to characterize continental fringe populations, which               harboring a trihybrid admixture from European, African, and
are often difficult to distinguish due to gene flow (Bulbul et al.,           Native American groups, which is typical for most South
2016; Li et al., 2016; Yuasa et al., 2018; Pereira et al., 2019;              American populations.
Phillips et al., 2019).
   The interest in studying AIMs is growing, and nowadays
many DNA testing companies are offering online information                    MATERIALS AND METHODS
on ancestry or genetic history to the average public in a
fast and easy way. In forensic genetics, besides tracing back                 Samples, Extraction of DNA and
individual genealogies, AIMs can have a prominent role during                 Quantification
the investigation phase of missing person cases and in the                    Blood samples on FTA cards (Whatman Inc., Clifton, NJ,
identification of crime perpetrators. AIMs are also used in clinical          United States) were collected from 65 Brazilian families (with
genetics, in case/control association studies, to avoid spurious              confirmed kinship) composed by mother, father, and two
associations due to population substructure (Marchini et al.,                 children (260 individuals in total), as well as from 84 unrelated
2004; Tian et al., 2008; Price et al., 2010).                                 Brazilian individuals. Informed consent was obtained from all
   The same AIM sets developed for human population genetics                  participants included in the study. The project was approved by
have also been used to investigate forensic cases. In this context,           an ethical committee of the State University of Rio de Janeiro
however, these sets are not usually utilized to question the                  (CAAE: 0067.0.228.000-09).
continental ancestry of a sample contributor, but rather, the                    DNA was extracted with the standard phenol-chloroform
most likely population of origin of the DNA profile, i.e., the                method. DNA extract concentration was measured using
Biogeographical Ancestry (BGA) of a sample donor (Phillips                    the InnoQuant HY kit (InnoGenomics) according to
et al., 2007; Rajeevan et al., 2012, 2020; Tvedebrink et al., 2017,           the manufacturer’s protocol or using the Qubit dsDNA
2018; Mogensen et al., 2020). However, inferring the most likely              High Sensitivity assay and the Qubit 2.0 Fluorometer
population of origin of an individual does not always provide                 (Invitrogen, Carlsbad, CA, United States) following the
direct information about its ancestry profile (and vice versa),               manufacturer’s instructions.
namely in recently admixed populations. A set of markers that
separates main population groups will not necessarily be the most             Analysis of Ancestry Markers
adequate for determination of the apportionment of ancestry at                The apportionment of the ancestry of each individual was
an individual level, which requires several loci with large allele            investigated with different sets of AIMs. One set consisted
frequency differences among source populations.                               of 46 indels selected to assess European, African, Asian, and
   Frequently used metrics proposed for AIM selection rely                    Native American ancestries. The indels were amplified by PCR,
on the maximization of genetic distances or allele frequency                  and analyzed by capillary electrophoresis, according to Pereira
differentials with the minimal number of markers (Pfaffelhuber                et al. (2012). The individuals were also analyzed for 165 SNPs
et al., 2020). However, large genetic distances are usually                   included in the Precision ID Ancestry panel (Thermo Fisher
associated with strong drift and/or selective pressure and,                   Scientific, Waltham, MA, United States) following the protocol
therefore, ancestry inferences or determination of the population             recommended by the manufacturer. The DNA was sequenced

Frontiers in Genetics | www.frontiersin.org                               2                                      August 2020 | Volume 11 | Article 966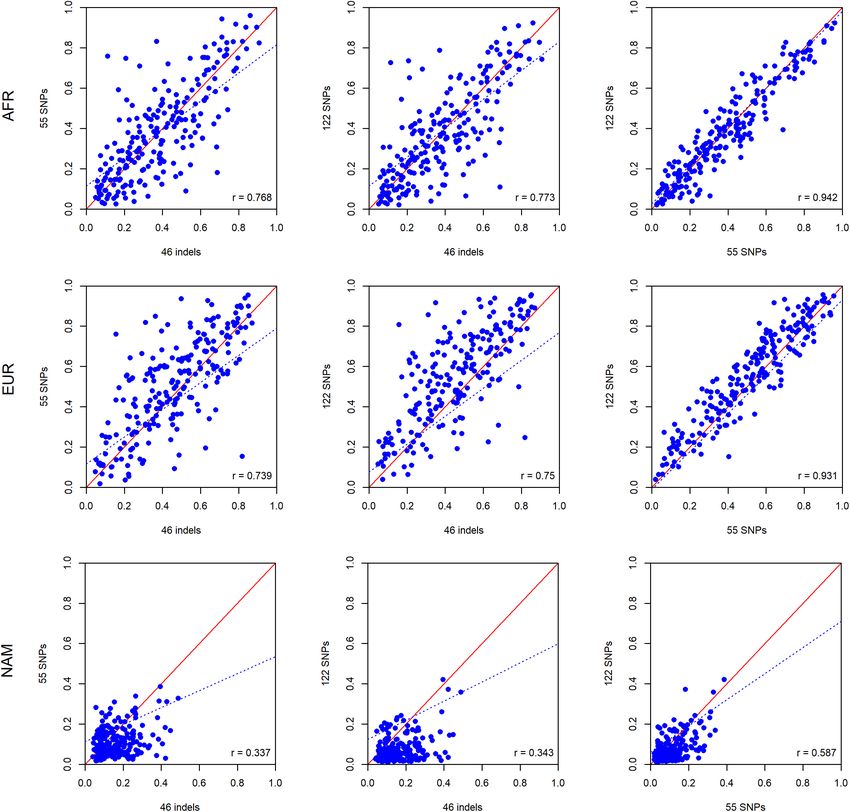
Pereira et al.                                                                                            Ancestry Inferences in Admixed Populations

using either the Ion PGMTM or the Ion S5TM platforms (Thermo                 The combined individual ancestry values provided by
Fisher Scientific). For the Ion PGMTM , each run contained 25             CLUMPP were used to calculate all the parameters reported in
libraries (50 pM) loaded on an Ion 318TM chip v2 (Thermo Fisher           this manuscript (average ancestry levels for the different datasets,
Scientific). For the Ion S5TM , 96 libraries (35–50 pM) were loaded       absolute differences in ancestry among siblings and parents, and
on Ion 530TM chips in each run (Thermo Fisher Scientific).                levels of variance reported in each component for all AIM sets).

                                                                          Population Assignment of Individuals
Data Analysis                                                             The assignment of individuals to a population of origin was
Allele calls for the 46 indels were considered for >50                    assessed using the GenoGeographer software (Tvedebrink et al.,
RFUs for heterozygote individuals, and >100 RFUs for                      2018; Mogensen et al., 2020). In this analysis, the z-score was
homozygote genotypes. For the 165 AIMs, allele calls were                 computed for each individual, considering AFR, EUR, NAM, and
carried out following the same criteria as described in                   Rio de Janeiro as reference populations. The test considers the
Santangelo et al. (2017).                                                 variance of the allele frequencies in the reference populations
   The Precision ID Ancestry panel combines two published                 (Chakraborty et al., 1993), and the respective p-values are used
assays of 55 (Kidd et al., 2014) and 123 AIMs (Kosoy et al.,              to assess the most likely population of origin of the profile.
2009; Nassir et al., 2009), with 13 overlapping SNPs. Therefore,          The analyses were performed using a leave-one-out approach,
for ancestry inference analysis, the following five datasets were         excluding the individual tested from the reference dataset.
considered: 46 indels, 55 SNPs, 122 SNPs, 164 SNPs, and 210
markers (46 indels + 164 SNPs). The SNP rs10954737 was
not included in the analyses, as it was not typed in all the
African (AFR), European (EUR), and Native American (NAM)                  RESULTS
reference populations (hence, the analysis considered 164 SNPs
instead of 165 SNPs).                                                     Genetic Profile of the Rio de Janeiro
   Reference population data used in the analyses were available          Population for 210 AIMs
for all panels and consisted of 100 AFR, 100 EUR, and 47                  Data from 214 unrelated individuals (130 unrelated parents from
NAM individuals. Data for 46 indels were retrieved from the               65 families, plus 84 additional unrelated individuals), living in Rio
1000 Genomes database or were previously generated for HGDP-              de Janeiro (Brazil), were used to calculate population descriptive
CEPH samples (Pereira et al., 2012). Genotypes for the same               statistics for 210 ancestry markers (164 SNPs + 46 indels). Three
individuals for the 164 AIMs were kindly collected and provided           populations were used as reference – AFR, EUR, and NAM.
by the Kidd Lab from publicly available data.                             Supplementary Table S1 contains detailed information on allele
   Allele frequencies, Hardy-Weinberg Equilibrium (HWE),                  frequencies for these markers in Rio de Janeiro compared to the
genetic diversities, and pairwise F ST genetic distances were             reference populations.
calculated using the Arlequin v3.5.2.2 software (Excoffier and               Three loci – rs1800414, rs3811801, and rs671 – were
Lischer, 2010). HWE analysis was carried out using 1,000,000              monomorphic in the sample from Rio de Janeiro. This result is in
Markov Chain Monte Carlo (MCMC) steps and 1,000,000                       accordance with previous studies showing that these loci are only
dememorization steps. Correction for multiple testing was done            polymorphic in East Asian populations (Kidd et al., 2014; Pereira
according to Bonferroni (1936). Statistical significance among            et al., 2017; Santangelo et al., 2017). As expected for an admixed
genetic diversities was assessed with the t-test.                         population with NAM, AFR, and EUR ancestry, the remaining
                                                                          207 markers were polymorphic in the Rio de Janeiro dataset. For
                                                                          the reference populations included in this study, the number of
Ancestry Inference                                                        monomorphic loci was higher: 34 loci were monomorphic in the
The distribution of NAM, EUR, and AFR genetic ancestry in                 AFR reference population, 8 in the EUR sample, and 9 in the
each individual was estimated using the STRUCTURE v.2.3.4.21              NAM group (Supplementary Table S1).
software (Pritchard et al., 2000; Falush et al., 2003). The                  Hardy-Weinberg Equilibrium was assessed for the 207
analysis was carried out using a burn-in period of 100,000                polymorphic markers in the Brazilian population. After
iterations, followed by 100,000 repetitions for the MCMC.                 correction for multiple tests, only rs6451722 presented a
The “admixture” and the “correlated allele frequencies” models            statistically significant deviation (p-value: 0.0002). This deviation
were considered. Population information was used to assist                was associated with an excess of observed homozygotes (63%
clustering. Three assumed clusters (K) were considered in the             compared to 50% expected under HWE), pointing to some degree
analyses, and five independent runs were performed to verify the          of population stratification in Rio de Janeiro. Indeed, although
consistency of the results. The cluster membership coefficients           statistically non-significant when applying the Bonferroni
of the five runs were combined using CLUMPP v.1.1.222                     correction, 72% of the polymorphic loci showed lower observed
(Jakobsson and Rosenberg, 2007).                                          heterozygosity values than expected in a population in HWE.
    The apportionment of ancestry in each individual was plotted          The excess of homozygotes was higher for loci with greater
using the package “plotrix” developed for R software (R Core              differences in the allele frequencies between AFR and EUR
Team,, 2013). Statistical significance among average ancestry             populations, which are the main contributors to the current
estimates was assessed with the z-score.                                  population of Rio de Janeiro (Figure 1). This general tendency

Frontiers in Genetics | www.frontiersin.org                           3                                        August 2020 | Volume 11 | Article 966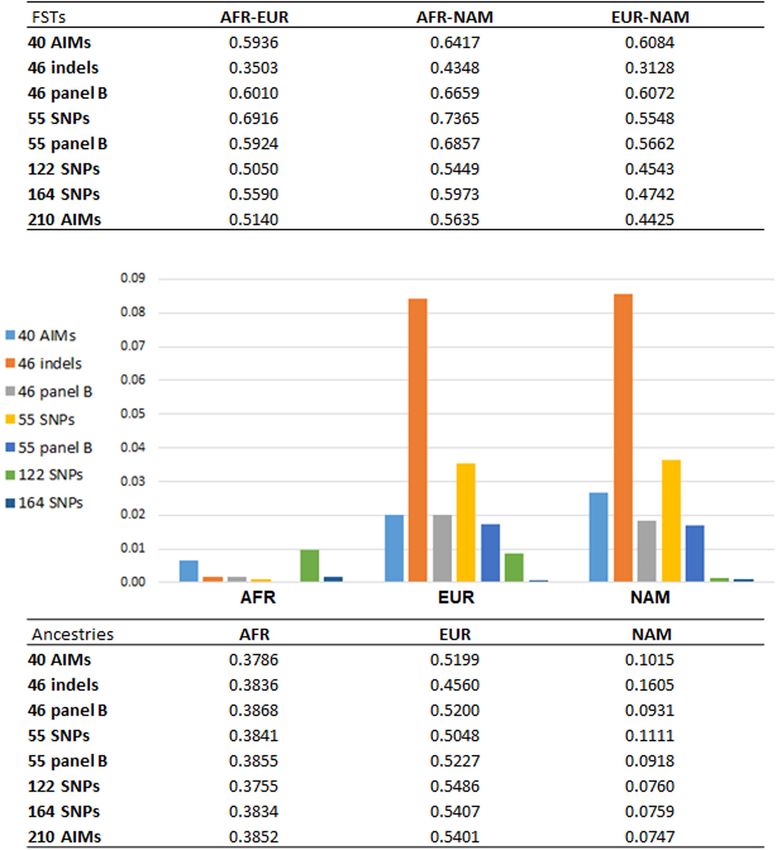
Pereira et al.                                                                                                          Ancestry Inferences in Admixed Populations

  FIGURE 1 | Differences between expected and observed heterozygosity values for the 210 AIMs in the Rio de Janeiro, AFR, and EUR reference samples. A positive
  value reflects an excess of homozygotes for the marker. Markers are presented in descending order of absolute allele frequency differences between AFR and EUR
  (more information on Supplementary Table S2).

for an excess of homozygosity was not observed in the AFR and                       Manta et al. (2013) investigated randomly selected unrelated
EUR reference population samples.                                                   individuals born in the metropolitan region of Rio de Janeiro. In
    The average genetic diversity was higher in the Brazilian                       the current study, the samples were collected from paternity cases
sample (0.376 ± 0.179) than in any of the three continental                         from Rio de Janeiro that also include surrounding areas outside
references (AFR: 0.202 ± 0.098; EUR: 0.264 ± 0.127; NAM:                            the metropolis. Variation in the ancestry contributions across Rio
0.294 ± 0.142), reflecting the trihybrid origin of the Rio de Janeiro               de Janeiro has been reported by others (Almeida et al., 2017).
population. Differences in the genetic diversity values between                     A previous study that evaluated ancestry inference when using
Rio de Janeiro sample and all reference samples were statistically                  different sampling cohorts from the Rio de Janeiro population
significant (t-test: p-value < 0.016).                                              reported increased AFR and decreased EUR contributions
    Pairwise F ST values among populations showed a smaller                         outside the metropolitan region (Almeida et al., 2017). This
differentiation between the Brazilian dataset and the EUR                           sampling effect is also observed in this work.
reference (F ST = 0.113) than with AFR (F ST = 0.212) and NAM
(F ST = 0.314), which is in accordance with the distribution
of ancestry proportions in the Brazilian sample. STRUCTURE
results showed that the EUR component was the one with the
highest contribution (54.0%), followed by the AFR (38.5%), and
the NAM (7.5%) components. The apportionment of ancestry
in each individual is plotted in Figure 2. The wide dispersal
of individuals across the plot (mostly along the AFR and
EUR axes) is consistent with a great intrapopulation variation,
compatible with recent admixture events and/or a certain degree
of population substructure.
    A previous study using the same 46 ancestry informative
indels as in this work, but in 280 individuals from Rio de
Janeiro, reported slightly different ancestry proportions (Manta
et al., 2013; Figure 3B). Furthermore, the difference between the
NAM proportions in both studies (Figures 3A,B) was statistically
significant (z-score p-value = 0.0271). Since the 46 indels are a
subset of the 210 AIMs analyzed here, we recalculated the average
ancestry values for our sample of 214 individuals based on the 46
indels alone (Figure 3C).
    Comparing the results obtained in the two population
samples from Rio de Janeiro for the 46 indels (Figures 3B,C),
higher AFR and NAM contributions were detected in this
study. Although differences in these two components were
not high enough to be statistically significant (AFR z-score
p-value = 0.09102; NAM z-score p-value = 0.4902), a statistically
significant decrease of 9.6% (z-score p-value = 0.03486) was                         FIGURE 2 | Triangular plot of the q-matrices generated in STRUCTURE and
                                                                                     combined in CLUMPP, considering the distribution of the three ancestry
found in the EUR component. This variation observed for the
                                                                                     components in each individual.
same AIM panel could be related to the sampling in both studies.

Frontiers in Genetics | www.frontiersin.org                                     4                                            August 2020 | Volume 11 | Article 966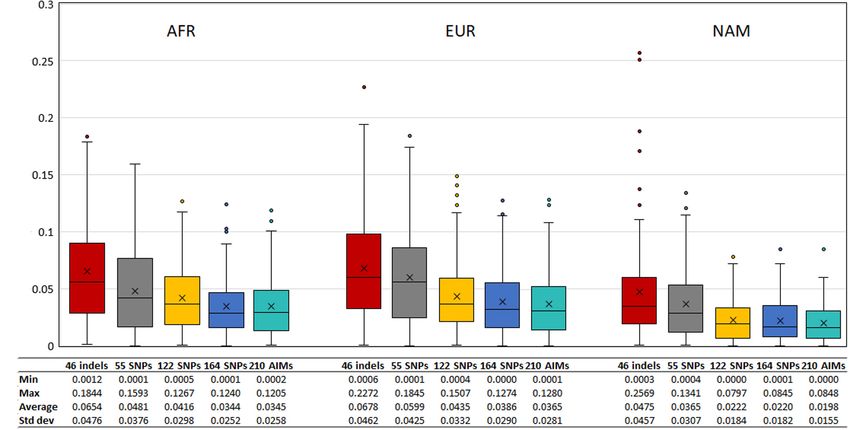
Pereira et al.                                                                                                            Ancestry Inferences in Admixed Populations

  FIGURE 3 | Apportionment of ancestry in Rio de Janeiro based on 210 AIMs (A), 46 indels from Manta et al., 2013 (B), and the current dataset (C).

   Differences in the ancestry components were not only                              role when addressing ancestry, since a low number of autosomal
observed between the two studies but also when comparing                             loci, even if unlinked, may lead to stochastic variations in the
the same individuals analyzed in this work for the 210 and                           representativeness of the different ancestors.
46 markers (Figures 3A,C). Compared to the complete AIM                                 To explore this issue further, we compared the ancestry
set, the 46 indels reported increased NAM and decreased EUR                          estimates obtained when using different AIM sets in several
ancestry proportions. The difference in the NAM component was                        American admixed populations.
statistically significant (z-score p-value = 0.00578).
   In the following sections, we intended to investigate the                         Ancestry Estimates in Rio de Janeiro Using Different
factors that may influence these differences in ancestry estimation                  Panels
and their impact when addressing ancestry at the population                          Average values of ancestry among the unrelated samples from
and individual levels. Ultimately, we aimed to disclose and                          Rio de Janeiro were calculated after dividing the data into
compare the effect of the parameters that most influence ancestry                    several datasets. The Precision ID Ancestry panel combines two
determination. This will help to understand how to achieve                           ancestry sets: the 55 SNPs selected by the Kidd lab (Kidd et al.,
more accurate estimates, particularly in populations harboring a                     2014), and 123 out of the 128 SNPs selected by the Seldin
trihybrid admixture from EUR, AFR, and NAM groups, like the                          lab (Kosoy et al., 2009; Nassir et al., 2009). The strategies for
Brazilian population.                                                                marker selection of the panels were slightly different. The 55
                                                                                     SNP panel was made to contain few markers to identify the
                                                                                     BGA of an unknown sample. The SNPs are representative of
Factors Influencing Ancestry                                                         diverse geographical regions, and the selection process included
Estimations at the Population Level                                                  pairwise comparisons of reference populations to select those
Although ancestry estimates can be deduced from full genomes                         markers with the largest allele frequency differences. The final set
or genome-wide studies, the overall ancestry at both population                      was balanced between population groups so that the geographic
and individual levels is most often calculated based on a certain                    regions could be distinguishable with the same level of robustness
number of genetic markers showing low discrepancies to the                           (Kidd et al., 2014). The strategy for the development of the 128
genome-wide results (e.g., Galanter et al., 2012; Santos et al.,                     SNP panel from the Seldin lab was to include markers with
2016). Since just a limited portion of the entire genome is                          large allele frequency differences among European, Sub-Saharan
analyzed, the accuracy of the results relies on the type and                         African, American, and East Asian groups (Kosoy et al., 2009;
number of selected markers. Loci with low variation among the                        Nassir et al., 2009).
source populations will tend to give poor ancestry estimates. In                        Using the information from the unrelated individuals
these cases, an overestimation of the less represented ancestry                      (N = 214), we compared the average ancestry proportions per
components at the expense of those most represented in                               component reported by the five panels (46 indels, 55 SNPs, 122
the population is expected, as seen previously for Rio de                            SNPs, 164 SNPs, and the total dataset of 210 AIMs) to evaluate the
Janeiro (Figures 3A,C).                                                              level of variation among them (Figure 4; more information on
   Similarly, even if the markers are highly informative, a                          the average, range, and variance of the ancestry values reported
balanced discriminatory power between reference populations is                       for each panel is presented in Supplementary Table S3).
also required. As shown in Galanter et al. (2012), a lower mean                         The values for the AFR component were similar for all sets of
locus-specific branch length for European ancestry results in an                     markers (values varied from 0.3755 for 122 SNPs to 0.3852 for
underestimation of this component in MXL and PUR subjects.                           the 210 AIMs). The variation was higher for the EUR and NAM
The same was observed for the AFR ancestry in that study.                            components, which represent the highest and lowest ancestry
Besides these factors, the number of markers may also play a                         proportions, respectively (discussed in more detail below).

Frontiers in Genetics | www.frontiersin.org                                      5                                              August 2020 | Volume 11 | Article 966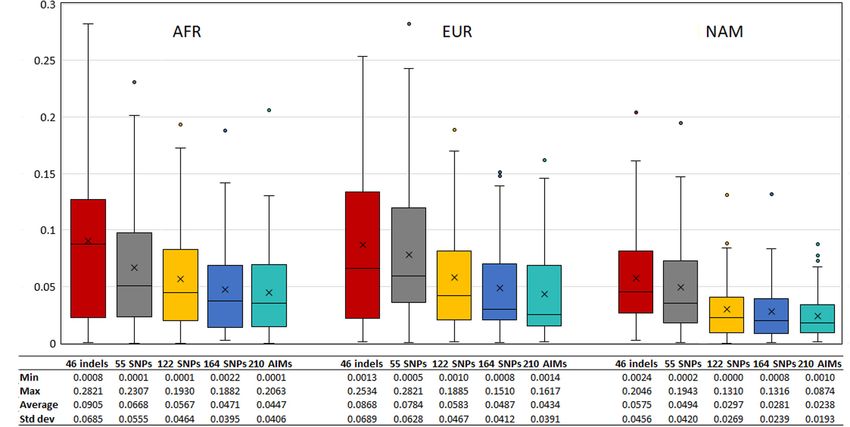
Pereira et al. Ancestry Inferences in Admixed Populations
FIGURE 4 | Average ancestry proportions per component for the Rio de
Janeiro sample reported by the five AIM sets considered.
FIGURE 6 | Sum of deviations from the reference values (Martin et al., 2017)
reported by each panel in the six admixed American populations from the
1000 Genomes database.
A previous study that compared ancestry inferences in
admixed samples from Brazil and Colombia using 30 ancestry
and 30 identity indel-markers showed that the proportions of Supplementary Table S3). As stated previously, if the panels
each component in a trihybrid population always tended to be provide low levels of population differentiation, a tendency to
equally divided for human identity markers that were not optimal underestimate the major ancestry component (in this case, EUR)
for discrimination of ancestry (Aquino et al., 2015). Therefore, and to overestimate the minor component (NAM) would be
when the true ancestry proportions were not captured by the expected, as seen for the 46 indel panel. Although to a lesser
selected markers, for K = 3 there was a tendency to overestimate extent, this tendency was also observed in the 55 SNP set.
ancestry to values closer to 33%, and vice-versa: values above 33%
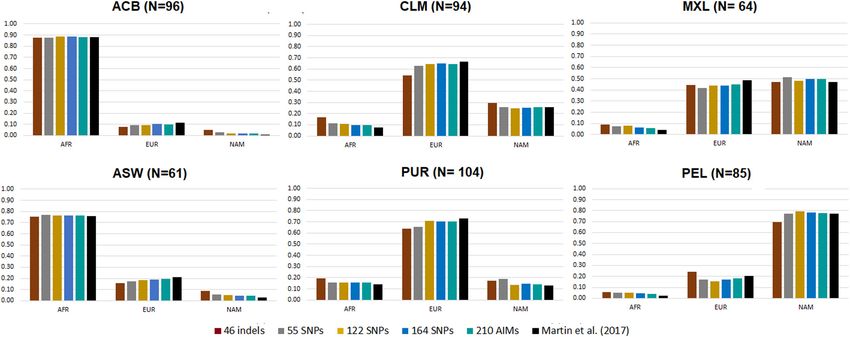
tended to be underestimated. Ancestry Estimates in American Admixed
In the studied population, the AFR ancestry component is Populations From the 1000 Genomes
close to 33% (Figure 4). As stated, smaller ancestry differences African, European, and Native American ancestry components
might not be captured at this level, regardless of the panel used, were estimated for the previously defined AIM sets using data
which may be why no significant difference was observed in the from six American admixed populations included in the 1000
AFR estimates with the different AIM sets. Genomes Project (phase 3): African Caribbean in Barbados
More variation was observed for the EUR and NAM (ACB); Americans of African ancestry in Southwest United States
components (Figure 4 and Supplementary Table S3). The EUR (ASW); Colombians from Medellin, Colombia (CLM); Mexican
component was smaller when the samples were analyzed for Ancestry from Los Angeles, United States (MXL); Peruvians
the 46 indels, and conversely, this was the panel reporting from Lima, Peru (PEL); and Puerto Ricans from Puerto Rico
the highest value of the NAM component (Figure 4 and (PUR). The results for each panel of AIMs were compared to
FIGURE 5 | Average ancestry proportions for the five AIM panels in six American admixed populations from the 1000 Genomes database. Reference values based
on genome-wide SNP data are represented in black (Martin et al., 2017).
Frontiers in Genetics | www.frontiersin.org 6 August 2020 | Volume 11 | Article 966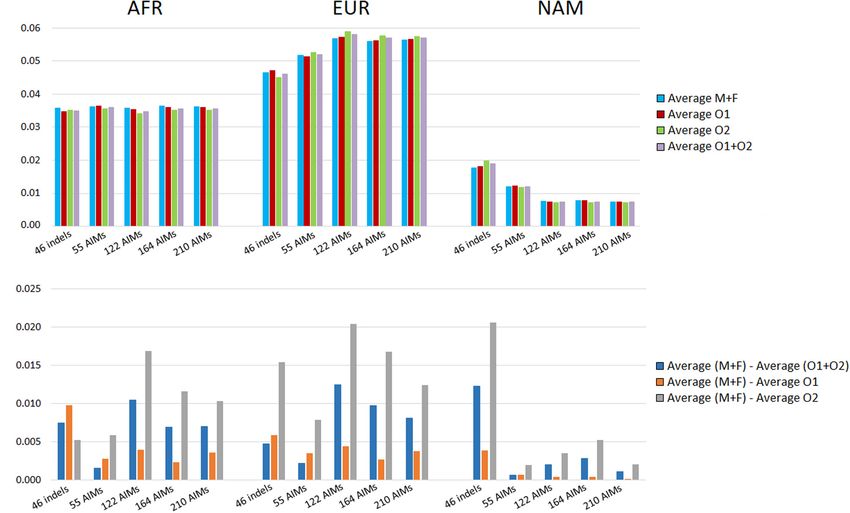
Pereira et al.                                                                                             Ancestry Inferences in Admixed Populations

the ancestry estimates based on common genome-wide SNPs                     Number of Markers and the Genetic Differentiation of
(Martin et al., 2017; Figure 5; more information on the average,            the Reference Populations
range, and variance of the ancestry values reported for each                From the results obtained for the different AIM-sets, it can be
panel is presented in Supplementary Table S4). The triangular               seen that the number of loci and their capacity to differentiate
plots of the individual q-matrices generated in STRUCTURE                   source populations influence the accuracy of the ancestry
for the six populations based on 210 AIMs are presented in                  estimations. With a higher number of loci, the variations
Supplementary Figure S1.                                                    associated with the estimations were smaller, as seen for example
    The six admixed populations could be divided into four                  in the inferences provided by the 122, 164, and 210 AIM panels
groups: Populations with mainly AFR ancestry (ACB and ASW),                 (Figures 4, 5). Apart from the variation in the number of loci,
populations with mainly EUR ancestry (CLM and PUR), a                       the five panels presented different pairwise F ST values among the
population with mainly NAM ancestry (PEL), and a population                 three reference populations (Figure 7A).
with similar proportions of EUR and NAM ancestries (MXL).                      This leads to the question of whether results of ancestry
    Considering the estimates for genome-wide data as reference,            inferences are more dependent on the number of markers
the ancestry values reported by the 46 indels overestimated                 included in an AIMs panel than the combined population
the minor components and underestimated the major ancestry                  differentiation these markers provide, or if they are equally
components for all American populations, except for populations             dependent on both?
with high AFR ancestry (ACB and ASW), similarly to the                         To address this issue, we returned to the global set
observation in the population from Rio de Janeiro (Figure 4).               of 210 AIMs, and defined three additional AIM panels
For the other AIM panels, there was a small underestimation                 based on different selection strategies (more details on
of the EUR component compared to the values obtained with                   Supplementary Information 1):
the genome-wide SNPs (EUR reference values varying from 11.7                   (a) two new panels with 46 and 55 AIMs (named 46 panel B
to 73.2%; AFR varying from 2.5 to 88%). In contrast, the NAM                and 55 panel B), where we aimed to maintain the same number
component was overestimated (NAM reference values between                   of markers but selected those that would have the highest and
0.3 and 77.3%).                                                             most balanced pairwise F ST s among all population groups. The
    However, it is worth noting the relatively low variation among          distances among EUR-NAM were given preference since they had
all sets in most populations. Most estimates fell within the interval       the smallest distances in the original panels;
defined by one standard deviation of the average reference values              (b) a new panel with a small number of markers (40 AIMs),
(Martin et al., 2017; Supplementary Table S4). Few cases were               but the emphasis was now on the selection of the combination
the exception, namely: the AFR component in MXL, for 46 indels,             of markers that produced smaller differences between the F ST s
55 SNPs, and 122 SNPs; the EUR component in PUR, for the 46                 among the reference groups (i.e., same levels of differentiation
indels; the NAM component in PUR, for 46 indels and 55 SNPs;                between AFR-EUR, AFR-NAM, and EUR-NAM).
and the NAM component in ACB, for all sets.                                    Figure 7 presents the pairwise F ST s among reference
    To understand which panel presented more variation                      populations obtained with each panel (Figure 7A), the average
compared to the reference values based on the genome-wide                   ancestry proportions reported for the 214 unrelated individuals
SNPs (Martin et al., 2017), we calculated the sum of all the                (Figure 7C), and their absolute differences compared to the
absolute deviations from the reference values for the five panels           estimates provided by the 210 AIMs (Figure 7B).
in each population (Figure 6). Different trends could be seen for              Looking at the pairwise F ST values (Figure 7A), we observed
each panel, depending on the ancestry profile of the population.            that the number of markers is not the only factor responsible for
    In all populations, the 210 AIM set had the smallest                    the differences previously reported in the ancestry estimations
accumulated error for the three continental components. The                 (Figure 7C). Panels with the same number of markers presented
46 indels performed worst in most populations, but it presented             different magnitudes of F ST. Compared to the 46 indels, the 46
smaller deviations than the 55, 122, and 164 SNP panels in the              panel B had greater F ST s among the three population groups, and
MXL population. This population had similar proportions of                  they were similar to the F ST s for larger panels. In Figure 7B, the
EUR and NAM ancestries (Figure 5). For the populations with                 new 46 panel B has much smaller deviations from the ancestry
lowest NAM ancestry, the combination of 46 indels and 164                   values obtained with the total set of 210 AIMs, and it appears to
SNPs did not substantially improve the accuracy of the estimates            perform better than the 55 SNP panel, which has less balanced
compared to the 164 SNP panel alone.                                        pairwise F ST s (Figure 7A).
    However, for populations with high proportions of NAM                      For the two panels with 55 markers, smaller F ST values were
ancestry (MXL – 40.6% and PEL – 77.6%), the inclusion of the                obtained for AFR-EUR and AFR-NAM. For EUR-NAM, which
46 indels improved the estimates obtained with the 164 SNPs of              was the genetic distance that was prioritized upon selection
the Precision ID Ancestry panel.                                            of these markers, the F ST was slightly higher. The 55 panel B
    The type of errors seen for the 46 indels can be explained              also showed smaller differences compared to the 55 SNP set
by the low number of markers and/or low F ST values among                   (Figure 7B), probably due to more balanced pairwise F ST s among
the three populations. As for the remaining panels, the                     the source populations.
systematic biases were more likely due to an unbalanced genetic                Compared to the 46 indel and 55 SNP sets, the average
differentiation among populations, with EUR-NAM showing the                 ancestry values obtained with the 40 AIMs were overall closer
lowest F ST value (discussed in more detail below).                         to those reported for the 210 panel (Figure 7C); differences

Frontiers in Genetics | www.frontiersin.org                             7                                       August 2020 | Volume 11 | Article 966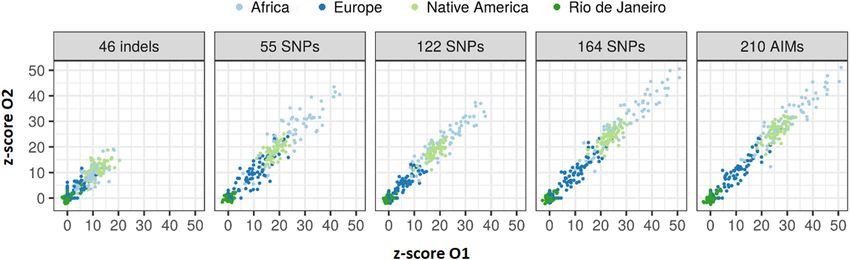
Pereira et al.                                                                                                         Ancestry Inferences in Admixed Populations

  FIGURE 7 | (A) pairwise FST values among reference populations (AFR, N = 100; EUR, N = 100; NAM, N = 47) based on the different AIM panels; (B) absolute
  values of the differences between the average ancestries reported for each panel compared to the 210 AIMs; (C) average ancestry values per component and per
  panel for unrelated individuals.

ranged from 0.0077 in the AFR component to 0.0277 in the                            especially for small sets of 40–55 SNPs. Large AIM sets (e.g., the
NAM component. As expected from the selection criteria, the F ST                    164 AIMs), result in smaller variation in the ancestry estimates
values based on the 40 AIMs were higher than those obtained                         even if these panels had slightly lower and less-balanced F ST s.
for other less balanced panels, or panels with a higher number
of markers (Figure 7A). However, when the number of markers
included in the panel increases to 122 or 164, the ancestry                         Factors Influencing Ancestry
estimates were closer to those obtained for the full set, with no                   Estimations at the Individual Level
significant variation observed between 164 AIMs and the total set                   As illustrated above, differences in ancestry estimates are
of 210 AIMs. A similar trend was observed when comparing the                        expected when using different groups of AIMs. These differences
performance of the three newly selected sets in the six American                    can be due to the poor performance of the markers to differentiate
populations from the 1000 Genomes project (Supplementary                            ancestry components. In this case, there will be a directional
Figure S2). However, the errors associated to each panel showed a                   bias in the estimations, and some ancestry components will
variation that depends on the ancestry profile of the populations.                  tend to be overestimated at both the individual and population
   The results highlight that a balanced population                                 level. However, if the differences are not related to the marker
differentiation among the reference groups also plays an                            performance, but with the (low) number of markers used, it is
important role in the accuracy of the ancestry estimations,                         expected that the differences in population genetic statistics will

Frontiers in Genetics | www.frontiersin.org                                     8                                            August 2020 | Volume 11 | Article 966
Pereira et al.                                                                                           Ancestry Inferences in Admixed Populations

be random. These variations will have a much smaller effect in            the variation observed between parents and offspring subsamples.
larger population samples than at the individual level.                   We can, therefore, conclude that if there is a drift effect at the
                                                                          individual level, this is not reflected at the population level for
Individual Ancestry Estimates Using Different Panels                      the number of samples analyzed here. A directional bias could
To investigate differences in ancestry estimates at the individual        also influence the differences observed within each panel. For
level, we plotted the pairwise comparisons between the panels of          instance, an approximation of ancestry components to a certain
46 indels, 55 SNPs, and 122 SNPs.                                         value will result in a smaller difference among individuals.
   As can be seen in Figure 8, there are large differences at the             To investigate the expected variation of ancestry estimates at
individual level when the results of the three panels are compared.       the individual level, we compared the average ancestry of the
The results are in accordance with the ancestry estimates at the          parents and offsprings for each component (Figure 10).
population level, with the NAM component showing the worst                    A high positive correlation was obtained for all AIM sets, and
results. The highest levels of correlation and agreement among            the values were closer to r = 1 when the number of markers was
comparisons were found between the 55 SNP and 122 SNP panels              increased. For the AFR component, the highest correlation was
for the AFR and EUR components (r = 0.942 and r = 0.931,                  observed for the 164 SNPs (r = 0.989). For the EUR component,
respectively). The correlation was lower for the NAM component            the 164 SNPs and total AIM set of 210 markers presented the
in all pairwise comparisons (r ≤ 0.585).                                  highest values (r = 0.984). For the NAM component, the highest
   The results for the six American admixed populations of the            value (r = 0.927) was reported for the 122 SNPs.
1000 Genomes Project showed a similar trend, with the 55 SNP                  To evaluate the agreement between the observed ancestries
and 122 SNP panels presenting the highest levels of correlation           for each offspring and the expected values given by the average
and agreement among comparisons. However, the component                   ancestry of the parents, we calculated the absolute differences of
with the largest differences varied among populations. The most           these values, shown in Figure 11. The differences decreased when
extreme disagreement among the three panels was obtained for              a higher number of markers was used.
the NAM component in ACB and for the AFR component in                         Although the differences between the average ancestry
MXL (Supplementary Figures S3–S8).                                        estimated in parents vs. offspring were lowest for the 55 SNPs
                                                                          at the population level (Figure 9B), the full set of 210 AIMs
Comparison of Average Ancestry Proportions in                             produced the smallest variation at the individual level. Moreover,
Parents vs. Offspring                                                     the addition of the 46 Indels to the 164 SNPs had the highest
Families with parents and their offsprings are excellent proxies          effect in the NAM component, which is in accordance with what
to study the variation of ancestry estimations at the individual          was observed for the estimates obtained at the population level
level. To this end, data from 65 families (mother, father, and two        (Figure 5 – Section “Ancestry Estimates in American Admixed
offsprings) with confirmed kinship were investigated (N = 260).           Populations From the 1000 Genomes”).
The estimates reported by the five panels (46 indels, 55 SNPs,
122 SNPs, 164 SNPs, and 210 AIMs) were compared once                      Comparison of Ancestry Estimates Among Sibling
again considering that: (1) the apportionment of ancestry in the          Pairs
offspring should be close to the average ancestry of the parents,         A further comparison was performed between siblings
and (2) full siblings should present very similar ancestry values         (Figure 12) based on the assumption that siblings should have
for a set of unlinked markers.                                            identical ancestry components from the three continental sources
    In this context, the most informative group of loci will be the       when accessed by a large enough number of well balanced AIMs.
one presenting the smallest difference in ancestry between the                As for the comparisons between parents and offsprings, a high
siblings and their parents.                                               correlation was also observed between the ancestry proportions
    We looked at the variation in the average ancestry proportions        of siblings. The smallest r-value was 0.531 for the 55 SNPs in
provided by STRUCTURE for the datasets defined by the parents             NAM; all other correlations were above 0.761 (Figure 12). There
(mothers and fathers, M + F) and the offspring (O1, O2, and               was an overall tendency of increased correlation with an increase
O1 + O2). The average values and their absolute differences are           in the number of markers.
presented in Figure 9.                                                        The concordance between the ancestries of the siblings
    In theory, the average ancestry proportions in these four             was measured by calculating the absolute differences observed
groups should be similar, but differences were observed between           (Figure 13). Again, smaller differences among siblings were
the estimates. The largest difference between datasets was 2%             obtained with increasing numbers of markers. The 210 AIM
for the EUR component estimated by the 122 AIMs, and for                  panel had the smallest deviation in ancestry estimations among
the NAM, when using 46 indels. The variation in the ancestry              siblings (Figure 13).
proportions was observed regardless of the number of markers                  For all AIM sets, both correlation and concordance were
included in the panel. The set of 55 SNPs had the lowest variation        higher between parents vs. offspring than between siblings.
(all values were below 0.078%).
    The analyses were based on a limited number of loci and a             Inferences on Biogeographical Ancestry
random variation was expected that depended on the numbers                (BGA)
of markers and samples analyzed. However, there was no clear              The five previously defined AIM sets were used for prediction of
correlation between the number of markers and the differences in          the biogeographical origin of the profiles from Rio de Janeiro,

Frontiers in Genetics | www.frontiersin.org                           9                                       August 2020 | Volume 11 | Article 966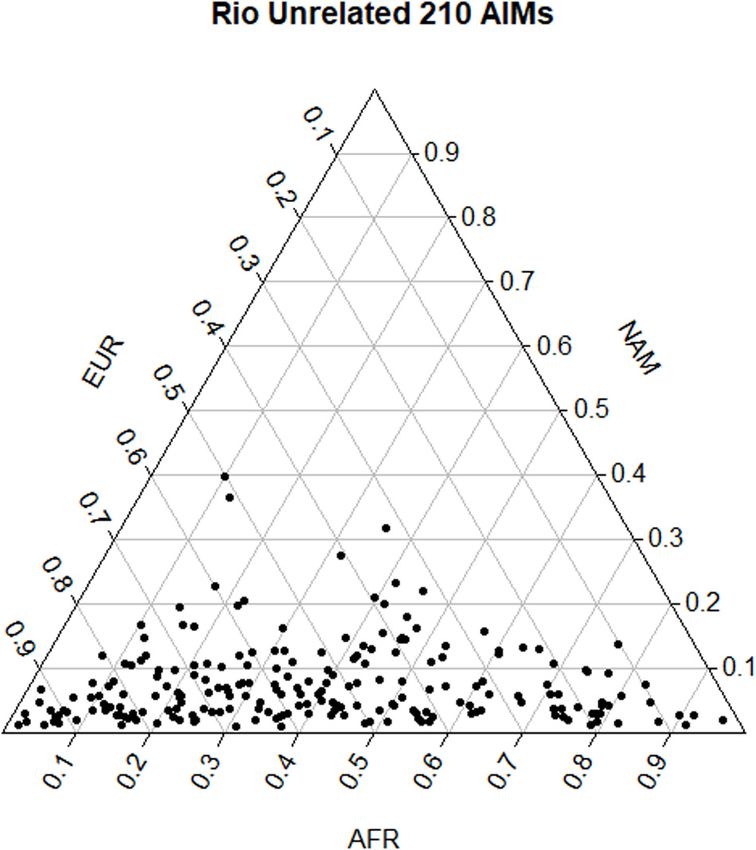
Pereira et al.                                                                                                             Ancestry Inferences in Admixed Populations

  FIGURE 8 | Pairwise comparisons between ancestry estimates provided by the panels with 46 indels, 55 SNPs, and 122 SNPs among the unrelated individuals from
  the Rio de Janeiro population. The respective r-values are indicated in the figures, and the tendency line is represented as a blue dashed line. The red solid line
  indicates the perfect agreement between two AIM panels.

considering four reference populations: AFR, EUR, NAM, and                             the potential source populations. To this end, for all AIM sets,
Rio de Janeiro. A z-score test was applied to the 214 unrelated                        we evaluated the proportion of individuals that were classified as
individuals and to each offspring of the 65 sibling pairs from Rio                     “Rejected” (none of the four reference populations was defined
de Janeiro, to assess whether one (or more) of the four reference                      as a possible population of origin of the profile; z-score > 1.64,
populations was accepted as a potential population of origin of                        p-value < 0.05) or “Accepted” (at least one of the four reference
each AIM profile. This test was performed using the approach                           populations was defined as a possible population of origin of the
described in Tvedebrink et al. (2018).                                                 profile; z-score ≤ 1.64, p-value ≥ 0.05).
                                                                                          Among the cases defined as “Accepted,” it was also calculated
Biogeographical Ancestry Inferences in Rio de                                          (1) the proportion of “concordant” assignments (individuals
Janeiro Using Different Panels                                                         accepted in the true population of origin or, when accepted in
The accuracy of BGA inferences for the five AIM sets was                               more than one population, a significant higher likelihood was
estimated considering AFR, EUR, NAM, and Rio de Janeiro as                             obtained for the true population of origin), (2) “discordant”

Frontiers in Genetics | www.frontiersin.org                                       10                                             August 2020 | Volume 11 | Article 966
Pereira et al. Ancestry Inferences in Admixed Populations FIGURE 9 | (A) Average ancestry values per component reported by the five panels in parents (mother and father, M + F) and the offspring (offspring 1, offspring 2, and O1 + O2); (B) absolute differences between the average of the parents and: the average of both offspring (blue), the average of the offspring 1 (orange), and the average of the offspring 2 (light gray). (individuals accepted in a population that was not the true EUR and Rio de Janeiro samples when considering EUR as the population of origin, or accepted in the true population but population of origin. with a significantly lower likelihood than in another), and (3) “ambiguous” (individuals accepted in more than one population Comparison of Biogeographical Ancestry Estimates with non-significantly different likelihoods). Between Sibling Pairs The results in Table 1 show that there is a relatively high To compare the results among the two siblings, we investigated rate of rejection, depending on the population and the panel (1) how many sibling pairs had both siblings accepted or both considered. The highest values were found for the Rio de rejected in the true population of origin, (2) how many had Janeiro samples. In this population, the percentage of samples one sibling accepted into a reference population and the other rejected increased for larger panels, reaching 31% for the 210 sibling was rejected, and (3) how many sibling pairs had both AIMs. Except for the AFR, the 46 Indels showed discordant offspring rejected or both accepted as belonging to any of the results that reach 21% in Rio de Janeiro. Although with high three reference populations considered rather than the true one percentage of rejection, larger panels show higher percentage of (Supplementary Table S5). concordant profiles. However, even for the AIM sets with high For the 65 sibling pairs, the number of pairs rejected in all concordance, there is still 9% of individuals being assigned to the reference populations varied from one for the 122 SNPs to six for wrong population. the 210 AIMs. The number of sibling pairs where one individual The final proportion of all cases that were accepted in the true was accepted and one was rejected as belonging to any of the population with significant higher likelihood was only 63% for tested populations varied from seven (for the 46 indels) to 15 the largest panel (135 individuals out of the 214). Taking together cases (for the 122 SNPs) (see Supplementary Figure S10). The both sensitivity and specificity (concordant results), the 55 SNPs 46 indels showed the highest sensitivity (percentage of sibling presented the highest rate of assignment of individuals in the true pairs that were not rejected in the true population), and the population of origin (71%). lowest sensitivity was obtained for the 210 AIMs (Supplementary The discordant assignments were mainly due to the low Table S5 and Supplementary Figures S9, S10). Supplementary discrimination between EUR and Rio de Janeiro. Comparing Table S5 presents the percentage of cases where individuals were the z-scores obtained with the different panels (Supplementary accepted in their true population of origin and rejected in other Figure S9) it is possible to see an overlap of the z-scores for the reference populations, which indicates the specificity of each Frontiers in Genetics | www.frontiersin.org 11 August 2020 | Volume 11 | Article 966
Pereira et al.                                                                                                                Ancestry Inferences in Admixed Populations

  FIGURE 10 | Pairwise comparisons between the average ancestry estimates of the parents and the average estimates of their offsprings based on five AIM sets.
  The respective r-values are indicated in the figures, and the tendency line is represented as a blue dashed line. The red solid line indicates the perfect agreement
  between two AIM panels.

Frontiers in Genetics | www.frontiersin.org                                         12                                               August 2020 | Volume 11 | Article 966
Pereira et al.                                                                                                                 Ancestry Inferences in Admixed Populations

  FIGURE 11 | (A) Box and whisker plot of the absolute differences between the ancestry estimated in the 130 offsprings and the average ancestry of the parents with
  the five AIM sets. The box represents the interquartile range between the first and the third quartiles. Line in the box displays the median value and the x displays the
  mean value. Whiskers define 1.5 times the interquartile range. (B) The minimum, maximum, average values, and the respective standard deviations are also
  presented for each panel and component.

panel. In all cases, profiles were rejected as belonging to the NAM                       DISCUSSION
reference population. In two cases, one of the two siblings was
also accepted in the AFR population. The highest proportion                               Genetic Profile of the Rio de Janeiro
of ambiguities corresponded to profiles where individuals were                            Population
both accepted in EUR and the Rio de Janeiro populations.                                  Several studies have pointed to a high variation in the
The panel showing the lowest specificity was the 46 indels,                               genetic background of Brazilian populations, that present
and the 55 SNP panel was the one with the highest specificity                             different proportions of EUR, AFR, and NAM admixture.
(Supplementary Table S5). Taking together both sensitivity and                            This characteristic is shared by most populations in South
specificity, the best results were obtained for the 55 SNPs, with                         American countries (Salzano and Sans, 2014; Homburger
79.23% of acceptance in Rio de Janeiro and exclusion from other                           et al., 2015; Chacón-Duque et al., 2018). The results from
populations. The frequency of rejection of the true population                            the analysis of 210 AIMs in the 214 unrelated individuals
plus ambiguous assignment was the highest for the 46 indels                               from Rio de Janeiro indicated that the population was
(44.62%) and varied from approximately 20 to 30% for the                                  predominantly European (54.0%) with admixture of African
remaining panels.                                                                         (38.5%) and Native American genetic heritage (7.5%),
   The results obtained for the sibling pairs with different                              which was in accordance with the expectations based
acceptance output in the true population (one accepted and                                on previous studies on Brazilian populations (e.g., Pena
one rejected), for at least one marker set, are described in                              et al., 2011; Manta et al., 2013; Salzano and Sans, 2014;
Supplementary Figure S11. The highest agreement between                                   Moura et al., 2015).
siblings (both rejected or accepted) was obtained for the 46 indels.                         A comparison with another sample from Rio de Janeiro
The number of sibling pairs with a different outcome was 13                               (Manta et al., 2013) showed differences in ancestry estimates.
for the 55 SNPs, 164 SNPs, and 210 AIMs, increasing to 15 for                             These differences can be explained by different sampling
122 SNPs. Except in one case (F87), the acceptance/rejection                              strategies in association with population stratification. Locus by
result varied among panels.                                                               locus analysis did not reveal statistically significant deviations
   The z-scores calculated for the 65 sibling pairs considering in                        to the HWE, except for one locus. Nevertheless, an overall
the four reference populations (Figure 14) showed that despite                            excess of homozygotes was observed, particularly for loci
their low sensibility and specificity, larger panels resulted in                          showing large differences in allele frequency between the two
higher rejection values when considering AFR, EUR, and NAM                                main source populations (AFR and EUR). This excess of
as possible populations of origin. A good agreement can also be                           homozygosity is also supportive of population stratification
seen in the z-scores between siblings.                                                    in Rio de Janeiro.

Frontiers in Genetics | www.frontiersin.org                                          13                                               August 2020 | Volume 11 | Article 966
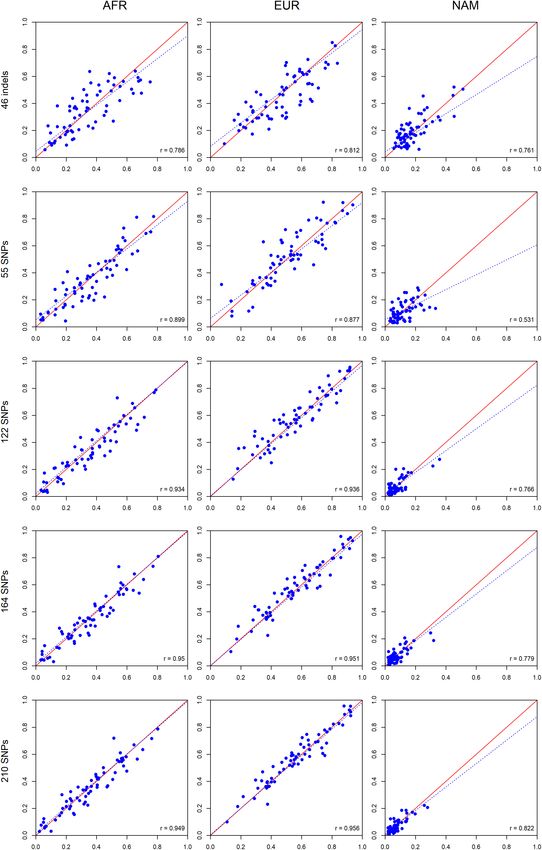
Pereira et al.                                                                                                             Ancestry Inferences in Admixed Populations

  FIGURE 12 | Comparisons between the ancestry estimates for siblings pairs based on the five AIM panel. The respective r-values are indicated in the figures, and
  the tendency line is represented as a blue dashed line. The red solid line indicates the perfect agreement between two AIM panels.

Frontiers in Genetics | www.frontiersin.org                                      14                                              August 2020 | Volume 11 | Article 966
Pereira et al.                                                                                                                 Ancestry Inferences in Admixed Populations

  FIGURE 13 | (A) Box and whiskers plot of the absolute differences between the ancestry values obtained for siblings based on results with the five AIM sets. See
  Figure 11 for the explanation of the Box and whiskers plot. (B) The minimum, maximum, average values, and the respective standard deviations are also presented
  for each panel and component.

TABLE 1 | Results of BGA inferences for five AIM panels, considering AFR, EUR, NAM, and Rio de Janeiro populations.

                                                                                                Accepted

                                    Panel                      Ambiguous                       Concordant                       Discordant                       Rejected

                                  46 indels                      0 (0.00%)                     93 (100.00%)                      0 (0.00%)                       7 (7.00%)
AFR                               55 SNPs                        0 (0.00%)                     89 (100.00%)                      0 (0.00%)                      11 (11.00%)
                                 122 SNPs                        0 (0.00%)                     92 (100.00%)                      0 (0.00%)                       8 (8.00%)
                                 164 SNPs                        0 (0.00%)                     91 (100.00%)                      0 (0.00%)                       9 (9.00%)
                                  210 AIMs                       0 (0.00%)                     91 (100.00%)                      0 (0.00%)                       9 (9.00%)
EUR                               46 indels                      2 (2.02%)                      94 (94.95%)                      3 (3.03%)                       1 (1.00%)
                                  55 SNPs                        0 (0.00%)                     90 (100.00%)                      0 (0.00%)                      10 (10.00%)
                                 122 SNPs                        0 (0.00%)                     97 (100.00%)                      0 (0.00%)                       3 (3.00%)
                                 164 SNPs                        0 (0.00%)                     96 (100.00%)                      0 (0.00%)                       4 (4.00%)
                                  210 AIMs                       0 (0.00%)                     97 (100.00%)                      0 (0.00%)                       3 (3.00%)
NAM                               46 indels                      0 (0.00%)                      41 (97.62%)                      1 (2.38%)                       5 (10.64%)
                                  55 SNPs                        0 (0.00%)                     39 (100.00%)                      0 (0.00%)                       8 (17.02%)
                                 122 SNPs                        0 (0.00%)                     36 (100.00%)                      0 (0.00%)                      11 (23.40%)
                                 164 SNPs                        0 (0.00%)                     34 (100.00%)                      0 (0.00%)                      13 (27.66%)
                                  210 AIMs                       0 (0.00%)                     33 (100.00%)                      0 (0.00%)                      14 (29.79%)
Rio de Janeiro                    46 indels                      8 (4.60%)                     129 (74.14%)                     37 (21.26%)                     40 (18.69%)
                                  55 SNPs                        0 (0.00%)                     151 (90.96%)                      15 (9.04%)                     48 (22.43%)
                                 122 SNPs                        1 (0.63%)                     134 (84.81%)                     23 (14.56%)                     56 (26.17%)
                                 164 SNPs                        0 (0.00%)                     137 (91.95%)                      12 (8.05%)                     65 (30.37%)
                                  210 AIMs                       0 (0.00%)                     135 (91.22%)                      13 (8.78%)                     66 (30.84%)

“Rejected” – none of the four reference populations was defined as a possible population of origin of the profile; z-score > 1.64, p-value < 0.05; “Accepted” – at least
one of the four reference populations was defined as a possible population of origin of the profile; z-score ≤ 1.64, p-value ≥ 0.05; “Ambiguous” – accepted in more
than one population with non-significantly different likelihoods; “Concordant” – accepted in the true population of origin or, when accepted in more than one population, a
significant higher likelihood was obtained for the true population of origin; “Discordant” – accepted in a population that was not the true population of origin, or accepted
in the true population but with a significantly lower likelihood than in another.

Frontiers in Genetics | www.frontiersin.org                                          15                                               August 2020 | Volume 11 | Article 966
Pereira et al. Ancestry Inferences in Admixed Populations FIGURE 14 | Values of z-score for the 65 sibling pairs when tested against Rio de Janeiro, AFR, EUR, and NAM population samples. In forensic genetics, it is important to consider the population presence of population substructure in Rio de Janeiro (Simão stratification in the definition of allele frequency databases, et al., 2018). In summary, the results obtained in this study and sub-structuring levels are also relevant for adjusting match highlight the importance of having large sample sizes to probabilities (Curran et al., 2002; Buckleton et al., 2016; Hessab investigate population substructure in admixed populations. et al., 2018). In contrast to many North American populations, Although statistically significant deviations to HWE could there are admixture gradients within populations in South only be detected for a single marker when applying Bonferroni America, which makes it difficult to define ethnic subgroups correction, the results indicated the need of studying a larger except for some Native and Afro-descendant communities that sample from Rio de Janeiro to investigate an overall excess of have maintained a certain degree of cultural identity and observed homozygosity. geographical isolation. The 210 AIMs are essentially biallelic and a smaller number of individuals is usually necessary for accurate allele frequency Ancestry Estimations in South American estimations compared to multiallelic STRs. However, large Admixed Populations sample sizes are required to detect HWE deviations and linkage In the last few years, many studies have been published reporting disequilibrium that are more likely to occur in recently admixture new AIM sets to determine the proportion of intercontinental and/or stratified populations (Kling et al., 2015). individual admixture and to infer BGA. Selected sets of different No deviations from HWE have so far been reported for types of AIMs have been proposed based on their ability to the commonly used STRs in admixed Brazilian populations determine population clustering patterns (Soundararajan et al., (Rodrigues et al., 2007; de Assis Poiares et al., 2010; Alves 2016; Kidd et al., 2017). In most cases, these panels were based et al., 2014; Hessab et al., 2015; Moyses et al., 2017). This on their ability to correctly assign the origin of individuals may be attributed to the relatively small sample sizes since from African, Eastern Asian, European, Oceanian, and Native small deviations can only be detected in large samples. American populations. Less often, a higher resolution was Furthermore, STRs selected for forensic identification have a high pursued within one of these five groups (e.g., Li et al., 2016; Bulbul intrapopulation diversity and low intercontinental variability. et al., 2018; Jung et al., 2019; Verdugo et al., 2020). Regardless Therefore, they are less efficient for the detection of HWE of the ability of these sets to separate populations from different deviations in admixed populations than AIMs. In most forensic continents or geographic regions, the uncertainty associated genetic publications, the authors employ Bonferroni adjustments with the estimates provided by these panels and their capacity whenever HWE p-values surpass the predefined significance level to accurately report the different ancestral contributions in (usually 5%). However, no further consideration concerning the individuals of admixed populations has rarely been investigated. result itself or the sample size is usually made, which neglects the This work aimed to compare the results of different groups possibility of population stratification (Ye et al., 2020). of AIMs currently in use in the forensic field and their ability to Lineage markers may also be useful to detect intrapopulation determine the admixture proportions of a population, the profile substructure since they present strong geographical of an individual’s ancestry, and the assignment of its population differentiation. The presence of gametic associations between of origin in admixed populations from South America. autosomal, mtDNA, and Y-chromosomal markers can be due At the population level, all AIM sets reported similar to recent admixture and population stratification (Vullo et al., population profiles in terms of the relative proportions of AFR, 2015). A study carried out in the Brazilian population of Rio EUR, and NAM components in the seven admixed American de Janeiro showed a gametic association between autosomal populations. However, the absolute ancestry values were quite AIMs and mtDNA haplogroups. This association between variable. Comparisons made for panels with different numbers unlinked markers supports our hypotheses regarding the of markers and different ability to differentiate the three main Frontiers in Genetics | www.frontiersin.org 16 August 2020 | Volume 11 | Article 966
You can also read