Mitigating Pandemic Risk with Influenza A Virus Field Surveillance at a Swine-Human Interface - bioRxiv
←
→
Page content transcription
If your browser does not render page correctly, please read the page content below
bioRxiv preprint first posted online Mar. 21, 2019; doi: http://dx.doi.org/10.1101/585588. The copyright holder for this preprint
     (which was not peer-reviewed) is the author/funder, who has granted bioRxiv a license to display the preprint in perpetuity.
                                  It is made available under a CC-BY-NC-ND 4.0 International license.

     Mitigating Pandemic Risk with Influenza A Virus
     Field Surveillance at a Swine-Human Interface
Benjamin L. Rambo-Martin1†, Matthew W. Keller2†, Malania M. Wilson1, Jacqueline M. Nolting3, Tavis
K. Anderson5, Amy L. Vincent5, Ujwal Bagal1, Yunho Jang4, Elizabeth B. Neuhaus4, C. Todd Davis4,
Andrew S. Bowman3, David E. Wentworth4, and John R. Barnes4*

1
Battelle Memorial Institute, Atlanta, Georgia, USA
2
Oak Ridge Institute of Science and Education (ORISE), Oak Ridge, Tennessee, USA
3
The Ohio State University, Department of Veterinary Preventive Medicine, Columbus, Ohio, USA
4
Influenza Division, National Center for Immunization and Respiratory Diseases (NCIRD), Centers for
Disease Control and Prevention (CDC), Atlanta, Georgia, USA
5
 National Animal Disease Center, Agricultural Research Service (ARS), United States Department of
Agriculture (USDA), Ames, Iowa, USA
Running Title: Portable Influenza A Virus Surveillance

*Address correspondence to fzq9@cdc.gov

†B.L.R.-M. and M.W.K. contributed equally to this work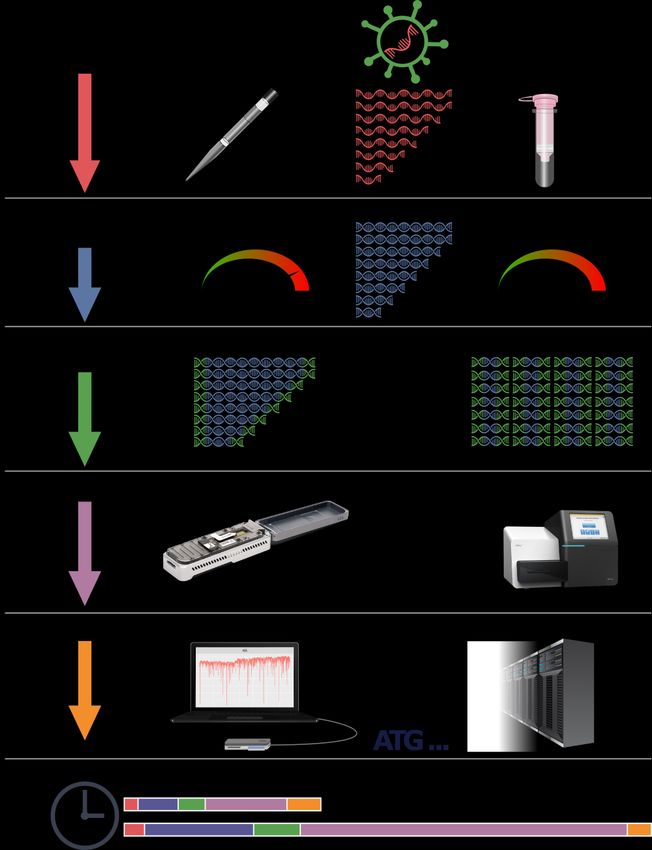
bioRxiv preprint first posted online Mar. 21, 2019; doi: http://dx.doi.org/10.1101/585588. The copyright holder for this preprint
  (which was not peer-reviewed) is the author/funder, who has granted bioRxiv a license to display the preprint in perpetuity.
                               It is made available under a CC-BY-NC-ND 4.0 International license.

         Working overnight at a large swine exhibition, we identified an influenza A virus (IAV)
outbreak in swine, nanopore-sequenced 13 IAV genomes from samples collected, and in real-
time, determined that these viruses posed a novel risk to humans due to genetic mismatches
between the viruses and current pre-pandemic candidate vaccine viruses (CVV). We developed
and used a portable IAV sequencing and analysis platform called Mia (Mobile Influenza
Analysis) to complete and characterize full-length consensus genomes approximately 18 hours
after unpacking the mobile lab. Swine are important animal IAV reservoirs that have given rise
to pandemic viruses via zoonotic transmission. Genomic analyses of IAV in swine are critical to
understanding pandemic risk of viruses in this reservoir, and characterization of viruses
circulating in exhibition swine enables rapid comparison to current seasonal influenza vaccines
and CVVs. The Mia system rapidly identified three genetically distinct swine IAV lineages from
three subtypes: A(H1N1), A(H3N2) and A(H1N2). Additional analysis of the HA protein
sequences of the A(H1N2) viruses identified >30 amino acid differences between the HA1
portion of the hemagglutinin of these viruses and the most closely related pre-2009 CVV. All
virus sequences were emailed to colleagues at CDC who initiated development of a
synthetically derived CVV designed to provide an optimal antigenic match with the viruses
detected in the exhibition. In subsequent months, this virus caused 13 infections in humans,
and was the dominant variant virus in the US detected in 2018. Had this virus caused a severe
outbreak or pandemic, our proactive surveillance efforts and CVV derivation would have
provided an approximate 8 week time advantage for vaccine manufacturing. This is the first
report of the use of field-derived nanopore sequencing data to initiate a real-time, actionable
public health countermeasure.

         Mobile sequencing technology, specifically the MinION sequencing platform from Oxford
Nanopore Technologies (Oxford, UK), has successfully generated rapid genomic surveillance data on-
site during outbreaks of Ebola1, Zika2, and Lassa3 viruses. These studies relied on transfer of raw read
data to centralized institutions harboring high-performance computational resources to perform
extensive phylogenetic analyses. These analyses resulted in a deep understanding of the viral
evolution before and during the outbreak, as well as estimation of transmission chains. Their reliance
on vast databases and computationally intensive algorithms limited their ability to influence real-time
prevention strategies and potentially stop further transmission events. Furthermore, the lack of vaccines
to these viruses meant that the real-time derived sequence data could not be leveraged to identify a
suitable vaccine. On the other hand, influenza viruses have multiple enzootic reservoirs, cause annual
epidemics in humans, and rapidly evolve, which necessitates constant genomic surveillance and
iterative vaccine development. Given this need, we have an opportunity to mitigate the risk of an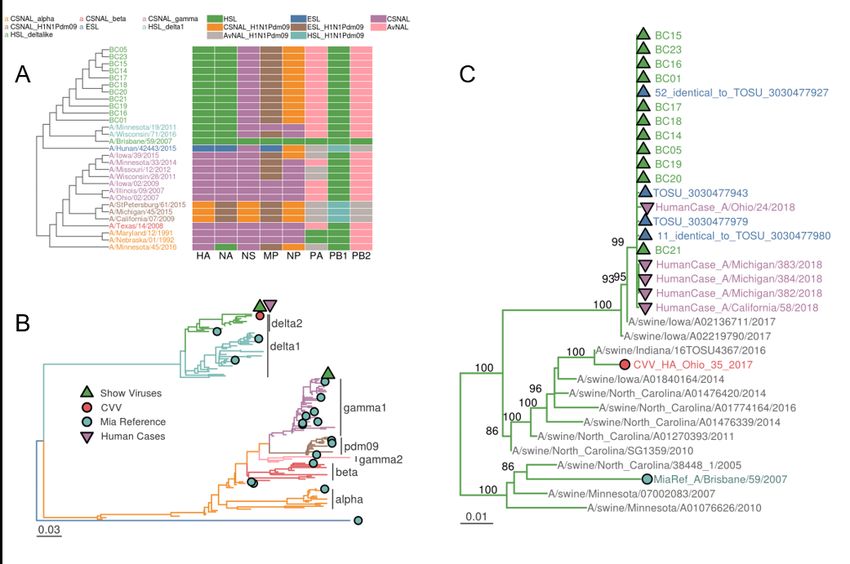
bioRxiv preprint first posted online Mar. 21, 2019; doi: http://dx.doi.org/10.1101/585588. The copyright holder for this preprint
  (which was not peer-reviewed) is the author/funder, who has granted bioRxiv a license to display the preprint in perpetuity.
                               It is made available under a CC-BY-NC-ND 4.0 International license.

influenza outbreak at its source in real-time by analyzing the viral genomes present and, subsequently,
developing the best matched candidate vaccine virus (CVV).

          Influenza A viruses (IAV) circulating in swine have the potential to infect humans and are
capable of causing pandemics4, as evidenced by the 2009 H1N1 pandemic (Figure 1). Since the 2009
H1N1 pandemic, there have been 464 human cases of swine-origin influenza viruses (termed variant
influenza viruses) resulting from exposure to swine, most commonly during attendance at agricultural
fairs. The worst outbreak since 2009 occurred during the summer of 2012 and resulted in at least 306
H3N2 variant cases across 10 US states5. These cases were primarily pediatric, with half of the cases
under the age of 7. While the majority of post-2009 pandemic variant virus infections resulted in mild
influenza-like illness (ILI), 16 pediatric hospitalizations and one pediatric fatality were reported. Since
the majority of variant virus infections have been detected in children less than 18 years of age6, there
is an increased risk for onward transmission in day-care settings and schools if a variant virus
possessed the ability for human-to-human transmission. Thus far, human-to-human transmission of
known variant outbreaks has been limited based on available epidemiologic data. However, due to the
sporadic nature of these infections, the immunologically naïve population affected, and the persistent
circulation of evolutionarily diverse IAV in the swine host, the Centers for Disease Control and
Prevention and other World Health Organization (WHO) Collaborating Centers for Influenza and
Essential Regulatory Laboratories have developed pre-pandemic candidate vaccine viruses (CVVs)
that target specific swine influenza virus subtypes and HA gene lineages that have caused variant virus
infections7. To date, eleven CVVs representing antigenically diverse groups of swine influenza viruses
have been proposed or already developed for pre-pandemic preparedness purposes8. Ongoing
surveillance efforts to assess the suitability of existing CVVs focus on the genetic and antigenic
characterization of variant viruses detected in humans, but may also rely on characterization of viruses
identified in swine in order to forecast which viruses are more likely to circulate at the animal-human
interface and result in future human infections. This work involved sampling a large exhibition swine
population in order to detect and characterize swine viruses in support of surveillance and forecasting
activities.

         Exhibition swine have a greater risk for viral spillover into humans as compared to production
swine due to their close and protracted interaction with people and their nation-wide travel9. Exhibitors
travel with their swine across geographical regions in the US to attend national, state, and local
exhibitions. At these exhibitions, swine of various ages and from many geographical regions
intermingle. Throughout the exhibition, swine are walked around the barns, shuttled into staging pens,
and exhibited in a corral simultaneously with a dozen or more swine. The swine are typically
shepherded by children as many exhibition rules require that individuals presenting a swine within the
exhibition ring be under the age of 20. The exhibition itself can last up to a week, during which time
bioRxiv preprint first posted online Mar. 21, 2019; doi: http://dx.doi.org/10.1101/585588. The copyright holder for this preprint
  (which was not peer-reviewed) is the author/funder, who has granted bioRxiv a license to display the preprint in perpetuity.
                               It is made available under a CC-BY-NC-ND 4.0 International license.

swine are living in immediate proximity to others and have direct contact with humans. Children, in
particular, may be immunologically naïve to swine influenza viruses that are genetically and
antigenically distinct from recent seasonal influenza viruses or vaccines to which they have been
exposed6. The increased risk at this unique interface warrants concerted proactive surveillance and
simultaneously serves as a proving ground for new real-time in-field genomic approaches to help
prevent zoonotic infections and potential outbreaks. Due to the lengthy process of collecting samples in
the field and shipping them to centralized laboratories, genome sequencing and analysis often occurs
several weeks or months after sample collection. Thus, the current surveillance process is less able to
contribute real-time data during the emergence of pandemic threats10. Here, we describe the
development and deployment of a rapid and portable IAV sequencing pipeline we call Mia [miə, MEE-
uh]: Mobile Influenza Analysis and genomic results obtained from this surveillance.

Results
Development of the Mia Platform
         We created a mobile influenza genomics platform to estimate the risk to humans posed by
viruses within a local IAV outbreak by performing in-field extraction and amplification of influenza A
viruses, complete genome sequencing and automated genome assembly, BLAST comparisons,
phylogenetic analysis and variant detection to candidate vaccine viruses. We used our high-throughput
influenza virus sequencing pipeline11 as a template for developing Mia (Figure 2). Our goal was a rapid
workflow in a compact platform that is easily transported by two people on a commercial airliner. For
RNA extraction, we elected to use Akonni Biosystems’ TruTip Rapid RNA kit due to its small footprint
and demonstrated effectiveness on influenza A viruses 12. We chose the mini8 by MiniPCR due to its
small size, ability to run 8 samples at a time, low cost, low power needs, and overall simplicity. Due to
the high fidelity of our rapid amplification strategy 11, we were able to simplify amplicon quality control
from fragment analyzation to fluorometric quantification, which is already a necessary step for amplicon
pooling. For sequencing, we chose the nanopore sequencing platform MinION for the extremely small
size, rapid sequencing speed, and live access to data as it is sequencing. The final inventory is
available in Table S1.

Sample Processing
         Our surveillance target was a large agricultural event featuring exhibition swine. The swine
began arriving on Sunday (day 0) and received an initial veterinary screening upon entry. We began
scouting swine on day 3 for influenza-like illness (ILI) and noted the locations in the exhibition barn of
animals with clinical signs of respiratory disease. During the day, the barns were very crowded with
swine, presenters, their families, farm hands, visitors and event staff. To avoid interfering with the
bioRxiv preprint first posted online Mar. 21, 2019; doi: http://dx.doi.org/10.1101/585588. The copyright holder for this preprint
(which was not peer-reviewed) is the author/funder, who has granted bioRxiv a license to display the preprint in perpetuity.
It is made available under a CC-BY-NC-ND 4.0 International license.
event’s proceedings, the swabbing and sequencing was conducted during the event’s off-hours.
Beginning at 4 AM on day 4, we swabbed ILI-identified swine and their pen neighbors (n=94) for
influenza A virus (IAV) with Flu DETECT® Swine Kits. We detected seven IAV positive samples, but
suspected additional samples collected from pen neighbors might be positive by sequence analysis. At
11 PM on day 4, we erected the Mia platform inside the exhibition barn and began the workflow on 24
samples collected from the rapid test positive swine and their immediate neighbors. We began RNA
extraction at 11:40 PM, amplification of the full genome at 12:47 AM, and quantified barcoded
amplicons at 4:30 AM. Sample concentrations ranged from to 12.7 to 41.9 ng/µL (Table S2). We
normalized and pooled the barcoded samples to 1 µg total, and began library construction at 4:50 AM.
The final library amounted to 279 ng.
The library was ready for sequencing at 6 AM, however the MinKNOW controller software on an
Ubuntu 16.04 operating system failed to recognize multiple MinION sequencers. We were able to use a
cellphone as a mobile hotspot to download and install the latest version of MinKNOW. This fix required
MinKNOW and sequencing on the Windows 10 partition, which negated use of our real-time Linux-
based analytical pipeline. At this time people were arriving at the barn to begin exhibition activities and
to avoid disrupting the event, once the sequencing was initiated, we transported the sequencer
attached to the laptop powered by the laptop’s battery to our hotel room via automobile. Following 6
hours of sequencing, we stopped the run and transferred the raw fast5 data onto the Ubuntu partition,
which initiated the analyses.
Base-calling and Genome Assembly
Sequencing produced 99,988 reads that were base-called and demultiplexed with Albacore
v.2.2.7. A total of 67,105 reads passed a basic QC threshold Q-value ≥ 7 and 22,552 of these reads
were assigned to one of 24 barcodes (Figure S1). The distribution of read lengths followed an
expected pattern with peaks corresponding to IAV segment lengths (Figure S1). We assembled
demultiplexed reads with IRMA13 and obtained full IAV genomes for 13 of the 24 samples, including all
samples that had Ct values < 30 (Ct 30 ≃ 100 EID50, data not shown) (Table 1, Table S3, and
Figures S2-21).
Real-Time Phylogenetic Analysis
We produced automated per-segment nucleotide alignments from all sequenced samples and a
reference panel of variant IAVs that were transmitted from swine to humans between 2003 and 2016.
The reference panel of viruses has broad diversity including swine-origin viruses of classical swine
lineages [1A.1 (H1-α), 1A.2 (H1-β), 1A.3.3.3 (H1-γ)], human seasonal lineages (1B.2.1 (H1-δ2) and
1B.2.2 (H1-δ1)), Eurasian avian-like lineages (1C.1 and 1C.2), avian-origin North American lineage,
and human seasonal lineages (H3, H1 pdm09, N1 and N2)14-17. Each segment-alignment was
automatically built into separate phylogenetic trees alongside a heat map displaying the top BLASTbioRxiv preprint first posted online Mar. 21, 2019; doi: http://dx.doi.org/10.1101/585588. The copyright holder for this preprint
(which was not peer-reviewed) is the author/funder, who has granted bioRxiv a license to display the preprint in perpetuity.
It is made available under a CC-BY-NC-ND 4.0 International license.
result per segment against the annotated references (Figures S22-29). Viruses collected during our
investigation included 1 H3N2 (barcode 22), 1 H1N1 (barcode 06) and 11 H1N2 (barcodes 01, 05, 14-
21, and 23). These 11 H1N2 viruses contained identical genome constellations. Both the HA and NA
gene segments were closely related to 2017/2018 H1N2 influenza viruses circulating in the U.S. swine
population and have been sporadically detected in previous A(H1N2)v zoonotic infections. The HA
gene segments belonged to the delta 2 sublineage or clade 1B.2 according to the swine influenza virus
H1 HA global nomenclature system. This lineage is common to swine in the U.S. and is derived from
human, seasonal H1N1 virus that was transmitted from humans to pigs in the early 2000s18. Each of
the H1N2 viruses possessed an NA gene derived from the 1998 human, seasonal H3N2 lineage now
found in U.S. swine influenza viruses. This NA is a distinct gene lineage from the NA gene found in the
closest CVV, A/Ohio/35/2017 (2002 human, seasonal NA lineage).The PB2, PB1, PA, and NS gene
segments were of triple reassortant internal gene cassette (TRIG) origin, commonly found in swine
influenza viruses in the U.S. The NP and M gene segments belonged to the 2009 H1N1 pandemic virus
lineage (Figure 3A).
Real-Time Comparison of HA1 proteins to Candidate Vaccine Viruses
Our automated real-time pipeline also provided amino acid difference tables of the mature HA1
protein sequence versus a set of WHO candidate vaccine viruses (CVV). A/Ohio/9/2015 and
A/Ohio/13/2017 were the nearest CVVs to the H1N1 and H3N2 viruses and had 2 and 0 antigenic
changes, respectively. These two viruses also had relatively low sequence coverage of the HA
segment (Figures S4 & S19). A/Ohio/35/2017 was the most similar CVV in our database to the 11
H1N2 viruses and had 32 amino acid differences compared to their consensus sequence (Figure 4,
Figure S30, and Table S4). Seven differences were identified in predicted H1 antigenic sites, including
4 in antigenic sites A or B19. More generally, the H1N2 virus HA genes were only ~93% identical to the
nucleotide sequence of Ohio/35/2017 and, as discussed above, had NA genes belonging to different
ancestral lineages. Based on the genetic differences and markers of antigenic drift detected by the
analysis, the HA and NA consensus sequences, including UTRs, were electronically transmitted to
CDC’s Vaccine Preparedness Team in the Influenza Division to initiate the development of a synthetic
candidate vaccine virus. We were able to start this intervention from the field roughly 18 hours after the
initial setup of Mia (Table S5).
Post-Field Analyses
To assess the MinION-derived sequence accuracy we transported RNA and DNA amplicons
created onsite to the CDC in Atlanta, GA for confirmatory sequencing via Illumina MiSeq using the
standard Influenza Genomic Team’s (IGT) surveillance pipeline13. On the MiSeq, 13 samples had
completed genomes with average coverage ≥ 100x for each segment (IGT’s standard QC threshold).
Of those 13, 12 had MinION-derived mean coverage of ≥ 5x across segments with 8 having ≥ 20xbioRxiv preprint first posted online Mar. 21, 2019; doi: http://dx.doi.org/10.1101/585588. The copyright holder for this preprint
(which was not peer-reviewed) is the author/funder, who has granted bioRxiv a license to display the preprint in perpetuity.
It is made available under a CC-BY-NC-ND 4.0 International license.
coverage across HA, the primary target of protective immune responses and the most important protein
for vaccine development (Table S3). There was high concordance (R2 = 0.87; Figure S31) of mean
segment coverage produced by MinION and MiSeq for field-derived amplicons. Consensus identities
averaged 99.3% across the 13 genomes (Table S3).
As our real-time Mia database contained human-cases of swine IAV, we performed additional
post-field phylogenetic analyses using the outbreak data, the Mia database, and additional swine IAV
sequences that represent the genetic diversity and evolutionary relationships of contemporary swine
IAV14,15,20. When compared to 126 swine H1 sequences, our Mia identified swine-H1N2 viruses were in
a monophyletic clade with contemporary 1B.2.1 (H1-δ2) HA genes from the human seasonal lineage
(Figure 3). These viruses predominantly pair with N2 sequences that have been circulating in swine
since at least 1998 as part of a triple reassortment (TRIG) group of viruses15,16 (Figures 1 and S36).
Across all segments, MiSeq-derived data mirrors the tree topology created in real-time in the field from
MinION-derived sequences (Figures 3, S22-29, and S33-41).
To compare the viral diversity we found in our MinION-derived viral sequences to what fully
existed at the exhibition, we performed our standard IAV surveillance procedure in which we sampled
425 additional swine regardless of ILI. From these samples, we detected 136 (32%) IAV-positive
specimens by RT-PCR and successfully sequenced 65 full genomes on a MiSeq. We found that the
diversity of viruses collected and sequenced by more traditional surveillance methods was also
detected in similar proportions by our Mia field-sequencing (Figures 3 and S33-41).
Materials and Methods
Logistics
Our instrument inventory was finalized after three full practice runs and consisted of three main
pieces of luggage to transport Mia (Table S1, Figure S43). We used a Pelican (Torrance, CA, USA) Air
1615 (internal dimensions: 75.16 x 39.37 x 23.82 cm) to transport plastic consumables, ambient
temperature liquids, PPE, racks, pipettes, and power strips. This is a larger suitcase that was checked
during air travel. We used a smaller Pelican 1510 (internal dimensions: 50.3 x 27.94 x 19.3 cm) to
transport the electronic equipment including the MinIONs, thermocyclers, vortex, microfuge, and qubit.
While this case is extremely rugged and would likely fare well against the checked baggage handling,
we were concerned about damage during luggage inspection and opted to carry this onto the plane.
We also carried on the laptop inside of a backpack. Our cold-chain was maintained during
transportation in an Ozark Trail (Potosi, MO, USA) 26 quart certified bear-resistant cooler (internal
dimensions: 27.3 x 40.64 x 22.86 cm). To simultaneously transport materials at -20°C and +4°C, the
cooler was partitioned with a 7.6 cm piece of Styrofoam cut to a snug fit. All enzymes and reagents
requiring storage at -20°C were stored in a cold block and surrounded with frozen cold packs in thebioRxiv preprint first posted online Mar. 21, 2019; doi: http://dx.doi.org/10.1101/585588. The copyright holder for this preprint
(which was not peer-reviewed) is the author/funder, who has granted bioRxiv a license to display the preprint in perpetuity.
It is made available under a CC-BY-NC-ND 4.0 International license.
bottom of the cooler. Primers and flowcells were stored at +4°C on top of the Styrofoam and were
surrounded by refrigerated cold packs. We maintained the cold chain on site by storing reagents in a
hotel refrigerator/freezer before repacking the cooler to transport the reagents to the exhibition barn.
The SuperScript IV was shipped to the barn on dry ice at the insistence of the manufacturer. Since
ethanol over 70% cannot be transported on a commercial airliner, it was shipped via ground
transportation. For a work bench, we used a small folding table found at the event and purchased
plastic table cloths, Lysol, and extra garbage bags locally. To avoid disrupting the event, we setup Mia
inside a horse stall near the pigs and worked overnight (Figure S44).
Diagnostic screening and sampling
To confirm the presence of IAV and to identify the location of outbreak clusters, we screened 94
swine displaying ILI with Flu DETECT® (Bridgewater, NJ, USA) Influenza A Virus Swine rapid tests via
nasal swabs. We performed the screening early in the morning to locate IAV positive swine and
returned to the same location for sampling and sequencing later that evening. It should be noted that
due to logistical challenges, we used standard cotton swabs instead of the provided swabs, which likely
contributed to the high false negative rate of the tests21.
We selected 24 swine for respiratory-sample collection and sequencing which included the
seven positives from the screen and their immediate neighbors. We sampled these swine via sterile
gauze nasal wipes and submersion in 5 ml brain heart infusion (BHI) media22,23.
RNA Extraction
Immediately after sampling, we extracted RNA from the BHI samples using the Akonni TruTip®
(Frederick, MD, USA) Rapid RNA kit according to the manufacturer’s instructions with minor
modifications 12. We extracted the samples in a 96 deep well block using a manual 12 channel 1000 µL
pipette. Before lysis, we diluted the 70 µL samples with 180 µL of water and spiked them with 0.5 µg of
Qiagen (Venlo, Netherlands) carrier RNA. We eluted the samples in 70 µL of water that had been
warmed to 75°C.
Amplification, Barcoding, Library Preparation, and Sequencing
We amplified the full influenza A virus genome using a recently described fast multi-segment
reverse transcription polymerase chain reaction (fMRT-PCR)11 with some modifications for portability.
We used three miniPCR™ (Cambridge, MA, USA) mini8 thermocyclers under laptop control for elution
buffer heating, fMRT-PCR, barcoding, and library preparation. Following barcoding, we quantified the
products using a Qubit™ (Thermo Fisher Scientific, Waltham, MA, USA) DNA BR/HS assay. The
quantification data allowed us to normalize and pool the barcodes and served as our only quality
control check during the molecular workflow. Once pooled, we prepared the amplicons for nanopore
sequencing using the SQK-LSK 108 library kit (Oxford Nanopore Technologies, Oxford, UK). This
protocol required cooling to 20°C; however, the temperature in the barn was roughly 30°C, and the fan-bioRxiv preprint first posted online Mar. 21, 2019; doi: http://dx.doi.org/10.1101/585588. The copyright holder for this preprint
(which was not peer-reviewed) is the author/funder, who has granted bioRxiv a license to display the preprint in perpetuity.
It is made available under a CC-BY-NC-ND 4.0 International license.
cooled mini8 thermocyclers could not get below ambient temperature. To solve this issue, we placed
the thermocycler on a bed of ice, which effectively lowered the ambient temperature and allowed the
mini8 to cool to 20°C. We sequenced the pooled samples on a MinION Mk 1B nanopore sequencer
using flowcell FAH58363 equipped with R9.5.1 chemistry.
Real-Time Analyses
For real-time analyses, we used a high performance Dell (Round Rock, TX, USA) Precision
7720 laptop with 64GB ram, four-core Intel Xeon 3.00GHz CPU E3-1505M v6 (2 threads/core) and two
1TB solid state hard drives, partitioned separately into a Windows 10 OS and Ubuntu 16.04 OS. Mia’s
custom analytical application runs on the Ubuntu partition and initiates automatically via crontab upon
MinION read file (fast5) origination during active sequencing. We base called and demultiplexed fast5
read files with Albacore v.2.2.7 (Oxford Nanopore Technologies, Oxford, UK) and assembled
subsequent fastq files into consensus sequences with IRMA v.0.6.713. We used a custom MinION
configuration module for IRMA that changes the default ‘FLU’ module parameters as follows: dropping
the median read Q-score filter from 30 to 0, raising the minimum read length from 125 to 150, raising
the frequency threshold for insertion and deletion refinement from 0.25 to 0.75 and 0.6 to 0.75
respectively, and lowering the Smith-Waterman mismatch penalty from 5 to 3 and the gap open penalty
from 10 to 6. We checked consensus sequences against a local database containing clade-annotated
IAV sequences with BLASTn v.2.7.1+24 and used top BLAST matches to interpret a sample’s IAV
genome constellation. We aligned consensus sequences against reference sequences with MUSCLE
v.3.8.3125. We built phylogenetic trees with FastTree v.2.1.8 Double Precision26 with a generalized
time-reversible model, branch lengths optimized under a gamma distribution, and local support values
produced from bootstrap sampling 10,000 times and visualized the trees in R v.3.4.4 with GGtree27. We
determined amino acid differences to each candidate vaccine virus sequence in our database with a
custom Python script that translates DNA consensus sequences and MUSCLE aligns the mature HA1
protein sequences. Analytical and processing status results were fed into a SQLite v.3.11.0 (Hwaci Inc.
Charlotte, NC) database and visualized in a web browser with an interactive R-shiny28 application.
Reads are processed in 4,000-read batches for the first 5 iterations, followed by 20,000-read
batches for another 5 iterations and then 40,000-read batches until reads are no longer produced by
the sequencer. This stepwise batching provides the user an understanding of the run’s quality within
minutes of sequencing, allowing the user to decide if it is worth continuing the run while maximizing
computational resources. Results seen within the first hour of sequencing track across a 6- or even 48-
hour run, with the extended run time increasing coverage and resolving a scant number of consensus
bases 11.bioRxiv preprint first posted online Mar. 21, 2019; doi: http://dx.doi.org/10.1101/585588. The copyright holder for this preprint
(which was not peer-reviewed) is the author/funder, who has granted bioRxiv a license to display the preprint in perpetuity.
It is made available under a CC-BY-NC-ND 4.0 International license.
Post-Field Analyses
We transported field-derived RNA and amplicons on dry ice back to the CDC in Atlanta, GA and
processed them with the Influenza Genomics Team’s standard Illumina (San Diego, CA, USA) MiSeq
influenza surveillance pipeline. We processed and assembled reads with IRMA’s FLU-sensitive module
13
and calculated the identity of MinION-derived consensus sequences based on alignment to the
sample’s MiSeq-derived consensus, considered the gold standard. Out of 425 swine sampled through
our standard surveillance efforts at the exhibition, 136 tested positive for IAV by RT-PCR. Complete
genome sequencing via our standard Illumina pipeline was attempted on 79 of those and produced 65
full genomes.
We performed phylogenetic analyses with MiSeq produced sequences and an annotated set of
swine-IAV sequences. The annotated dataset was constructed by downloading all publicly available
swine IAV data collected in North America from the Influenza Research Database29 on June 1, 2018.
Each gene was aligned with MAFFT v7.294b30 and the best-known maximum likelihood phylogeny for
each alignment was inferred using IQ-TREE v1.6.231, with the model of molecular evolution
automatically selected during the tree search. Each gene was classified to evolutionary lineage and/or
phylogenetic clade15,17,20. Subsequently, we selected 3-10 viruses from each named clade that captured
the evolutionary relationships among clades, and that represented the major HA, NA, and whole
genome constellations circulating in US swine15,20. We then aligned the MiSeq and annotated
sequences with MUSCLE v.3.8.3125 and inferred maximum likelihood trees using IQ-TREE24 v.1.6.8
implementing a generalized time-reversible model of nucleotide substitution with gamma-distributed
rate heterogeneity across sites while allowing for a proportion of invariable sites and 1000 ultra-fast
bootstrap approximations32 (iqtree –m GTR+G+I –bb 1000).
Discussion
We successfully developed a mobile NGS suite called Mia and deployed it to a high priority
swine-human interface that resulted in our identification of an influenza A virus outbreak. The data
generated indicated that while multiple lineages were co-circulating, available candidate vaccine
viruses (CVVs) were less likely to be adequate antigenic matches if the predominate viruses were to
emerge in humans. Therefore, the sequence data was used to initiate synthesis of an optimal CVV
within 18 hours of unpacking Mia. This proactive strategy of identifying the predominant swine influenza
viruses in exhibition pigs prior to the start of annual agricultural fairs in the USA proved to be very
useful as zoonotic infections caused by the predominate A(H1N2) virus found in exhibition pigs were
detected in humans exposed at fairs in July and August 201833.
We created Mia by selecting and optimizing laboratory equipment that fits into two standard
sized suitcases that can be set up and operated in the field by two people to produce a high-qualitybioRxiv preprint first posted online Mar. 21, 2019; doi: http://dx.doi.org/10.1101/585588. The copyright holder for this preprint
(which was not peer-reviewed) is the author/funder, who has granted bioRxiv a license to display the preprint in perpetuity.
It is made available under a CC-BY-NC-ND 4.0 International license.
multiplexed NGS amplicon library in 7 hours. Also in the field, we performed base calling, quality
control, genome assembly, phylogenetic analysis, BLAST searching, and amino acid comparisons to
current CVVs without an internet connection. We were able to monitor all these results via our custom
automated application on a laptop. The numerically dominant subtype we detected were H1N2 swine
influenza viruses that were genetically different from the most similar WHO pre-pandemic CVV. We
determined that these viruses posed a risk of causing disease in a young population, as similar H1
viruses disappeared from seasonal circulation in humans in 2010 and were replaced by the 2009 H1N1
pandemic virus. Approximately 18 hours after sampling, we emailed consensus sequences of these
viruses to CDC for immediate synthesis of a new H1N2 CVV.
By returning RNA from the field, we were able to confirm the sequencing results with our
Illumina sequencing pipeline 13. Without considering a coverage threshold for the nanopore data, we
sequenced 13 full genomes in the field. These same 13 samples were also successfully sequenced in
the lab on an Illumina MiSeq. This, at least partially, confirmed the sensitivity of our field based method.
By comparing MiSeq and MinION produced sequencing, we saw that the maximum MinION-derived
sequence accuracy is achieved between 10-20x mean fold coverage (Figure S32). If we apply a 20x
coverage threshold to the nanopore data, then only 4 genomes were successful in the field, but with 8
HA segment sequences passing. Importantly, the HA sequence is the most critical for making vaccine
strain determinations. In future experiments, we can ensure coverage thresholds are met by monitoring
coverage in real-time and more deliberately deciding when to stop sequencing, rather than simply
sequencing for a defined 6 hours as we did here. Illumina sequencing also allowed us to confirm the
accuracy of our in-field generated consensus sequences (99.3% overall). This level of accuracy
confirms the validity of the suite of analyses that we performed in the field with the nanopore data.
While speed is a primary success of our work, there remains room for improvement. A major
delay in this effort was an Oxford Nanopore Technologies’ software controller (MinKNOW) issue that
failed to recognize and connect to the sequencer. The fix for this took 34 minutes and required
sequencing on the Windows partition of the laptop whereas the analysis software runs on the Linux
partition. This resulted in our automated analysis pipeline not having access to the raw sequencing data
until we terminated the sequencing experiment after 6 hours and transferred the data across the
partition. This issue has since been resolved and would now save us up to 6 hours on the entire
workflow, depending on the read generation rate of a given sequencing run. We are also developing a
containerized version of Mia that will be able to run on any operating system that supports Docker
(Docker Inc, San Francisco, CA), including Windows and Mac. Moreover, we are now incorporating the
use of Oxford Nanopore Technologies’ (Oxford, UK) MinIT portable GPU base caller that will
dramatically reduce the time of base calling, our analytical pipeline’s tightest bottleneck.bioRxiv preprint first posted online Mar. 21, 2019; doi: http://dx.doi.org/10.1101/585588. The copyright holder for this preprint
(which was not peer-reviewed) is the author/funder, who has granted bioRxiv a license to display the preprint in perpetuity.
It is made available under a CC-BY-NC-ND 4.0 International license.
Direct RNA sequencing of IAVs has recently been demonstrated, and while this technique is
extremely fast (bioRxiv preprint first posted online Mar. 21, 2019; doi: http://dx.doi.org/10.1101/585588. The copyright holder for this preprint
(which was not peer-reviewed) is the author/funder, who has granted bioRxiv a license to display the preprint in perpetuity.
It is made available under a CC-BY-NC-ND 4.0 International license.
display. Mention of trade names or commercial products in this article is solely for the purpose of
providing specific information and does not imply recommendation or endorsement by the USDA.
USDA is an equal opportunity provider and employer.
The authors declare no competing interests.
References
1 Quick, J. et al. Real-time, portable genome sequencing for Ebola surveillance. Nature 530, 228 (2016).
2 Faria, N. R. et al. Mobile real-time surveillance of Zika virus in Brazil. Genome Med 8, 97 (2016).
3 Kafetzopoulou, L. E. et al. Metagenomic sequencing at the epicenter of the Nigeria 2018 Lassa fever
outbreak. Science 363, 74, doi:10.1126/science.aau9343 (2019).
4 Garten, R. J. et al. Antigenic and genetic characteristics of swine-origin 2009 A(H1N1) influenza viruses
circulating in humans. Science 325, 197-201, doi:10.1126/science.1176225 (2009).
5 Jhung, M. A. et al. Outbreak of variant influenza A(H3N2) virus in the United States. Clin Infect Dis 57,
1703-1712, doi:10.1093/cid/cit649 (2013).
6 Centers for Disease Control and Prevention. Reported Infections with Variant Influenza Viruses in the
United States, (2017).
7 World Health Organization. Antigenic and genetic characteristics of zoonotic influenza viruses and
development of candidate vaccine viruses for pandemic preparedness. (2018).
8 World Health Organization. Influenza vaccine viruses and reagents,
(2019).
9 Bowman, A. S. et al. Influenza A(H3N2) virus in swine at agricultural fairs and transmission to humans,
Michigan and Ohio, USA, 2016. Emerg Infect Dis 23, 1551-1555, doi:10.3201/eid2309.170847 (2017).
10 Gardy, J. L. & Loman, N. J. Towards a genomics-informed, real-time, global pathogen surveillance
system. Nat Rev Genet 19, 9, doi:10.1038/nrg.2017.88 (2017).
11 Wilson, M. M. et al. Development of rapid subtyping and surveillance of influenza A. In Preparation
(2018).
12 Chandler, D. P. et al. Rapid, simple influenza RNA extraction from nasopharyngeal samples. J Virol
Methods 183, 8-13, doi:https://doi.org/10.1016/j.jviromet.2012.03.002 (2012).
13 Shepard, S. S. et al. Viral deep sequencing needs an adaptive approach: IRMA, the iterative refinement
meta-assembler. BMC Genomics 17, 708 (2016).
14 Rajao, D. S. et al. Antigenic and genetic evolution of contemporary swine H1 influenza viruses in the
United States. Virology 518, 45-54, doi:https://doi.org/10.1016/j.virol.2018.02.006 (2018).
15 Gao, S. et al. The genomic evolution of H1 influenza A viruses from swine detected in the United States
between 2009 and 2016. The Journal of general virology 98, 2001-2010, doi:10.1099/jgv.0.000885
(2017).
16 Kitikoon, P. et al. Genotype patterns of contemporary reassorted H3N2 virus in US swine. The Journal of
general virology 94, 1236-1241, doi:10.1099/vir.0.51839-0 (2013).
17 Anderson, T. K. et al. A phylogeny-based global nomenclature system and automated annotation tool for
H1 hemagglutinin genes from swine influenza A viruses. mSphere 1, doi:10.1128/mSphere.00275-16
(2016).
18 Centers for Disease Control and Prevention. Update: novel influenza A (H1N1) virus infections-
worldwide, May 6, 2009. MMWR 58, 453 (2009).
19 Igarashi, M. et al. Predicting the antigenic structure of the pandemic (H1N1) 2009 influenza virus
hemagglutinin. PLoS ONE 5, e8553, doi:10.1371/journal.pone.0008553 (2010).
20 Walia, R. R., Anderson, T. K. & Vincent, A. L. Regional patterns of genetic diversity in swine influenza A
viruses in the United States from 2010 to 2016. Influenza Other Resp 0, doi:10.1111/irv.12559 (2018).
21 Krauss, S., Walker, D. & Webster, R. G. Influenza virus isolation. Methods in molecular biology (Clifton,
N.J.) 865, 11-24, doi:10.1007/978-1-61779-621-0_2 (2012).
22 Edwards, J. L. et al. Utility of snout wipe samples for influenza A virus surveillance in exhibition swine
populations. Influenza Other Resp 8, 574-579, doi:10.1111/irv.12270 (2014).bioRxiv preprint first posted online Mar. 21, 2019; doi: http://dx.doi.org/10.1101/585588. The copyright holder for this preprint
(which was not peer-reviewed) is the author/funder, who has granted bioRxiv a license to display the preprint in perpetuity.
It is made available under a CC-BY-NC-ND 4.0 International license.
23 Nolting, J. M., Szablewski, C. M., Edwards, J. L., Nelson, S. W. & Bowman, A. S. Nasal wipes for influenza
A virus detection and isolation from swine. JoVE, 53313, doi:10.3791/53313 (2015).
24 Camacho, C. et al. BLAST+: architecture and applications. 10, 421, doi:10.1186/1471-2105-10-421
(2009).
25 Edgar, R. C. MUSCLE: multiple sequence alignment with high accuracy and high throughput. Nucleic
Acids Res 32, 1792-1797, doi:10.1093/nar/gkh340 (2004).
26 Price, M. N., Dehal, P. S. & Arkin, A. P. FastTree: Computing Large Minimum Evolution Trees with Profiles
instead of a Distance Matrix. Mol Biol Evol 26, 1641-1650, doi:10.1093/molbev/msp077 (2009).
27 Yu, G., Smith, D. K., Zhu, H., Guan, Y. & Lam, T. T.-Y. ggtree: an r package for visualization and annotation
of phylogenetic trees with their covariates and other associated data. Methods Ecol Evol 8, 28-36,
doi:doi:10.1111/2041-210X.12628 (2017).
28 Chang, W., Cheng, J., Allaire, J., Xie, Y. & McPherson, J. shiny: Web Application Framework for R. R
package version 1.1.0. (2018).
29 Lee, A. J. et al. Influenza Research Database: An integrated bioinformatics resource for influenza virus
research. Nucleic Acids Res 45, D466-D474, doi:10.1093/nar/gkw857 %J Nucleic Acids Research (2016).
30 Katoh, K. & Standley, D. M. MAFFT multiple sequence alignment software version 7: improvements in
performance and usability. Mol Biol Evol 30, 772-780, doi:10.1093/molbev/mst010 (2013).
31 Nguyen, L.-T., Schmidt, H. A., von Haeseler, A. & Minh, B. Q. IQ-TREE: A fast and effective stochastic
algorithm for estimating maximum-likelihood phylogenies. Mol Biol Evol 32, 268-274,
doi:10.1093/molbev/msu300 (2015).
32 Hoang, D. T., Vinh, L. S., Chernomor, O., Minh, B. Q. & von Haeseler, A. UFBoot2: Improving the Ultrafast
Bootstrap Approximation. Mol Biol Evol 35, 518-522, doi:10.1093/molbev/msx281 %J Molecular Biology
and Evolution (2017).
33 Centers for Disease Control and Prevention, N. C. f. I. a. R. D. N. FluView Interactive,
(2018).
34 Keller, M. W. et al. Direct RNA sequencing of the coding complete influenza A virus genome. Sci Rep 8,
14408, doi:10.1038/s41598-018-32615-8 (2018).
35 Peiris, J. S. M., de Jong, M. D. & Guan, Y. Avian influenza virus (H5N1): A threat to human health. Clinical
Microbiology Reviews 20, 243 (2007).
36 Cox, N. J., Trock, S. C. & Burke, S. A. in Influenza Pathogenesis and Control - Volume I (eds Richard W.
Compans & Michael B. A. Oldstone) 119-136 (Springer International Publishing, 2014).bioRxiv preprint first posted online Mar. 21, 2019; doi: http://dx.doi.org/10.1101/585588. The copyright holder for this preprint
(which was not peer-reviewed) is the author/funder, who has granted bioRxiv a license to display the preprint in perpetuity.
It is made available under a CC-BY-NC-ND 4.0 International license.
Figures and Tables
Figure 1
Genetic relationship of human and swine virus lineages. Colored arrows follow the evolution of
hemagglutinin. Human seasonal lineages (HSL) are green, classical swine North American lineage
H1N1Pdm09 (CSNAL H1N1Pdm09) is orange, classical swine North American lineage (CSNAL) is
purple, and Eurasian swine lineage (ESL) is blue. In 2009, influenza A/H1N1Pdm09 virus displaced the
previous human seasonal A/H1N1 virus from humans which continues circulating in swine. This virus
reassorted, picking up the N2 segment from the Triple Reassortment viruses into the A/H1N2 δ2
lineage that caused human infections in the summer of 2018. The history of this HA can be traced back
to the avian virus that caused the 1918 pandemic, through extinction and reemergence, and through
decades of human seasonal activity.bioRxiv preprint first posted online Mar. 21, 2019; doi: http://dx.doi.org/10.1101/585588. The copyright holder for this preprint
(which was not peer-reviewed) is the author/funder, who has granted bioRxiv a license to display the preprint in perpetuity.
It is made available under a CC-BY-NC-ND 4.0 International license.
Figure 2
Timeline comparison of portable versus centralized surveillance pipelines. The Mia pipeline is
modeled after the IGT pipeline with special considerations for speed and portability and is expected to
get results from 24 samples in a maximum of 14 hours and 30 minutes. The IGT pipeline is designed
for throughput and accuracy and would get results from 96 samples in 39 hours if operated
continuously.bioRxiv preprint first posted online Mar. 21, 2019; doi: http://dx.doi.org/10.1101/585588. The copyright holder for this preprint
(which was not peer-reviewed) is the author/funder, who has granted bioRxiv a license to display the preprint in perpetuity.
It is made available under a CC-BY-NC-ND 4.0 International license.
Figure 3
Phylogenetic relationships of HA-H1 sequences from exhibition-sampled swine, broad swine,
swine-variant and late summer 2018 human cases of swine-variant IAVs. A) Recreation of the
phylogenetic cladogram and genome constellation heatmap displayed in Mia’s Rshiny application. This
automatically generated figure showed us that our sampled viruses had HA sequences most similar to
the H1-delta2 A/Brisbane/59/2007 sequence and that they all shared a similar genome constellation.
CSNAL = Classical Swine North American Lineage; HSL = Human Seasonal Lineage; ESL = Eurasian
Swine Lineage; AvNAL = Avian North American Lineage; H1N1Pdm09 = H1N1 2009 pandemic lineage.
B) Maximum likelihood phylogeny of swine IAV HA-H1 sequences incorporating the swine-variant
viruses Mia used as references and the nearest candidate vaccine virus (Ohio/35/2017) to our found
outbreak of delta-2 IAV. C) Detail of the maximum likelihood phylogeny of delta-2 HA sequences
containing our field-processed IAVs (BCxx; green), 65 additional field-samples that were laboratory-
processed (blue), the nearest CVV (red), Mia reference (light blue) and five human cases of swine-
variant (purple) IAVs. Bootstrap values are annotated on internal nodes.bioRxiv preprint first posted online Mar. 21, 2019; doi: http://dx.doi.org/10.1101/585588. The copyright holder for this preprint
(which was not peer-reviewed) is the author/funder, who has granted bioRxiv a license to display the preprint in perpetuity.
It is made available under a CC-BY-NC-ND 4.0 International license.
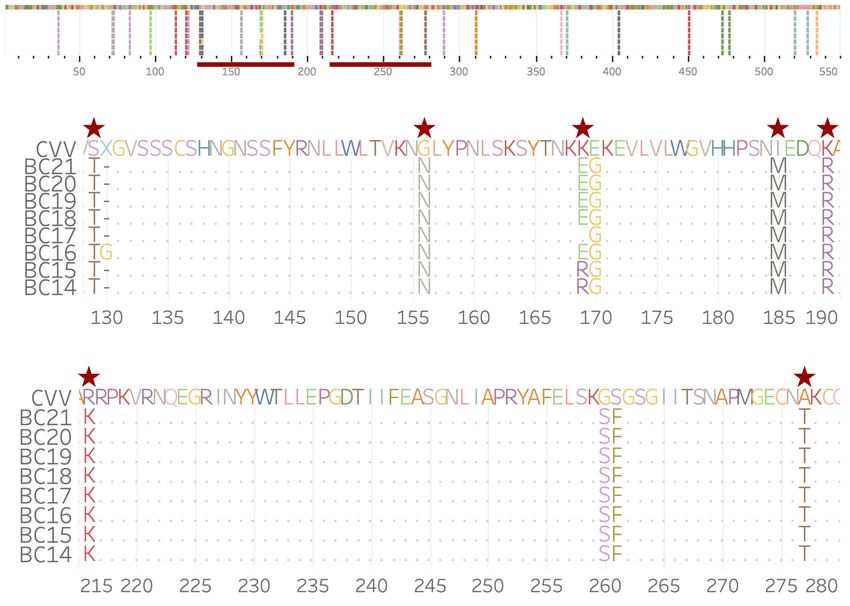
Figure 4
Mature H1 amino acid sequence alignment of H1 delta-2 sequences from Mia nanopore
sequencing versus A/Ohio/35/2017, the nearest CVV. Red stars indicate antigenic sites. This figure
was created post-field for publication purposes, however the same information was viewable in an
alignment viewer in the field as well as in Mia’s dashboard table.bioRxiv preprint first posted online Mar. 21, 2019; doi: http://dx.doi.org/10.1101/585588. The copyright holder for this preprint
(which was not peer-reviewed) is the author/funder, who has granted bioRxiv a license to display the preprint in perpetuity.
It is made available under a CC-BY-NC-ND 4.0 International license.
Table 1
Average HA Coverage
Mia Nanopore IGT Illumina
Average
Barcode Subtype Ct 20 100
Identity
01 H1N2 29.1 + + 0.995
02 33.6 + -
03 35.2 + -
04 - + -
05 H1N2 27.3 + + 0.989
06 H1N1 28.0 + + 0.993
07 - + -
08 31.5 + -
09 - + -
10 33.7 + -
11 34.8 + -
12 36.9 + -
13 - + -
14 H1N2 23.5 + + 0.997
15 H1N2 26.1 + + 0.997
16 H1N2 26.0 + + 0.997
17 H1N2 24.4 + + 0.997
18 H1N2 23.1 + + 0.997
19 H1N2 34.4 + + 0.997
20 H1N2 24.1 + + 0.997
21 H1N2 26.4 + + 0.996
22 H3N2 30.9 + + 0.960
23 H1N2 28.6 + + 0.997
24 - + -
Sequencing results. HA coverage is indicated for each technique by its threshold. Samples with zero
HA coverage are left blank. Complete coverage data can be found in Table S3. Average identity is
displayed for all segments.You can also read