Conserving relics from ancient underground worlds: assessing the influence of cave and landscape features on obligate iron cave dwellers from the ...
←
→
Page content transcription
If your browser does not render page correctly, please read the page content below
Conserving relics from ancient
                                        underground worlds: assessing the
                                        influence of cave and landscape features
                                        on obligate iron cave dwellers from the
                                        Eastern Amazon
                                        Rodolfo Jaffé1 ,2 ,3 , Xavier Prous4 , Allan Calux4 , Markus Gastauer1 ,
                                        Gilberto Nicacio1 , Robson Zampaulo4 , Pedro W.M. Souza-Filho1 ,5 ,
                                        Guilherme Oliveira1 , Iuri V. Brandi4 and José O. Siqueira1
                                    1
                                      Instituto Tecnológico Vale, Belém, PA, Brazil
                                    2
                                      Ecology, Universidade de São Paulo, São Paulo, Brazil
                                    3
                                      Ecology, Universidade Federal do Pará, Belém, Pará, Brazil
                                    4
                                      Environmental Licensing and Speleology, Vale, Nova Lima, Minas Gerais, Brazil
                                    5
                                      Geoscience, Universidade Federal do Pará, Belém, Pará, Brazil

                                            ABSTRACT
                                            The degradation of subterranean habitats is believed to represent a serious threat
                                            for the conservation of obligate subterranean dwellers (troglobites), many of which
                                            are short-range endemics. However, while the factors influencing cave biodiversity
                                            remain largely unknown, the influence of the surrounding landscape and patterns
                                            of subterranean connectivity of terrestrial troglobitic communities have never been
                                            systematically assessed. Using spatial statistics to analyze the most comprehensive
                                            speleological database yet available for tropical caves, we first assess the influence of iron
                                            cave characteristics and the surrounding landscape on troglobitic communities from
                                            the Eastern Amazon. We then determine the spatial pattern of troglobitic community
                                            composition, species richness, phylogenetic diversity, and the occurrence of frequent
                                            troglobitic species, and finally quantify how different landscape features influence
Submitted 15 January 2018
Accepted 3 March 2018                       the connectivity between caves. Our results reveal the key importance of habitat
Published 20 March 2018                     amount, guano, water, lithology, geomorphology, and elevation in shaping iron cave
Corresponding author                        troglobitic communities. While mining within 250 m from the caves influenced species
Rodolfo Jaffé, r.jaffe@ib.usp.br,           composition, increasing agricultural land cover within 50 m from the caves reduced
rodolfo.jaffe@itv.org                       species richness and phylogenetic diversity. Troglobitic species composition, species
Academic editor                             richness, phylogenetic diversity, and the occurrence of frequent troglobites showed
Jack Stanford                               spatial autocorrelation for up to 40 km. Finally, our results suggest that the conservation
Additional Information and                  of cave clusters should be prioritized, as geographic distance was the main factor
Declarations can be found on                determining connectivity between troglobitic communities. Overall, our work sheds
page 18
                                            important light onto one of the most overlooked terrestrial ecosystems, and highlights
DOI 10.7717/peerj.4531                      the need to shift conservation efforts from individual caves to subterranean habitats as
    Copyright                               a whole.
2018 Jaffé et al.

Distributed under                       Subjects Biodiversity, Conservation Biology, Ecology, Zoology, Spatial and Geographic
Creative Commons CC-BY 4.0              Information Science
                                        Keywords Troglobites, Landscape ecology, Iron caves, Speleology, Mining, Connectivity
OPEN ACCESS

                                        How to cite this article Jaffé et al. (2018), Conserving relics from ancient underground worlds: assessing the influence of cave and land-
                                        scape features on obligate iron cave dwellers from the Eastern Amazon. PeerJ 6:e4531; DOI 10.7717/peerj.4531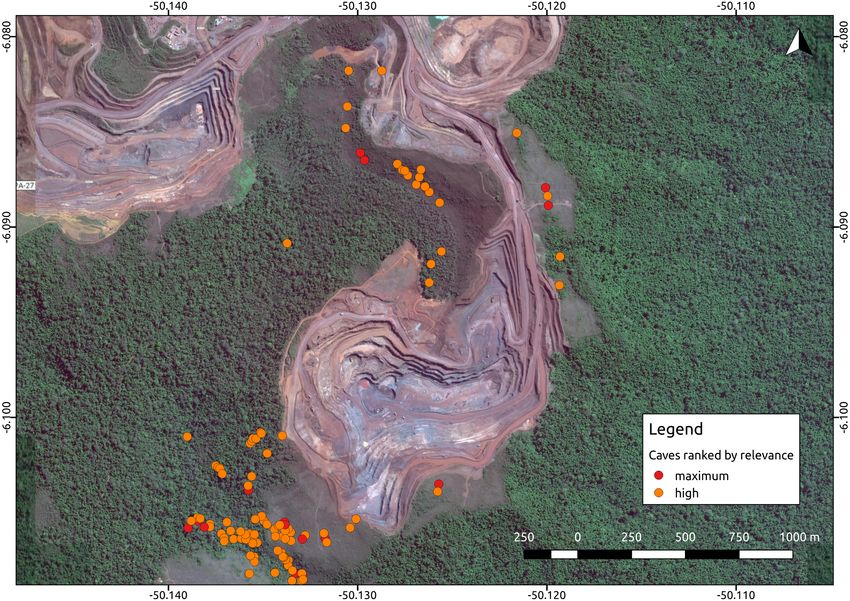
INTRODUCTION
                                    Caves harbor a unique biodiversity, often comprising obligate subterranean dwellers which
                                    must complete their entire life cycle underground (also known as troglobites) (Pipan &
                                    Culver, 2013). The unparalleled nature of subterranean environments has facilitated the
                                    evolution of many endemic troglobites, some of which are considered relics of ancient
                                    worlds because their closest relatives have long disappeared from surface environments
                                    (Culver & Pipan, 2009; Juan et al., 2010). Many of these troglobitic species are considered
                                    short-range endemics (Harvey, 2002) because they have only been found in a few caves. As
                                    dispersal is assumed to be restricted in these organisms, the degradation of subterranean
                                    habitats is believed to represent a threat for the conservation of such short-range endemics.
                                    Rare troglobites have therefore been the primary targets of cave conservation efforts
                                    worldwide (Harvey et al., 2011; Wynne & Voyles, 2013; Culver & Pipan, 2014; Ferreira,
                                    Oliveira & Silva, 2015).
                                       Environmental protection agencies of many countries prioritize the conservation of
                                    threatened troglobites (Guzik et al., 2011; Harvey et al., 2011; Auler & Piló, 2015), and
                                    require extensive speleological surveys prior to the implementation of mining and
                                    infrastructure projects. Brazil has one of the most stringent cave protection regimes in
                                    the world, which requires government agencies and consulting companies to categorize
                                    caves into one of four relevance categories (maximum, high, mid, or low), based on a
                                    complex set of biological, geological, and cultural attributes (Auler & Piló, 2015). Such
                                    categorization is later checked by the environmental protection agencies. Caves containing
                                    rare endemic troglobitic species, for instance, are always defined as maximum relevance
                                    caves, which must be protected along with a buffer area of 250 m (Jaffé et al., 2016). High
                                    relevance caves, on the other hand, can be impacted if appropriate compensation offsets
                                    are provided (i.e., preserving two similar caves). Since this protection regime is strictly
                                    enforced, the protection of maximum and high relevance caves essentially directs large
                                    development projects such as mining operations (Fig. 1).
                                       The factors influencing cave biodiversity remain largely unknown (Pipan & Culver,
                                    2013; Culver & Pipan, 2014), and the impact of the surrounding landscape on terrestrial
                                    troglobitic communities has never been systematically assessed (Hutchison et al., 2016;
                                    Pellegrini et al., 2016). However, a recent study found that habitat (karst) amount and
                                    landscape rugosity can predict the presence of major faunal groups of cave obligate species
                                    (Christman et al., 2016). Previous studies have reported spatial autocorrelation in the
                                    number and occurrence frequency of troglobites (Christman et al., 2005; Jaffé et al., 2016),
                                    which suggests some level of subterranean dispersal through porous rocks or micro-cavities
                                    (Auler et al., 2014). However, the factors influencing subterranean connectivity remain
                                    unexplored. Knowledge gaps are even larger in the tropics, where most troglobites remain
                                    unidentified to the species level, their distribution ranges have been established based on
                                    limited sampling, and their dispersal mechanisms are yet to be determined (Trajano &
                                    Bichuette, 2010; Auler & Piló, 2015; Jaffé et al., 2016). For instance, of the 150 troglomorphic
                                    species known to be associated to Brazilian iron caves, only 10 have been formally described,

Jaffé et al. (2018), PeerJ, DOI 10.7717/peerj.4531                                                                             2/23
Figure 1 Iron ore mine (N5, Serra Norte, Carajás, Brazil) showing the location of caves colored by
their relevance classification. The photo shows how mine planning is affected by the occurrence of max-
imum relevance caves, which must be protected along with a 250 m radius. Cave data was retrieved from
Jaffé et al. (2016), while the image was provided by Google Imagery 2017. Coordinates are shown in deci-
mal degrees.
Full-size DOI: 10.7717/peerj.4531/fig-1
and include spiders, isopods, springtails, beetles, true bugs and millipedes (Ferreira, Oliveira
& Silva, 2015).
Here we aim to fill some of these knowledge gaps taking advantage of the most
comprehensive speleological database yet available for tropical caves. The Carajás mineral
province (South-Eastern Amazon, Brazil) contains one of the world’s largest deposits of
high-grade iron ore (Poveromo, 1999) and some of the largest iron ore mining projects are
operating in the region. The environmental licensing of these mines required extensive
speleological surveys, undertaken by different companies during the past decade. These
surveys generated a wealth of data on cave biodiversity and geological characteristics of iron
caves, which not only contain higher richness of troglomorphic species than caves of other
lithologies (Silva, Martins & Ferreira, 2011), but are also amongst the most threatened
subterranean ecosystems. The present study assesses how cave and landscape features
influence community composition, species richness, phylogenetic diversity, occurrence
and connectivity patterns using previously unpublished and throughly curated lists of
troglobitic species for 473 iron caves. We hope the generated knowledge will help guide
sound conservation efforts and achieve the best compromise between mining and the
protection of cave biodiversity.
Jaffé et al. (2018), PeerJ, DOI 10.7717/peerj.4531 3/23Specifically, our study aims to: (1) assess the influence of cave characteristics and the
surrounding landscape on troglobitic species composition, species richness, phylogenetic
diversity, and the occurrence of frequent troglobitic species; (2) determine the spatial
pattern of troglobitic community composition, species richness, phylogenetic diversity,
and the occurrence of frequent troglobitic species; and (3) quantify how different landscape
features influence the connectivity between caves.
MATERIALS & METHODS
Jaffé et al. (2016) used data from 844 iron caves to assess how the current relevance
classification scheme ranks caves with different biodiversity indicators. Additionally,
they modelled total species richness (considering all taxa found inside caves), and the
presence/absence of rare troglobites, troglobites and bat populations. In the present
work, we retrieved previously unpublished data from a curated database containing
comprehensive lists of all troglobitic taxa occurring in 473 iron caves of Carajás, State of
Pará, Brazil. We then use this dataset to assess the influence of cave characteristics and
the surrounding landscape on troglobitic communities, model troglobitic community
composition, troglobitic species richness, troglobitic phylogenetic diversity, and the
occurrence of frequent troglobitic species, and finally quantify how different landscape
features influence the connectivity between caves.
Dataset
Initially, species inventories were obtained from speleology reports prepared by
independent consulting companies. All but one report (N5M2) have already been
submitted to the corresponding government agencies (the Brazilian Environmental
Protection Agency—IBAMA, and the Pará State’s Environment Agency—SEMAS-PA),
and are available as Supporting Information in Jaffé et al. (2016). Consulting companies
employed similar sampling methods and evaluated the same set of cave attributes (as
specified in the Brazilian legislation for the protection of caves: Federal Decree 6640/2008
and Normative Instruction MMA 02/2017). Cave terrestrial fauna, for instance, was
surveyed through the full extension of each cave, once during the dry season and once
during the wet season. Species lists were later validated by specialized taxonomists, who
compared collected specimens across caves and identified them to the finest possible
taxonomic level. Still, many specimens were left to the morpho-species level because
they represent new undescribed taxa (Trajano & Bichuette, 2010). Taxonomists classified
species as troglobites if they exhibited troglomorphic traits (Pipan & Culver, 2013) absent in
phylogenetically related taxa occurring in above-ground habitats. Non-troglobitic species
were not compared across caves so they were excluded from our dataset. Additionally,
personnel from the Department of Environmental Licensing and Speleology from Vale (a
mining company), traveled to caves containing rare troglobites to confirm occurrences
and collect specimens in surrounding caves, aiming at validating their occurrence range.
We then gathered all available information on the cave’s characteristics from different
speleology reports and Vale’s speleology database. These included cave coordinates,
altitude, horizontal projection (length), slope, area, volume, presence of percolating water
Jaffé et al. (2018), PeerJ, DOI 10.7717/peerj.4531 4/23and water reservoirs, presence of plant material, presence of plant detritus, presence
of roots, presence of guano, presence of other feces, presence of regurgitation balls,
presence of carcases, and presence of resident bat populations. We also assessed the
external environment by calculating additional cave and landscape metrics at four different
spatial scales (50, 100, 250, and 500 m radii from the cave’s centroid). These metrics
included subterranean area, cave density, cave declivity, lithology, distance to nearest
creek, geomorphology, and land cover (See Table S1). Water bodies and geomorphology
maps were obtained from the Brazilian Institute of Geography and Statistics (IBGE:
ftp://geoftp.ibge.gov.br/cartas_e_mapas/bases_cartograficas_continuas/bcim/), Souza-
Filho et al. (2016) provided a high resolution 2013 land cover map, and all other metrics
were calculated using data from Vale’s speleology database. We could not retrieve all metrics
in all caves, so some were excluded from certain analyses. The full datasets, including the
geographic coordinates of all caves, can be found along with all R scripts as (Dataset S1).
All statistical analyses were implemented in R (R Core Team, 2015).
Modeling troglobitic species composition, species richness and
phylogenetic diversity
To avoid possible biases arising from unequal sampling efforts across caves, we only
considered presence/absence data, omitting abundance information. We first created
a community matrix, containing information on the presence or absence of a given
species in each cave. We then used the vegan R package (Oksanen et al., 2016) to run a
Principal Coordinates Analysis (PCoA), employing Bray–Curtis dissimilarity distances.
The first two axis of this PCoA (MDS1 and MDS2) were considered proxies of troglobitic
community composition, and thus used as response variables in subsequent composition
models (Fig. S1). While troglobitic species richness was estimated as the total number of
species present in each cave, rarity-weighted richness was also calculated to account for
differences in species representation across caves (Albuquerque & Beier, 2015). Additionally,
phylogenetic diversity was used as a proxy of functional diversity (Flynn et al., 2011; Faith,
2015). We constructed a phylogenetic tree containing all troglobitic families sampled in at
least one cave using the Timetree of Life (Hedges & Kumar, 2009; Hedges et al., 2015). In
its actual version, the Timetree of Life contains more than 50,000 species, and all families
from our set of troglobitic species are represented. We inserted genera and subsequently
species this phylogeny, considering cases with more than two genera per family or more
than two species per genus as polytomies. The resulting phylogeny was dated using the bladj
algorithm from Phylocom-4.2 in combination with mean age estimates of 29 internal nodes
retrieved from the databases (Hedges & Kumar, 2009; Hedges et al., 2015) (Table S2). Nodes
without age estimates were placed evenly between two dated nodes (Fig. S2). Phylogenetic
diversity was finally calculated for each cave using Phylocom 4.2 (Webb et al., 2002), as the
sum of the lengths of all branches considered members of the corresponding minimum
spanning path.
We assessed the influence of internal (cave characteristics) and external (surrounding
landscape) features on our five response variables (species composition axes MDS1
and MDS2, species richness, log-transformed rarity-weighted richness and phylogenetic
Jaffé et al. (2018), PeerJ, DOI 10.7717/peerj.4531 5/23diversity). To do so we used the lme4 package (Bates et al., 2014) to fit linear mixed
models (for species composition, rarity-weighted richness and phylogenetic diversity) and
generalized linear mixed models (GLMM) with Poisson distributed errors (for species
richness), always keeping the geological unit (or highland) where the caves were located
as a random effect. This allowed us to account for spatial autocorrelation as well as other
potential unmeasured site-specific covariates. We first reduced the large number of initial
predictor variables (see Table S1) by identifying the relevant scale at which each landscape
component best explained our five response variables. This was done by comparing simple
models containing the same predictor measured at the four different spatial scales. Model
selection was based on the Akaike Information Criterion (AIC), and the best model (with
the lowest AIC) was considered to represent the relevant scale for a given predictor.
Because lithology and geomorphology contained many different classes, we ran principal
component analyses for each group of variables and included the first two synthetic axis
in our models. We then fit full models containing predictors at the relevant scale for
each response variable, along with the largest possible number of uncorrelated covariates
(r < 0.6). All models contained more than 20 observations for every predictor variable,
so overfitting was not an issue. Likelihood ratio tests (LRT) were employed to compare
full models with reduced models where each predictor was removed one by one. Only
predictor variables that significantly improved the full model’s log-likelihood (at α < 0.05)
were included in the final best models. These were then validated by plotting residual vs.
fitted values, residual vs. predictors, and by looking at the distribution of residuals. We
also tested for spatial autocorrelation in the final model’s residuals at the minimum spatial
scale (see below).
To assess sampling bias effects we tested if caves located in the proximity of mines
(which influence mine planning) were sampled more or less intensively than more distant
caves (which do not influence mine planning). To do so we modeled total species richness
(all taxa recorded inside each cave), troglobitic species richness and presence of rare
troglobites (found in three or less caves) in relation to the mining area surrounding caves
at different spatial scales (distant caves had mining areas of zero). Different species richness
and different probabilities of containing rare troglobites in caves surrounded by larger
mining areas would indicate uneven sampling efforts (since more species are likely to
have been identified and occurrence areas of rare species expanded with larger sampling
efforts). On the contrary, similar richness and rarity patterns across all caves would reveal
no systematic sampling bias effects. We ran GLMM with Poisson distributed errors (for
species richness) and GLMM with Bernoulli distributed responses (for presence of rare
troglobites), keeping the highland where the caves were located as a random effect. Since
mining area surrounding the caves was correlated across spatial scales, we only constructed
models containing a single predictor (mining area at a given scale).
Modeling the occurrence of frequent troglobites
To unravel which cave characteristics help predict the occurrence of certain troglobitic
species we analyzed a subset of our data containing the most frequent species (occurring
in at least 30 caves). We decided not to analyze species occurring in fewer than 30 caves
Jaffé et al. (2018), PeerJ, DOI 10.7717/peerj.4531 6/23to avoid overfitting and complete separation problems resulting from small sample sizes.
The presence of each one of these frequent species was modeled using generalized linear
models with Bernoulli distributed responses (logistic regressions). Presence/absence was
thus set as response variable, and all meaningful uncorrelated cave attributes as predictors.
As described above, LRT were employed to identify which predictor variables improved
the model’s log-likelihood.
Assessing spatial autocorrelation
We assessed spatial autocorrelation in our five response variables (species composition axes
MDS1 and MDS2, species richness, rarity-weighted richness and phylogenetic diversity).
The package spdep (Bivand & Piras, 2015) was employed to estimate Moran’s I, a standard
measure of spatial autocorrelation ranging from −1 (indicating perfect dispersion) to
+1 (perfect correlation, with zero indicating a random spatial pattern). As Moran’s I is
affected by the spatial scale chosen to assign weights to neighbors, we quantified spatial
autocorrelation across the full range of spatial scales of our data. We also tested for spatial
autocorrelation in the presence of each one of the frequent troglobitic species. To do so
we employed the Join Count Test of the spdep package (Bivand, Pebesma & Gómez-Rubio,
2008) and assessed spatial autocorrelation across the full range of spatial scales of our data.
The Single Color Statistic was computed for presence-presence in networks of neighboring
caves located within increasing distances, until we reached the maximal extent of our study
region.
Modeling connectivity between caves
In order to assess how different landscape features influence the connectivity between caves,
we used a landscape genetics approach, whereby a dissimilarity measure was related to
landscape resistance to dispersal (Jaffé et al., 2015). Community dissimilarity (Bray–Curtis
distance) was used as a proxy for connectivity, assuming that connected caves have more
similar troglobitic communities than isolated ones. We then relied on circuit theory
(McRae, 2006) to estimate landscape resistance to dispersal between caves, considering
land cover, elevation, terrain roundedness, and geographic distance.
Because troglobites are obligate subterranean dwellers (Pipan & Culver, 2013; Culver
& Pipan, 2014), we assumed they can only disperse through the shallow subterranean
habitat formed by lateritized igneous mafic rocks and banded ironstone formations (also
known as Mountain Savanna or Canga), where our caves are found. We therefore used
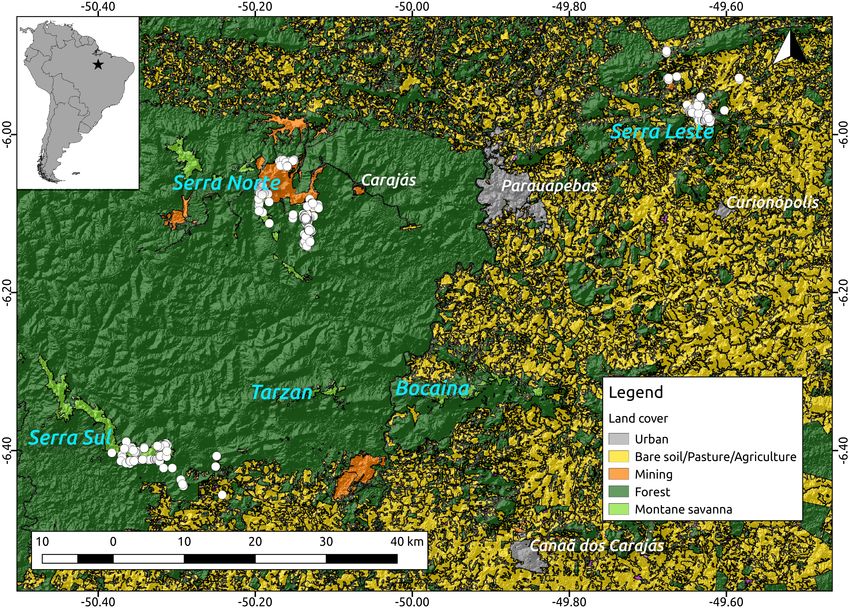
a 2013 land cover classification map (Souza-Filho et al., 2016) (see Fig. 2) and created a
resistance surface to where we attributed low resistance values (0.1) to Canga pixels and
high resistance values (0.9) to all other pixels (all other land cover classes). To test whether
lower elevations represented higher resistance to troglobite dispersal (given these organisms
occur in the highlands), we used a Digital Elevation Model—DEM (SRTM 1 Arc-second
global downloaded from https://earthexplorer.usgs.gov/) to build a resistance surface where
high elevation pixels represented lower resistance than lowland areas. Additionally, we used
the same DEM to create a terrain ruggedness raster using the Terrain Analysis plugin in
QGIS V2.14, and test whether pixels with higher roundedness represent higher resistance
Jaffé et al. (2018), PeerJ, DOI 10.7717/peerj.4531 7/23Figure 2 Location of the study region (upper left corner) and a detail of the study area showing the
spatial distribution of the caves included in our analyses (white dots, N = 473) over elevation and a
land cover layer. While the digital elevation raster (SRTM, 1 arc-second) was obtained from USGS Earth
Explorer, the land use classification shapefile was obtained from Souza-Filho et al. (2016). Coordinates are
shown in decimal degrees.
Full-size DOI: 10.7717/peerj.4531/fig-2
to troglobitic dispersal. Finally, we created a null-model raster (isolation by geographic
distance), where all pixels were coded with identical resistance values (0.5). All rasters were
cropped to the extent of the cave locations plus a buffer area of 5 km to minimize border
effects (Jaffé et al., 2015).
Using the program Circuitscape V4.0 (McRae, 2006) we then calculated pairwise
resistance distances between all caves, employing all the resistance surfaces described
above (land cover, elevation, ruggedness and isolation by geographic distance). Due to
Circuitscape’s computing limitations we replaced zero values in all rasters with 0.001, and
decreased the resolution of all rasters to achieve reasonable computing times. Finally, we
regressed Bray–Curtis dissimilarity distance against resistance distances using Maximum
Likelihood Population Effects (MLPE) (Clarke, Rothery & Raybould, 2002) to account for
the non-independence of pairwise distances (Jaffé et al., 2015). Code implementing the
MLPE correlation structure within the R package nlme (Pinheiro et al., 2014) is provided
at (https://github.com/nspope/corMLPE). Because all resistance distances were highly
correlated, we only ran simple MLPE models and compared them using the sample size
corrected Akaike Information Criterion (AICc).
Jaffé et al. (2018), PeerJ, DOI 10.7717/peerj.4531 8/23RESULTS
The composition of troglobitic communities was influenced by the total subterranean
area, cave density, terrain declivity, altitude, lithology, mining and Canga area (Table 1).
Specifically, larger mining areas surrounding caves were associated with the occurrence of
Paronellidae sp.4, whereas caves surrounded by smaller mining areas were usually inhabited
by Charinus carajas and Pyrgodesmidae sp.1 (Fig. S1). Similarly, caves surrounded by larger
Canga areas were associated with Charinus carajas, whereas caves surrounded by smaller
areas of Canga usually contained more Systrophiidae sp.1. The relevant scale at which
mining and Canga influenced community composition differed, being 250 m for the former
and 50 m for the later (Fig. 3). Species richness, rarity-weighted richness and phylogenetic
diversity were all explained by the distance to the nearest creek, geomorphology, cave
area and the presence of guano (Table 1). However, agriculture land cover was found
associated to both species richness and phylogenetic diversity, while Canga land cover
was an important predictor of rarity-weighted richness. Subterranean area was also
found associated to phylogenetic diversity (Table 1). Interestingly, species richness,
rarity-weighted richness and phylogenetic diversity increased with increasing distance
to the nearest creek, increasing cave area, and the presence of guano. On the other hand,
the amount of agricultural landscapes surrounding caves was negatively associated with
both species richness and phylogenetic diversity, and in both cases the relevant scale for
agriculture land cover was 50 m (Fig. 3). Finally, rarity-weighted richness increased with
the amount of Canga land cover surrounding caves and the relevant scale for the effect of
Canga land cover was 50 m (Fig. 3). We did not find spatial autocorrelation in any of the
model’s residuals and no systematic sampling bias effects were detected, given that richness
and rarity patterns were not influenced by the cave’s proximity to mines (Table S3).
The occurrence of the most frequent species was predicted by cave characteristics, with
altitude being the variable determining the presence or absence of most species (Table 2).
Presence of guano, cave slope, and presence of water reservoirs were also identified as
important predictors of some frequent species, although the direction of these effects
varied between species (Table 2).
Species composition, species richness, rarity-weighted richness and phylogenetic
diversity were found to be spatially autocorrelated for up to 40 km (Fig. 4). Above
this distance spatial autocorrelation disappeared, revealing a random spatial pattern. The
occurrence of frequent troglobitic species was also found to be spatially autocorrelated
across spatial scales (Fig. 5). Most troglobitic species were found to be restricted to one or
a few caves, but a few were found in more than 100 caves (Fig. 5).
Our connectivity analyses revealed that the model containing geographic distance was
the best to explain community dissimilarity, while neither land cover, terrain ruggedness or
elevation seemed to influence community dissimilarity (Table 3). Specifically, dissimilarity
increased with increasing geographic distance separating caves (Fig. 6).
Jaffé et al. (2018), PeerJ, DOI 10.7717/peerj.4531 9/23Table 1 Summary of the best models describing troglobitic species composition, species richness,
rarity-weighted richness and phylogenetic diversity.
Response variable Modela Predictor variables Estimate SE t /z p
Subterranean area 0.13 0.04 3.12 0.002
(500 m)
Species composition
LMM Declivity 0–10◦ (500 m) 0.09 0.03 2.98 0.003
(MDS1)
Mining area (250 m) −0.08 0.03 −3.01 0.003
Declivity 30–40◦ (500 m) −0.06 0.02 −2.74 0.006
Cave density (50 m) −0.08 0.02 −3.23 0.001
Species composition
LMM Lithology axis 2 (50 m) −0.10 0.04 −2.51 0.012
(MDS2)
Canga area (50 m) 0.07 0.03 2.44 0.015
Altitude −0.06 0.03 −1.82 0.070
Distance to nearest creek 0.13 0.04 3.04 0.002
Geomorphology axis 2 0.20 0.05 3.85Figure 3 Influence of land cover on troglobitic species composition, species richness, rarity-weighted
richness and phylogenetic diversity across spatial scales. The Y axis show the Akaike Information Cri-
teria (AIC) of simple mixed models containing each land cover predictor at four different spatial scales.
Lowest AIC values indicate the scale at which each predictor best explained response variables.
Full-size DOI: 10.7717/peerj.4531/fig-3
Jaffé et al. (2018), PeerJ, DOI 10.7717/peerj.4531 11/23Table 2 Parameter estimates for the best models explaining the presence of the most frequent troglo-
bitic species (occurring in at least 30 caves).
Species Altitude Presence of Cave slope Presence Presence Cave
guano of water of other area
reservoirs feces
aff Xyccarph sp1 −0.003 −0.947
Carajas paraua 0.136 0.642
Charinus carajas −0.002 0.107 0.331
Charinus orientalis −0.004 1.230 −0.164
Circoniscus buckupi 0.003 −1.192 1.600
Cyphoderidae sp1 1.106
Cyphoderidae sp2 1.753 0.001
Entomobryidae sp4 0.007
Entomobryomorpha sp −0.004 0.156 1.172 −1.316
Isotomidae sp2 −0.003 0.102 1.035
Matta sp1 0.009 0.104
Paronellidae sp4 0.006 0.708 0.001
Pyrgodesmidae sp1 −0.004 −0.900 0.159 1.341 −0.833
Systrophiidae sp1 −0.010 1.705 −1.672
Total number of models 11 7 7 6 4 2
Species inventories were initially obtained from independent consulting companies, who
employed similar sampling methods. These were later validated by specialized taxonomists,
and occurrence ranges of rare troglobites were confirmed through further sampling. Since
we did not detect any systematic sampling bias effects (Table S3), we are confident that our
results reflect the ecology of iron cave troglobites. On the other hand, temporal mismatches
between the maps employed to assess landscape features and the timing of speleological
surveys could have influenced our analyses. Speleological surveys performed by consulting
companies took place between 2005 and 2011 (Serra Norte), between 2010 and 2011 (Serra
Leste), and between 2010 and 2011 (Serra Sul; see details in Jaffé et al., 2016). While mining
activities in Serra Norte began in the 1980s, long before the speleological surveys took
place, Serra Leste had also been exposed to cattle ranching before the speleological surveys
were conducted there. Serra Sul, on the other hand, was still completely preserved in 2013
as mining activities had not yet began. Since we calculated landscape metrics using a 2013
land cover map, we believe time-lag effects had a minor impact on our results.
Previous studies have shown that cave size is a key predictor of subterranean biodiversity,
because larger caves not only have higher colonization rates, but can also host larger
and more diverse communities (Brunet & Medellín, 2001; Silva, Martins & Ferreira, 2011;
Simões, Souza-Silva & Ferreira, 2015). In turn, more diverse communities have been found
to contain more troglobitic species (Culver et al., 2004; Christman et al., 2005), and a recent
study on iron caves found a strong correlation between total species richness and the
richness of troglobites (Jaffé et al., 2016). Our results match these previous findings, as
habitat amount (assessed through cave area, subterranean area, cave density, and Canga
area) was found associated to all response variables (species composition, species richness,
Jaffé et al. (2018), PeerJ, DOI 10.7717/peerj.4531 12/23Figure 4 Spatial autocorrelation of troglobitic species composition, species richness, rarity-weighted
richness and phylogenetic diversity across different spatial scales. While the solid lines show the value
of Moran’s I estimates, the gray area depict 95% confidence intervals. The dashed lines represent expected
values under a null model of no spatial autocorrelation.
Full-size DOI: 10.7717/peerj.4531/fig-4
Jaffé et al. (2018), PeerJ, DOI 10.7717/peerj.4531 13/23Figure 5 Spatial autocorrelation in the occurrence of the most frequent troglobitic species (occurring
in 30 or more caves) across different spatial scales (A–N), and frequency distribution of occurrences
by species (O). Solid lines in A–N show the value of Single Color Statistic estimates, gray area depict 95%
confidence intervals, and dashed lines represent expected values under a null model of no spatial autocor-
relation. The dashed vertical line in O shows the threshold value of species occurring in at least 30 caves.
Full-size DOI: 10.7717/peerj.4531/fig-5
rarity-weighted richness, phylogenetic diversity, and the occurrence of some frequent
species). Additionally, our results show that proximal habitat amount (Canga within
50 m of the caves) is an important predictor of troglobitic community composition and
the presence of rare species (Fig. 3). Interestingly, our study is the first one to report an
association between the amount of subterranean habitat and phylogenetic diversity, our
proxy for functional diversity. This finding suggests that more diverse communities are
also more complex and possibly more resilient ones, given the higher functional diversity
they harbor (Lean & Maclaurin, 2016).
Our data also supports the idea that a higher availability of trophic resources
facilitates colonization of the cave’s interior (Poulson & White, 1969; Culver & Pipan, 2009;
Jaffé et al. (2018), PeerJ, DOI 10.7717/peerj.4531 14/23Figure 6 Relationship between troglobitic community dissimilarity (Bray–Curtis distance) and ge-
ographic distance resistance distance. Dissimilarity distance is de-correlated for the MLPE correlation
structure.
Full-size DOI: 10.7717/peerj.4531/fig-6
Table 3 Comparison of connectivity models.
Predictors variable Log-likelihood AICc 1AICc Weight
Geographic distance 41,538.18 −83,068.35 0.00 1.00
Land cover 41,392.50 −82,777.00 291.35 0.00
Rougedness 41,352.66 −82,697.32 371.04 0.00
Elevation 40,989.58 −81,971.17 1,097.18 0.00
White & Culver, 2012; Ferreira, Oliveira & Silva, 2015), as species richness, rarity-weighted
richness and phylogenetic diversity were higher in caves containing guano. For instance,
the cave’s deep interior has been compared to a desert since it is largely deprived of
trophic resources (White & Culver, 2012; Pipan & Culver, 2013). Troglobites thus rely on
Jaffé et al. (2018), PeerJ, DOI 10.7717/peerj.4531 15/23external material that is washed into the cave or brought in by mobile species (Poulson &
White, 1969; Taylor, Krejca & Denight, 2005; White & Culver, 2012; Wynne & Voyles, 2013).
Although our findings match those of a recent analysis of 844 iron caves from the Carajás
region, which also found higher species richness in caves containing guano (Jaffé et al.,
2016), they reveal that this trophic resource not only supports higher species richness but
also a higher functional diversity (assessed via phylogenetic diversity). Additionally, our
occurrence models reveal that the presence or absence of guano and other feces determines
the occurrence of certain frequent species (Table 2), as found for other troglobites (Ferreira
& Martins, 1999; White & Culver, 2012).
We also identified an effect of cave declivity and slope on species composition, which
suggests declivity influences the amount of resources that are carried or washed into caves.
Interestingly, species richness, rarity-weighted richness and phylogenetic diversity increased
with increasing distances to creeks, indicating a negative effect of water on cave diversity.
Supporting these findings, a study of 55 limestone caves from the Brazilian Savannah
found that the presence of water bodies significantly influences species composition
(Simões, Souza-Silva & Ferreira, 2015). Similarly, Jaffé et al. (2016) found a lower total
species richness in caves containing water reservoirs. Although we did not find a general
effect of water reservoirs on troglobitic communities, they were found to determine the
occurrence of some frequent species (Table 2). Water thus seems to be an important driver
of troglobitic biodiversity.
Whereas lithology influenced species composition, geomorphology affected species
richness, rarity-weighted richness and phylogenetic diversity. Specifically, the lithology
effect was mainly driven by the amount of basic rocks (Fig. S3), while homogeneous
or sharp differential geomorphology was the strongest correlate of species richness,
rarity-weighted richness and phylogenetic diversity (Fig. S4). Reinforcing our results,
a recent study of ten limestone caves found that the amount of limestone outcrops
surrounding the caves influence invertebrate community composition (Pellegrini et al.,
2016). Likewise, a study of 33 caves from Central Italy revealed that cave morphology
and microclimate strongly affected the composition of non-strict cave dwelling organisms
(Lunghi, Manenti & Ficetola, 2014). Finally, a recent landscape genetic study of secret
cave cricket populations occurring in 42 limestone caves of central Texas, found a strong
influence of karst topography on cricket gene flow (Hutchison et al., 2016). Along with our
findings, this accumulated evidence highlights the role of lithology and geomorphology in
shaping troglobitic communities.
Elevation was another factor found associated with the species composition of troglobitic
communities, with species like Systrophiidae sp.1 occurring at higher elevations and species
like Charinus carajas occurring at lower ones (Table 1, Fig. S1). Interestingly, altitude was
found to be the main variable determining the presence of frequent troglobites, indicating
that these species exhibit narrow elevation preferences (elevation ranged from 224 to 842
masl). This result, along with the fact that frequent species responded differently to cave
characteristics (Table 2), indicates a high level of specialization, as described for many
troglobites (Culver & Pipan, 2009; Pipan & Culver, 2013).
Jaffé et al. (2018), PeerJ, DOI 10.7717/peerj.4531 16/23To our knowledge, ours is the first study revealing an effect of anthropogenic land use
on terrestrial troglobitic communities (Gunn, Hardwick & Wood, 2000; Wood, Gunn &
Perkins, 2002; Moraes, Landis & Molander, 2002). While mining area within 250 m from
the caves influenced species composition, agriculture land cover at the smallest measured
scale (50 m) had a significant impact on species richness and phylogenetic diversity. Larger
mining areas surrounding caves were associated with the occurrence of Paronellidae sp.4,
whereas caves containing smaller or no mining areas usually contained Charinus carajas and
Pyrgodesmidae sp.1 (Fig. S1). These results suggest that Paronellidae sp.4 is more resilient
to mining-led landscape changes than Charinus carajas or Pyrgodesmidae sp.1, which
seem more susceptible (these three species occur in 147, 152, and 85 caves respectively, so
results are not biased by small sample sizes). However, agriculture but not mining land
cover was found associated to species richness and phylogenetic diversity (Table 1). This
result was unexpected, given the huge impact of mining on Canga subterranean habitats
(Fig. 1), and suggests a role of agricultural practices in the observed decay of species
richness and functional diversity. Indeed, herbicides, fungicides, insecticides, fertilizers and
mineral salt are widely used in the region, and farmers frequently burn pasturelands (Perz,
2003). As invertebrates have been found among the most affected group by the pesticide
doses employed (Schiesari et al., 2013), our findings suggest a role of these compounds in
the observed reduction in species richness. Additionally, fire may also influence shallow
subterranean environments, and deforestation is likely to reduce the amount of organic
material reaching the cave’s interior (Beynen & Townsend, 2005). Finally, land use changes
impacting bat populations (i.e., reducing available trophic or roosting resources) are also
likely to affect troglobitic communities by depriving them of guano (Muylaert, Stevens &
Ribeiro, 2016).
Previous studies have reported spatial autocorrelation in the number of troglobitic
species, the number of non-endemics, the number and occurrence frequency of single-cave
endemics, the total number of terrestrial species, the presence of troglobites, and the
presence of rare troglobites (Christman et al., 2005; Jaffé et al., 2016), which suggests that
troglobitic communities are able to influence the troglobitic composition of neighboring
caves. Our results match these findings, as troglobitic species composition, species richness,
rarity-weighted richness, phylogenetic diversity, and the occurrence of frequent troglobites
showed spatial autocorrelation across a range of spatial scales. For instance, the Canga
formations where our study caves are found, are constituted by highly porous rocks that
form many micro-cavities and cracks (Ferreira, 2005; Silva, Martins & Ferreira, 2011; Auler
et al., 2014). These represent potential subterranean habitats that could serve as dispersal
corridors for some troglobitic species (Jaffé et al., 2016), or may actually constitute the
primary subterranean habitat of these organisms, with caves being convenient sampling
sites (Culver & Pipan, 2014). Although no study had yet explicitly evaluated connectivity
between terrestrial troglobitic communities, there is limited evidence for non-obligate
subterranean dwellers (Pipan & Culver, 2007; Carlini et al., 2009; Hutchison et al., 2016).
Here we quantify the influence of landscape resistance on the similarity of terrestrial
troglobitic communities, and found that geographic distance is the main factor determining
community dissimilarity. Importantly, neither land cover, terrain ruggedness or elevation
Jaffé et al. (2018), PeerJ, DOI 10.7717/peerj.4531 17/23were found to influence community dissimilarity, indicating that anthropic land uses,
rough terrain or elevation gradients may not necessarily represent barriers to subterranean
cave connectivity (Christman et al., 2005).
Finally, our study highlights the uniqueness of troglobites, as most troglobitic species
were found to be restricted to one or a few caves (Fig. 5). These rare species, restricted to a
few caves (35 species occurred in a single cave), represent the most threatened short-range
endemics, so they should be conservation priorities. Further actions are nevertheless needed
to increase sampling efforts of single-cave endemics, confirm occurrence areas, and validate
taxonomic identification. Molecular DNA barcoding tools could contribute increase
the accuracy of taxonomic classification and achieve a fast cross-validation of species
occurrences across caves (Juan et al., 2010).
CONCLUSIONS
Our results have important implications for the protection of cave biodiversity. First,
our findings could guide speleological surveys focus on assessing the most relevant
cave characteristics driving troglobitic communities (habitat amount, guano, water,
lithology, geomorphology, and elevation). Second, our results highlight the need to
regulate agriculture in the vicinity (50 m) of iron caves, as agricultural landscapes were
found to have a profound impact on troglobitic biodiversity. Third, our work suggests
that the conservation of cave clusters should be prioritized, as geographic distance was the
main factor determining connectivity between troglobitic communities. Fourth, we argue
that conservation efforts should prioritize species occurring in one or a few caves, and
underline the need for further actions to confirm occurrence areas and validate taxonomic
identification of single-cave endemics. Overall, our work sheds important light onto one of
the most overlooked terrestrial ecosystems, and highlights the need to shift conservation
efforts from individual caves to subterranean habitats as a whole.
ACKNOWLEDGEMENTS
We thank Vale’s Environmental Licensing and Speleology Department for granting access
to its speleology database, and Rafael Melo de Brito for help with GIS analyses.
ADDITIONAL INFORMATION AND DECLARATIONS
Funding
Funding was provided by Instituto Tecnológico Vale and CNPq grants 380535/2017-3
(Gilberto Nicacio) and 307479/2016-1 (Guilherme Oliveira). The funders had no role
in study design, data collection and analysis, decision to publish, or preparation of the
manuscript.
Grant Disclosures
The following grant information was disclosed by the authors:
Instituto Tecnológico Vale.
CNPq grants: 380535/2017-3, 307479/2016-1.
Jaffé et al. (2018), PeerJ, DOI 10.7717/peerj.4531 18/23Competing Interests
Guilherme Oliveira is an Academic Editor for PeerJ.
Author Contributions
• Rodolfo Jaffé, Xavier Prous and Allan Calux conceived and designed the experiments,
performed the experiments, analyzed the data, contributed reagents/materials/analysis
tools, prepared figures and/or tables, authored or reviewed drafts of the paper, approved
the final draft.
• Markus Gastauer and Gilberto Nicacio performed the experiments, analyzed the data,
contributed reagents/materials/analysis tools, prepared figures and/or tables, authored
or reviewed drafts of the paper, approved the final draft.
• Robson Zampaulo performed the experiments, contributed reagents/materials/analysis
tools, authored or reviewed drafts of the paper, approved the final draft.
• Pedro W.M. Souza-Filho performed the experiments, contributed reagents/materials/-
analysis tools, prepared figures and/or tables, authored or reviewed drafts of the paper,
approved the final draft.
• Guilherme Oliveira authored or reviewed drafts of the paper, approved the final draft.
• Iuri V. Brandi and José O. Siqueira authored or reviewed drafts of the paper, approved
the final draft, provided institutional support.
Data Availability
The following information was supplied regarding data availability:
Datasets and R scripts are included as Supplemental Information.
Supplemental Information
Supplemental information for this article can be found online at http://dx.doi.org/10.7717/
peerj.4531#supplemental-information.
REFERENCES
Albuquerque F, Beier P. 2015. Rarity-weighted richness: a simple and reliable alter-
native to integer programming and heuristic algorithms for minimum set and
maximum coverage problems in conservation planning. PLOS ONE 10:e0119905
DOI 10.1371/journal.pone.0119905.
Auler AS, Piló LB. 2015. Caves and mining in Brazil: the dilemma of cave preservation
within a mining context. In: Andreo B, Carrasco F, Durán JJ, Jiménez P, LaMoreaux
JW, eds. Environmental earth sciences. Berlin, Heidelberg: Springer, 487–496
DOI 10.1007/978-3-642-17435-3_55.
Auler A, Piló L, Parker C, Senko J, Sasowsky I, Barton H. 2014. Hypogene cave patterns
in iron ore caves: convergence of forms or processes? In: Klimchouk A, Sasowsky
ID, Mylroie J, Engel SA, Engel AS, eds. Hypogene cave morphologies. Leesburg: Karst
Water Institute, 15–19.
Bates D, Maechler M, Bolker B, Walker S. 2014. lme4: linear mixed-effects models using
Eigen and S4. Available at http:// cran.r-project.org/ package=lme4.
Jaffé et al. (2018), PeerJ, DOI 10.7717/peerj.4531 19/23Beynen P, Townsend K. 2005. A disturbance index for karst environments. Environmen-
tal Management 36:101–116 DOI 10.1007/s00267-004-0265-9.
Bivand RS, Pebesma EJ, Gómez-Rubio V. 2008. Applied spatial data analysis with R.
New York: Springer-Verlag New York.
Bivand R, Piras G. 2015. Comparing implementations of estimation methods for spatial
econometrics. Journal of Statistical Software 63:1–36 DOI 10.18637/jss.v063.i18.
Brunet AK, Medellín RA. 2001. The species—area relationship in bat assemblages of
tropical caves. Journal of Mammalogy 82:1114–1122
DOI 10.1644/1545-1542(2001)0822.0.CO;2.
Carlini DB, Manning J, Sullivan PG, Fong DW. 2009. Molecular genetic variation and
population structure in morphologically differentiated cave and surface populations
of the freshwater amphipod Gammarus minus. Molecular Ecology 18:1932–1945
DOI 10.1111/j.1365-294X.2009.04161.x.
Christman MC, Culver DC, Madden MK, White D. 2005. Patterns of endemism of
the eastern North American cave fauna. Journal of Biogeography 32:1441–1452
DOI 10.1111/j.1365-2699.2005.01263.x.
Christman MC, Doctor DH, Niemiller ML, Weary DJ, Young JA, Zigler KS, Culver DC.
2016. Predicting the occurrence of cave-inhabiting fauna based on features of the
earth surface environment. PLOS ONE 11:e0160408
DOI 10.1371/journal.pone.0160408.
Clarke RT, Rothery P, Raybould AF. 2002. Confidence limits for regression relationships
between distance matrices: estimating gene flow with distance. Journal of Agricul-
tural, Biological, and Environmental Statistics 7:361–372 DOI 10.1198/108571102320.
Culver DC, Christman MC, Šereg I, Trontelj P, Sket B. 2004. The location of terrestrial
species-rich caves in a cave-rich area. Subterranean Biology 2:27–32.
Culver DC, Pipan T. 2009. The biology of caves and other subterranean habitats. New
York: Oxford University Press.
Culver DC, Pipan T. 2014. Shallow subterranean habitats: ecology, evolution, and conserva-
tion. New York: Oxford University Press.
Faith DP. 2015. Phylogenetic diversity, functional trait diversity and extinction:
avoiding tipping points and worst-case losses. Philosophical Transactions of
the Royal Society of London. Series B, Biological Sciences 370:Article 200140011
DOI 10.1098/rstb.2014.0011.
Ferreira RL. 2005. A vida subterrânea nos campos ferruginosos. O Carste 3:106–115.
Ferreira RL, Martins RP. 1999. Trophic structure and natural history of bat guano
invertebrate communities, with special reference to Brazilian caves. Tropical Zoology
12:231–252 DOI 10.1080/03946975.1999.10539391.
Ferreira RL, Oliveira MPA, Silva MS. 2015. Biodiversidade subterrânea em geossistemas
ferruginosos. In: Geossistemas ferruginosos do Brasil: Áreas prioritárias para con-
servação da diversiadde geológica e biológica, patrimônio cultural e serviços ambientais.
Belo Horizonte: Instituto Prístino, 195–231.
Jaffé et al. (2018), PeerJ, DOI 10.7717/peerj.4531 20/23Flynn DFB, Mirotchnick N, Jain M, Palmer MI, Naeem S. 2011. Functional and phy-
logenetic diversity as predictors of biodiversity—ecosystem-function relationships.
Ecology 92:1573–1581 DOI 10.1890/10-1245.1.
Gunn J, Hardwick P, Wood PJ. 2000. The invertebrate community of the Peak—
Speedwell cave system, Derbyshire, England—pressures and considerations for
conservation management. Aquatic Conservation: Marine and Freshwater Ecosystems
10:353–369 DOI 10.1002/1099-0755(200009/10)10:53.0.CO;2-S.
Guzik MT, Austin AD, Cooper SJB, Harvey MS, Humphreys WF, Bradford T, Eberhard
SM, King RA, Leys R, Muirhead KA. 2011. VIEWPOINT. Is the Australian subter-
ranean fauna uniquely diverse? Invertebrate Systematics 24:407–418.
Harvey MS. 2002. Short-range endemism among the Australian fauna: some ex-
amples from non-marine environments. Invertebrate Systematics 16:555–570
DOI 10.1071/IS02009.
Harvey MS, Rix MG, Framenau VW, Hamilton ZR, Johnson MS, Teale RJ, Humphreys
G, Humphreys WF. 2011. Protecting the innocent: studying short-range en-
demic taxa enhances conservation outcomes. Invertebrate Systematics 25:1–10
DOI 10.1071/IS11011.
Hedges SB, Kumar S. 2009. The timetree of life. Oxford: OUP Oxford.
Hedges SB, Marin J, Suleski M, Paymer M, Kumar S. 2015. Tree of life reveals clock-
like speciation and diversification. Molecular Biology and Evolution 32:835–845
DOI 10.1093/molbev/msv037.
Hutchison NL, Lance RF, Pekins CE, Noble ME, Leberg PL. 2016. Influence of geomor-
phology and surface features on the genetic structure of an important trogloxene, the
secret cave cricket (Ceuthophilus secretus). Conservation Genetics 17:969–983.
Jaffé R, Castilla A, Pope N, Imperatriz-Fonseca VL, Metzger JP, Arias MC, Jha S. 2015.
Landscape genetics of a tropical rescue pollinator. Conservation Genetics 17:267–278
DOI 10.1007/s10592-015-0779-0.
Jaffé R, Prous X, Zampaulo R, Giannini T, Imperatriz-Fonseca V, Maurity C, Oliveira
G, Brandi I, Siqueira J. 2016. Reconciling mining with the conservation of cave
biodiversity: a quantitative baseline to help establish conservation priorities. PLOS
ONE 11:e0168348 DOI 10.1371/journal.pone.0168348.
Juan C, Guzik MT, Jaume D, Cooper SJB. 2010. Evolution in caves: darwin’s
‘‘wrecks of ancient life’’ in the molecular era. Molecular Ecology 19:3865–3880
DOI 10.1111/j.1365-294X.2010.04759.x.
Lean C, Maclaurin J. 2016. The value of phylogenetic diversity. In: Biodiversity conserva-
tion and phylogenetic systematics. Cham: Springer, 19–37.
Lunghi E, Manenti R, Ficetola GF. 2014. Do cave features affect underground
habitat exploitation by non-troglobite species? Acta Oecologica 55:29–35
DOI 10.1016/j.actao.2013.11.003.
McRae BH. 2006. Isolation by resistance. Evolution 60:1551–1561
DOI 10.1111/j.0014-3820.2006.tb00500.x.
Jaffé et al. (2018), PeerJ, DOI 10.7717/peerj.4531 21/23Moraes R, Landis WG, Molander S. 2002. Regional risk assessment of a brazilian rain
forest reserve. Human and Ecological Risk Assessment: An International Journal
8:1779–1803 DOI 10.1080/20028091057600.
Muylaert RL, Stevens RD, Ribeiro MC. 2016. Threshold effect of habitat loss on
bat richness in cerrado-forest landscapes. Ecological Applications 26:1854–1867
DOI 10.1890/15-1757.1.
Oksanen J, Blanchet FG, Friendly M, Kindt R, Legendre P, McGlinn D, Minchin PR,
O’Hara RB, Simpson GL, Solymos P, Stevens MHH, Szoecs E, Wagner H. 2016.
vegan: community ecology package. Available at https:// cran.r-project.org/ package=
vegan.
Pellegrini T, Sales LP, Aguiar P, Lopes Ferreira R. 2016. Linking spatial scale depen-
dence of land-use descriptors and invertebrate cave community composition.
Subterranean Biology 18:17–38 DOI 10.3897/subtbiol.18.8335.
Perz SG. 2003. Social determinants and land use correlates of agricultural technology
adoption in a forest frontier: a case study in the Brazilian Amazon. Human Ecology
31:133–165 DOI 10.1023/A:1022838325166.
Pinheiro J, Bates D, DebRoy S, Sarkar D. 2014. nlme: linear and nonlinear mixed effects
models. Available at http:// cran.r-project.org/ package=nlme.
Pipan T, Culver DC. 2007. Copepod distribution as an indicator of epikarst system
connectivity. Hydrogeology Journal 15:817–822 DOI 10.1007/s10040-006-0114-4.
Pipan T, Culver DC. 2013. Subterranean ecosystems. In: Levin SA, ed. Encyclopedia of
Biodiversity. Waltham: Academic Press, 44–62.
Poulson TL, White WB. 1969. The cave environment. Science 165:971–981
DOI 10.1126/science.165.3897.971.
Poveromo JJ. 1999. Iron ores. In: Levin SA, ed. The making, shaping, and treating of steel:
ironmaking volume. Pittsburg: The AISE Steel Foundation, 547–550.
R Core Team. 2015. R: a language and environment for statistical computing. Vienna: R
Project for Statistical Computing. Available at https:// www.R-project.org .
Schiesari L, Waichman A, Brock T, Adams C, Grillitsch B. 2013. Pesticide use and
biodiversity conservation in the Amazonian agricultural frontier. Philosophical
Transactions of the Royal Society B: Biological Sciences 368:Article 20120378
DOI 10.1098/rstb.2012.0378.
Silva MS, Martins RP, Ferreira RL. 2011. Cave lithology determining the structure of
the invertebrate communities in the Brazilian Atlantic Rain Forest. Biodiversity and
Conservation 20:1713–1729 DOI 10.1007/s10531-011-0057-5.
Simões MH, Souza-Silva M, Ferreira RL. 2015. Cave physical attributes influencing the
structure of terrestrial invertebrate communities in Neotropics. Subterranean Biology
16:103–121 DOI 10.3897/subtbiol.16.5470.
Souza-Filho PWM, De Souza EB, Silva Júnior RO, Nascimento WR, Versiani de
Mendonça BR, Guimarães JTF, Dall’Agnol R, Siqueira JO. 2016. Four decades of
land-cover, land-use and hydroclimatology changes in the Itacaiúnas River water-
shed, southeastern Amazon. Journal of Environmental Management 167:175–184
DOI 10.1016/j.jenvman.2015.11.039.
Jaffé et al. (2018), PeerJ, DOI 10.7717/peerj.4531 22/23You can also read