Species versus within species niches: a multi modelling approach to assess range size of a spring dwelling amphibian - Nature
←
→
Page content transcription
If your browser does not render page correctly, please read the page content below
www.nature.com/scientificreports
OPEN Species versus within‑species
niches: a multi‑modelling
approach to assess range size
of a spring‑dwelling amphibian
Forough Goudarzi1, Mahmoud‑Reza Hemami 1*
, Mansoureh Malekian1, Sima Fakheran1 &
Fernando Martínez‑Freiría 2
Species Distribution Models (SDMs) can be used to estimate potential geographic ranges and derive
indices to assess species conservation status. However, habitat-specialist species require fine-scale
range estimates that reflect resource dependency. Furthermore, local adaptation of intraspecific
lineages to distinct environmental conditions across ranges have frequently been neglected in SDMs.
Here, we propose a multi-stage SDM approach to estimate the distributional range and potential
area of occupancy (pAOO) of Neurergus kaiseri, a spring-dwelling amphibian with two climatically-
divergent evolutionary lineages. We integrate both broad-scale climatic variables and fine-resolution
environmental data to predict the species distribution while examining the performance of lineage-
level versus species-level modelling on the estimated pAOO. Predictions of habitat suitability at the
landscape scale differed considerably between evolutionary level models. At the landscape scale,
spatial predictions derived from lineage-level models showed low overlap and recognised a larger
amount of suitable habitats than species-level model. The variable dependency of lineages was
different at the landscape scale, but similar at the local scale. Our results highlight the importance
of considering fine-scale resolution approaches, as well as intraspecific genetic structure of taxa to
estimate pAOO. The flexible procedure presented here can be used as a guideline for estimating pAOO
of other similar species.
Species distribution models (SDMs) are a widely used tool to predict species occurrence and infer their envi-
ronmental requirements1. Although species is the most frequently used evolutionary level to conduct SDMs,
recent studies have suggested that ecological niches of intraspecific evolutionary units may significantly differ,
leading to distinct responses of these units to environmental variation across their ranges2,3. Accounting for local
adaptations of intraspecific lineages is therefore, important when predicting potential distribution of species,
particularly when ‘phylogenetic niche conservatism’ (sensu Harvey and P agel4) is not assumed (e.g. Banerjee
et al.5 and Martínez‐Freiría et al.6).
Conservation decisions such as species’ redlisting require a deep understanding of the species distribution
and abundance7. To assess the conservation status of species, the International Union for Conservation of Nature
(IUCN) uses a number of criteria including the reduction in population size and/or geographic range over a
determined time. The area of occupancy (AOO) is an index of the size of species’ geographic range which is
frequently used in IUCN assessments and shows the rarity of a species through its distribution range8. Classify-
ing taxa correctly into threat categories highly depends on the developed method to quantify species distribu-
tion and approximate A OO9. For habitat-specialist taxa, as well as small, cryptic species which require survey
efforts at the fine spatial resolution, AOO would get a reliable index if it would correctly reflect the area of these
specific sites10. SDMs are potentially applicable in estimating range measures such as AOO if appropriate spatial
resolution considering resource dependency and the relevant variables affecting species occurrence are correctly
selected8. Growing studies have indicated that using model-based approaches reduces uncertainties associated
with the estimation of range size6,11,12.
1
Department of Natural Resources, Isfahan University of Technology, 84156‑83111 Isfahan, Iran. 2CIBIO/InBIO,
Centro de Investigação em Biodiversidade e Recursos Genéticos da Universidade Do Porto, Instituto de Ciências
Agrárias de Vairão R. Padre Armando Quintas, 4485‑661 Vairão, Portugal. *email: mrhemami@iut.ac.ir
Scientific Reports | (2021) 11:597 | https://doi.org/10.1038/s41598-020-79783-0 1
Vol.:(0123456789)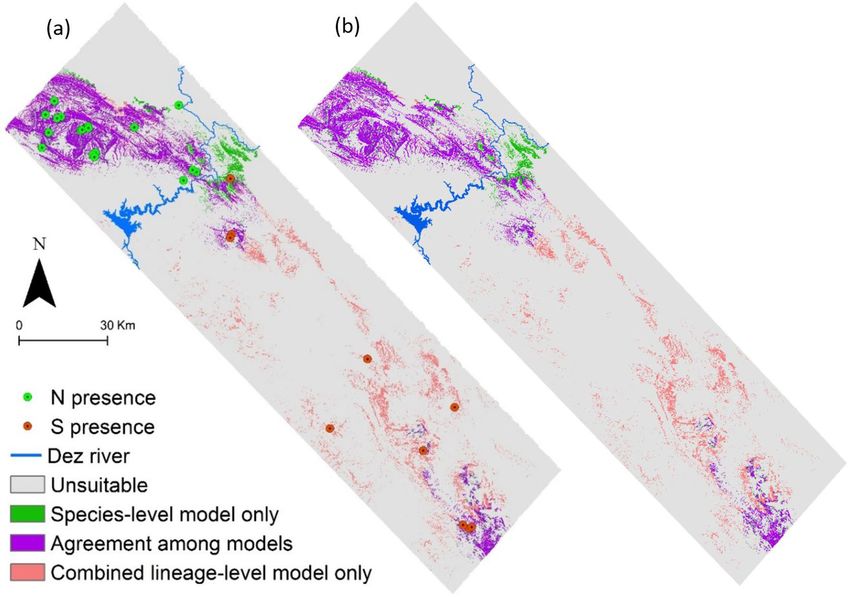
www.nature.com/scientificreports/
Figure 1. Geographic distribution of springs and ponds inhabited by the northern (N) and the southern (S)
lineages of Neurergus kaiseri in southwestern Zagros Mountains, Iran. The maps were generated in ArcGIS 10.4
using the base free map of Digital Elevation Model from Japan Aerospace Exploration Agency (JAXA) under the
Term of Use available from (https://global.jaxa.jp/policy.html). Newt is photographed by FG.
Amphibians are ectothermic habitat-specialist vertebrates with limited dispersal ability, in which local scale
environmental variables are main factors related to their o ccurrence13. A striking case occurs with spring-dweller
amphibians, which are highly dependent on springs and the nearby ponds roughly all over the year. Predicting
the occurrence of these species is very problematic at large scales because the presence of small water bodies
such as springs is not captured in the available environmental predictors (e.g. Worldclim v ariables14), making it
necessary to develop alternative a pproaches15.
Kaiser’s newt (Neurergus kaiseri, Schmidt 1952) is a spring-pond dwelling a mphibian16 distributed sporadi-
cally across southwestern Zagros Mountains of I ran17. Even though there is no estimate of AOO, it is currently
listed as Vulnerable (VU) in the IUCN Red List due to decreasing population trend and habitat f ragmentation18.
Currently, none of the known occurrence sites of N. kaiseri is protected and only a small part of the predicted
distribution of the species stands within the existing protected a reas19. Two species lineages, North (N) and South
(S), are recognised by both mitochondrial and nuclear DNA data, which are separated by Dez River17 (Fig. 1).
These two lineages evolved through allopatric speciation and currently, due to no shared haplotypes in nuDNA
(23,518 RAD loci), are considered as evolutionarily significant u nits17,20. Ecological niche tests have shown that
these lineages occupy similar local habitats within their ancestral niche, but in different climatic conditions17.
Environmental alterations such as climate change or habitat degradation may affect the distribution of each
lineage differently5,21,22 and therefore, it is important to advance into conservation assessments that recognise
local adaptation of populations23.
Here we use a multi-scale SDM approach to show the importance of including within species genetic diver-
sity into SDMs while estimating range-based IUCN’s indices of Kaiser’s newt as a case study. We compare the
estimated suitable areas for the species and its two evolutionary lineages based on different spatial scale envi-
ronmental data and show the scale dependency of the results that may change conservation implications. Our
specific aims are to (1) identify and compare species- and lineage-level range measures of N. kaiseri, and (2)
integrate relevant landscape and local scale predictors in a multi-scale SDM approach. We hypothesise that: (1)
Scientific Reports | (2021) 11:597 | https://doi.org/10.1038/s41598-020-79783-0 2
Vol:.(1234567890)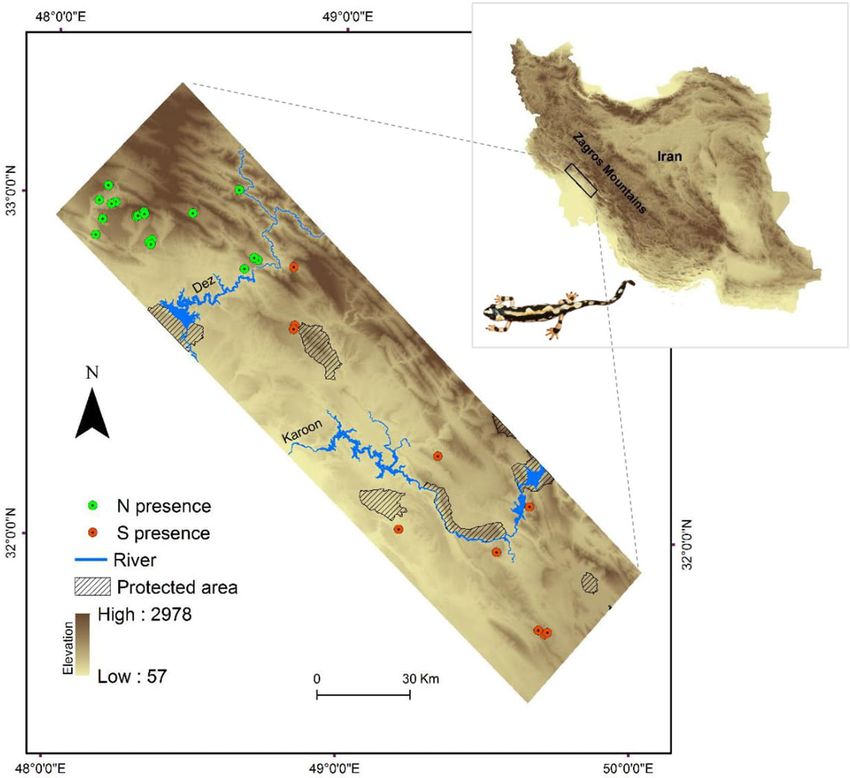
www.nature.com/scientificreports/
Landscape
scale Local scale
N of
records AUC TSS AUC TSS
Species-level 28 0.90 0.50 0.95 0.68
N 18 0.96 0.75 0.95 0.59
Lineage-level
S 10 0.79 0.27 0.96 0.68
Table 1. Number of records used to construct models, and performance of different evolutionary level
models at the landscape and local spatial scales based on the Area Under the Curve of Receiver Operating
Characteristic (AUC) and True Skill Statistic (TSS).
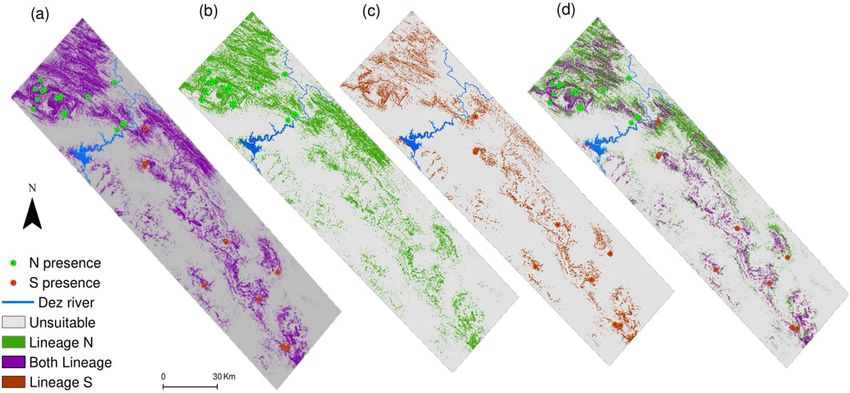
Figure 2. Potentially climatic suitable areas according to (a) Species-level binary model, (b) N lineage binary
model, (c) S lineage binary model and (d) overlay of binary models of the two lineages (N + S binary model) for
Neurergus kaiseri at the landscape scale. The Dez River is depicted as a reference for lineages distribution.
the intraspecific lineage-level compared to species-level SDMs will provide a more accurate measure of N. kaiseri’s
range size, (2) incorporating fine-scale local environmental variables improve the predictions performance of
SDMs, and (3) integrating hypothesis 1 and 2 will help us in a better estimation of the species AOO.
Results
SDM performance. The species-level SDM exhibited good overall predictive performance at landscape and
local scales (Table 1). Lineage N SDM demonstrated excellent overall predictive capacity at both landscape and
local scales (Table 1). Lineage S SDM performed poorly to predict suitable habitat conditions at the landscape
scale, as was evident from the low predictive capacity (AUC = 0.79, TSS = 0.27; Table 1). However, the predictive
power of the S model was significantly enhanced while training under local habitat variables (Table 1).
SDM at landscape scale. The contribution of topo-climatic variables to species and lineages landscape
models were different. Annual mean temperature mostly contributed to species-level modelling, while precipi-
tation seasonality had the highest contribution to the N and S lineages models (see Supplementary Table S1
online). Univariate response curves indicated that the S lineage differently responds to both the annual mean
temperature and precipitation seasonality at the landscape scale (see Supplementary Fig. S1 online).
The predicted climatic range by the species-level model was split up as the two separate northern and southern
range with no overlapped area (Fig. 2a). The climatically suitable range for N lineage was distinctively found
in the north part of the study region (Fig. 2b), but the SDM predicted a wider distribution range for lineage S
(Fig. 2c). Overlaying binary predictions of lineage-level models at the landscape scale revealed that the two line-
ages mainly occupied unique geographic ranges and had low range overlap (Fig. 2d). The probabilistic models
are shown in Supplementary Fig. S2 online.
SDM at local scale. The contribution and permutation importance of variables to species and lineages N
and S local scale models were very similar. Among the six local scale variables, the contribution of forest and
formation distances, and TPI, accounted for more than 77% of the three models’ (i.e. species, N and S) predic-
tions (see Supplementary Table S2 online). The probability of occurrence of the species and both lineage N and S
sharply decreased with increasing distance from forest and conglomerate formations, as well as with increasing
values of TPI (see Supplementary Fig. S1 online).
Scientific Reports | (2021) 11:597 | https://doi.org/10.1038/s41598-020-79783-0 3
Vol.:(0123456789)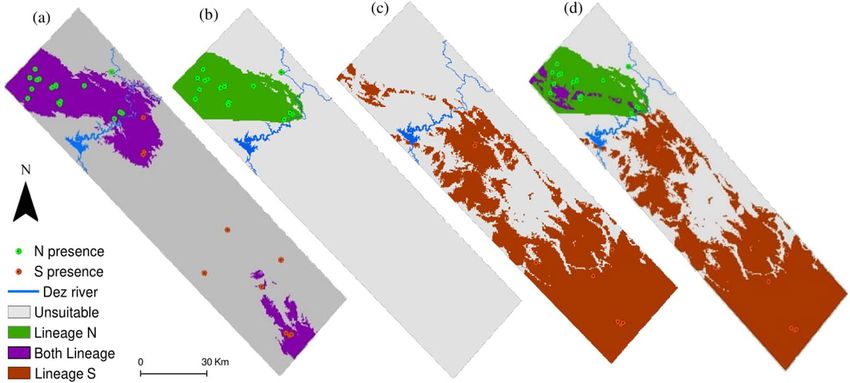
www.nature.com/scientificreports/
Figure 3. Potentially suitable areas according to (a) Species-level binary model, (b) N lineage binary model, (c)
S lineage binary model and (d) overlay of binary models of the two lineages (N + S binary model) for Neurergus
kaiseri at the local scale. The Dez River is depicted as a reference for lineages distribution.
Landscape scale Local scale
N N
Species model Lineage model S Species model Lineage model S
94% 94%
N lineage (18 records) 94% 94% 94% 94%
0% 55%
0% 90%
S lineage (10 records) 70% 90% 90% 90%
90% 90%
Table 2. The percentage of correct classification of each lineage’s occurrence records by species-level and
lineage-level models for each of the two studied landscape and local scales, and the percentage of correct
classification of each lineage’s records by another model (cross-prediction) based on minimum training
presence of known occurrences.
Species-level and both lineages-level models predicted similar distribution ranges for Kaiser’s newt at the
local scale (Fig. 3a). Overlaying analysis verified that lineage N and S had high geographic range overlap, with
approximately no unique areas for lineage S but much unique suitable range for lineage N (Fig. 3b–d). Proba-
bilistic models are shown in Supplementary Fig. S3 online.
SDMs cross‑prediction. The species-level model had the same successful prediction of the records at both
the landscape and local scales. Predictive performance of the S model was enhanced at the local scale relative to
the landscape scale (Table 2). Lineage-level models were more successful than the species-level model in predict-
ing N and S records at the landscape scale and were the same at the local scale (Table 2). Overall, the lineage-level
model had a better predictive performance. Cross-prediction tests showed that a model built with occurrence
records of one lineage could not retrieve climatically suitable areas for the other lineage. At the local scale, the
S model could accurately predict most of N populations’ occurrence, but the S model was not much successful
(Table 2).
Combination of landscape and local scale models. The local scale model predicted less suitable habi-
tat area than the landscape scale model, substantially through lineage-level modelling approach (Table 3).
Results of the lineage-level modelling predicted more unique, suitable habitats for Kaiser’s newt compared to
the species-level model (combining all the presence points for modelling and ignoring the intraspecific distinc-
tion; Table 3, Fig. 4).
The lineage- and species-level models had low Schoener’s D overlap at the landscape scale (D = 0.33) but
were very similar at the local scale (D = 0.86). Although, the distribution maps resulted from the two different
evolutionary-level models were relatively similar (D = 0.62), predicted ranges were considerably different (Fig. 4).
Potential area of occupancy (pAOO). The suitable habitat for Kaiser’s newt accounted for 1006 and 1297
km2 as predicted by species-level and combined lineage-level models, respectively. Agreement of species-level
Scientific Reports | (2021) 11:597 | https://doi.org/10.1038/s41598-020-79783-0 4
Vol:.(1234567890)www.nature.com/scientificreports/
Spatial scale Rank N pixels* % CCR Schoener’s D
Species 3,141,807 85%
Landscape N 1,881,323 94% 0.33
Lineage 8,218,898 92%
S 6,557,992 90%
Species 2,995,407 96%
Local N 2,703,309 94% 0.86
Lineage 2,810,175 92%
S 1,227,324 90%
Species 1,118,135 78%
Landscape + local N 88% 0.62
Lineage 1,441,800 85%
S 80%
Table 3. The number of suitable pixels (30 × 30 m) predicted by each model (N pixels), the percentage of
correct classification of occurrence records by each lineage-/species-level model based on minimum training
presence cut-off threshold (% CCR), and Schoener’s D prediction at the two evolutionary ranks. *Northern and
southern lineages are shared some areas (pixels).
Figure 4. (a) Predicted geographic distribution of Neurergus kaiseri by species- and lineage-level models,
derived from the combined landscape and local scale binary models. (b) Potential area of occupancy (pAOO)
after eliminating non-spring areas at 30 m resolution. Discrepancies and agreements are depicted. The Dez River
is depicted as a reference for lineages distribution.
and combined lineage-level models assigned approximately 805 k m2 suitable area for the species (Fig. 4a). After
overlapping with the modelled spring map, the suitable habitat for Kaiser’s newt (pAOO) was reduced by 8% and
was respectively 928 km2 and 1186 km2 by species-level and combined lineage-level model (see Supplementary
method and Fig. S4 online). Agreement of species-level and combined lineage-level models after eliminating
non-spring areas assigned approximately 743 km2 suitable area for the Kaiser’s newt (Fig. 4b). Comparatively,
predicted pAOO based on the IUCN standard 2 × 2 grids was estimated 3120 km2 by species-level model and
6364 km2 by combined lineage-level model. After eliminating non-spring areas, pAOO at species-level remained
with the same extension, while combined lineage-level model assigned approximately 6180 k m2 pAOO based on
IUCN recommended grid size (see Supplementary Fig. S5 online).
Scientific Reports | (2021) 11:597 | https://doi.org/10.1038/s41598-020-79783-0 5
Vol.:(0123456789)www.nature.com/scientificreports/
Discussion
We developed a multi-scale modelling approach to approximate the potential area of occupancy (pAOO) of
habitat-specialist taxa with contrasting levels of intraspecific genetic and climatic niche divergence. Using the
spring-dwelling amphibian Neurergus kaiseri as a model species, we show the importance of considering species
intraspecific variability and fine-scale local environmental variables to obtain reliable predictions of distributional
ranges for conservation purposes.
Our analyses recognised two climatic variables (i.e. annual mean temperature and precipitation seasonality)
plus elevation as the most important parameters determining N. kaiseri’s distribution. Ectothermic organisms are
highly dependent on environmental conditions, mainly topoclimatic, to develop their a ctivities8,24. In addition,
local scale variables limit species distribution within the climatic distribution. Similar to the findings of other
studies on newt species25–28, TPI, and forest and formation distances were the most important factors limiting
the species distribution range. This implies that at local scale, biophysical rather than bioclimatic variables may
be important in limiting or extending species distribution range, as has also been documented by Manzoor
et al.29. Negative TPI may allow for humidity to be retained and solar radiation to be blocked, providing a more
stable local condition (suitable habitat) for Kaiser’s newt. As direct sunlight causes rapid evaporation of shallow
waters in the hot and dry climate of the species range, sites incorporated enough shaded areas may be selected by
the species. Canopy cover appears to supply the required shade for the northern populations, while topography
provides shade for the southern populations. Several studies indicated a dependency of intraspecific lineages
on distinct environmental d rivers30–32. In our case, the S lineage could compensate for the harsh climate of the
southern region by being limited to local topographic r efugia33. Our study therefore, contributes to the growing
literature which indicates that including multi-scale predictors into SDMs produces a more accurate species’
environmental niche a pproximation34, especially if within-species genetic variation is considered21,22.
A previous related study showed that climatic niches of the two lineages of N. kaiseri were not identical17.
Consequently, we expected that the predicted landscape distribution of the species was dependent on whether to
consider the species or intraspecific lineages as the unit of modelling. We found support for this expectation in
the low Schoener’s D overlap found for topo-climatic niches of lineages, the different variable weights obtained
for species- and lineage-level landscape models and the low cross-prediction capacity of lineage-level models.
In contrast, at the local scale at which lineages had identical occupied n iches17, the predicted areas by the two
different evolutionary-level models were very similar. Also, both species and lineage models were affected by the
same local variables, i.e. forest distance, formation distance and TPI, and the associated response curves showed
a similar profile for these three factors.
We found that incorporating intraspecific genetic information firmly improves the prediction of SDMs. The
combination of topo-climatic niches of both lineages provided a wider range size compared to the topo-climatic
niche inferred for the species; consequently, spatial predictions differed at these two evolutionary levels. Due
to unequal sample size, the species-level model was biased in favour of lineage N, which likely resulted in los-
ing variables’ dependency and consequently reducing the suitable range of lineage S (see Pearman et al.21). The
lineage-level models predicted the occurrence sites with higher accuracy compared to that of the species-level
model and identified climatically suitable unique areas within the distribution range of both lineages (i.e. high
sensitivity). A comparable pattern was recently reported by Lecocq et al.22, and Chardon et al.30. Still, our infer-
ences are based on small sample size (n < 30), and although we used a robust algorithm capable to deal with
small sample size35, our findings must be considered with c aution36. Increasing studies are demonstrating the
necessity of considering intraspecific lineages in SDMs, particularly those with unique evolutionary histories6,37,
and predicting the response of lineages to anthropogenic climate c hange5,21,22,38. Our findings revealed that the
two lineages of the Kaiser’s newt may act differently in response to climate change and should be considered as
separate conservation management units.
In a heterogeneous landscape, habitat-specialist species occupy only a small fraction of their extent of occur-
rence that represents the AOO. Kaiser’s newt is limited to particular topo-climatic and habitat conditions occur-
ring nearby springs and ponds in the South-West Zagros Mountains. Our study is the first applying a SDM to
develop a multi-stage, fine-grid-based procedure for approximating the potential AOO of a spring-dwelling
amphibian. As suggested by Jiménez-Alfaro et al.11, we used fine-spatial-scale data to reduce the uncertainty of
our SDMs for estimating AOO. The use of SDM for AOO estimation has been criticised due to probable extinc-
tion events across the predicted potential suitable range of s pecies39. However, we show it can be useful for rare
species where detectability hampers a good knowledge of distributional r ange39, particularly when appropriate
spatial resolution mirroring resource (i.e. spring/ponds) dependency is considered in model b uilding8.
The IUCN recommends a standard 2 × 2 km resolution to estimate AOO, which frequently requires downscal-
ing or upscaling distributional r anges40. Distinct works have pinpointed that downscaling ranges for estimating
AOO may result in overestimations of this m etric11,41, especially for freshwater t axa25. Here, we recommend
developing taxon-specific standard resolutions to homogenously estimate AOO for conservation applications. In
our study, the use of a very fine grid size (30 × 30 m) for the final model to match the area of species core breeding
habitat reduces overestimations in the pAOO. Still, our pAOO estimation can be upscaled and standardised based
on IUCN recommendation for determining the conservation status of a species. Considering the relatively similar
habitat use pattern of spring-dwelling amphibians, the developed procedure for estimating pAOO can be used
for other spring dwellers worldwide. The developed modelling process can be improved by including finer scale
predictors such as microclimate data and biological covariates (e.g. larvae predators and competitors) if available.
Our results highlight the importance of incorporating fine-scale environmental variables, as well as intraspe-
cific genetic information to estimate AOO. Incorporating this all information will provide us with a more accurate
understanding of the species distribution/AOO for redlisting. Grid-based, standard approaches are known to
introduce an important bias into range measures, particularly in habitat-specialist s pecies25. Eventually, bias
Scientific Reports | (2021) 11:597 | https://doi.org/10.1038/s41598-020-79783-0 6
Vol:.(1234567890)www.nature.com/scientificreports/
may result in misclassifications of taxa on the Red List of threatened Species24. Where possible, conservation
planning for spring-dwelling species should be informed by output of lineage-based rather than species-level
SDMs incorporated with fine-scale environmental variation.
Methods
Model species and study area. The Zagros Mountain range represents the southern, Asian branch of
the Alpine geosynclines. Annual precipitation of over 500 mm has formed a relatively dense oak forest. Karstic
carbonate aquifers, which are highly fed during the wet season, are characteristic of these mountains; where they
meet in contact with nonkarstic formations or alluvium, water emerges as s pring42.
Kaiser’s newt is endemic to the South-West Zagros Mountains of Iran18, patchily occurring in springs sur-
rounded by woodland with rock outcrops. We delimited a study area of 12,635 k m2 covering the entire identified
distribution range of the species and some potentially suitable localities (Fig. 1). The climate through the study
area varies from wet in the north to dry in the south, mainly due to the influence of dry-warm weather from
the Arabian Peninsula in the south-west. The elevation ranges from 57 to around 3,000 m above sea level. Land
use pattern includes intermixed oak woodland and cropland (mainly dry farming), urban and rural residential,
and transportation development leaving a preponderance of forest cover on higher elevations. Lowland steep
slopes are dominated by deciduous and evergreen shrubs with more than 30% cover and desert steppes with
over 10% c over43.
We conducted two systematic surveys during April-June in 2015 and 2016 to locate occupied sites of rare
Kaiser’s newt. The sampling effort included all known permanent breeding sites of the species reported by the
Department of Environment (DOE) and previous s tudies44,45. We also recorded and verified new localities (n = 6)
with the assistance of local people. To reduce observer heterogeneity bias, all occupied springs/ponds were sur-
veyed similarly by one person through dip-netting46. We recorded a total of 30 sites (encompassing springs and
neighbouring ponds) at GPS resolution inhabited by adults and/or larvae of Kaiser’s newt (Fig. 1). Our recorded
localities represented the known range of N. kaiseri as of the final collection in 2017. We avoided the inclusion
of eight further records available in the literature (e.g. Mobaraki et al.45 and Vaissi and S harifi19) due to their
coarse-scale resolution. The average migration distance in closely related species (e.g. crested newts) is about 400
m47. Hence, to ensure preserving at least 500 m distances between localities, we spatially trimmed occurrence
points. The final dataset comprised of 28 occupied sites by the whole species, including 18 by the lineage N and
10 by the lineage S considering the evolutionary history of the species.
Spatial predictors. Landscape scale predictors. Climate is the primary driver of species distribution by
limiting individuals’ establishment and dispersal48. Freely available variables, such as the bioclimatic variables
from Worldclim14 (http://www.worldclim.org/bioclim), are likely spatially biased for our study area due to the
scarce number of weather stations across the region; furthermore, these variables do not match to our sampling
period and are not available for lower resolutions than 30 s (~ 1 km2). Therefore, we derived the 19 bioclimatic
variables from temperature and rainfall data recorded over 13–26 recent years at 20 synoptic stations around our
study region using the ‘biovars’ function in the ‘dismo’49 package in R50. These 19 variables at ~ 500 m resolution
were interpolated using the Spline algorithm that accounts for the elevation (Japan Aerospace Exploration Agen-
cy; JAXA) in ArcGIS 10.451. We selected the input variables considering the physiological and ecological require-
ments of newts and a comprehensive literature review52–56. Furthermore, variables were tested for correlation
and only a set of low correlated variables (Pearson’s pairwise correlations ≤ 0.75) composed of five bioclimatic
(annual mean temperature, Bio1; mean temperature diurnal range, Bio2; temperature seasonality, Bio4; annual
precipitation, Bio12; and precipitation seasonality, Bio15) plus elevation were retained for further analyses.
Local scale predictors. Incoming Solar Radiation (SR), Topographic Wetness Index (TWI) and Topographic
Position Index (TPI) were extracted from 30 m resolution Digital Elevation Model (DEM) (Japan Aerospace
Exploration Agency; JAXA) in ArcGIS 10.451 and used as a proxy of the local climate. SR affects habitat con-
ditions and contains the information on aspect, slope, and latitude57. The spatial variation of solar radiation
(Wh/m2) is severely influenced by the topography at the landscape scale, which along with temporal (daily and
annual) variation contributes to local climate variability. Average solar radiation was calculated hourly for the 1st
and 15th of each month from March to October (active season of the study species) using the Solar Radiation
rcGIS51 Spatial Analyst extension. TWI is a steady-state wetness index used for quantifying effects of
tool of the A
topography on hydrological processes, such as surface flow and is calculated from the flow accumulation across
the landscape. TPI is an index of topographic roughness and compares the elevation of each cell in a DEM to
the mean elevation of a specified neighbourhood around that cell (local window). As TPI is naturally very scale-
dependent, it was calculated relative to 10, 30, 50, 70, 90, 110, 130 and 150 m neighbourhoods using the Land
Facet Corridor Tool58. The absolute value of TPI increased with increasing neighbourhood size up to 90 m, and
then remained unchanged beyond that; thus, a 90 m neighbourhood TPI was considered the most representative
of the terrain roughness of the study area and was used for modelling. Negative values represent grids that are
lower in elevation than their surrounding (e.g. ravines), positive values represent grids that are relatively higher
(e.g. ridge) and zero means a flat or low slope area. In addition, NDVI (the Normalised Difference Vegetation
Index) was derived from non-cloudy images of Landsat-7 ETM (9 and 15 June 2015). We considered the influ-
ence of the terrestrial habitat surrounding breeding sites by measuring the distance from breeding sites to the
edge of the forest, Forest distance. We used a worldwide 30 m resolution land cover map produced by Chen
et al.43. According to this map, the forest in the study area includes a canopy cover of more than 30% and sparse
woodlands with a cover of 10–30%.
Scientific Reports | (2021) 11:597 | https://doi.org/10.1038/s41598-020-79783-0 7
Vol.:(0123456789)www.nature.com/scientificreports/
Many ecological studies on amphibians have concluded that geological substrate is a key driver of amphibian
habitat suitability28,59. We used the National Iranian Oil Company’s 1:100,000 geological map and considered dis-
tance to conglomerate formation across the study area as a geological predictor, Formation distance. In the study
region, conglomerate substrates (i.e. Kashkan and Bakhtiari formations) have high porosity and the capability
to store phreatic water27. This physical property provides water and hiding cavities for newts; hence, it increases
the probability of their presence. Since there were no significant pairwise, correlated variables, as tested using
the Band Collection Statistics tool in ArcGIS51, all six variables were employed in the model building.
Multi spatial scale distribution modelling. Collecting true absence data is difficult in species with
secretive behaviour such as most of the amphibian species. Lack of true absences hampers the use of presence/
absence approaches, which are based on the strong assumption that species are perfectly detected. We used Max-
ent V.3.4.160, a presence-background method for model building, which has a high predictive power even when
there is only a small sample of presence p oints60, and has been widely used in spatial ecology (e.g. Martínez‐Frei-
ría et al. , Rodríguez-Rodríguez et al. , Banerjee et al.5).
6 3
We selected a total of 11 predictive variables gathered at distinct spatial scales (i.e. landscape and local scale).
Integrating all of these variables in a unique model would imply upscaling the local variables from 30 to 500 m
resolution, causing the loss of fine-scale habitat information. On the other hand, considering our small sample
size, incorporating many predictors introduce complexity that would affect model p rediction61. Hence, we imple-
mented a two-step modelling procedure dividing the selected variables into the two steps.
SDMs development. We used three occurrence datasets for model building: (1) all occurrences for the spe-
cies (28 records), (2) occurrence of lineage N (18 records), and (3) occurrence of lineage S (ten records). Our
approach followed these steps (see Supplementary Fig. S6 online): (1) Landscape and local predictors were sepa-
rately employed to construct species-level and lineage-level models in Maxent (six distinct models in total); (2)
Average variable contribution and permutation importance of the models, as well as response curve profiles,
were considered to identify the most important variables affecting the distribution of the species and lineages at
both landscape and local scales; (3) Minimum training presence logistic threshold (MTP) was used to convert
the continuous predictions generated by Maxent to binary predictions due to its capacity in classifying all the
localities with records of N. kaiseri as suitable (see Supplementary Note and Table S3 online); (4) N and S binary
models were overlaid and compared to the species-level binary model to assess the predictive power of the two
different evolutionary level SDMs (species‐level model versus lineage‐level models); (5) Binary landscape scale
models were resampled into 30 m resolution and overlaid with local scale models at the two different evolution-
ary levels (i.e. species- and lineage-level). Congruent pixels depicting suitable areas at both spatial scales were
selected.
We developed all Maxent models with the following settings. We ran 30 bootstrap replicates for N and
S populations. A 75/25 ratio was devoted to randomly splitting the occurrence data into train/test in model
building. We implemented the random seed option to guarantee utilising a separate train/test dataset in every
run. Recent studies have claimed that using the default setting is not always the appropriate option (e.g. Merow
et al.62; Radosavljevic and A nderson63) especially when the sample size is s mall64. In addition, the number of
model parameters affects model complexity, which may cause over-fitting65. To control the model complexity
and over-parameterisation, we calculated the beta multiplier and also reduced the number of included features
and covariates66. We ran the model using different regularisation beta-multiplier values (0.5, 1, 2) and assessed
the most parsimonious N and S models based on Akaike’s Information Criterion corrected for small sample size
(AICc). Accordingly, the final models were built with a beta-multiplier of 1. We also selected different features
based on the available number of occupied sites for each model: Linear, Quadratic and Hinge for lineage N with
18 records and Linear and Quadratic for lineage S with 10 r ecords67.
Model evaluation. For assessing the performance of the models at the landscape and local scales (hypothesis
1) in discriminating suitable/unsuitable areas, we took the advantages of two evaluators. To show the general
accuracy of the models, we used the Area Under the Curve of Receiver Operating Characteristic (AUC), and
to evaluate the predictions after being transformed with the selected threshold, the True Skill Statistic (TSS)68
was employed6,21. For assessing the predictive performance of different models at different evolutionary ranks
(hypothesis 2), we calculated the percentage of correct classification records by each of the intraspecific lineages
and binarised species SDMs based on MTP cut-off threshold. To calculate sensitivity (proportion of correctly
identified presences) we employed the recorded N. kaiseri occurrences which used to calibrate the SDMs. We
also quantified the similarity of the prediction of the two model types based on Schoener’s D index69 using
ENMtools70. For more comparison, we also calculated the suitable area predicted by each model type.
Potential occupancy areas. Kaiser’s newt is a spring-breeder; a characteristic derived from its stream-breeding
ancestors16. To find the sites potentially suitable for being occupied by Kaiser’s newt, we masked the two models
(i.e. species and combined lineage-level model) by a spring map produced through a distribution modelling
approach (see Supplementary Method online). This assisted to eliminate the areas other than spring sites where
the species could not persist. We also estimated the AOO adapted from the IUCN Red List criteria (i.e. 2 × 2 km
grid cells40), and ran through the R50 package ‘Redlistr’71. We specified that at least one per cent of a grid cell
should be potentially occupied to be counted in estimating pAOO.
Data availability
Distribution data will be available on reasonable request.
Scientific Reports | (2021) 11:597 | https://doi.org/10.1038/s41598-020-79783-0 8
Vol:.(1234567890)www.nature.com/scientificreports/
Received: 25 October 2020; Accepted: 11 December 2020
References
1. Araújo, M. B. et al. Standards for distribution models in biodiversity assessments. Sci. Adv. 5, eaat4858 (2019).
2. Peterson, M. L., Doak, D. F. & Morris, W. F. Incorporating local adaptation into forecasts of species’ distribution and abundance
under climate change. Glob. Change. Biol 25, 775–793 (2019).
3. Rodríguez-Rodríguez, E. J. et al. Niche models at inter- and intraspecific levels reveal hierarchical niche differentiation in midwife
toads. Sci. Rep. 10, 10942 (2020).
4. Harvey, P. H. & Pagel, M. D. The Comparative Method in Evolutionary Biology Vol. 239 (Oxford University Press, Oxford, 1991).
5. Banerjee, A. K., Mukherjee, A., Guo, W., Ng, W. L. & Huang, Y. Combining ecological niche modeling with genetic lineage informa-
tion to predict potential distribution of Mikania micrantha Kunth in South and Southeast Asia under predicted climate change.
Glob. Ecol. Conserv. 20, e00800 (2019).
6. Martínez-Freiría, F. et al. Climatic refugia boosted allopatric diversification in western Mediterranean vipers. J. Biogeogr. https://
doi.org/10.1111/jbi.13861(2020).
7. Groom, Q. J., Marsh, C. J., Gavish, Y. & Kunin, W. E. How to predict fine resolution occupancy from coarse occupancy data. Methods
Ecol. Evol. 9, 2273–2284 (2018).
8. Li, Y. et al. Climate and topography explain range sizes of terrestrial vertebrates. Nat. Clim. Change 6, 498–502 (2016).
9. Cardoso, P., Borges, P. A. V., Triantis, K. A., Ferrández, M. A. & Martín, J. L. Adapting the IUCN Red List criteria for invertebrates.
Biol. Conserv. 144, 2432–2440 (2011).
10. Burbidge, A., Woinarski, J. & Harrison, P. The Action Plan for Australian Mammals 2012 (Csiro Publishing, Clayton, 2014).
11. Jiménez-Alfaro, B., Draper, D. & Nogués-Bravo, D. Modeling the potential area of occupancy at fine resolution may reduce uncer-
tainty in species range estimates. Biol. Conserv. 147, 190–196 (2012).
12. Kamino, L. H. Y., Siqueira, M., Sánchez-Tapia, A. & Stehmann, J. R. Reassessment of the extinction risk of endemic species in the
Neotropics: how can modelling tools help us. Nat. Conserv. 10, 191–198 (2012).
13. Kluber, M. R., Olson, D. H. & Puettmann, K. J. Amphibian distributions in riparian and upslope areas and their habitat associations
on managed forest landscapes in the Oregon Coast Range. For. Ecol. Manage 256, 529–535 (2008).
14. Hijmans, R. J., Cameron, S. E., Parra, J. L., Jones, P. G. & Jarvis, A. Very high resolution interpolated climate surfaces for global
land areas. Int. J. Climatol. 25, 1965–1978 (2005).
15. Guisan, A. & Thuiller, W. Predicting species distribution: offering more than simple habitat models. Ecol. Lett. 8, 993–1009 (2005).
16. Steinfartz, S., Hwang, U. W., Tautz, D., Öz, M. & Veith, M. Molecular phylogeny of the salamandrid genus Neurergus: evidence for
an intrageneric switch of reproductive biology. Amphib-Reptilia. 23, 419–431 (2002).
17. Goudarzi, F. et al. Geographic separation and genetic differentiation of populations are not coupled with niche differentiation in
threatened Kaiser’s spotted newt (Neurergus kaiseri). Sci. Rep. 9, 6239 (2019).
18. IUCN SSC Amphibian Specialist Group. Neurergus kaiseri. The IUCN Red List of Threatened Species 2016: e.T59450A49436271.
https://doi.org/10.2305/IUCN.UK.2016-3.RLTS.T59450A49436271.en. Downloaded on 29 November 2018.
19. Vaissi, S. & Sharifi, M. Integrating multi-criteria decision analysis with a GIS-based siting procedure to select a protected area for
the Kaiser’s mountain newt, Neurergus kaiseri (Caudata: Salamandridae). Glob. Ecol. Conserv. 20, e00738 (2019).
20. Rancilhac, L. et al. Phylogeny and species delimitation of Near Eastern Neurergus newts (Salamandridae) based on genome-wide
RADseq data analysis. Mol. Phylogenet. Evol. 133, 189–197 (2019).
21. Pearman, P. B., D’Amen, M., Graham, C. H., Thuiller, W. & Zimmermann, N. E. Within-taxon niche structure: niche conservatism,
divergence and predicted effects of climate change. Ecography 33, 990–1003 (2010).
22. Lecocq, T., Harpke, A., Rasmont, P. & Schweiger, O. Integrating intraspecific differentiation in species distribution models: Con-
sequences on projections of current and future climatically suitable areas of species. Divers. Distrib. 25, 1088–1100 (2019).
23. Rodríguez-Rodríguez, E. J. et al. Climate change challenges IUCN conservation priorities: A test with western Mediterranean
amphibians. SN Appl. Sci. 2, 216 (2020).
24. Joppa, L. N. et al. Impact of alternative metrics on estimates of extent of occurrence for extinction risk assessment. Conserv. Biol.
30, 362–370 (2016).
25. Denoël, M. & Ficetola, G. F. Landscape-level thresholds and newt conservation. Ecol. Appl. 17, 302–309 (2007).
26. Denoël, M. et al. A multi-scale approach to facultative paedomorphosis of European newts (Salamandridae) in the Montenegrin
karst: distribution pattern, environmental variables, and conservation. Biol. Conserv. 142, 509–517 (2009).
27. Ildos, A. S. & Ancona, N. Analysis of amphibian habitat preferences in a farmland area (Po plain, northern Italy). Amphib-Reptilia.
15, 307–316 (1994).
28. Beebee, T. J. Discriminant analysis of amphibian habitat determinants in South-East England. Amphib-Reptilia. 6, 35–43 (1985).
29. Manzoor, S. A., Griffiths, G. & Lukac, M. Species distribution model transferability and model grain size—finer may not always
be better. Sci. Rep. 8, 7168 (2018).
30. Chardon, N. I., Pironon, S., Peterson, M. L. & Doak, D. F. Incorporating intraspecific variation into species distribution models
improves distribution predictions, but cannot predict species traits for a wide-spread plant species. Ecography 43, 60–74 (2020).
31. Maguire, K. C., Shinneman, D. J., Potter, K. M. & Hipkins, V. D. Intraspecific niche models for ponderosa pine (Pinus ponderosa)
suggest potential variability in population-level response to climate change. Syst. Biol 67, 965–978 (2018).
32. Barria, A. M. et al. The importance of intraspecific variation for niche differentiation and species distribution models: The ecologi-
cally diverse frog pleurodema thaul as study case. Evol. Biol. 47, 206–219 (2020).
33. Austin, M. P. & Van Niel, K. P. Impact of landscape predictors on climate change modelling of species distributions: A case study
with Eucalyptus fastigata in southern New South Wales, Australia. J. Biogeogr. 38, 9–19 (2011).
34. Fournier, A., Barbet-Massin, M., Rome, Q. & Courchamp, F. Predicting species distribution combining multi-scale drivers. Glob.
Ecol. Conserv. 12, 215–226 (2017).
35. Hernandez, P. A., Graham, C. H., Master, L. L. & Albert, D. L. The effect of sample size and species characteristics on performance
of different species distribution modeling methods. Ecography 29, 773–785 (2006).
36. Wisz, M. S. et al. Effects of sample size on the performance of species distribution models. Divers. Distrib. 14, 763–773 (2008).
37. Dinis, M. et al. Allopatric diversification and evolutionary melting pot in a North African Palearctic relict: the biogeographic
history of Salamandra algira. Mol. Phylogenet. Evol. 130, 81–91 (2019).
38. Schulte, U. et al. Cryptic niche conservatism among evolutionary lineages of an invasive lizard. Glob. Ecol. Biogeogr 21, 198–211
(2012).
39. Breiner, F. T., Guisan, A., Nobis, M. P. & Bergamini, A. Including environmental niche information to improve IUCN Red List
assessments. Divers. Distrib. 23, 484–495 (2017).
40. IUCN Standards and Petitions Committee. Guidelines for Using the IUCN Red List Categories and Criteria, ver. 14. The Standards
and Petitions Committee. https://www.iucnredlist.org/documents/RedListGuidelines.pdf (accessed 22 March 2020). (2019).
41. Hartley, S. & Kunin, W. E. Scale dependency of rarity, extinction risk, and conservation priority. Conserv. Biol. 17, 1559–1570
(2003).
42. Raeisi, E. & Stevanovic, Z. Groundwater Hydrology of Springs 498–515 (Elsevier, Amsterdam, 2010).
Scientific Reports | (2021) 11:597 | https://doi.org/10.1038/s41598-020-79783-0 9
Vol.:(0123456789)www.nature.com/scientificreports/
43. Chen, J. et al. Global land cover mapping at 30 m resolution: A POK-based operational approach. ISPRS J. Photogramm. Remote
Sens. 103, 7–27 (2015).
44. Sharifi, M., Farasat, H., Barani-Beiranvand, H., Vaissi, S. & Foroozanfar, E. Notes on the distribution and abundance of the endan-
gered kaiser’s mountain newt, neurergus kaiseri (caudata: salamandridae), in southwestern Iran. Herpetol. Conserv. Biol 8, 724–731
(2013).
45. Mobaraki, A. et al. A conservation reassessment of the Critically Endangered, Lorestan newt Neurergus kaiseri (Schmidt 1952) in
Iran. Amphib. Reptile Conserv. 9, 16–25 (2014).
46. Casula, P., Vignoli, L., Luiselli, L. & Lecis, R. Local abundance and observer’s identity affect visual detectability of Sardinian
mountain newts. Herpetol. J. 27, 258–265 (2017).
47. Joly, P., Morand, C. & Cohas, A. Habitat fragmentation and amphibian conservation: Building a tool for assessing landscape matrix
connectivity. BC. R. Biol. 326, 132–139 (2003).
48. Pearson, R. G. & Dawson, T. P. Predicting the impacts of climate change on the distribution of species: are bioclimate envelope
models useful?. Glob. Ecol. Biogeogr 12, 361–371 (2003).
49. Hijmans, R. J., Phillips, S., Leathwick, J. & Elith, J. dismo: Species distribution modeling. R package version 1.0-12. The R Foundation
for Statistical Computing, Vienna. http://cran.r-project.org (2015).
50. R Core Team. R: A Language and Environment for Statistical Computing (R Foundation for Statistical Computing, Vienna, 2013).
51. ESRI. Using ecological niche modeling. (2016).
52. Blank, L. & Blaustein, L. Using ecological niche modeling to predict the distributions of two endangered amphibian species in
aquatic breeding sites. Hydrobiologia 693, 157–167 (2012).
53. Bradie, J. & Leung, B. A quantitative synthesis of the importance of variables used in MaxEnt species distribution models. J. Bio-
geogr. 44, 1344–1361 (2017).
54. Cunningham, H. R., Rissler, L. J., Buckley, L. B. & Urban, M. C. Abiotic and biotic constraints across reptile and amphibian ranges.
Ecography 39, 1–8 (2015).
55. Peterman, W. E. & Semlitsch, R. D. Fine-scale habitat associations of a terrestrial salamander: the role of environmental gradients
and implications for population dynamics. PLoS ONE 8, e62184 (2013).
56. Vasconcelos, T. S., Rodríguez, M. Á. & Hawkins, B. A. Species distribution modelling as a macroecological tool: A case study using
New World amphibians. Ecography 35, 539–548 (2012).
57. Keating, K. A., Gogan, P. J. P., Vore, J. M. & Irby, L. R. A simple solar radiation index for wildlife habitat studies. J. Wildl. Manage.
71, 1344–1348 (2007).
58. Jenness, J., Brost, B. & Beier, P. Land Facet Corridor Designer: Extension for ArcGIS. Jenness Enterprises. http://www.jennessent
.com/arcgis/land_facets.htm. (2013).
59. Marnell, F. Discriminant analysis of the terrestrial and aquatic habitat determinants of the smooth newt (Triturus vulgaris) and
the common frog (Rana temporaria) in Ireland. J Zool 244, 1–6 (2001).
60. Phillips, S. J., Anderson, R. P. & Schapire, R. E. Maximum entropy modeling of species geographic distributions. Ecol. Model. 190,
231–259 (2006).
61. Warren, D. L., Wright, A. N., Seifert, S. N. & Shaffer, H. B. Incorporating model complexity and spatial sampling bias into ecological
niche models of climate change risks faced by 90 C alifornia vertebrate species of concern. Divers. Distrib. 20, 334–343 (2014).
62. Merow, C., Smith, M. J. & Silander, J. A. A practical guide to MaxEnt for modeling species’ distributions: What it does, and why
inputs and settings matter. Ecography 36, 1058–1069 (2013).
63. Radosavljevic, A. & Anderson, R. P. Making better Maxent models of species distributions: Complexity, overfitting and evaluation.
J. Biogeogr. 41, 629–643 (2014).
64. Morales, N. S., Fernández, I. C. & Baca-González, V. MaxEnt’s parameter configuration and small samples: Are we paying attention
to recommendations? A systematic review. PeerJ 5, e3093 (2017).
65. Shcheglovitova, M. & Anderson, R. P. Estimating optimal complexity for ecological niche models: A jackknife approach for species
with small sample sizes. Ecol. Modell. 269, 9–17 (2013).
66. Moreno-Amat, E. et al. Impact of model complexity on cross-temporal transferability in Maxent species distribution models: An
assessment using paleobotanical data. Ecol. Model. 312, 308–317 (2015).
67. Elith, J. et al. A statistical explanation of MaxEnt for ecologists. Divers. Distrib. 17, 43–57 (2011).
68. Allouche, O., Tsoar, A. & Kadmon, R. Assessing the accuracy of species distribution models: Prevalence, kappa and the true skill
statistic (TSS). J. Appl. Ecol. 43, 1223–1232 (2006).
69. Schoener, T. W. The Anolis lizards of Bimini: Resource partitioning in a complex fauna. Ecology 49, 704–726 (1968).
70. Warren, D. L., Glor, R. E. & Turelli, M. Environmental niche equivalency versus conservatism: Quantitative approaches to niche
evolution. Evolution 62, 2868–2883 (2008).
71. Lee, C. K. F., Keith, D. A., Nicholson, E. & Murray, N. J. Redlistr: tools for the IUCN Red Lists of ecosystems and threatened species
in R. Ecography 42, 1050–1055 (2019).
Acknowledgements
We are grateful to Stiftung Artenschutz’s Amphibian Fund for providing financial support, Luristan and Kuzistan
Provincial Departments of Environment for providing logistics in the field. A. Parsa, Mr Azarbad, K. Dodan-
geh, G. Poursatar, N. Jarang, M. Naserpour, K. Mirdoraghi, Y. Ghenaatkar, R. Goudarzi and M. Izadi for their
assistance during the fieldwork and to three anonymous referees for valuable suggestions that improved the
manuscript. FM-F is supported by a contract from FCT Portugal (ref. DL57/2016/CP1440/CT0010).
Author contributions
M.R.H. designed the study. F.G. collected and analysed the data, produced the figures, and wrote the preliminary
manuscript. F.G., M.R.H., F.M.-F., M.M. and S.F. discussed conceptual issues. F.G., M.R.H., F.M.-F. revised the
text and contributed comments to the final version of the manuscript.
Competing interests
The authors declare no competing interests.
Additional information
Supplementary Information The online version contains supplementary material available at https://doi.
org/10.1038/s41598-020-79783-0.
Correspondence and requests for materials should be addressed to M.-R.H.
Reprints and permissions information is available at www.nature.com/reprints.
Scientific Reports | (2021) 11:597 | https://doi.org/10.1038/s41598-020-79783-0 10
Vol:.(1234567890)www.nature.com/scientificreports/
Publisher’s note Springer Nature remains neutral with regard to jurisdictional claims in published maps and
institutional affiliations.
Open Access This article is licensed under a Creative Commons Attribution 4.0 International
License, which permits use, sharing, adaptation, distribution and reproduction in any medium or
format, as long as you give appropriate credit to the original author(s) and the source, provide a link to the
Creative Commons licence, and indicate if changes were made. The images or other third party material in this
article are included in the article’s Creative Commons licence, unless indicated otherwise in a credit line to the
material. If material is not included in the article’s Creative Commons licence and your intended use is not
permitted by statutory regulation or exceeds the permitted use, you will need to obtain permission directly from
the copyright holder. To view a copy of this licence, visit http://creativecommons.org/licenses/by/4.0/.
© The Author(s) 2021
Scientific Reports | (2021) 11:597 | https://doi.org/10.1038/s41598-020-79783-0 11
Vol.:(0123456789)You can also read


