Assessing and zoning of typhoon storm surge risk with a geographic information system (GIS) technique: a case study of the coastal area of Huizhou ...
←
→
Page content transcription
If your browser does not render page correctly, please read the page content below
Nat. Hazards Earth Syst. Sci., 21, 439–462, 2021
https://doi.org/10.5194/nhess-21-439-2021
© Author(s) 2021. This work is distributed under
the Creative Commons Attribution 4.0 License.

Assessing and zoning of typhoon storm surge risk with
a geographic information system (GIS) technique:
a case study of the coastal area of Huizhou
Si Wang1 , Lin Mu1,2,3 , Zhenfeng Yao4 , Jia Gao1 , Enjin Zhao1 , and Lizhe Wang5
1 College of Marine Science and Technology, China University of Geosciences, Wuhan, 430074, China
2 Shenzhen  Research Institute, China University of Geosciences, Shenzhen, 518057, China
3 College of Life Sciences and Oceanography, Shenzhen University, Shenzhen, 518060, China
4 Department of Natural Resources of Huizhou Bureau, Huizhou, 516001, China
5 College of Computer Science, China University of Geosciences, Wuhan, 430074, China

Correspondence: Lin Mu (moulin1977@hotmail.com)

Received: 18 April 2020 – Discussion started: 12 June 2020
Revised: 4 October 2020 – Accepted: 18 November 2020 – Published: 29 January 2021

Abstract. Storm surge is one of the most destructive marine       barriers, only a small proportion of the petrochemical in-
disasters to life and property for Chinese coastal regions, es-   dustrial zone and the densely populated communities in the
pecially for Guangdong Province. In Huizhou city, Guang-          coastal areas were at risk of storm surge for the scenarios
dong Province, due to the high concentrations of chemical         of 10- and 20-year return period typhoon intensity. More-
and petroleum industries and the high population density,         over, some parts of the exposed zone and densely populated
the low-lying coastal area is susceptible to the storm surge.     communities were subject to high and very high risk when
Therefore, a comprehensive risk assessment of storm surge         typhoon intensities were set to a 50- or a 100-year return
over the coastal area of Huizhou can delimit zones that could     period. Besides, the scenario with the most intense typhoon
be affected to reduce disaster losses. In this paper, typhoon     (1000-year return period) induced a very high risk to the
intensity for the minimum central pressure of 880, 910, 920,      coastal area of Huizhou. Accordingly, the risk maps can help
930, and 940 hPa (corresponding to a 1000-, 100-, 50-, 20-,       decision-makers to develop risk response plans and evacu-
and 10-year return period) scenarios was designed to cover        ation strategies in coastal communities with a high popula-
possible situations. The Jelesnianski method and the Ad-          tion density to minimize civilian casualties. The risk analysis
vanced Circulation (ADCIRC) model coupled with the Sim-           can also be utilized to identify the risk zones with the high
ulating Waves Nearshore (SWAN) model were utilized to             concentration of chemical and petroleum industries to reduce
simulate inundation extents and depths of storm surge over        economic losses and prevent environmental damage caused
the computational domain under these representative scenar-       by the chemical pollutants and oil spills from petroleum fa-
ios. Subsequently, the output data from the coupled simu-         cilities and infrastructures that could be affected by storm
lation model (ADCIRC–SWAN) were imported to the ge-               surge.
ographic information system (GIS) software to conduct the
hazard assessment for each of the designed scenarios. Then,
the vulnerability assessment was made based on the dataset
of land cover types in the coastal region. Consequently, the      1   Introduction
potential storm surge risk maps for the designed scenarios
were produced by combining hazard assessment and vulner-          Storm surge is the abnormal rise in sea level during tropi-
ability assessment with the risk matrix approach. The risk        cal cyclones, and the surge is primarily produced by strong
maps indicate that due to the protection given by storm surge     storm winds pushing water into shore. When a tropical cy-
                                                                  clone makes landfall, the accompanying storm surge will

Published by Copernicus Publications on behalf of the European Geosciences Union.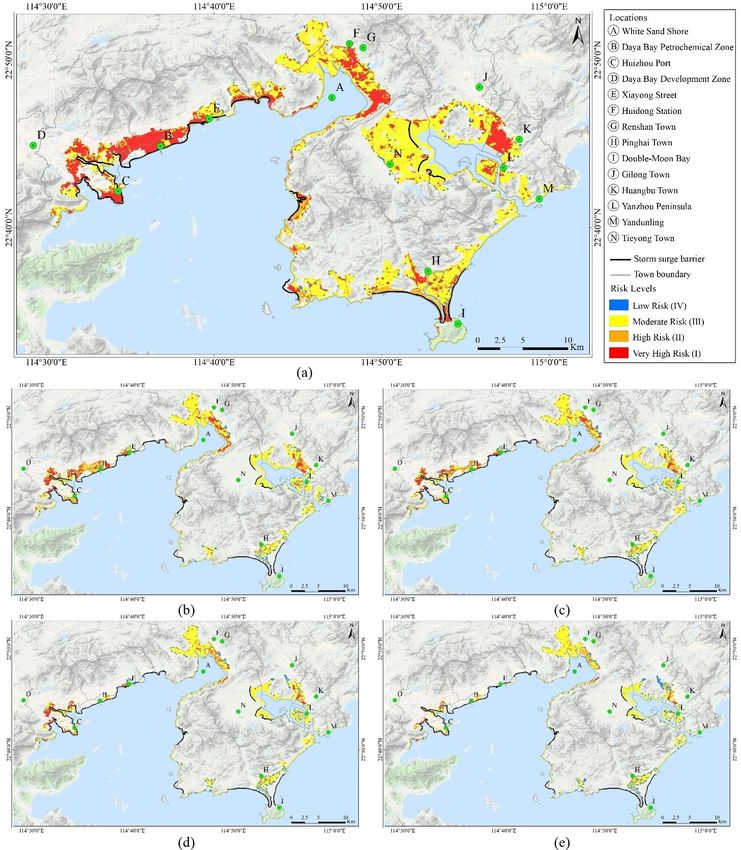
440                                S. Wang et al.: Assessing and zoning of typhoon storm surge risk with a GIS technique

lead to significant flooding in the surrounding coastal area.     bility (Crichton, 1999; Kaźmierczak and Cavan, 2011; Koks
Therefore, storm surge associated with tropical cyclones is a     et al., 2015):
devastating hazard and frequently causes considerable deaths
                                                                   1. The hazard is defined as a natural event that causes im-
and property damage in many coastal regions of the world.
                                                                      pacts on people and infrastructures. The hydrodynamic
For example, in August 2005, Hurricane Katrina struck the
                                                                      models, wave models, and the statistical methods are
United States, and the storm surge from Katrina along the
                                                                      applied to the qualitative evaluation of storm surge haz-
Gulf Coast area was ranging from 3 m (10 ft) to 8.5 m (28 ft)
                                                                      ard. With the statistical methods, the relation between
high. It caused USD 108 billion in property damages and re-
                                                                      minimum central pressure and return period of typhoons
sulted in a death toll of 1833 persons (Hurricane Katrina:
                                                                      can be constructed based on the historical storm records
August 2005, 2020). In 2019, Typhoon Hagibis caused se-
                                                                      at specific zones. Then, the hydrodynamic models and
vere storm surge flooding that inundated southern areas of
                                                                      the wave models are utilized to simulate potential inun-
Honshu and killed at least 99 people in Japan (Japan: Ty-
                                                                      dation extents and depths under different typhoon inten-
phoon: 2019/10/12, 2020).
                                                                      sity scenarios.
   In China, storm surge is regarded as one of the most seri-
ous marine disasters and inflicts tremendous losses to peo-        2. The exposure means the elements at risk in a given haz-
ple’s life and property. Every year, about 27 tropical cy-            ard event. The exposure assessment of storm surge is
clones are formed over the western North Pacific Ocean                performed by measuring the counts of affected elements
and the South China Sea, and one-fourth of them strike di-            in the inundated region.
rectly coastal regions of China. The tropical cyclone storm
                                                                   3. The vulnerability refers to the degree to which a natu-
surge, from 2000 to 2018, caused a direct economic loss of
                                                                      ral element is susceptible to sustaining damage from a
RMB 10.82 billion and left a death toll of 46 on average an-
                                                                      hazard event.
nually in China (China Marine disaster bulletin, 2020). These
economic damages and casualties will be further increased         An empirical stage–damage curve is a common tool for
because of the explosive population growth and the rapid de-      assessing vulnerability. In order to develop stage–damage
velopment of society in the coastal area of China (Seto et al.,   curves for elements, researchers need to observe and ana-
2011; Lichter et al., 2011; McGranahan et al., 2007). More-       lyze the damage of elements in the disaster-affected area and
over, with considerably rising sea levels caused by continued     assign the percentage damage to different types of elements
global warming, tropical-cyclone-induced storm surge will         according to the scale of damage and disaster degree.
be more destructive in the future (Zhai et al., 2018). There-        The quantitative stage–damage curve method for the vul-
fore, it is important to establish storm surge preparedness       nerability assessment (Middelmann, 2010; de Moel et al.,
plans in advance to reduce economic losses and casualties         2014; McGrath et al., 2015) is common in developed coun-
for coastal cities.                                               tries. However, because of lacking adequate damage-cost
   Huizhou is the eastern city in the Pearl River Delta re-       data collected through postdisaster surveys, constructing
gion in Guangdong Province, China. In Huizhou, the petro-         stage–damage curves is difficult in developing countries.
chemicals and electronic information have developed into          Thus, the stage–damage curve method for assessing vulner-
the dominant industries. The Daya Bay Petrochemical Zone,         ability is not appropriate for Chinese coastal regions. This
located in the coastal area of Huizhou, is currently ranked       limited data availability has led to other data utilized to as-
the first in China in terms of the scale of integrating refin-    sess vulnerability in China. In 2019, a panel of Chinese
ery and petrochemical production. The high concentrations         ocean disaster prevention and reduction researchers updated
of petroleum-refining facilities and energy infrastructures in    and published the latest guideline Technical directives for
the Petrochemical Zone and the high density of population         risk assessment and zoning of marine disaster – Part 1:
in low-lying coastal communities make the coastal area of         storm surge (https://www.renrendoc.com/p-82139795.html,
Huizhou especially vulnerable to storm surges. The storm          last access: 12 December 2020). The latest guideline pro-
surge risk that the coastal area of Huizhou faces could be        vides the procedures and approaches for hazard, vulnerabil-
increased with sea-level rise, population growth, and further     ity, and risk assessment of storm surge (Sect. 3). According
petrochemical industry development. Thus, it is necessary to      to the latest guideline, the land cover types and their corre-
assess the potential risk of typhoon storm surge in advance       sponding vulnerability values rather than the stage–damage
in Huizhou to help decision-makers understand the affected        curve are recommended to conduct the vulnerability assess-
regions and allow them to develop mitigation strategies and       ment in China.
future land use planning.                                            In the past few years, the latest guideline has been taken
   The terminologies and methods for coastal risk assessment      and put into operation of storm surge risk assessment in the
vary among different scholars and organizations. In most          coastal areas of China (Fang et al., 2016; Zhang et al., 2016).
cases, the risk assessment of storm surge flooding is deter-      However, few studies have made a risk assessment of storm
mined by the combination of hazard, exposure, and vulnera-        surge in Huizhou city. This paper attempts to conduct a com-
                                                                  prehensive assessment and zonation of storm surge risk in

Nat. Hazards Earth Syst. Sci., 21, 439–462, 2021                                  https://doi.org/10.5194/nhess-21-439-2021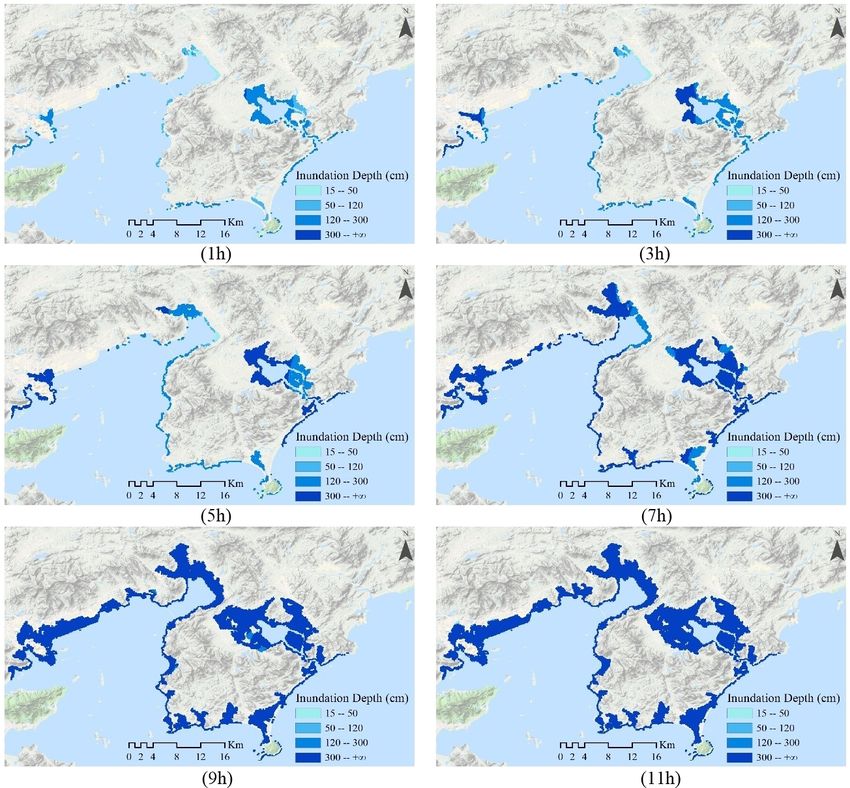
S. Wang et al.: Assessing and zoning of typhoon storm surge risk with a GIS technique                                        441

the coastal area of Huizhou city with the latest guideline.        ple dead and caused a direct economic loss of RMB 2.37 bil-
First, the relation between minimum central pressure and re-       lion.
turn period was constructed from historical tropical cyclone          The Huizhou city is located in the southeastern area of
records in Huizhou with statistical approaches. Then, the ty-      Guangdong Province, and it occupies part of the Pearl River
phoon intensities for the minimum central pressure of 880,         Delta megalopolis to the northeast of Hong Kong and Shen-
910, 920, 930, and 940 hPa (corresponding to a 1000-, 100-,        zhen. Spanning from 22◦ 40 to 23◦ 570 N and 113◦ 510 to
50-, 20-, and 10-year return period) scenarios were designed.      115◦ 280 W, it covers a land area of about 11 347 km2 and
Subsequently, the Jelesnianski method was utilized to gen-         sea area of approximately 4520 km2 . There are two dis-
erate wind field, and the Advanced Circulation (ADCIRC)            tricts (Huicheng and Huiyang) and three counties (Boluo,
hydrodynamic model coupled with the Simulating Waves               Huidong, and Longmen) in Huizhou, as shown in Fig. 1b.
Nearshore (SWAN) wave model was employed to simulate               The coastal region of Huiyang district and Huidong county
the storm surge for each of the designed typhoon intensity         have been affected by the tropical cyclones during the season
scenarios. The data of simulated storm surge over the compu-       running from April to November.
tational domain under different typhoon intensity scenarios           In this paper, the region within a distance of 10 km from
were generated from the coupled ADCIRC–SWAN model.                 the coastline in Huiyang district and Huidong county is cho-
Afterward, the inundation extents and depths of storm surge        sen as a study area to understand the potential risk of storm
maps can be created from the simulated data in geographic          surge in this region, as shown in Fig. 1b and c. In addition
information system (GIS)-integrated software to visualize          to high population density in coastal communities, the main
and assess storm surge hazard levels. Eventually, combin-          reason for choosing this region is that high concentrations
ing hazard assessment with vulnerability assessment, the risk      of petroleum facilities and infrastructures in the Daya Bay
map during a specific typhoon intensity in the study area was      Petrochemical Zone make the study area vulnerable to storm
obtained. The risk maps can help decision-makers to develop        surges. The Daya Bay Petrochemical Zone has an area of
evacuation plans for the densely populated communities in          about 27.8 km2 , as shown in Fig. 1c, and is currently tak-
the coastal area. The risk analysis can be utilized to iden-       ing the first spot at the scale of petrochemical-refining in-
tify the risk zones with the high concentrations of chemical       tegration in China. By the end of 2018, the Petrochemical
and petroleum industries to prevent environmental damage           Zone has attracted investment from many of the world’s
caused by the chemical pollutants and oil spills from affected     top 500 companies and industry-leading enterprises. These
petroleum industries.                                              world chemical and industrial giants including Exxon Mobil,
   The rest of the paper is organized as follows: the study        Shell, and Clariant have invested RMB 131.6 billion to shape
area and datasets are described in Sect. 2; Sect. 3 depicts the    up the industrial chains of the oil refinery, ethylene, propy-
methodology and procedure, including the model description         lene, and butylene in Daya Bay Petrochemical Zone. In 2018,
and validation, storm parameters and scenario design, and          the oil-refining capacity and the ethylene production capac-
the procedure for conducting the risk assessment; results and      ity have been enhanced to 22 million and 2.2 million t yr−1 ,
discussion are stated in Sect. 4; the conclusion of the study is   respectively, and the petrochemical industrial output value
drawn and future research is provided in Sect. 5.                  reached RMB 270 billion (Huizhou, 2020a, b). Now, the
                                                                   Daya Bay Petrochemical Zone is striving to develop into the
                                                                   world-class petrochemical base and planning to be one of
                                                                   the world’s top 10 petrochemical industrial zones in the sub-
2     Study area and datasets                                      sequent few years. Therefore, with the growing population
                                                                   density and particularly the rapid development of petroleum
2.1    Study area                                                  and chemical industries, the storm surge risk over the study
                                                                   area will be increased. The risk assessment and risk analysis
Guangdong is a coastal province, located in the southern-          are considered to be important strategies to identify the risk
most part of China, and has a long coastline along the South       regions in the Daya Bay Petrochemical Zone, which can min-
China Sea, as shown in Fig. 1a. Guangdong is one of the            imize the loss of life and property and prevent environmental
most prosperous provinces in China, with the highest GDP           damage caused by affected coastal petroleum facilities and
of RMB 9.73 trillion and a population of 113.46 million            infrastructures.
in 2018. However, due to the geographical position, Guang-
dong is the most frequently affected province by tropical cy-      2.2   Dataset requirement
clones in China. The storm surge is regarded as the most se-
rious marine disaster for Guangdong Province. During the           The datasets used in the study contain observed data and sur-
period from 1949 to 2017, 263 tropical cyclones landed in          vey data obtained from various sources. The datasets can be
Guangdong Province (Ying et al., 2014). In 2018, three dif-        employed to conduct the hazard assessment, vulnerability as-
ferent typhoons including Ewiniar, Bebinca, and Mangkhut           sessment, and risk assessment of storm surge in the study
made landfall on Guangdong Province, which left four peo-          area for each of the different typhoon intensity scenarios.

https://doi.org/10.5194/nhess-21-439-2021                                   Nat. Hazards Earth Syst. Sci., 21, 439–462, 2021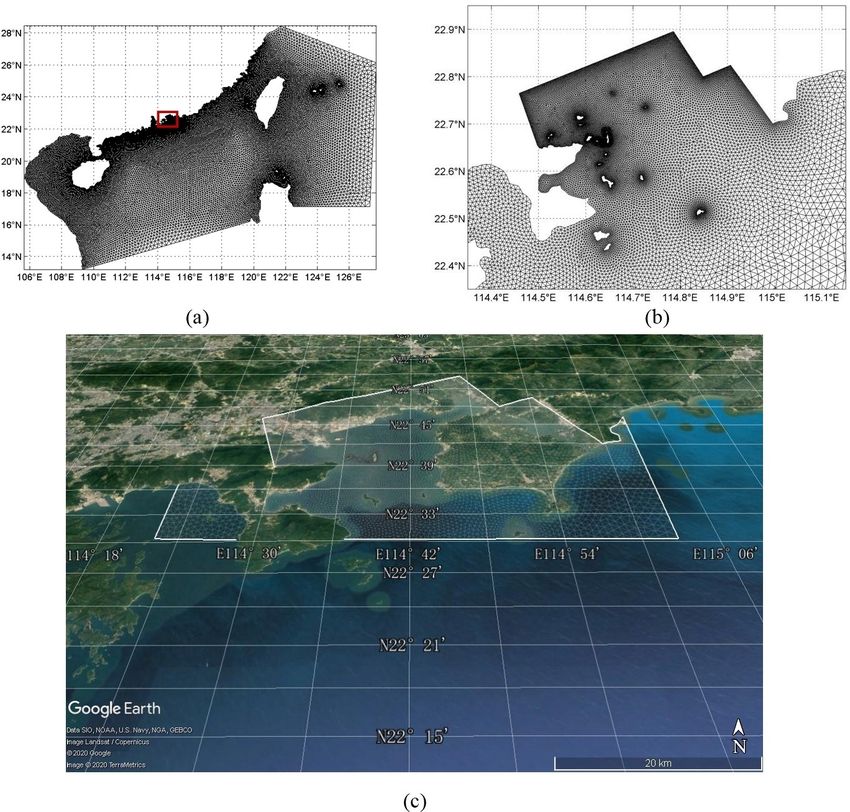
442                                 S. Wang et al.: Assessing and zoning of typhoon storm surge risk with a GIS technique

Figure 1. The maps of observation locations used in the study: (a) the map of Guangdong Province in the southern area of China where the
shapefile of administrative boundaries was obtained from the GADM database under © 2018 GADM license (https://gadm.org/data.html,
last access: 19 January 2021), with academic publishing permission from Global Administrative Areas (https://gadm.org/license.html, last
access: 19 January 2021); (b) the map of Huizhou city and the study area, which was made using the ArcGIS 10.5; (c) the map of towns
and their boundaries in the study area and the petrochemical buildings are distributed in the Daya Bay Petrochemical Zone, which was made
using the ArcGIS 10.5. The maps and satellite images obtained from © Google Earth or © Google Maps can be used and printed in the
research papers with permission from Google’s website (https://www.google.com/permissions/geoguidelines/, last access: 19 January 2021).

The datasets, which can be downloaded from the Figshare                     typhoon scenarios over the study area. The input param-
repository (Wang, 2020a), are listed in Table 1 and described               eters of each of the typhoon scenarios are used to gen-
below.                                                                      erate wind field with the Jelesnianski method, which is
                                                                            the requirement for modeling storm surge.
  1. The dataset of Historical Tropical Cyclone: it contains
     information on name, time, track, minimum central                   2. The dataset of Digital Elevation Model (DEM): the
     pressure, and maximum wind velocity of tropical cy-                    dataset of DEM with a scale of 1 : 2000 was constructed
     clones that made landfall in the coastal area of Huizhou               in 2015 and is available from Huizhou Land and Re-
     during the period from 1949 to 2017. It was obtained                   sources Bureau. It is a raster dataset that depicts land
     from the China Meteorological Administration. The his-                 heights in Huizhou’s solid surface. The point in the
     torical data can be analyzed to construct representative               dataset contains the elevation value for the region that

Nat. Hazards Earth Syst. Sci., 21, 439–462, 2021                                        https://doi.org/10.5194/nhess-21-439-2021
S. Wang et al.: Assessing and zoning of typhoon storm surge risk with a GIS technique                                                443

Figure 2. The DEM map of the study area including rivers and the elevation value that point covers. The map was made using the ArcGIS 10.5
software based on the terrain base map layer, which was obtained from © Google Maps (map data © 2019 Google).

Table 1. Summary of the datasets for conducting the risk assessment of storm surge.

                         Dataset name                       Source                                         Time
                         Historical Tropical Cyclone        China Meteorological Administration      1949–2017
                         Digital Elevation Model (DEM)      Huizhou Land and Resources Bureau             2015
                         Storm Surge Barriers               Huizhou Oceanic Administration                2018
                         Land Cover Types                   Huizhou Land and Resources Bureau             2016
                         District Boundaries                Huizhou Land and Resources Bureau             2017
                         Water Level Records                Huizhou tidal gauge station              2006–2018

     point covers. The DEM dataset is used for modeling                      of land covers. The dataset is applied to modeling storm
     storm surge. The DEM map of the study area is shown                     surge and conducting the vulnerability assessment.
     in Fig. 2.
                                                                         5. The dataset of Administrative Boundary: the dataset
  3. The dataset of Storm Surge Barriers: the dataset in-                   contains administrative boundaries at the township level
     cludes information on storm surge barriers such as dikes               of Huizhou in 2017, and there are 12 towns in the study
     and levees constructed in the study area, as shown in                  area. It was obtained from Huizhou Land and Resources
     Fig. 3. The data related to name, height, slope, loca-                 Bureau.
     tion, material, latitude, and longitude have been sur-
     veyed from the project named marine disaster preven-
     tion and reduction of Huizhou in 2018. The dataset is               6. The dataset of Water Level Records: the Huizhou
     utilized to accurately simulate the inundation extent and              Oceanic Administration deployed the Huizhou water
     depth of storm surge.                                                  level gauging station that is located in the Quenwan port
                                                                            and Gangkou gauging station, as shown in Fig. 3. The
  4. The dataset of Land Cover Types: the dataset contains                  coastal water level around the stations is automatically
     current physical material including water, agriculture,                measured and recorded with a gauge at fixed intervals
     trees, and wetlands over the study area. It was obtained               of time. The dataset contains the height of hourly water
     from the Huizhou Land and Resources Bureau, which                      level records. The dataset can be used for validating the
     was created by analyzing remotely sensed imagery of                    coupled model (ADCIRC–SWAN) over the study area
     Huizhou in 2016. Because each physical material has its                by comparing simulated water levels and measured wa-
     bottom friction, the simulated inundated areas of storm                ter levels.
     surge cannot be the same on the different combinations

https://doi.org/10.5194/nhess-21-439-2021                                        Nat. Hazards Earth Syst. Sci., 21, 439–462, 2021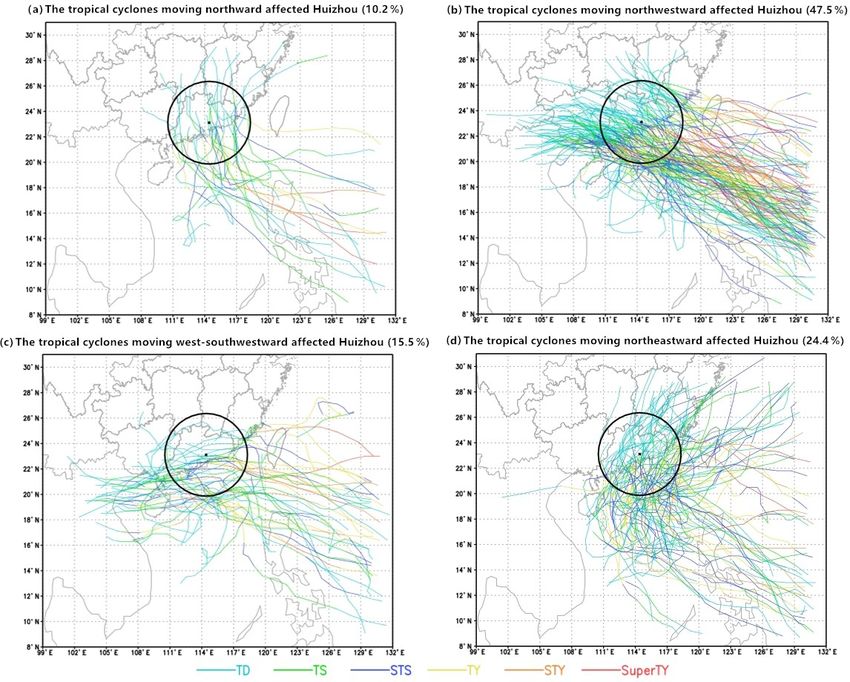
444                                  S. Wang et al.: Assessing and zoning of typhoon storm surge risk with a GIS technique

Figure 3. The map of Storm Surge Barriers such as dikes and levees along the coastline of Huizhou over the study area, which are marked
by the colored lines. The two stations including Huizhou gauging station and Gangkou gauging station measure the water levels in the study
area, which are indicated by the lemon chiffon dot and the green dot, respectively. The map was made using the ArcGIS 10.5 software based
on the terrain base map layer, which was obtained from © Google Maps (map data © 2019 Google).

3     Methodology and procedure                                        Table 2. The Manning’s values related to the land cover types over
                                                                       the study area.

3.1    Model description and validation
                                                                                        Land types      Manning’s values
                                                                                        Settlements                 0.07
In this study, the Jelesnianski numerical method (Jelesnian-                            Forest                     0.065
ski and Taylor, 1973), the well-established Advanced Cir-                               Dryland                     0.06
culation (ADCIRC) model (Luettich et al., 1992; Westerink                               Paddy field                 0.05
et al., 1994), and Simulating Waves Nearshore (SWAN)                                    Road                       0.035
model (Booij et al., 1999) are employed to simulate ty-                                 Riverway             0.025–0.035
phoon storm surge. The ADCIRC model is a two- and three-                                Open spaces                0.035
dimensional hydrodynamic circulation model, which can be
utilized to model tides, wind-driven circulation, and storm
surge. The ADCIRC model has been applied to simulate                   late the storm surge on the same unstructured grid (Dietrich
the hydrology in regions including the Gulf of Mexico, the             et al., 2011, 2012).
Mediterranean Sea, and the South China Sea (Kerr et al.,                  The computational domain in this study covered the
2013; Orlić et al., 2010; Li et al., 2020). The ADCIRC-2D in          coastal region of Huizhou, as shown in Fig. 4, with pro-
the study was run using a spherical coordinate system. It can          gressively higher resolution approaching the coastal area of
provide both water surface elevation and the depth-averaged            Huizhou. In the areas along the coastline of Huizhou, the
velocity of the current in coastal seas by solving continuity          high grid resolution of 100–200 m is provided to improve
equations and momentum equations. As for the friction coef-            the simulation accuracy, and simultaneously unstructured
ficient, Manning’s n values derived from the land cover types          grids contain a coarse resolution of 30 km along the open
over the study area are utilized, which are listed in Table 2.         ocean boundary for decreasing computational cost. There are
These land types were first associated with Manning’s val-             38 407 nodes and 74 328 grids over the computational do-
ues, and then the Manning’s n values are averaged for the              main, as shown in Fig. 4a. The open boundary of the model
ADCIRC mesh.                                                           water level is controlled by the total water level, which is ob-
   The SWAN model is a third-generation numerical wave                 tained by the superposition of 11 astronomical tidal compo-
model, which is used to simulate wind-generated wave prop-             nents. These 11 astronomical tidal components are M2, N2,
agation in coastal regions. The model computes the wave                S2, K2, K1, O1, P1, Q1, MS4 , M4 , and M6 . The wave open
action density spectrum by solving the wave action balance             boundary is controlled by a two-dimensional wave spectrum.
equation. It can be coupled to the ADCIRC model to simu-

Nat. Hazards Earth Syst. Sci., 21, 439–462, 2021                                         https://doi.org/10.5194/nhess-21-439-2021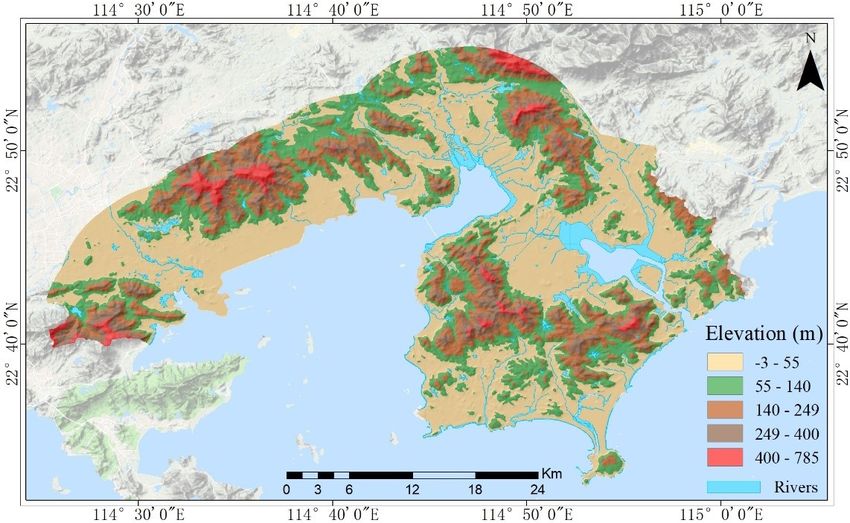
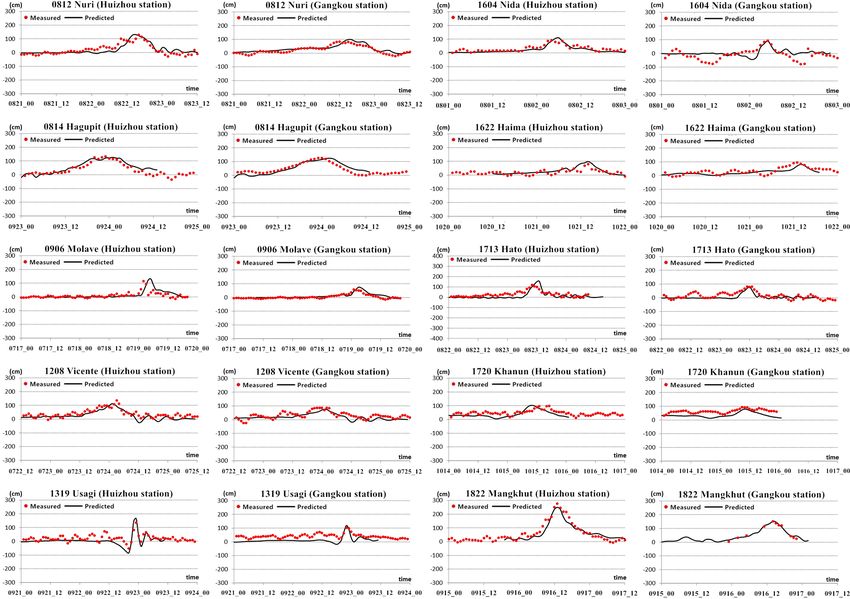
S. Wang et al.: Assessing and zoning of typhoon storm surge risk with a GIS technique                                            445

Figure 4. A computational domain (a) and the domain over the study area (b). The satellite image (c) was obtained from © Google Earth
(map data © 2020 Google, © 2020 ZENRIN).

   The procedure of modeling storm surge is as follows: the          (0812, 0814, 0906, 1208, 1319, 1604, 1622, 1713, 1720,
wind filed, which is generated by the Jelesnianski method, is        1822), which caused high water levels in Huizhou gauging
provided to the coupled model (ADCIRC–SWAN). Then, the               station and Gangkou gauging station (Fig. 3), are selected to
ADCIRC model is operated to calculate the water level and            validate the coupled model (ADCIRC–SWAN) for the study
current under the wind filed. Subsequently, based on the wa-         area. Figure 5 shows all maximum simulated water levels,
ter level, the current, and the wind velocity, the SWAN model        the highest observed water levels, and the timing of these
computes the wave spectrum, which is then passed back to             peaks for these 10 representative typhoons.
the ADCIRC model to calculate the water levels in the next              Two error statistic approaches are utilized to evaluate the
simulated round. Thus, the modeling typhoon event can be             performance of the coupled model with a comparison be-
converted by the wave–current coupled model (ADCIRC–                 tween maximum predicted water levels and the highest mea-
SWAN) into a storm surge event, outputting the data of water         sured water levels. The relative error (RE) is calculated as
height corresponding to every grid node over the computa-            the highest measured water level is above 100 cm. The abso-
tional domain.                                                       lute error (AE) is computed when the highest measured wa-
   As the Jelesnianski method and the coupled                        ter level is below 100 cm. The statistical results from the two
model (ADCIRC–SWAN) have never been used in                          stations have been summarized in Table 3. It displays that
simulating typhoon storm surge over the coastal areas of             the data with RE ≤ 20 % or AE ≤ 20 cm account for 90 % of
Huizhou, the simulated performance of the coupled model              all simulated data, which satisfies the criterion in the latest
is needed to be evaluated. The 10 representative typhoons            guideline. Therefore, the performance of the coupled model

https://doi.org/10.5194/nhess-21-439-2021                                     Nat. Hazards Earth Syst. Sci., 21, 439–462, 2021
446                                  S. Wang et al.: Assessing and zoning of typhoon storm surge risk with a GIS technique

Figure 5. The predicted water levels (black line) and highest measured water levels (red dots) recorded by the Huizhou station and Gangkou
station during the typhoon events.

is considered to be reliable regarding its ability to simulate         Based on the historical typhoon records, the minimum cen-
storm surges in the study area.                                        tral pressure–return period relation for the study area was
                                                                       constructed with extreme value distribution Type I, as shown
3.2     Storm parameters                                               in Fig. 6. Thus, the minimum central pressure associated with
                                                                       a given return period can be calculated. For example, it can
After validating the performance of the coupled ADCIRC–                be observed from Fig. 6 that the minimum central pressure
SWAN model, the input storm parameters must be set for                 of typhoons corresponding to the return period of 1000 years
designing the typhoon scenarios, which can be used to create           was estimated at 880 hPa.
the wind field with the Jelesnianski method to drive the storm
surge in the coupled model. The storm parameters include the
                                                                       3.2.2   Radius of maximum wind
minimum central pressure, the radius of maximum winds, the
maximum wind velocity, and the storm track.
                                                                       The radius of maximum wind (Rmax ) has a strong connec-
3.2.1    Return period and minimum central pressure                    tion to the maximum wind velocity and the minimum central
                                                                       pressure of the typhoon (P0 ). The researchers (Vickery et al.,
The typhoon return period is the average time between ty-              2000; Cheung et al., 2007) developed empirical formulas to
phoons with a certain intensity at a specific location. The            calculate the radius of maximum wind based on the Rmax –P0
typhoon return periods for Huizhou can be determined by                relationship, as shown in Eq. (1) to (3), where θ represents
making statistics of historical typhoon records in Huizhou.            the latitude of the typhoon’s center, 1P indicates the pres-

Nat. Hazards Earth Syst. Sci., 21, 439–462, 2021                                         https://doi.org/10.5194/nhess-21-439-2021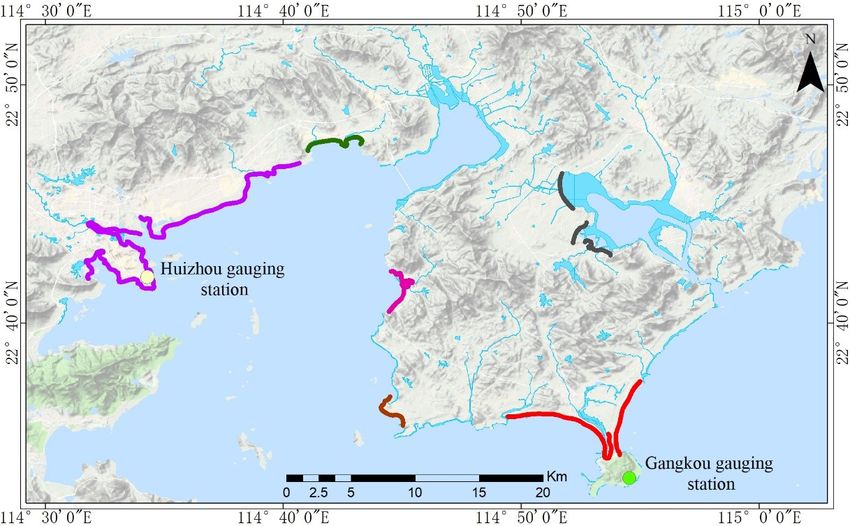
S. Wang et al.: Assessing and zoning of typhoon storm surge risk with a GIS technique                                              447

Table 3. Summary of error statistics (AE and RE) between maximum predicted water levels and highest measured water levels from Huizhou
station and Gangkou station during the typhoon events.

                    Typhoon name          Measure data (cm)           Relative error (%)       Absolute error (cm)
                                        Huizhou     Gangkou          Huizhou    Gangkou       Huizhou     Gangkou
                    Nuri (0812)              129          84               2            –            –          15
                    Hagupit (0814)           135         126               6            2            –           –
                    Molave (0906)            116          58              13            –            –          17
                    Vicente (1208)           136          87              18            –            –          11
                    Usagi (1319)             137         102              21           17            –           –
                    Nida (1604)               92          94               –            –           18           2
                    Haima (1622)              81          94               –            –           18          12
                    Hato (1713)              120          81              30            –            –           0
                    Khanun (1720)             98          93               –            –            5          14
                    Mangkhut (1822)          278         151              10            1            –           –

Figure 6. The relation between the return period and the central pressure of typhoons on extreme value distribution Type I, which struck
coastal areas of Huizhou city from 1949–2017.

sure difference between central pressure and ambient pres-
sure, and Rk is an empirical constant with a value of 50.              Rmax = 260.93 × (1010 − P0 )−0.512                           (4)

Rmax = exp 2.635 − 0.000050861P 2 + 0.0394899θ            (1)
                                                                          Therefore, according to the above empirical equations and
Rmax = 1119.0 × (1010 − P0 )−0.806                             (2)
                                                                       historical observations, the radius of maximum wind corre-
Rmax = Rk − 0.4 × (P0 − 900) + 0.01 × (P0 − 900)2              (3)     sponding to the minimum central pressure can be calculated.
                                                                       As shown in Table 4, averaging the empirical values from
Analyzing the historical radius of maximum wind data mea-
                                                                       Eqs. (1) to (4) and observed values, the radius of maximum
sured in the northwest Pacific hurricane records (2001–2016)
                                                                       wind with respect to the minimum central pressure at 880 hPa
from the Joint Typhoon Warning Center (JTWC), the empiri-
                                                                       was estimated at 30 km.
cal Eq. (4) of the Rmax –1P relation can be constructed based
on Eq. (2) with regression statistics, as shown in Fig. 7.

https://doi.org/10.5194/nhess-21-439-2021                                        Nat. Hazards Earth Syst. Sci., 21, 439–462, 2021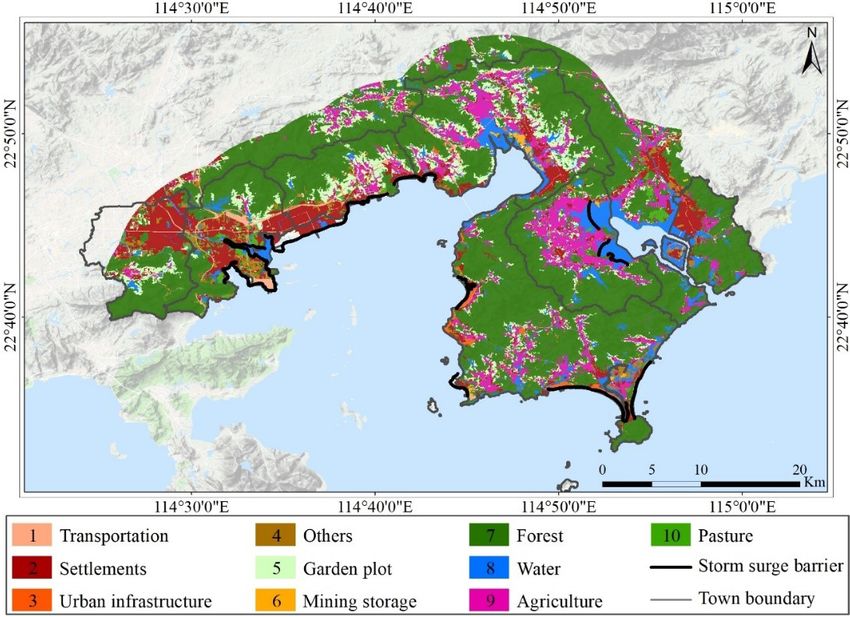
448                                     S. Wang et al.: Assessing and zoning of typhoon storm surge risk with a GIS technique

Figure 7. The relation between the pressure difference (1P ) and the radius of maximum wind (Rmax ).

Table 4. The estimated value of the radius of maximum wind            of Historical Tropical Cyclones and dataset of Water Level
when P0 is 880 hPa.                                                   Records, the five typhoons (7908, 0906, 1319, 1713, 1822)
                                                                      that caused the higher water level over the study area were
                       Empirical Eq.         Observed   Averaged      moved on the northwestward track. In particular, the re-
                 (1)     (2)   (3)     (4)    JTWC                    cent super typhoon Mangkhut (1822), which struck south-
                                                                      ern China in September 2018, led to the highest water level
 Radius (km)     15      22    62      22     [9, 37]     30          in Huizhou history. The track of super typhoon Mangkhut is
                                                                      shown in Fig. 10.
                                                                         Figure 10 depicts the super typhoon Mangkhut mov-
3.2.3   Maximum wind velocity                                         ing northwestward into the South China Sea toward south-
                                                                      ern China. It was the costliest and most devastating ma-
Based on the records from the dataset of Historical Tropi-            rine disaster in the history of Huizhou. During the su-
cal Cyclones, the regression statistic is made on the observed        per typhoon Mangkhut period, the maximum water level at
data containing maximum wind velocity (Vmax ) and the min-            Huizhou gauging station reached up to 349 cm at 13:00 LT,
imum central pressure (P0 ) with the wind–pressure empirical          16 September 2018. The direct economic losses caused
equation (Atkinson and Holliday, 1977), as shown in Fig. 8.           by super typhoon Mangkhut to Huizhou were estimated at
   Then, the empirical equation of the Vmax –P0 over the study        RMB 577.39 million, and 0.236 million people were af-
area can be established, as shown in Eq. (5).                         fected. Therefore, the Mangkhut track was chosen to model
                                                                      the worst-case scenario of storm surge under different repre-
Vmax = 3.7237 × (1010 − P0 )0.6065                             (5)    sentative typhoon intensities in this study.
                                                                         In order to provide complete geographical coverage for the
3.2.4   Tropical storm track                                          study area, a set of deviated typhoon tracks were produced.
                                                                      The 33 typhoon tracks deviating from the original Typhoon
The tracks of tropical cyclones, which affected the coastal
                                                                      Mangkhut track were generated, as shown in Fig. 11. These
area of Huizhou during the period from 1949 to 2017, can
                                                                      34 tracks are spaced 5 km apart and represent the typhoon
be divided into four categories: moving northward (10.2 % of
                                                                      activity near Huizhou. In this paper, the tracks were used to
total), moving northwestward (47.5 % of total), moving west-
                                                                      simulate the storm surge in the coastal area of Huizhou with
southwestward (15.5 % of total), and moving northeastward
                                                                      the Jelesnianski method and the coupled model (ADCIRC–
(24.4 % of total), as shown in Fig. 9.
                                                                      SWAN).
   Figure 9 indicates that tropical cyclones that approached
the coast areas of Huizhou in the northwest (47.5 %) are
the most common. The northwestward track is perpendicu-
lar to the coastline of Huizhou, which can increase the max-
imum storm surge for the study area. Analyzing the dataset

Nat. Hazards Earth Syst. Sci., 21, 439–462, 2021                                        https://doi.org/10.5194/nhess-21-439-2021
S. Wang et al.: Assessing and zoning of typhoon storm surge risk with a GIS technique 449 Figure 8. The relation between the pressure difference (1P ) and the maximum wind velocity (Vmax ). Figure 9. The tracks of tropical cyclones affected Huizhou from 1949 to 2017. There are six categories of tropical cyclones: tropical depression (TD), tropical storm (TS), severe tropical storm (STS), typhoon (TY), severe typhoon super (STY), and super typhoon (Super TY). https://doi.org/10.5194/nhess-21-439-2021 Nat. Hazards Earth Syst. Sci., 21, 439–462, 2021
450                                  S. Wang et al.: Assessing and zoning of typhoon storm surge risk with a GIS technique

Figure 10. The track of super typhoon Mangkhut over the western North Pacific and the South China Sea. The six categories of wind speeds
are represented by the different colored dots. The track map was made using the ArcGIS 10.5 software based on the satellite base map layer,
which was obtained from © Google Maps (map data © 2019 Google).

Figure 11. The 34 typhoon tracks (16 shifting to the left and 17 shifting to the right and from the Mangkhut track) over the western North
Pacific and the South China Sea. The track map was made using the ArcGIS 10.5 software based on the satellite base map layer, which was
obtained from © Google Maps (map data © 2019 Google).

3.3   Procedure for assessing risk                                      simulated surge documenting the temporal variation in inun-
                                                                        dation depth over the computational domain are generated.
                                                                        Then, these output data from the coupled (SWAN–ADCIRC)
The procedure for conducting the risk assessment of storm
                                                                        model for each scenario are converted to the ArcGIS 10.5
surge in China is derived from the latest guideline. The risk
                                                                        software. Eventually, the hazard maps, vulnerability maps,
assessment is regarded as a combination of hazard assess-
                                                                        and risk maps for these representative scenarios are made us-
ment and vulnerability assessment. The procedure involves
                                                                        ing the ArcGIS 10.5 software.
four steps: typhoon scenario design, hazard assessment,
vulnerability assessment, and risk assessment as shown in
Fig. 12.                                                                3.3.1   Typhoon scenario design
   As seen in Fig. 12, the datasets used in the study are
Land Cover, DEM, Historical Tropical Cyclones, Historical               The typhoon scenario is parametrized by intensity, maximum
Sea Level, Storm Surge Barriers, and District Boundaries.               wind velocity, radius of maximum winds, and track. The
The wind field created with the Jelesnianski method is pro-             lower the central pressure or the longer the year return period,
vided to the coupled (SWAN–ADCIRC) model, which sim-                    the more intense the storm. Thus, the minimum central pres-
ulates the storm surge for each of the design typhoon in-               sure or the year return period can be regarded as an indica-
tensity scenarios. Subsequently, the 12 h time series data of           tor for the typhoon intensity. The comprehensive and repre-

Nat. Hazards Earth Syst. Sci., 21, 439–462, 2021                                          https://doi.org/10.5194/nhess-21-439-2021
S. Wang et al.: Assessing and zoning of typhoon storm surge risk with a GIS technique 451
Figure 12. The procedure for conducting the risk assessment of storm surge over the study area.
Table 5. Constructed storm scenarios with different intensities. Table 6. Hazard zone classification according to the inundation
depth.
Grade Minimum Return Maximum Radius of The number
central period wind maximum of typhoon
Inundation Hazard
pressure (yr) velocity winds track
depth (cm)
(hPa) (m s−1 ) (km)
I 880 1000 61 30 34 [15, 50) Low (IV)
II 910 100 57 31 34 [50, 120) Moderate (III)
III 920 50 53 33 34 [120, 300) High (II)
IV 930 20 49 35 34 [300, +∞) Very high (I)
V 940 10 45 38 34
with the Jelesnianski method was run on the datasets for sce-
sentative typhoon intensity for the minimum central pressure narios with an increasing minimum central pressure from
of 880, 910, 920, 930, and 940 hPa (corresponding to 1000- 880 hPa up to 940 hPa. Then, the outputs of the coupled
, 100-, 50-, 20-, and 10-year return period) scenarios were model (ADCIRC–SWAN) were imported to the GIS soft-
designed. The corresponding maximum wind velocity and ware.
radius of maximum winds were calculated for each of the The spatial extents of surge area and heights of surge wa-
designed scenarios according to the analysis in Sect. 3.2.1– ter in given scenarios were displayed in the ArcGIS 10.5
3.2.3, as shown in Table 5. The 34 constructed tracks dis- software. The inundation depth was calculated by subtract-
cussed in Sect. 3.2.4 were used as input data to create the ing DEM from the height of simulated surge water at each
wind field. grid. The storm surge hazard for the study area was assessed
based on the classifications of inundation depths as summa-
3.3.2 Hazard assessment rized in Table 6. Accordingly, the different hazard levels were
assigned to the inundation zones.
The hazard assessment is to identify the potential inunda-
tion extent and depth of storm surge caused by typhoons
for the study area. The ADCIRC–SWAN model integrated
https://doi.org/10.5194/nhess-21-439-2021 Nat. Hazards Earth Syst. Sci., 21, 439–462, 2021452 S. Wang et al.: Assessing and zoning of typhoon storm surge risk with a GIS technique
3.3.3 Vulnerability assessment inundation depth over the study area was divided into four
categories according to the criterion in the latest guideline.
The exposure assessment aims to identify elements affected As shown in Fig. 13, the inundation area progressively
by storm surge. The land cover can be considered to be the expanded from the coastline to the mainland and reached
representation of affected elements. The land cover type is re- a maximum at approximately the 11th hour. Moreover, the
garded as an indicator to assess the vulnerability in the study maximum distance that storm surge flooding penetrates in-
area to storm surge. The vulnerability values ranging from 0 land from the coastline is approximately 6 km, and the in-
to 1 are assigned to different land cover types, which were undation distances in other regions are less than 4 km. Fur-
defined in the latest guideline according to their properties of thermore, the simulated inundation depths over many coastal
susceptibility and resilience to storm surge. The value of 0 areas are more than 300 cm at the 11th hour.
indicates no vulnerability, and the value of 1 represents the With the output data of simulated storm surge elevations at
highest vulnerability. The four levels of vulnerability were the 12th hour, the hazard map, where regions are in different
defined in the latest guideline (I–IV), from very high vulner- colors based on the inundation depths (Table 6), was made
ability (I) to low vulnerability (IV). The Land Cover dataset for each of the designed scenarios using the ArcGIS 10.5
was categorized into 12 first classifications according to the software. The higher the inundation depth reach, the higher
latest guideline, as summarized in Table 7. Based on the vul- the risk is. These maps of hazard assessment over the study
nerability value corresponding to land cover type in Table 7, area for the representative scenarios are shown in Fig. 14, and
the vulnerability level over the study area was evaluated. the inundated areas for each scenario are shown in Fig. 15.
Figure 14 shows the ultimate simulated inundation ex-
3.3.4 Risk assessment tents and corresponding hazard assessment under each of
the designed scenarios. First of all, the maximum inunda-
As for the risk assessment, the inundated region is divided tion depths and extents decrease with increasing typhoon
into several storm surge risk districts by integrating the in- intensity. Second, in terms of the Daya Bay Petrochemical
undation hazard assessment and vulnerability of affected el- Zone (B), the hazard of storm surges is at a high or very high
ements over the study area. The quantitative risk assessment level when the minimum central pressure of the typhoon is
and the risk matrix are the primary methods for evaluating 880 hPa. Moreover, the hazard of storm surge in the Daya
risk. However, the quantitative risk assessment method is Bay Petrochemical Zone (B) is at moderate and high levels as
data-demanding, and it is difficult to quantify all populations the minimum central pressure of typhoon is 910 or 920 hPa.
and properties at risk. The risk matrix, a typical semiquanti- Furthermore, the Daya Bay Petrochemical Zone (B) is hardly
tative approach, is utilized to solve these problems. The risk affected by the storm surge from the typhoon with a mini-
matrix is made of classes of hazard level on one axis and mum central pressure at 930 or 940 hPa due to the protection
the vulnerability level on the other axis, as shown in two- given by storm surge barriers.
dimensional Table 8. Moreover, it can be observed from Fig. 15 that the inun-
With the risk matrix approach, the degree of risk can be dated area assigned to a very high hazard level decreases with
determined based on limited quantitative data. The degree of increasing value of the minimum central pressure. The inun-
risk is evaluated by four levels (I–IV) from very high risk (I) dated land area belonged to the high level of hazard changes
to low risk (IV). For example, low vulnerability combined from 221.88 to 52.39 km2 when the minimum central pres-
with low hazard can lead to a low risk, or the combination of sure is 880 hPa. As the value of the minimum central pressure
very high vulnerability and low hazard can result in moderate varied from 880 to 910 hPa, the inundated area classified as
risk in the area. the high, moderate, or low hazard level increases rapidly, and
these curves then remain nearly constant across other scenar-
ios (910, 920, 930, and 940 hPa).
4 Results and discussion Figure 14a demonstrates that the very high-hazard zones
are mainly located in the southeast of the Daya Bay Devel-
4.1 Hazard assessment opment Zone (D), the Huizhou Port (C), the region to the
north of the White Sand Shore (A), the field close to the
The coupled model (ADCIRC–SWAN) model and the Je- Huidong station (F) in Renshan town (G), the coastal place
lesnianski method were utilized to simulate the inundation from the Double Moon Bay (I) to the Pinghai town (H), the
extents and depths for each designed typhoon scenario (Ta- Tieyong town (N), the land from the Huangbu town (K) to
ble 5). The 12 h simulation of storm surge flooding over the Yandunling (M), and Yanzhou Peninsula (L). The construc-
study area for each typhoon scenario can be displayed in the tion of storm surge barriers along the coastline of Huizhou
ArcGIS 10.5 software. For example, for the typhoon inten- cannot prevent storm surge caused by typhoons with a mini-
sity with 880 hPa (1000-year return period), the simulated mum central pressure at 880 hPa.
inundation depths and extents of storm surge at time inter-
vals of 2 h during the 12 h period are shown in Fig. 13. The
Nat. Hazards Earth Syst. Sci., 21, 439–462, 2021 https://doi.org/10.5194/nhess-21-439-2021S. Wang et al.: Assessing and zoning of typhoon storm surge risk with a GIS technique 453
Table 7. The vulnerability value and vulnerability level for different land cover types.
The first classification of land cover The second classification of land cover
Number Name Value Number Name Value Level
011 Paddy field 0.1 IV
01 Agriculture 0.1–0.2 012 Irrigable land 0.2 IV
013 Dry land 0.2 IV
021 Orchard 0.3 IV
02 Garden plot 0.1–0.3
023 Other filed 0.1 IV
031 Forest land 0.1 IV
03 Forest 0.1 032 Shrubland 0.1 IV
033 Other woodland 0.1 IV
04 Pasture 0.1 043 Other grassland 0.1 IV
06 Mining storage 0.6–1 062 Land for mining 0.6–0.9 II–I
071 Urban residential land 1 I
07 Settlements 1
072 Rural residence land 1 I
08 Urban infrastructure 0.4–1 088 Scenic area 0.5 III
101 Land for railway 0.6–0.9 II–I
102 Land for highways 0.6–0.8 II
104 Country road 0.6 II
10 Transportation 0.6–1
105 Land for airport 0.8–1 II–I
106 Land for harbor 0.6–1 II–I
107 Land for pipeline transportation 0.6–1 II–I
111 River 0.1 IV
113 Reservoir 0.2 IV
114 Pond 0.3 IV
11 Water 0.1–0.8 115 Coastal beach 0.1 IV
116 Inland beach 0.1 IV
117 Ditch 0.1 IV
118 Hydraulic construction land 0.5–0.8 III–II
122 Facility agriculture land 0.2–0.5 IV–III
124 Saline–alkali land 0.1 IV
12 Others 0.1–0.5 125 Wetland 0.1 IV
126 Sand land 0.1 IV
127 Bare land 0.1 IV
Table 8. Risk matrix method for assessing storm surge risk.
Vulnerability
Low (IV) Moderate (III) High (II) Very high (I)
[0.1, 0.3] (0.3, 0.5] (0.5, 0.8] (0.8, 1]
Low (IV) Low risk (IV) Low risk (IV) Moderate risk (III) Moderate risk (III)
Moderate (III) Low risk (IV) Moderate risk (III) High risk (II) Very high risk (I)
Hazard
High (II) Moderate risk (III) High risk (II) High risk (II) Very high risk (I)
Very high (I) Moderate risk (III) High risk (II) Very high risk (I) Very high risk (I)
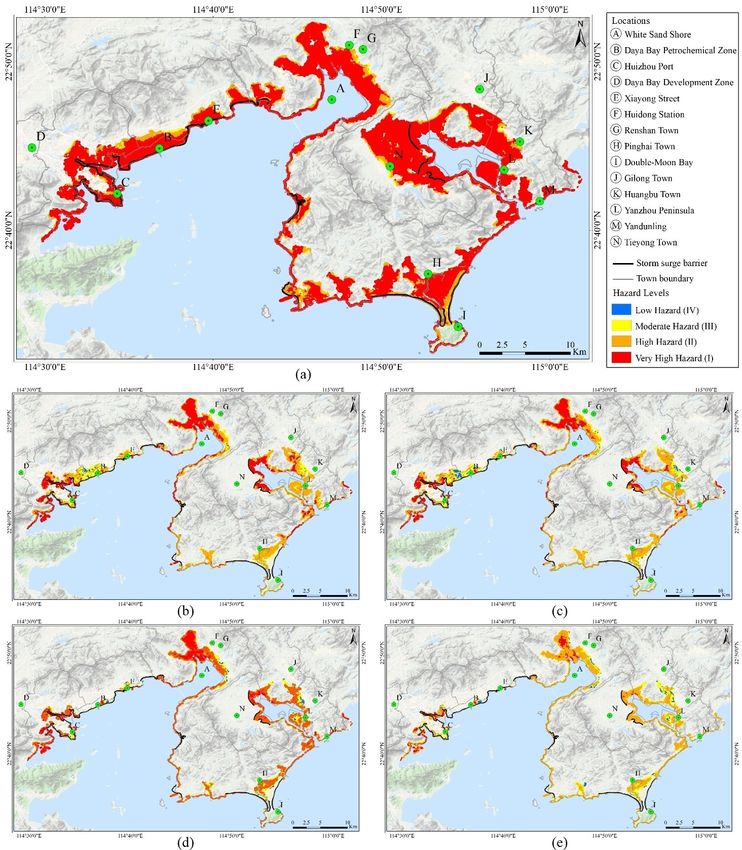
https://doi.org/10.5194/nhess-21-439-2021 Nat. Hazards Earth Syst. Sci., 21, 439–462, 2021454 S. Wang et al.: Assessing and zoning of typhoon storm surge risk with a GIS technique Figure 13. The maps display the simulated inundation extents of storm surge over the study area during 12-hour simulation for the 880 hPa (1000-year return period) scenario. These maps were made using the ArcGIS 10.5 software based on the terrain base map layer, which was obtained from © Google Maps (map data © 2019 Google). Figure 14b–e indicate that the typhoons with minimum 4.2 Vulnerability assessment central pressure are at 910, 920, 930, and 940 hPa; most ar- eas of the inundated region are at a moderate level or high hazard level. The storm surge barriers can effectively protect The vulnerability assessment can be used to identify differ- coastal urban settlements and industrial facilities from storm ent vulnerable regions in the study area. Making an expo- surge generated by these designed typhoon scenarios. How- sure map is an important step before the vulnerability assess- ever, the Huizhou Port (C) and the southeast of the Daya Bay ment. The Land Cover dataset obtained from the Huizhou Development Zone (D) are at a very high hazard level caused Land and Resources Bureau in 2016 can be categorized into by storm surge as they lie along the low-elevation coastal 10 different land cover types, and the exposure map over the area. In addition, the hazard of storm surge in the region to study area is illustrated in Fig. 16. In addition, the land areas the north of the White Sand Shore (A), the southwest of the and percentages of different land cover types are presented Gilong town (J), and the Yanzhou Peninsula (L) is at a very in Fig. 17. high level because they are relatively flat without protection Figure 16 shows the distribution of different land cover from barriers. types within the study area, which provides an overall view Nat. Hazards Earth Syst. Sci., 21, 439–462, 2021 https://doi.org/10.5194/nhess-21-439-2021
S. Wang et al.: Assessing and zoning of typhoon storm surge risk with a GIS technique                                                   455

Figure 14. The hazard assessment maps represent the inundation extents and depths for five storm scenarios: (a) 880 hPa, (b) 910 hPa,
(c) 920 hPa, (d) 930 hPa, (e) 940 hPa. Different colors represent different hazard levels. The red means the highest water level and very
high storm surge hazard, orange stands for high hazard, yellow represents moderate hazard, and blue indicates low hazard on the map. The
important locations in the study area are labeled with letters, and the violet lines refer to the storm surge barriers along the coastline of
Huizhou. These maps were made using the ArcGIS 10.5 software based on the terrain base map layer, which was obtained from © Google
Maps (map data © 2019 Google).

https://doi.org/10.5194/nhess-21-439-2021                                          Nat. Hazards Earth Syst. Sci., 21, 439–462, 2021
456                                  S. Wang et al.: Assessing and zoning of typhoon storm surge risk with a GIS technique

Figure 15. The simulated inundated areas with different hazard levels for each scenario.

Figure 16. The exposure map of different land cover types in the study area. The map was made using the ArcGIS 10.5 software based on
the terrain base map layer, which was obtained from © Google Maps (map data © 2019 Google).

of the region where the forest is concentrated, the zone of             land, the pasture land, the transportation land, and other lands
settlements, or the location of urban infrastructure.                   have a low surface area.
   As seen in Fig. 17, the forest land occupies most                       According to the relation between the exposure of land
of the land surface of the study area (55.9 %, approxi-                 cover types and their corresponding vulnerability values de-
mately 633.17 km2 ). The second-largest land cover type                 scribed in Table 7, the four levels of vulnerability with each
is settlement land, which occupies approximately 10.51 %                covered zone to storm surge in the study area can be deter-
(119.1 km2 ) of the study area’s surface. The agricultural land,        mined, as displayed in Fig. 18. Moreover, the land area and
the garden plot land, and the water land have a large sur-              percentage of each vulnerability zone in relation to the study
face area, while mining storage land, the urban infrastructure          area are summarized in Table 9.

Nat. Hazards Earth Syst. Sci., 21, 439–462, 2021                                           https://doi.org/10.5194/nhess-21-439-2021
S. Wang et al.: Assessing and zoning of typhoon storm surge risk with a GIS technique                                                 457

Figure 17. The land areas and proportions of different land cover types in the study area.

Figure 18. The map of vulnerability zones in the study area. The red means the highest vulnerability level (I), and the blue stands for the
lowest vulnerability level (IV) on the map. The map was made using the ArcGIS 10.5 software based on the terrain base map layer, which
was obtained from © Google Maps (map data © 2019 Google).

Table 9. The vulnerability level, area, and proportion for each vul-        Table 9 shows that the total area is 1132.8 km2 . The zone
nerability zone.                                                         marked by low vulnerability level (IV) covers an area of
                                                                         978.21 km2 . The zone is mainly present in the forest, agri-
         Vulnerability    Color        Area     Proportion               culture, garden plot, and water and accounts for the greatest
         level                        (km2 )          (%)                proportion of the study area. The zone assigned to the high-
         Very high (I)    Red        119.10          10.51               est vulnerability level (I) is covered with settlements, and its
         High (II)        Orange      27.07           2.38               geographical area is 119.1 km2 . The vulnerability level in the
         Moderate (III)   Yellow       8.42           0.74               land area, which is covered by mining storage and transporta-
         Low (IV)         Blue       978.21          86.37               tion, is at a high level (II), and it makes up 2.38 % of the study
                                                                         area. The moderate vulnerability (III) zone is mainly under
                                                                         the urban infrastructure class, with a total area of 8.42 km2 .
                                                                            Figure 18 shows that the zones marked by a very high vul-
                                                                         nerability (level I) are mainly distributed in the center of the
                                                                         Daya Bay Petrochemical Zone (B) and the Daya Bay Devel-

https://doi.org/10.5194/nhess-21-439-2021                                           Nat. Hazards Earth Syst. Sci., 21, 439–462, 2021
458 S. Wang et al.: Assessing and zoning of typhoon storm surge risk with a GIS technique
opment Zone (D) as well as the residential areas including high. When the minimum central pressure is 880 hPa, the
the Renshan town (G), the Gilong town (J), and the Huangbu Daya Bay Petrochemical Zone (B) has a deep inundation sta-
town (K): tus (level I). Thus, the risk level in this zone is very high
(level I). As the minimum central pressure is 910 or 920 hPa,
1. The high-density human settlements and the highly con-
the risk levels over a wide area of the Daya Bay Petrochem-
centrated petroleum and chemical industries make the
ical Zone (B) are high and moderate. However, the Daya
Daya Bay Petrochemical Zone (B) highly susceptible to
Bay Petrochemical Zone (B) is largely free from risk due
the effects of surge disaster, and thus the property and
to the protection provided by the storm surge barriers along
human loss caused by the storm surge is significant.
the coastline when the minimum central pressure is 930 or
2. The center of the Daya Bay Development Zone (D) 940 hPa.
could suffer potential human casualties during storm Moreover, the Huizhou Port (C) and the southeast of the
surge events due to the higher density of the population. Daya Bay Development Zone (D) are classified as very high-
risk or high-risk regions because the regions occupied by
3. The residential areas including the Renshan town (G), transportation land or human settlements (Fig. 18) are com-
the Gilong town (J), Pinghai town (H), and the Huangbu bined with high or very high levels of hazard of storm surge
town (K), which lie along the coastline, are more vul- (Fig. 14). In addition, the regions featuring very high or
nerable to the storm surge without the protection from high risk levels are the area to the north of the White Sand
barriers. Therefore, these zones would most likely suf- Shore (A), the Renshan town (G), Pinghai town (H), and the
fer significant losses from storm surge. Huangbu town (K). Without the protection from the barrier
Furthermore, the Huizhou port (C) is located on the coast, system, these regions mainly occupied by humans are at a
playing a critical role in global trading, which could leave moderate risk level even as the minimum central pressure is
residents and assets with greater exposures to the storm surge 940 hPa. Although the vulnerability level is high in the Gi-
than those located further inland. Accordingly, the vulnera- long town (J) and the Tieyong town (N), there is no sign of
bility level in the Huizhou port (C) is high (level II). the risk of storm surge due to their locations far from the
Moreover, some urban infrastructure, transportation, and coastline when the minimum central pressure is 910, 920,
mining storage that are situated along the coastline of 930, or 940 hPa.
Huizhou are sensitive to the storm surge, and the vulnerabil- The total area of hazard and risk of storm surge under dif-
ity level for these coastal zones is moderate (III) or high (II). ferent typhoon intensities are shown in Fig. 21. It can be ob-
In addition, the most common land cover types over the served from Fig. 21 that although 83.4 % (227 km2 ) of the to-
study area are forest land, agriculture land, the garden plot tal inundated area is a very high-hazard zone with regards to
land, and the water land. These land cover types are hardly storm surge as the minimum central pressure is the 880 hPa,
affected by natural disasters. Thus, most regions in the study only 8 % (21.97 km2 ) of the total inundated area belonged
area colored by blue are at a low vulnerability level (IV). to the very high-risk zone with regards to storm surge, and
25 % (66.39 km2 ) of the entire inundated area falls into the
4.3 Risk assessment moderate risk category due to its moderate or high vulner-
ability level. For other typhoon scenarios, many inundated
With the risk matrix approach (Table 8), the risk map in the areas are at a high hazard level for storm surge, but most of
study area can be made by the combination of the hazard map them change to moderate-risk zones, which indicates that the
and the vulnerability map. The risk region was categorized area at a high hazard level cannot represent that area at a high
into four dangerous zones represented by different colors, as risk level.
shown in Fig. 19. The statistics of the areas of different risk
level zones for each of the design scenarios are summarized
in Fig. 20. 5 Conclusions
The statistics data in Fig. 20 indicate the total area at a
risk level and the land area labeled with a very high-level In this paper, the coupled model (ADCIRC–SWAN) and the
decrease with the increasing minimum central pressure of a Jelesnianski method were used for semiquantitative risk as-
typhoon. The regions at a moderate risk level take the largest sessment of storm surge under different typhoon intensity.
portion of the total area at a risk level for each of the typhoon The typhoon intensity scenarios were designed to the min-
scenarios. For example, approximately 66.39 km2 area is ex- imum central pressure of 880, 910, 920, 930, and 940 hPa
posed to the moderate risk as the minimum central pressure (corresponding to 1000-, 100-, 50-, 20-, and 10-year return
is 880 hPa, and an area of about 22.57 km2 would be at mod- period). The coastal dikes and levees, which are supposed to
erate risk when the minimum central pressure is 940 hPa. not be damaged during the modeling period, were included in
Figure 19 shows that the high concentrations of petroleum the ADCIRC–SWAN model and Jelesnianski method to sim-
industries and the high density of the population in the Daya ulate the storm surge. The possible inundation extents and
Bay Petrochemical Zone (B) make its vulnerability very depths of storm surge under five different typhoon intensi-
Nat. Hazards Earth Syst. Sci., 21, 439–462, 2021 https://doi.org/10.5194/nhess-21-439-2021You can also read