Professional Opinion - Government of ...
←
→
Page content transcription
If your browser does not render page correctly, please read the page content below
Professional Opinion

             No. 2010/04

             Storm surge modelling for
             Bunbury, Western Australia
             L. Fountain., J. Sexton, N. Habili, M. Hazelwood, and H Anderson.

              PREPARED FOR:

              Department of Planning, Western Australia and the Western Australian
              Planning Commission
              November 2010

A P P LY I N G G E O S C I E N C E TO AU ST R A L I A’ S M O ST I M P O R TA N T C H A L L E N G E S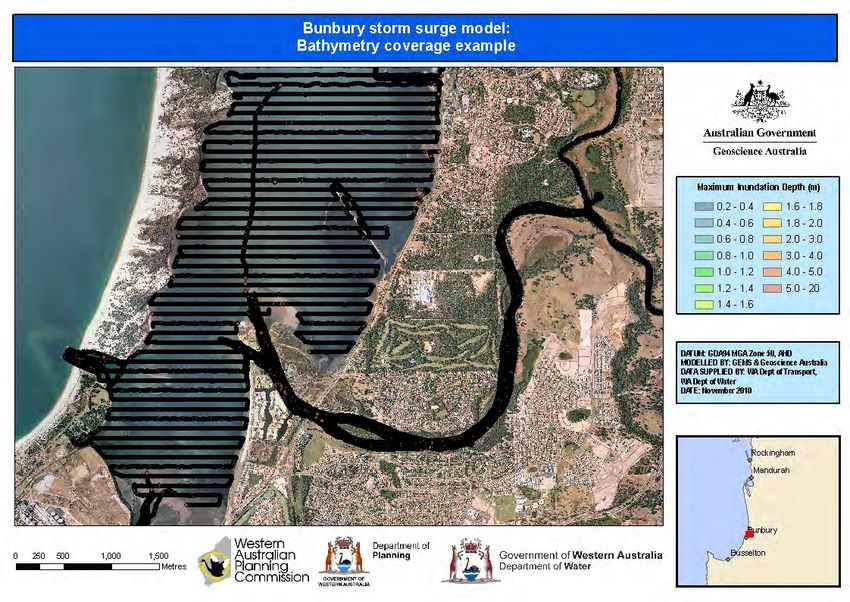
Professional Opinion 2010/04 – Storm surge modelling for Bunbury, Western Australia

Professional Opinion 2010/04:

Storm surge modelling for Bunbury,
Western Australia

                                         November 2010
Professional Opinion 2010/04 – Storm surge modelling for Bunbury, Western Australia

Department of Resources, Energy and Tourism
Minister for Resources, Energy and Tourism: The Hon. Martin Ferguson, MP
Secretary: Mr Drew Clarke

Geoscience Australia
Chief Executive Officer: Dr Chris Pigram

© Commonwealth of Australia 2010

This work is for internal government use only and no part of this product may be
reproduced, distributed or displayed publicly by any process without the joint permission
of Geoscience Australia (GA), the Western Australian Department of Planning (DoP) and
the Western Australian Planning Commission (WAPC). Requests and enquiries should be
directed to the Chief Executive Officer, Geoscience Australia, GPO Box 378 Canberra ACT
2601 and the Department of Planning, Gordon Stephenson House, 140 Williams Street,
Perth WA 6000. GA, DoP and WAPC and have tried to make the information in the
product as accurate as possible. However, it does not guarantee that the information is
totally accurate or complete. Therefore, you should not solely rely on this information
when making a commercial decision.

GeoCat No. 70307

Bibliographic reference: Fountain, L., Sexton, J., Habili, N., Hazelwood, M. and Anderson,
H. 2010. Storm surge modelling for Bunbury, Western Australia, Professional Opinion.
No.2010/04

                                         November 2010
Professional Opinion 2010/04 – Storm surge modelling for Bunbury, Western Australia

Contents

1.  Executive Summary ..................................................................................................................7
2.  Glossary ......................................................................................................................................9
3.  Introduction .............................................................................................................................10
4.  Methodology ............................................................................................................................13
  4.1.   Storm Surge Modelling Framework............................................................................13
  4.2.   City of Bunbury Case Study .........................................................................................15
5. Results .......................................................................................................................................25
6. Discussion ................................................................................................................................34
  6.1.   Model Issues and Limitations ......................................................................................36
7. Conclusions ..............................................................................................................................39
8. References ................................................................................................................................41
Appendix. A Storm scenario - background................................................................................43
Appendix. B Shoreface Translation Model (STM) Methodology - Overview ....................48
Appendix. C TC Alby observed high water levels ...................................................................52

                                                                        iii

                                                                    November 2010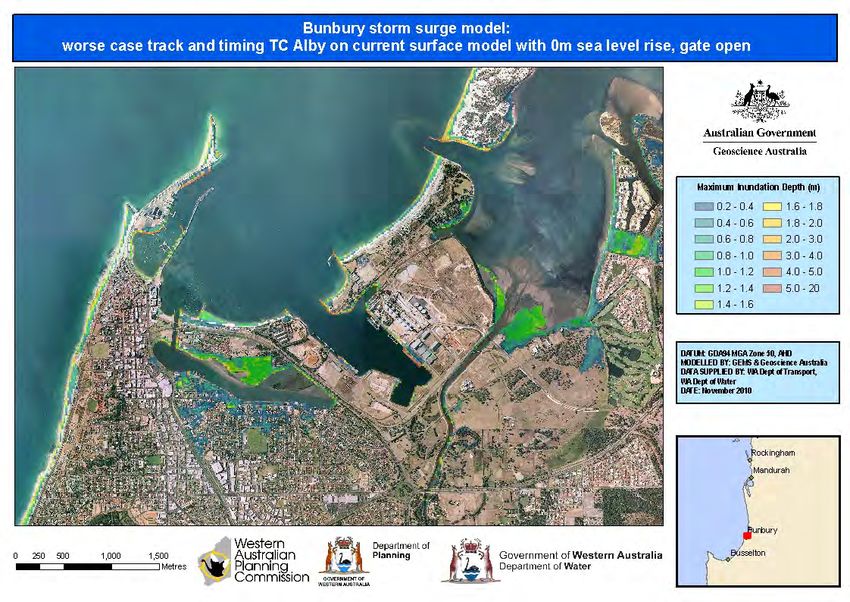
Professional Opinion 2010/04 – Storm surge modelling for Bunbury, Western Australia

Figures
Figure 1: Storm surge modelling methodology. This project applies the GCOM2D model as
    developed and applied by GEMS to estimate the offshore hazard and ANUGA to
    estimate the storm surge inundation. The change to the coastline is estimated using the
    STM as developed and applied by the University of Sydney. ..........................................13
Figure 2: ‘Actual case’ (black) and ‘worst case’ (pink) tracks for TC Alby used for
    verification and prediction of extreme outcomes respectively..........................................17
Figure 3: Model output from GEMSURGE and the tide gauge reading at Bunbury for TC
    Alby............................................................................................................................................18
Figure 4: Area of interest for storm surge inundation. ...............................................................19
Figure 5: ANUGA refinement for Bunbury inundation model.................................................20
Figure 6: Synthetic gauges supplied by DoP................................................................................21
Figure 7: Sub cells within the Busselton-Rockingham coastal cell............................................23
Figure 8: Bunbury – Stratham Golf Course sub cell (#5) coastal recession risk forecast with
    time in the future......................................................................................................................24
Figure 9: Extent of potential recession for Bunbury by 2100. The potential costal recession
    distances are represented as gradated probabilities from the minimum recession of
    approximately 150m to the maximum extent of up to 450m. NB: the influence of the
    underlying geology on the extent of potential recession....................................................24
Figure 10: Maximum inundation depth (m) for Case 1 – gate open.........................................25
Figure 11: Maximum inundation depth (m) for Case 2 – gate closed.......................................26
Figure 12: Maximum inundation depth (m) for Case 2 – gate open.........................................26
Figure 13: Maximum inundation depth (m) for Case 3 – gate closed.......................................27
Figure 14: Maximum inundation depth (m) for Case 3 – gate open.........................................27
Figure 15: Maximum inundation depth (m) for Case 4 – gate closed.......................................28
Figure 16: Maximum inundation depth (m) for Case 4 – gate open.........................................28
Figure 17: Maximum inundation depth (m) for Case 5 – gate closed.......................................29
Figure 18: Maximum inundation depth (m) for Case 5 – gate open.........................................29
Figure 19: Maximum inundation depth (m) for Case 6 ..............................................................30
Figure 20: Time series at two of the synthetic tide gauges supplied by DoP (DoP_2 and
    DoP_4) for Case 5 – gate open................................................................................................31
Figure 21: Time series at two of the synthetic tide gauges supplied by DoP (DoP_2 and
    DoP_4) for Case 5 – gate closed. ............................................................................................32
Figure 22: Offshore synthetic tide gauges. ...................................................................................33
Figure 23: Time series at one of the synthetic offshore tide gauges (B) for Case 1. ................33
Figure 24: Time series at one of the synthetic offshore tide gauges (B) for Case 2. ................34
Figure 25: Maximum inundation depth (m) for Case 1 as modelled by GEMS. .....................35
Figure 26: Maximum inundation depth (m) for Case 2 as modelled by GEMS. .....................36
Figure 27: Elevation data coverage example................................................................................38
Figure 28: Official track of Tropical Cyclone Alby from the Bureau of Meteorology. ...........43
Figure 29: Tracks of cyclones in the Mandurah area (defined by box) for the period 1950-
    2008. ...........................................................................................................................................46
Figure 30: Minimum central pressure of storms in the Mandurah area (1950-2008) – that is
    within box shown in Figure 29...............................................................................................46
Figure 31: Return for cyclone central pressure for the region shown in Figure 29.................47
Figure 32: Schematic diagram showing features of a tropical cyclone undergoing extra-
    tropical transition.....................................................................................................................47
Figure 33: Components incorporated pragmatically into morphological behaviour
    modelling. The objective of the STM is to enable quantitative experimentation on how

                                                                          4

                                                                      November 2010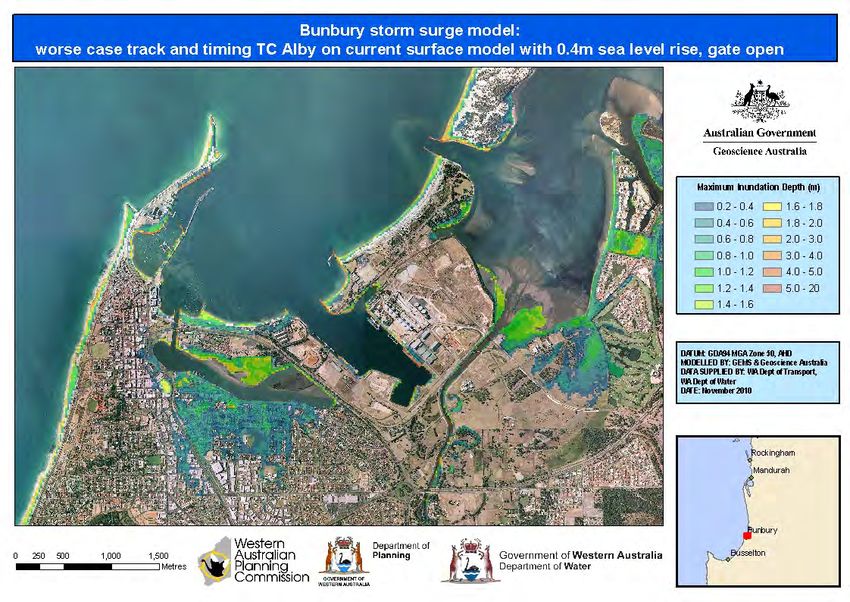
Professional Opinion 2010/04 – Storm surge modelling for Bunbury, Western Australia

    factors in the third level influence morphological behaviour. (Source: Cowell et al.,
    1995) ...........................................................................................................................................48
Figure 34: Responses of a sand body to sea-level rise: (a) barrier rollover where landward
    bypassing occurs as washover, flood-tide delta or transgressive-dune deposits; (b and
    c) transitional barrier truncation with a steeper backshore; (d) a mainland beach where
    the littoral cell is closed. (Source and further explanation: Cowell et al., 2006).............49
Figure 35: Definition sketch of basic profile geometry and internal parameters for the
    limiting types of behaviour; (a) barrier mode and (b) encroachment mode (Source:
    Cowell et al., 1995) ...................................................................................................................50
Figure 36: Location of inundation observations from TC Alby in 1978. ..................................52

                                                                          5

                                                                      November 2010
Professional Opinion 2010/04 – Storm surge modelling for Bunbury, Western Australia

Tables
Table 1. Scenario labels and descriptions. ....................................................................................11
Table 2: Observations from TC Alby in 1978. ..............................................................................55

                                                               6

                                                            November 2010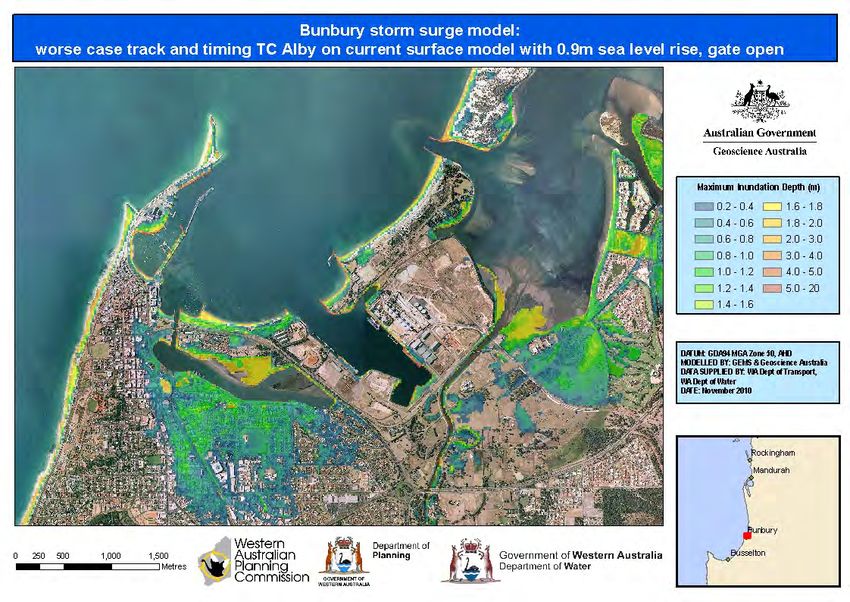
Professional Opinion 2010/04 – Storm surge modelling for Bunbury, Western Australia

1. Executive Summary
Geoscience Australia (GA), the Western Australian (WA) Department of Planning (DoP)
and the Western Australian Planning Commission (WAPC) have collaborated through a
Memorandum of Understanding (MoU) to develop a storm surge modelling methodology
that can be applied to Bunbury. The aim of this document is to provide the DoP and WAPC
with a description of the methodology, how the model and the results may be used, and an
assessment of the estimated inundation from a range of storm surge and climate change
scenarios at Bunbury. At the conclusion of the MoU, this modelling methodology will be
made available to the DoP and WAPC through the provision of tools and data that can be
used for planning purposes.

The modelling methodology used here integrates the outputs from Global Environmental
Modelling Systems (GEMS) 2D Coastal Ocean Model (GCOM2D) regional scale storm
surge model with the free and open source hydrodynamic modelling software ANUGA to
estimate inundation at the City of Bunbury resulting from a range of possible storms surge
events. These models are used in conjunction with the Shoreface Translation Model (STM),
developed by Peter Cowell, Peter Roy and Bob Jones at the University of Sydney, to predict
potential inundation under a number of climate change scenarios that alter the local
coastline surrounding Bunbury. All care has been taken to validate and calibrate each
component of this modelling methodology and further validation is required for the
integrated modelling methodology. The results described in this report are an important
first step in that validation process. It must be remembered that all aspects of the modelling
methodology involve uncertainty and approximations, and model results are by nature
only indicative. As a result, the model outputs described here should not be relied upon
solely for planning decisions.

The model outputs described here can provide an indicative relative assessment of
potential inundation. The outputs highlight that certain parts of the coastline are
vulnerable to inundation and that some areas have the potential for greater inundation
than others. The model outputs may be used in the development of appropriate town
planning policy response, community awareness raising, development assessment
processes, emergency planning responses and physical flood protection infrastructure.
However, the resolution and accuracy of the model is not sufficient to predict damage to
individual properties. The model results must be used as only one of a number of inputs
that must be considered when attempting to understanding the risk of storm surge
inundation to the City of Bunbury.

                                              7

                                            November 2010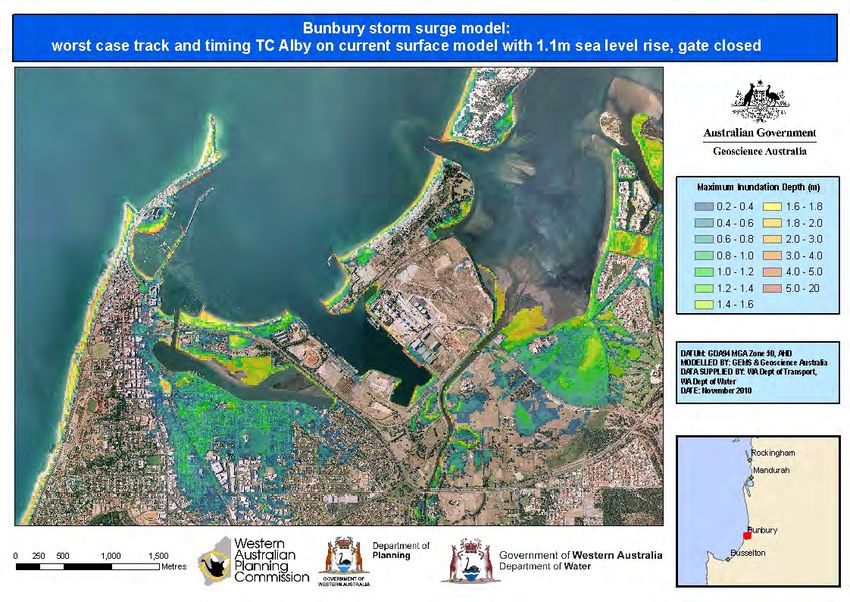
Professional Opinion 2010/04 – Storm surge modelling for Bunbury, Western Australia
The assessment covers model results for six cases:
1. Simulation of inundation arising from the 1978 Tropical Cyclone (TC) Alby event
(baseline event)
2. Simulation of inundation resulting from a ‘worst case’ track given the current
surface model and no sea level rise
3. Simulation of inundation resulting from a ‘worst case’ track given the current
surface model and a 0.4m level rise
4. Simulation of inundation resulting from a ‘worst case’ track given the current
surface model and a 0.9m sea level rise
5. Simulation of inundation resulting from a ‘worst case’ track using the current
surface model and a 1.1m sea level rise
6. Simulation of inundation resulting from a ‘worst case’ track given a potential future
surface model and a 1.1m sea level rise
The effect of the storm surge gate at Bunbury will also be investigated for cases 1-5. For
each of these cases, the model outputs will be:
Maximum inundation depth maps,
Maximum flow speed maps, and
Time series plots for particular locations.
The key observations of the modelled outputs are:
The foredunes on the open coast play a significant role in protecting the City of
Bunbury from storm surge inundation for all cases considered.
These foredunes continue to exist in the potential future surface model; however
they are translated in distance (landward) and have increased in height.
The potential future surface model developed here assumes that no other coastal
engineering processes have occurred.
The storm surge gate acts to reduce the inundation extent for the 1978 TC Alby
event and the worst case track and timing TC Alby event for the current surface
model.
The modelled inundation resulting from the integrated GCOM2D and ANUGA
method described here compares well with inundation from GCOM2D.
The model outputs compare well with the observed tide gauge reading at Bunbury.
The model comparison with observed inundation from 1978 lies between Case 3
and Case 4.
8
November 2010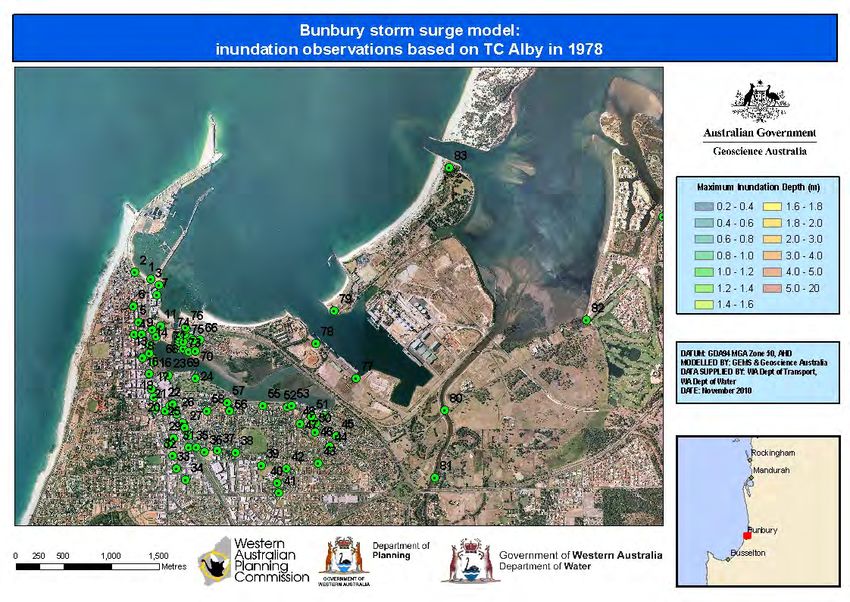
Professional Opinion 2010/04 – Storm surge modelling for Bunbury, Western Australia

2. Glossary
This table defines technical terms and abbreviations used in this document.

ANU                         Australian National University.
ANUGA                       A free and open source hydrodynamic modelling tool developed
                            jointly by the Australian National University and Geoscience Australia.
Bathymetry                  The depth of the ocean floor from the water surface.
DCCEE                       Australian Government Department of Climate Change and Energy
                            Efficiency.
DoP                         Western Australian Department of Planning.
FOSS                        Free and Open Source Software.
GA                          Geoscience Australia.
GCOM2D                      GEMS 2D Coastal Ocean Model .
GEMS                        Global Environmental Modelling Systems Pty Ltd,
Geomorphic features/        Surface features and landforms including those on the seafloor (see
geomorphology               geomorphology glossary below for definitions of geomorphic terms).
Return period               Also known as a recurrence interval, this is an estimate of the interval
                            of time between hazard events of a certain size.
SLR                         Sea level rise.
STM                         Shoreface Translation Model developed and applied by the University
                            of Sydney.
Topography                  The elevation of the land surface from sea level.
WAPC                        Western Australian Planning Commission.
Wave height                 The positive amplitude of the storm surge wave. When the storm
                            surge reaches the shore it often reaches run‐up heights much greater
                            than this.

                                                9

                                              November 2010
Professional Opinion 2010/04 – Storm surge modelling for Bunbury, Western Australia
3. Introduction
The Western Australia (WA) coast line is particularly vulnerable to the impacts of storm
surge. This is especially so due to the close proximity of the urban environment to the coast
and, generally speaking, the low relief of the coastal hinterland. Numerous historic storm
surge events have been recorded in WA. The effects of climate change and the changing
nature of cyclones, coupled with projected sea level rise, may lead to increased
vulnerability to storm surge inundation. This has been recognised nationally with the
Department of Climate Change and Energy Efficiency (DCCEE) initiating a suite of studies
to support a National Coastal Vulnerability Assessment (DCCEE, 2010).
GA has been developing and applying a tsunami impact and risk modelling methodology
since 2005 largely based on the ANUGA hydrodynamic inundation model. Recently,
ANUGA has also been trialled and further developed to work as a tool for the simulation
of riverine flooding from rainfall events predominantly by individuals in local councils.
This report outlines the development of a modelling methodology which can be used to
simulate storm surge along the coast of Australia. The aim of the project is to equip
ANUGA, traditionally used for inundation, with the necessary tools to accurately model
storm surge. An associated aim is to validate the new methodology against a historical
event and finally provide a case study of potential impacts of storm surge on the City of
Bunbury. The results of this study may be used to develop appropriate planning and
development policies that respond to the identified flood risk.
A range of commercial storm surge models are currently employed by consultants around
Australia. A key intent of this project is to develop a modelling capability that is provided
through the free and open source ANUGA software that can be applied by the Western
Australian State or local governments or provided to third-party contractors. The open
source software will provide increased transparency to the WA government, ability to
rerun models when new data is available, test mitigation options and potentially reduce
costs of any future storm surge studies. This approach aligns with the goals of the 2002
COAG review of Natural Disasters in Australia in developing data, information and tools
that could be used by government to manage natural hazard risk in Australia.
ANUGA is specifically designed for robust modelling of the wetting and drying processes
arising from shallow water flow over dry land. This allows for modelling of tsunami, flood
and storm surge. ANUGA has been extensively applied and validated against tsunami
flow and is increasingly being used for flood modelling. The software has been designed
for detailed localised inundation studies and is currently less suited to large, regional scale
assessments. Consequently, ANUGA is currently not capable of modelling the entire storm
surge process. ANUGA must be coupled with another coarser large scale open ocean storm
surge model before it can be applied to simulate onshore inundation.
For this project then, the storm and the resultant storm surge will be modelled by Global
Environment Modelling System (GEMS) using GCOM2D (Hubbert, 1990 and 1991). The
storm surge height and current estimated by GCOM2D will be used to drive ANUGA
10
November 2010Professional Opinion 2010/04 – Storm surge modelling for Bunbury, Western Australia
which will then estimate inundation at the City of Bunbury. Over the life of this project, it
is intended to equip ANUGA with the ability to incorporate wind fields directly from other
models (preferably free and open source, FOSS) as well as wave setup processes (such as
SWAN 1 ) so that a free an open source integrated storm surge inundation model can be
developed.
GCOM2D can estimate storm surge inundation. A key activity of this project will be to
compare ANUGA inundation estimates with the GCOM2D inundation estimates.
Differences will be expected as each model implements a different numerical modelling
approach. All numerical schemes have advantages and disadvantages and it is not the
purpose of this report to provide a treatise on that.
ANUGA also does not model the change to the coastline through sea-level rise and long
term erosion and sediment transport. The timescales of such processes are of the order of
tens to hundreds of years, whereas the timescales typically modelled by ANUGA are hours
to days. To estimate the effect of storm surge, subject to climate change, in addition to an
open ocean storm surge model, ANUGA must also be coupled with a model which can be
used to predict long-term change in coastline morphology. The Shoreface Translation
Model (STM), developed by the University of Sydney is one such model. It must be noted
that ANUGA has the ability to dynamically change the elevation during a simulation;
however this is only suitable for processes that occur over short timeframes of hours to
days.
REPORT STRUCTURE
The remainder of this document proposes an inundation modelling methodology for
simulating storm surge along the Australian coast. A number of storm surge scenarios that
could potentially impact the City of Bunbury are investigated. Numerous measures such as
maximum inundation depth and current maps and time series at selected locations, are
used to quantify impacts. Finally we present recommendations and discuss the utility of
ANUGA for modelling storm surge inundation and avenues for future work.
All figures are named by: Scenario_speed/depth where Scenario is labelled as shown in Table
1.
Scenario Description
Case_1 Simulation of the 1978 Tropical Cyclone (TC) Alby event (baseline event)
Case_2 Worst case track and timing TC Alby on current surface model with 0m sea level rise
Case_3 Worst case track and timing TC Alby on current surface model with 0.4m sea level rise
Case_4 Worst case track and timing TC Alby on current surface model with 0.9m sea level rise
Case_5 Worst case track and timing TC Alby on current surface model with 1.1m sea level rise
Case_6 Worst case track and timing TC Alby on future surface model with 1.1m sea level rise
Table 1. Scenario labels and descriptions.
Maximum inundation depth maps are provided on the accompanying DVD. These show
the maximum water depth onshore (Figures appended depth). Maximum flow speed maps
are also provided on the accompanying DVD showing the maximum flow speeds expected
offshore as well as the inundation zone (Figures appended speed).
1SWAN is a third-generation wave model that computes random, short-crested wind-generated
waves in coastal regions and inland waters, see http://vlm089.citg.tudelft.nl/swan/index.htm
11
November 2010Professional Opinion 2010/04 – Storm surge modelling for Bunbury, Western Australia
The modelled outputs (in the form of ArcGIS raster grids) used in the creation of the above
figures are also provided on the accompanying DVD. This is to enable the DoP and WAPC
to incorporate outputs into their decision support systems, thereby assisting storm surge
planning activities.
By the completion of the MoU in June 2011, the modelling software, model configurations
in the form of computer scripts, and all input data will be supplied. Instructions on
installing the relevant software and locations of data and scripts will be provided.
12
November 2010Professional Opinion 2010/04 – Storm surge modelling for Bunbury, Western Australia
4. Methodology
4.1. Storm Surge Modelling Framework
Numerous models are currently used to simulate storm surge inundation, such as
GCOM2D and Mike21. Here we introduce the modelling methodology employed by
Geoscience Australia to model storm surge. The general outline of the proposed modelling
methodology is illustrated in Figure 1.
Offshore hazard model
(GCOM2D)
Cyclone
Offshore storm surge
Future climate
coastal
Elevation Data response
(STM)
Translated
coastline
Inundation hazard model
(ANUGA)
Onshore inundation
Figure 1: Storm surge modelling methodology. This project applies the GCOM2D model as developed and applied by
GEMS to estimate the offshore hazard and ANUGA to estimate the storm surge inundation. The change to the
coastline is estimated using the STM as developed and applied by the University of Sydney.
The methodology used by Geoscience Australia has three distinct components. Firstly a
bathymetry and elevation data set must be obtained. When investigating the effects of
climate change, an appropriate model must be used to estimate the shoreline recession
and/or growth caused by long-term climatic processes. Here we use the Shoreface
Translation Model (STM). The STM modelling methodology, outlined in Appendix B,
estimates shoreline recession based on climate change scenarios. The STM developed by
the University of Sydney is capable of modelling the effects of sea-level rise, disturbances
to sediment budgets, effects of mixed sediment-sizes (including sand and mud), variable
resistance to erosion for material comprising strata in the substrate (which can include
bedrock and reefs), and complex topography. The Bruun Rule, normally used to predict
coastal retreat due to sea-level rise, cannot handle any of these complications.
Once the shoreline geometry has been determined the sea surface deformation caused by
the storm surge on the regional scale must be approximated. Here we use GCOM2D
(Hubbert, 1990 and 1991) to provide an accurate representation of surface wind and
13
November 2010Professional Opinion 2010/04 – Storm surge modelling for Bunbury, Western Australia
atmospheric pressure fields over the region of interest. The GCOM2D has been applied to a
large number of locations around Australia including: Port Hedland, Karratha, Cape
Lambert, Derby, Onslow, Dampier, Cairns, Gold Coast, Darwin, Mornington Island and
Port Phillip Bay. The model is based on the storm surge model described by Hubbert el al.
(1990, 1991) and Hubbert and McInnes (1999). Surface wind speeds and pressures are
derived indirectly by applying a tropical cyclone vortex model based on the empirical
relationships presented by Holland (1980). Atmospheric forcing is derived from the GEMS
Mesoscale Atmospheric Prediction System (MAPS) or from a tropical cyclone model.
Once the GCOM2D model has been applied, the predicted sea surface height and
momentum are used to generate a boundary condition for a localised ANUGA inundation
simulation. ANUGA is a Free and Open Source Software (FOSS) package capable of
modelling the impact of hydrological disasters 2 . The software is based on the conserved
form of the shallow water wave equations discretised to unstructured triangular meshes
using a finite-volume numerical scheme (Nielsen et al 2005). ANUGA has primarily been
used for tsunami inundation modelling (Jakeman et al 2010) and there is an increasing
interest in developing ANUGA into a tool for flood modelling, dam break studies and
modelling of coastal processes (see, for e.g. Middelmann-Fernandes and Nielsen, 2009).
Elevation data is needed by all three models. As the scale of the physical processes is
different for each model, the resultant resolution of the elevation data is different for each
model. Where physical processes act quickly, as in the deep ocean, coarse bathymetry data
can be used. As the storm surge reaches shallow water and the complex nearshore
environment, increasingly finer scale data is required. A key benefit of the numerical
implementation adopted by ANUGA is that the unstructured mesh allows high resolution
data to be taken advantage of in areas of interest.
High resolution bathymetry and topography data has been provided by the WA State
Government. The Department of Water provided onshore LiDAR 3 and the Department of
Transport (DOT) provided offshore LiDAR. This was supplemented by additional
bathymetry from DoT such as fairsheets and chart data. In addition, the 250 m Australian
bathymetry and topography grid (Geoscience Australia, 2005) was also incorporated for
the deeper water sections.
The elevation data is bare earth, meaning it does not include buildings or other structures.
A tsunami inundation model of the 2004 Indian Ocean Tsunami impact on Patong Beach,
Thailand illustrates that the inclusion of structures into the elevation data can have a
significant impact on the modelled inundation extent (Jakeman et al 2010). It is anticipated
that there would also be some impact to the inundation for the City of Bunbury, however,
it is not as highly urbanised as at Patong Beach. This information could be incorporated
into the model should building footprints, or higher-resolution elevation data which
includes structures, become available.
The use of the three aforementioned models is intended to enhance the modelling process
by using models which are individually well suited to one of the three distinct phases of
storm surge modelling subject to climate change. The STM is designed specifically to
estimate shoreline recession based on climate change scenarios. GCOM2D is well suited to
2 The software can be downloaded online at http://sourceforge.net/projects/anuga
3 Light Detection and Ranging with a horizontal resolution of 1m.
14
November 2010Professional Opinion 2010/04 – Storm surge modelling for Bunbury, Western Australia
modelling storm surge over large distances. In comparison, ANUGA is designed to
accurately model the complex wetting and drying process of inundation.
4.2. City of Bunbury Case Study
In estimating the inundation from a particular storm event, the process is as follows:
1. build an offshore storm surge model using GCOM2D
a. generate a storm event using a vortex model
i. set the storm path (geographic fixes of the storm centre in time)
from which the direction and speed of movement can be derived
ii. set the central pressure
iii. set the Radius of Maximum Wind (the distance from storm centre to
the band of strongest winds which occurs in the eye wall)
iv. set the Shape Parameter “B” (which along with the radius of
maximum wind) defines the rate of change of wind speed with
distance from the centre.
b. model the storm surge
i. determine locations of interest where model is refined
ii. set the initial conditions (time of day, initial sea level, elevation)
iii. set the boundary conditions (e.g. tide)
iv. simulate the model for a specified time
v. determine the time varying wave height and momentum
vi. if modelling an historic event, calibrate the model by comparing to
a tide gauge in the area
2. build an inundation model using ANUGA
a. determine locations of interest where model is refined
b. set the initial conditions (time of day, initial sea level, elevation)
c. set the boundary conditions (in this case the outputs from GCOM2D)
d. simulate the model for a specified time
e. determine the run-up (maximum elevation above mean sea level reached
by the wave), inundation distance (maximum distance from the coast
reached by the wave) and time varying inundation depth and horizontal
momentum at a given coastal locality
i. compare with observed data if available
3. investigate the impact of storm surge gate
4. investigate the impact of various climate change scenarios
a. use a shoreline recession model to predict the changes to the coastline
induced by climate change induced sea-level rise and return to 2b
b. change initial sea level in step 2b and rerun
Step 1a – generate a storm event using a vortex model:
As one of the most intense cyclones on record to impact the southern reaches of the west
coast of Western Australia, Tropical Cyclone Alby (TC Alby) that occurred in 1978 has been
used as a baseline event for this project. Modelling an historic event has the benefit of the
impacts being remembered by the community. This is very important when the model
results are being communicated as the community can more easily relate to the scenario
and can compare the model outputs with what they may have experienced or heard. If the
results match people’s experiences, then the community may have a greater trust in model
results for future, hypothetical events. From a modelling point of view, it is crucial to
15
November 2010Professional Opinion 2010/04 – Storm surge modelling for Bunbury, Western Australia
model historical events where observed data is available to be able to calibrate and validate
the model.
TC Alby was the fifth tropical cyclone of the 1977/78 cyclone season in the north western
Australian region. A detailed description of the life cycle and impact of TC Alby is
contained in the Bureau of Meteorology report of TC Alby with the key points summarised
at Appendix A.
An estimation of a return period for TC Alby is problematic because of the relatively small
number of cyclonic events that have had a major impact on the west coast of WA.
Appendix A provides an analysis of the history of these events for the period 1950-2008 to
estimate that the estimated return period for TC Alby to be of the order of 200 years.
The question of whether rainfall induced flooding will be coincident with the TC Alby
storm surge also needs to be considered. Based on an understanding of the cyclone system
(see Appendix A) it can be concluded that for storms that cross the coast, the incidence of
storm surge associated with the strongest on-shore winds, areas of significant rainfall and
the location surge is unlikely to be coincident. For storms that remain off the coast and
which have the capacity to produce sea level elevation as result of a ‘trapped wave’ that
propagates southwards along the coast heaviest rainfall is also expected to remain offshore.
Moreover, the fact that the cyclones are moving rapidly means that even when rainfall
rates are relatively intense, total rainfall within a catchment will be limited by the duration
of that rainfall.
Based on this assessment it is considered that coincidence of the rainfall induced flooding
and significant surge is quite unlikely and is therefore not considered from a modelling
perspective in this study.
The track shown and described for TC Alby in Appendix A was used for simulations to
validate the model (described below). In order to investigate the impact of a ‘worst case’
strike this track was shifted in space so that the storm maximum winds impacted more
directly on the City of Bunbury as shown in Figure 2. A large number of alternate tracks
were investigated in order to determine the worst cyclone track using the same cyclone
intensity and dimension parameters exhibited by TC Alby. It emerged from these studies
that the same ‘worst track’ applied to both Mandurah and Bunbury (and Busselton) due to
the nature of the sea level response to TC Alby in the region from Mandurah to Bunbury.
To understand this it is important to note that the data from the tide gauges at Mandurah,
Bunbury and Busselton showed that the peak sea levels at each location occurred at all
three locations within an hour of each other. This is due to the fact that TC Alby was
moving very fast as it passed along this region producing a sea level response along the
coast which was almost concurrent at each of the three locations. The shifted track is
shown in Figure 2 along with the ‘actual’ track used for verification (the verification ‘track’
is explained further below).
16
November 2010Professional Opinion 2010/04 – Storm surge modelling for Bunbury, Western Australia
Figure 2: ‘Actual case’ (black) and ‘worst case’ (pink) tracks for TC Alby used for verification and prediction of
extreme outcomes respectively.
Step 1b – model the storm surge:
The model simulations were carried out with the GEMS Storm Surge simulation model
(GEMSURGE). This model simulates the inundation during extreme coastal and riverine
events driven by atmospheric pressures, winds, tides and bottom friction (more important
in shallow water and across hitherto dry land). The atmospheric pressures and the wind
fields are predicted from the cyclone track information with a cyclone model based on the
Holland vortex model (1980 and 2008). The bottom frictions are calculated from terrain
type information if it is available.
The tidal forcing for the studies was generated from the GEMS tidal constituent database
which was initially developed for the Western Australian coast for Australian Maritime
Safety Authority (AMSA) to support the AMSA Search and Rescue Ocean prediction
system which is based on the GEMS ocean model. The tidal constituent data was derived
from a long term modelling study on a 1.8km grid around Australia which involved
multiple iterations of model predictions, comparison with tide gauge data and adjustment
17
November 2010Professional Opinion 2010/04 – Storm surge modelling for Bunbury, Western Australia
of boundary conditions based on error analyses. The model iterations were continued until
errors reached a minimum status.
The official track for TC Alby provided by the Bureau of Meteorology was given in decimal
degrees of latitude and longitude quoted to one decimal place. The potential numerical
error in this track is therefore approximately +/- 5kms. The initial simulation with the
precise official track did not produce a good verification at Bunbury and Mandurah with
the errors being higher at Mandurah. Adjustment of the track within the +/- 5kms error
margin however resulted in a much better verification being obtained.
Figure 3: Model output from GEMSURGE and the tide gauge reading at Bunbury for TC Alby.
The model compares well against the observation at the tide gauge at Bunbury as shown in
Figure 3. The model introduces some artificial oscillations prior to the largest peak.
Importantly the model estimates the height of the main surge and captures the subsequent
ocean surface fluctuations.
Step 2 - build an inundation model using ANUGA:
Any model should be set up according to end user requirements and it should also
consider the potential vulnerability of the inundation based on the elevation and what may
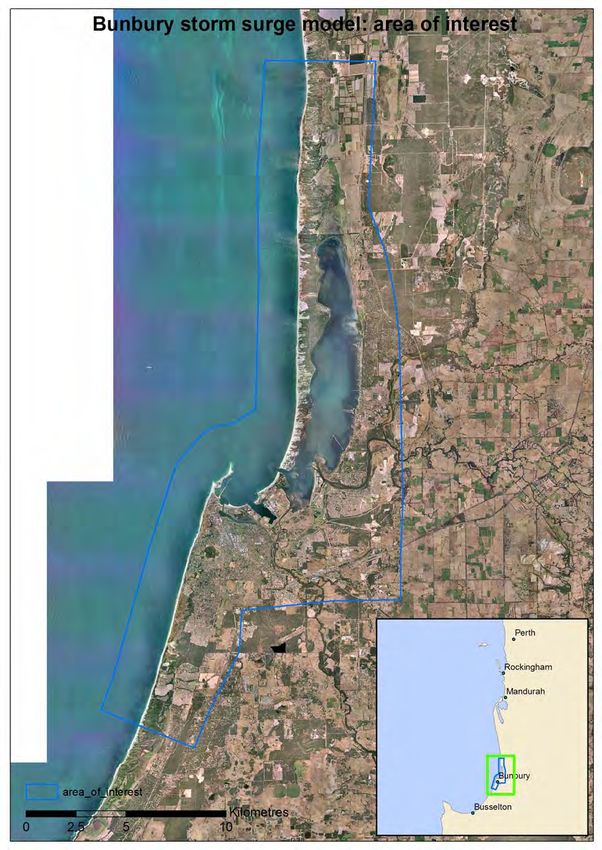
have been inundated in the past. The extent of interest was discussed with DoP and DoT
officers at a meeting in Fremantle in October 2009 and shown in Figure 4.
18
November 2010Professional Opinion 2010/04 – Storm surge modelling for Bunbury, Western Australia
Figure 4: Area of interest for storm surge inundation.
As mentioned earlier, ANUGA uses an unstructured triangular mesh to underpin the
computations. A minimum mesh resolution is specified to describe the mesh, defined as
the maximum allowable area of a triangle. In order to accurately capture the wave
19
November 2010Professional Opinion 2010/04 – Storm surge modelling for Bunbury, Western Australia
dynamics, the model is built with a series of embedded internal polygons that have varying
minimum mesh resolution. These polygons are constructed in such a way so that the
polygon surrounding the community has the finest minimum mesh resolution. Subsequent
polygons are constructed in a nested fashion. Figure 5 shows the polygons used in
building the ANUGA inundation model. Note that the minimum resolution of the mesh is
smallest within the area of interest, with a maximum allowable area of 200 m2
(approximately 20 m triangle side length 4 ). The resolution within the subsequent polygons
decreases away from the community, where the wave dynamics allow a coarser mesh. The
model configuration specifies the maximum allowable triangle area, and hence the
minimum mesh resolution for each region in the model.
Figure 5: ANUGA refinement for Bunbury inundation model.
The model simulation is initiated at midday 4 March, 1978 with the initial sea level at mean
sea level. Astronomical tidal forces are implicitly captured by the ANUGA simulation via
the coupling with the GEMS model. The time varying boundary condition, derived from
GEMS, and used to drive the ANUGA simulation, captures the change in ocean
momentum and surface elevation due to the cumulative effect of the astronomical tide and
the storm related processes. The total model simulation time is two days. This time was
chosen to allow the full dynamics of the storm surge event to reach the area of interest and
cover the major effects of the complex interaction with the nearshore environment.
The inundation model estimates the time varying nature of the wave amplitude and flow
speed for the total simulation time. The maximum inundation depth and maximum flow
speed maps are therefore the maximum wave amplitude and flow speed over the entire
simulation time. It is also possible to determine how the water depth varies with time at
4Note, most of the triangles will have an area much smaller than 200 m2 meaning that the
model resolution is much less than 20m.
20
November 2010Professional Opinion 2010/04 – Storm surge modelling for Bunbury, Western Australia
selected observation points (synthetic ‘water level gauges’) within the model area. This
data can be used to determine the number of peak surges within the storm event as well as
the time for the water to recede at specific locations. In conjunction with the maximum
inundation depth maps, these outputs can be used to inform planning and preparation
activities. In the current model a gauge is co-located with the actual tide gauge at Bunbury,
primarily for the purpose of validating the model against the historical tide gauge record
for TC Alby recorded at Bunbury. Similar data has been generated for a series of locations
as shown in Figure 6.
Figure 6: Synthetic gauges supplied by DoP.
In addition to the actual tide gauge at Bunbury, the model outputs can be compared to the
high water observations shown in Appendix C.
Step 3 - investigate the impact of a storm surge gate:
The Bunbury Storm Surge Barrier is located at the Western end of the Leschenault Inlet.
The barrier was constructed in 1980, as part of coastal protection works aimed to prevent
seawater inundation of low lying areas of the City of Bunbury. The barrier is operated
during periods of extreme high ocean water levels, isolating Leschenault Inlet from the
Indian Ocean. The barrier consists of a pair of steel gates, between two sheet pile bulwarks,
which are opened and closed using hydraulic machinery.
Operation of the barrier is intended to prevent seawater inundation of the low-lying areas
of Bunbury. This operation is complicated by the stormwater drainage of the City of
Bunbury, a portion of which drains into the lower Leschenault Inlet. The ocean water level
at which the barrier is closed and the duration of closure determines the capacity of the
Inlet to hold stormwater runoff, before the embankment around the Inlet is overtopped.
High ocean water levels are caused by a combination of tidal conditions, oceanographic
conditions and atmospheric factors such as barometric pressure, onshore wind conditions
21
November 2010Professional Opinion 2010/04 – Storm surge modelling for Bunbury, Western Australia
and wave forcing. Elevated water levels generally occur in conjunction with storm events,
due to low pressure and strong winds. Review of the processes affecting ocean water levels
indicated that significant water levels may be generated by typical winter storms in
conjunction with high astronomic tides. Analysis of the drainage into the Inlet determined
the recommended ocean water level at which the storm surge barrier should be closed. This
takes into account the possibility of extreme rainfall and ocean water levels, for a sustained
period.
Whilst the Storm Surge Barrier has been designed to provide protection of Bunbury against
ocean flooding, it is integrally linked to the drainage of Bunbury CBD. During closure, all
stormwater runoff from the CBD will be captured within the Inlet. Closure of the Barrier
for an extended period of time provides the potential for backing up of the CBD drainage
system and runoff flooding. When closing the barrier to prevent ocean flooding, it is
appropriate to ensure that the capacity of the Inlet to receive runoff is maximised.
Step 4 - investigate the impact of various climate change scenarios:
The effects of climate change are incorporated in two key ways. Firstly, a range of sea-level
rise scenarios can be applied to GCOM2D and ANUGA as changes to the initial still water
level. Secondly, elevation changes in the coastal zone as a result of increased storminess
and sea level rise can then be incorporated in GCOM2D and ANUGA to estimate the
inundation for a future landscape.
The University of Sydney undertook a quantitative coastal-recession risk assessment in the
Busselton-Rockingham coastal cell using the sediment-budget model described in
Appendix B. For the purpose of the study this sediment cell was subdivided into seven
littoral sub cells distinguished on environmental conditions, e.g. sediment budget, dune
volumes and evolution and shoreline controls, in order to obtain the optimal balance
between precessions of the sediment budget assessment of the reliability of results.
22
November 2010Professional Opinion 2010/04 – Storm surge modelling for Bunbury, Western Australia
Figure 7: Sub cells within the Busselton‐Rockingham coastal cell..
Recession is defined as the distance that the present day face the frontal dune or its counter
part recede inland (negative recession = accretion). Computed estimates for future
recession distances are expressed in terms of their probability of occurrence: i.e. risk.
Comparative risk is higher for cases in which risk curves plot further to the right in the risk
diagrams. Conversely, cases in which curves plot the further to the left entail lower overall
risk. This study reports the recession figure with a probability of occurrence p = 0.10, i.e.
there is a 10% chance that the extent of coastal recession will be greater than what has been
modelled.
By 2030 despite modest sea level rise, the Bunbury sub cell will have started to recede,
although the risk is slightly lower than the other cells due to larger dune volumes and
smaller potential sediment losses to estuaries. By 2100 there is significant shoreline
recession in the Bunbury sub cell (Figure 8 and Figure 9), with recession in the range of 400
- 500m predicted by the model.
23
November 2010Professional Opinion 2010/04 – Storm surge modelling for Bunbury, Western Australia
Figure 8: Bunbury – Stratham Golf Course sub cell (#5) coastal recession risk forecast with time in the future.
Figure 9: Extent of potential recession for Bunbury by 2100. The potential costal recession distances are represented
as gradated probabilities from a minimum recession of approximately 150m to a maximum extent of up to 450m.
NB: the influence of the underlying geology on the extent of potential recession.
24
November 2010Professional Opinion 2010/04 – Storm surge modelling for Bunbury, Western Australia
5. Results
This report considers six possible storm surge scenarios:
1. Simulation of inundation arising from the 1978 Tropical Cyclone (TC) Alby event
(baseline event)
2. Simulation of inundation resulting from a ‘worst case’ track given the current
surface model and a no sea level rise
3. Simulation of inundation resulting from a ‘worst case’ track using the current
surface model and a 0.4m sea level rise
4. Simulation of inundation resulting from a ‘worst case’ track using the current
surface model and a 0.9m sea level rise
5. Simulation of inundation resulting from a ‘worst case’ track using the current
surface model and a 1.1m sea level rise
6. Simulation of inundation resulting from a ‘worst case’ track given a potential future
surface model and a 1.1m sea level rise
The maximum inundation depth (in metres) estimated by the method are shown in Figure
10 to Figure 19. The figures show the six cases with Cases 2-5 shown with the gate open
and closed.
Figure 10: Maximum inundation depth (m) for Case 1 – gate open
25
November 2010Professional Opinion 2010/04 – Storm surge modelling for Bunbury, Western Australia
Figure 11: Maximum inundation depth (m) for Case 2 – gate closed
Figure 12: Maximum inundation depth (m) for Case 2 – gate open
26
November 2010Professional Opinion 2010/04 – Storm surge modelling for Bunbury, Western Australia
Figure 13: Maximum inundation depth (m) for Case 3 – gate closed
Figure 14: Maximum inundation depth (m) for Case 3 – gate open
27
November 2010Professional Opinion 2010/04 – Storm surge modelling for Bunbury, Western Australia
Figure 15: Maximum inundation depth (m) for Case 4 – gate closed
Figure 16: Maximum inundation depth (m) for Case 4 – gate open
28
November 2010Professional Opinion 2010/04 – Storm surge modelling for Bunbury, Western Australia
Figure 17: Maximum inundation depth (m) for Case 5 – gate closed
Figure 18: Maximum inundation depth (m) for Case 5 – gate open
29
November 2010Professional Opinion 2010/04 – Storm surge modelling for Bunbury, Western Australia
Figure 19: Maximum inundation depth (m) for Case 6
A time series of the water depth estimated at the locations supplied by DoP are shown in
Figure 20 and Figure 21. These results are shown for Case 5 only.
30
November 2010Professional Opinion 2010/04 – Storm surge modelling for Bunbury, Western Australia
Figure 20: Time series at two of the synthetic tide gauges supplied by DoP (DoP_2 and DoP_4) for Case 5 – gate
open.
31
November 2010Professional Opinion 2010/04 – Storm surge modelling for Bunbury, Western Australia
Figure 21: Time series at two of the synthetic tide gauges supplied by DoP (DoP_2 and DoP_4) for Case 5 – gate
closed.
These results clearly show that the storm surge gate acts to reduce the depth of inundation.
These results also show that the inundation drains more quickly in the area surrounding
DoP_4 than DoP_2. This may be useful for recovery purposes.
Time series at offshore synthetic gauges can be used in understanding the dynamics of the
storm surge inundation process. Figure 22 shows two example synthetic tide gauges that
will be used to illustrate the differences in the resultant sea surface elevation from the two
storm events modelled here. Figure 23 shows a typical waveform from the 1978 TC Alby
32
November 2010Professional Opinion 2010/04 – Storm surge modelling for Bunbury, Western Australia
event and Figure 24 shows a typical waveform from the ‘worst case’ track and timing
event.
Figure 22: Offshore synthetic tide gauges.
Figure 23: Time series at one of the synthetic offshore tide gauges (B) for Case 1.
33
November 2010Professional Opinion 2010/04 – Storm surge modelling for Bunbury, Western Australia
Figure 24: Time series at one of the synthetic offshore tide gauges (B) for Case 2.
6. Discussion
The inundation extent predicted by the modelling framework used here when applied to
Case 1 is small in comparison to the observations of inundation recorded in 1978 (see
Appendix C). However the storm surge model compares well with the tide gauge reading
at Bunbury (see Figure 3). Since 1978 there have been changes to the surface model, both
offshore and onshore which can have significant impacts to the predicted inundation. The
simulations performed use current topography and elevation data which may not capture
the true topography that existed during the 1978 event. The current elevation data is
characterised by large sand dunes which likely prevented the simulation from predicting
the severe inundation observed during TC Alby. Case 6 illustrates how a change in the
shape of the coast line (in this case caused by sea level rise) can have significant impact on
the predicted inundation. Although sea level rise has been much smaller since 1978 it is
possible that long term sediment transport processes have caused changes to the coastline
elevation that have similarly affected inundation extent. The current coastline topography
may naturally buffer against storm surge inundation better than the coastline topography
in 1978.
Any inaccuracy in the onshore and offshore topography has much less impact on the
predicted sea surface elevation at the tide gauge. Inundation extent is much less sensitive to
small perturbations in the coastal topography. The momentum of the currents generated by
storm surges is considerably smaller than those caused by tsunami, for example.
Consequently the effect of reflections and diffractions of waves and thus local topography
is less significant in storm surge events. The degree to which the estimates are sensitive to
topographical changes could be investigated further.
34
November 2010Professional Opinion 2010/04 – Storm surge modelling for Bunbury, Western Australia
The model result that is closer to the observed inundation in 1978 is somewhere between
Case 3 and Case 4 (worst case track and timing TC Alby with 0.4m and 0.9m SLR
respectively). This suggests that the model is sensitive to the inputs of initial sea level and
event, as well as the surface model, as described above. As expected, the inundation extent
increases as the SLR increases.
The results confirm the effect of the storm surge gate, that is, there is increased inundation
when the gate is open (compare Figure 17 and Figure 18, and Figure 20 and Figure 21, for
example).
As mentioned earlier, GCOM2D can also model inundation. Figure 25 and Figure 26 show
the modelled inundation developed by GEMS using GCOM2D for Case 1 and Case 2
respectively. A comparison of Figure 10 and Figure 11 shows that the integrated method
(GCOM2D and ANUGA) compares well with the GCOM2D results. This indicates that
with the provision of boundary data (the storm surge event), we have increased confidence
in ANUGA being able to successfully determine storm surge inundation.
Figure 25: Maximum inundation depth (m) for Case 1 as modelled by GEMS.
35
November 2010Professional Opinion 2010/04 – Storm surge modelling for Bunbury, Western Australia
Figure 26: Maximum inundation depth (m) for Case 2 as modelled by GEMS.
The key observations of the modelled outputs are:
The foredunes on the open coast play a significant role in protecting the City of
Bunbury from storm surge inundation for all cases considered.
These foredunes continue to exist in the potential future surface model; however
they are translated in distance (landward) and have increased in height.
The potential future surface model developed here assumes that no other coastal
engineering processes have occurred.
The storm surge gate acts to reduce the inundation extent for the 1978 TC Alby
event and the worst case track and timing TC Alby event for the current surface
model.
The modelled inundation resulting from the integrated GCOM2D and ANUGA
method described here compares well with inundation from GCOM2D.
The model outputs compare well with the observed tide gauge reading at Bunbury.
The model comparison with observed inundation from 1978 lies between Case 3
and Case 4 (i.e. between SLR of 0.4m and 0.9m).
6.1. Model Issues and Limitations
Some of the key approximations and limitations are summarised below. It is important to
appreciate that the model results described here are indicative and should not be relied
upon solely for making any decision.
It must be emphasised that the developed capability can only be applied for the City of
Bunbury for TC Alby and worst track TC Alby, at this stage. This is because the open ocean
36
November 2010Professional Opinion 2010/04 – Storm surge modelling for Bunbury, Western Australia
storm surge model data is only currently available for these two events for the City of
Bunbury. Geoscience Australia is investigating the possibility of developing a national
storm tide database to enable a range of possible events under different climate change
scenarios to be modelled using this approach. Such a database would make it possible to
estimate inundation at selected locations when suitable elevation data is available.
The model outputs contained in this document are based on two storm events and do not
represent all possible storm events. Therefore, the results can be used as an indicative
guide only to possible future storms. A suite of events for a range of tracks, intensities and
return periods would be required to develop a deeper understanding of the storm surge
impact and risk.
The combined hazard of storm surge inundation and riverine flooding has not been
modelled. Coincident rainfall was not applied for this phase of the project as it was not
applicable for TC Alby. However, flooding scenarios can be incorporated into ANUGA to
investigate the effect of the combination of the two hazards.
ANUGA does not yet incorporate wave setup. Wave setup is a super-elevation of the mean
water surface over normal ‘still’ water level due to wave action alone. GCOM2D
incorporates this feature and thus the wave dynamics have been propagated close to the
coast. Continued development of ANUGA will require wave setup to be incorporated.
Neglecting wave setup within the ANUGA domain will likely cause a slight under-
prediction of inundation extent. The effect of the wave setup is problem dependent and
will be investigated in future studies. By restricting the computational domain employed
by ANUGA to the 10m depth contour we believe that the integrated effect of wave setup
over the small computation domain is small and that the majority of the effects of wave
setup are captured by GCOM2D.
ANUGA does not model the storm itself and the resultant wind effect on inundation. At
this stage, ANUGA must be integrated with an open ocean storm surge model as shown in
Figure 1. It is expected that there will be little impact to the estimated inundation as
modelled here by not incorporating wind in ANUGA. Wind shear stress is usually very
small but its integrated effect over a large body of water can be large (Dean and Dalrymple
1991).
Neglecting the effects of wind shear and barometric pressure will typically tend to
underestimate the inundation extent. By restricting the computational domain employed
by ANUGA to the 10m depth contour we hope to keep the integrated effect of wind and
pressure small. This project will investigate the impact on model outputs by varying the
point at which the integration occurs. This will inform the continued development of
ANUGA.
We must note that the elevation data (bathymetric as well as topographic) used for these
models has been the best available. This project is one of the first to use the high-resolution
data acquired by the WA State Government and its coverage and accuracy is excellent.
Some bathymetry data, as shown in Figure 27, has been captured using other methods that
give coarser resolution to that of LiDAR. The predicted inundation depth and extent is
sensitive to variations in elevation data and therefore the model outputs should be used
with caution. It is difficult to estimate the variation in model results based on the accuracy
of the elevation data without simulating many more models or incorporating local
37
November 2010You can also read


