Single-molecule visualization of fast polymerase turnover in the bacterial replisome
←
→
Page content transcription
If your browser does not render page correctly, please read the page content below
RESEARCH ARTICLE

                                   Single-molecule visualization of fast
                                   polymerase turnover in the bacterial
                                   replisome
                                   Jacob S Lewis1,2†, Lisanne M Spenkelink1,2,3†, Slobodan Jergic1,2,
                                   Elizabeth A Wood4, Enrico Monachino1,2,3, Nicholas P Horan1,2,
                                   Karl E Duderstadt3,5,6, Michael M Cox4, Andrew Robinson1,2, Nicholas E Dixon1,2*,
                                   Antoine M van Oijen1,2*
                                   1
                                    Centre for Medical and Molecular Bioscience, University of Wollongong,
                                   Wollongong, Australia; 2Illawarra Health and Medical Research Institute, University
                                   of Wollongong, Wollongong, Australia; 3Zernike Institute for Advanced Materials,
                                   University of Groningen, Groningen, The Netherlands; 4Department of
                                   Biochemistry, University of Wisconsin-Madison, Madison, United States; 5Max
                                   Planck Institute of Biochemistry, Martinsried, Germany; 6Physik Department,
                                   Technishche Universität München, Garching, Germany

                                   Abstract The Escherichia coli DNA replication machinery has been used as a road map to
                                   uncover design rules that enable DNA duplication with high efficiency and fidelity. Although the
                                   enzymatic activities of the replicative DNA Pol III are well understood, its dynamics within the
                                   replisome are not. Here, we test the accepted view that the Pol III holoenzyme remains stably
                                   associated within the replisome. We use in vitro single-molecule assays with fluorescently labeled
                                   polymerases to demonstrate that the Pol III* complex (holoenzyme lacking the b2 sliding clamp), is
*For correspondence: nickd@        rapidly exchanged during processive DNA replication. Nevertheless, the replisome is highly
uow.edu.au (NED); vanoijen@uow.    resistant to dilution in the absence of Pol III* in solution. We further show similar exchange in live
edu.au (AMvO)                      cells containing labeled clamp loader and polymerase. These observations suggest a concentration-
†                                  dependent exchange mechanism providing a balance between stability and plasticity, facilitating
 These authors contributed
                                   replacement of replisomal components dependent on their availability in the environment.
equally to this work
                                   DOI: 10.7554/eLife.23932.001
Competing interest: See
page 15

Funding: See page 15
                                   Introduction
Received: 06 December 2016         The Escherichia coli replisome requires participation of 13 different proteins. Ten of them form
Accepted: 20 April 2017            the DNA polymerase III (Pol III) holoenzyme (HE), which is arranged into three functionally dis-
Published: 22 April 2017           tinct and stably bound subassemblies (Figure 1A): aeq forms the Pol III core that has DNA poly-
Reviewing editor: Taekjip Ha,      merase activity; b2 is the sliding clamp needed for stable association with the primer–template
Johns Hopkins University School    DNA; and tng (3–n)dd’yc (where n = 2 or 3 in the HE) is the clamp loader complex (CLC) that
of Medicine, United States         loads b2 onto DNA and is the central organizer of the replisome (Robinson and van Oijen,
                                   2013; Duderstadt et al., 2014; Lewis et al., 2016). The CLC interacts with two or three Pol III
   Copyright Lewis et al. This
                                   cores via the a–t interaction, forming stable complexes termed Pol III* (i.e. HE lacking only the
article is distributed under the
                                   sliding clamp). Pol III* ensures the organization of the cores needed for coordinated DNA syn-
terms of the Creative Commons
Attribution License, which         thesis on the two template strands (Wu et al., 1992; Onrust et al., 1995) and is essential for
permits unrestricted use and       cell survival (Blinkova et al., 1993). Although physical coupling of leading and lagging strand
redistribution provided that the   cores in one HE particle requires the lagging strand polymerase to undergo cycles of release
original author and source are     and rebinding from one Okazaki fragment to the next, the molecular mechanisms underlying its
credited.                          cycling are still debated (Dohrmann et al., 2011). There is, however, consensus that Pol III is

Lewis et al. eLife 2017;6:e23932. DOI: 10.7554/eLife.23932                                                                         1 of 17
Research article                                                                                   Biophysics and Structural Biology

                                   reused rather than replaced for successive Okazaki fragment synthesis (Tanner et al., 2008,
                                   2009, 2011; Yao et al., 2009; Georgescu et al., 2011). Thus, the replisome is believed to be a
                                   highly stable entity.
                                       The key observations that support efficient Pol III recycling derive from in vitro replication assays
                                   in the absence of free polymerase (Yao et al., 2009; Tanner et al., 2011; Georgescu et al., 2011)
                                   and are consistent with the high stability of the a–t interaction that binds cores to the CLC (KD = 0.3
                                   nM; t1/2 = 29 min in 300 mM NaCl) (Jergic et al., 2007). Nevertheless, the introduction of high con-
                                   centrations of catalytically dead Pol III* (still able to bind primed DNA) inhibits ongoing replication
                                   (Yuan et al., 2016). Reconciling these different observations, we here demonstrate the presence of
                                   a novel exchange mechanism that allows Pol III* to remain stably associated with the replisome
                                   under conditions of high dilution, yet facilitates rapid exchange at nanomolar concentrations.

                                   Results
                                   In vitro single-molecule observation of Pol III dynamics
                                   We use a single-molecule approach to directly visualize the dynamics of Pol III complexes at the rep-
                                   lication fork (Mok and Marians, 1987; Tanner et al., 2009). A rolling-circle DNA amplification
                                   scheme is used to observe highly processive DNA synthesis in real time, while imaging Pol III com-
                                   plexes entering and leaving the replisome. Using the minimal set of 12 proteins required to support
                                   coupled leading and lagging strand synthesis, we allow active replisomes to self assemble onto pre-
                                   formed replication forks (Tanner et al., 2008, 2009). A 5’-flap within a 7.2 kb double-stranded (ds)
                                   circular DNA substrate is anchored to the surface of a microfluidic flow cell and replication is initi-
                                   ated by introducing a laminar flow of buffer with the components required for coupled leading and
                                   lagging strand synthesis (Figure 1B). As replication proceeds, the newly synthesized leading strand
                                   becomes part of the circle and later acts as a template for lagging strand synthesis. With the lagging
                                   strand attached to the surface and the continuously growing DNA product stretched in the buffer
                                   flow, the dsDNA circle moves away from the anchor point. Replication is visualized by real-time
                                   near-TIRF fluorescence imaging of stained dsDNA (Figure 2A, Figure 2—figure supplement 1).
                                   This strategy allows quantification of the rates of individual replisomes and their processivities
                                   (Figure 2B).
                                       We fluorescently labeled the Pol III a subunit following its fusion to a SNAP tag (Figure 2—figure
                                   supplement 2) and covalently coupled it separately in >80% yields to red and green fluorophores.
                                   Fluorescently labeled Pol III cores were reconstituted from individual SNAP-a, e and q subunits and
                                   isolated chromatographically (Tanner et al., 2008), then assembled into single-color Pol III*s in situ
                                   with separately isolated t3-CLC (Tanner et al., 2008). The labeled Pol III*s were active in coupled
                                   DNA replication, producing Okazaki fragments of similar sizes to wild-type polymerase (Figure 2—
                                   figure supplement 3).
                                       A kymograph (Figure 2C) shows the fluorescence of the red Pol III* during rolling-circle replica-
                                   tion; it supports replication at rates similar to the untagged wild-type enzyme (Figure 2D). Simulta-
                                   neous imaging of the stained DNA and red Pol III* shows that the polymerase spot is located at the
                                   tip of the growing DNA, confirming that the labeled Pol III is a functional component of reconsti-
                                   tuted replisomes (Figure 2—figure supplement 4). We also observe Pol III that remains bound to
                                   the DNA on the lagging strand behind the replication fork, evident as horizontal lines in Figure 2C.
                                   We reasoned that these correspond to polymerases bound to the 3’-termini of Okazaki fragments.
                                   We repeated the experiment in the presence of Pol I and/or DNA ligase; Pol I replaces RNA primers
                                   with DNA and ligase seals the remaining nick. In the presence of Pol I (with or without ligase), Pol III
                                   binding behind the replisome is no longer observed (Figure 2E), consistent with Pol I efficiently dis-
                                   placing Pol III during Okazaki fragment maturation.
                                       Surprisingly, the fluorescent Pol III at the growing tip of the rolling circle is highly resistant to pho-
                                   tobleaching. Its fluorescence in the replisome has a much longer lifetime compared to that of
                                   labeled Pol III cores immobilized on a surface and subjected to the same excitation intensity
                                   (Figure 2F). Since the experiments in Figure 2 are performed with 6.7 nM Pol III* in solution, this
                                   observation suggests that the polymerase exchanges into the replisome from solution to replace
                                   photobleached Pol III.

Lewis et al. eLife 2017;6:e23932. DOI: 10.7554/eLife.23932                                                                                2 of 17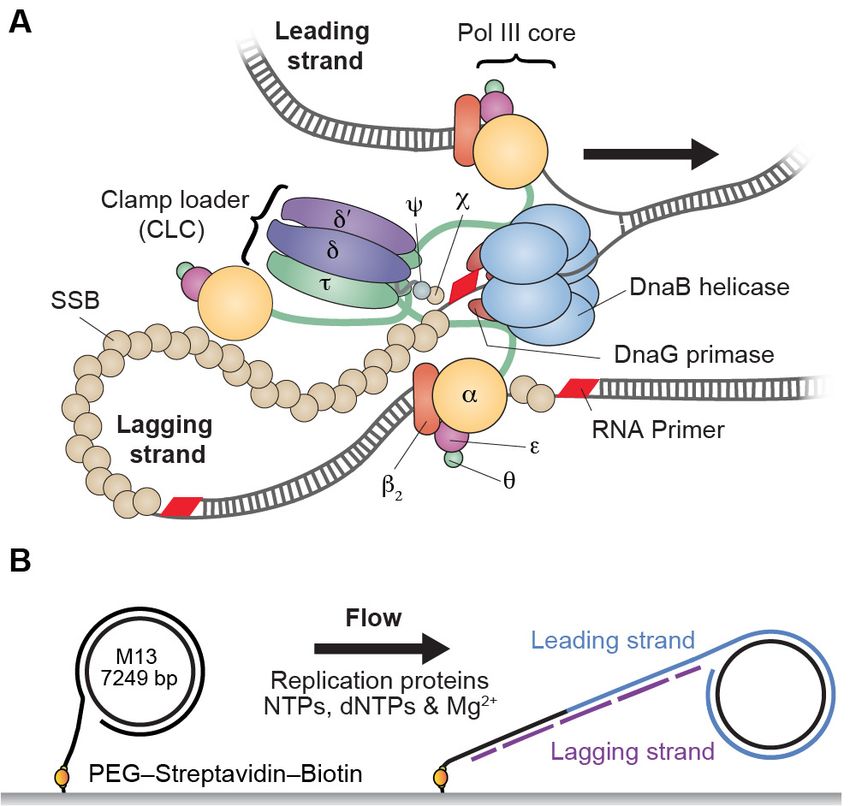
Research article                                                                                        Biophysics and Structural Biology

                                   Figure 1. Single-molecule rolling-circle replication assay. (A) Canonical view of the organization of the E. coli
                                   replication fork. The DnaB helicase encircles the lagging strand, facilitates unwinding of dsDNA through ATP
                                   hydrolysis, and recruits DnaG primase for synthesis of RNA primers that initiate synthesis of 1–2 kb Okazaki
                                   fragments on the lagging strand. The extruded single-stranded (ss) DNA is protected by ssDNA-binding protein,
                                   SSB. The Pol III holoenzyme (HE) uses the ssDNA of both strands as a template for coupled, simultaneous
                                   synthesis of a pair of new DNA duplex molecules. The b2 sliding clamp confers high processivity on the Pol III HE
                                   by tethering the aeq Pol III core onto the DNA. The clamp loader complex (CLC) assembles the b2 clamp onto
                                   RNA primer junctions. Up to three Pol III cores interact with the CLC through its t subunits to form the Pol III*
                                   complex, and the t subunits also interact with DnaB, thus coupling the Pol III HE to the helicase. (B) Schematic
                                   representation of the experimental design. 5’-Biotinylated M13 DNA is coupled to the passivated surface of a
                                   microfluidic flow cell through a streptavidin linkage. Addition of the E. coli replication proteins and nucleotides
                                   initiates DNA synthesis. The DNA products are elongated hydrodynamically by flow, labeled with intercalating
                                   DNA stain, and visualized using fluorescence microscopy (Figure 1—figure supplement 1).
                                   DOI: 10.7554/eLife.23932.002
                                   The following figure supplement is available for figure 1:
                                   Figure supplement 1. Schematic overview of the single-molecule fluorescence microscope.
                                   DOI: 10.7554/eLife.23932.003

                                   Exchange of Pol III* complexes in vitro
                                   To characterize the dynamic behavior of Pol III at the fork and directly visualize its exchange in real
                                   time, we used mixtures of red and green Pol III*s. To demonstrate that green Pol III cores in a Pol
                                   III* complex do not exchange with the red ones from another Pol III*, we combined them in a 1:1
                                   ratio for 1 hr at 37˚C (Figure 3A), then imaged the mixture on the surface of a coverslip at the sin-
                                   gle-molecule level (Figure 3B, Figure 3—figure supplement 1). Consistent with the stable interac-
                                   tion between a in the core and t in the CLC, exchange of Pol III cores was not observed. It remained
                                   possible, however, that the nature and strength of the a–t interaction is different at a step in lagging
                                   strand replication that involves exchange of Pol III cores within the Pol III* complex (Leu et al.,
                                   2003). To test this possibility, we mixed pre-assembled red and green Pol III* complexes in a 1:1
                                   ratio and used them in a bulk rolling-circle replication experiment in an eightfold molar excess over
                                   5’-biotinylated flap-primed dsDNA template. Under these conditions, most Pol III*s will have partici-
                                   pated in replication at the fork, as long leading strand and shorter lagging strand products are gen-
                                   erated (Figure 3—figure supplement 2). Next, the newly synthesized DNA was removed from
                                   proteins by its immobilization on streptavidin beads, and subsequent single-molecule imaging of the
                                   released protein fraction on the surface of a coverslip showed no co-localization of red and green

Lewis et al. eLife 2017;6:e23932. DOI: 10.7554/eLife.23932                                                                                      3 of 17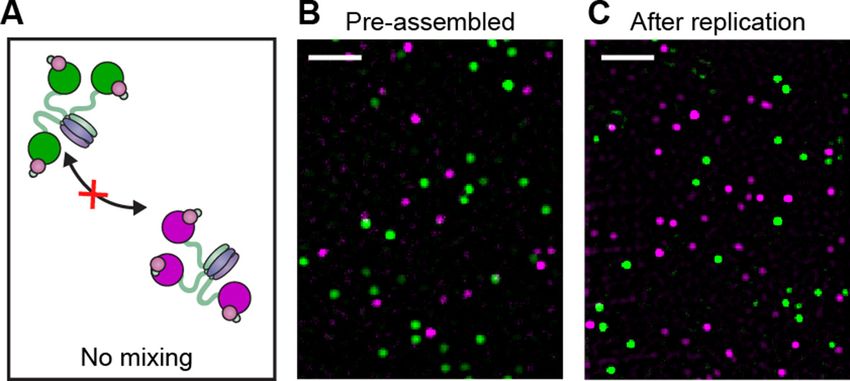
Research article                                                                                                Biophysics and Structural Biology

Figure 2. Real-time fluorescence imaging of coupled DNA replication. (A) Kymograph of an individual DNA molecule undergoing coupled leading and
lagging strand replication. The gray scale indicates the fluorescence intensity of stained DNA. (B) Single-molecule trajectory obtained from the
kymograph in (A), used to quantify the rates and processivities of replication events. The magenta box represents an example line segment used to
determine rates. (C) Kymograph of the dynamics of red-labeled Pol IIIs on an individual DNA molecule. The Pol III moves with the replisome in the
direction of flow as it elongates the DNA, visible as a bright magenta spot moving away from the surface anchor point. Additional Pol IIIs are left
behind the moving replisome, seen as horizontal lines on the kymograph. (D) Histograms of the rate of replication for wild-type Pol III (492 ± 23 bp/s)
and red Pol III (561 ± 27 bp/s) fit to Gaussian distributions. (E) Kymograph of the distribution of red Pol III on an individual DNA molecule in the
presence of 150 nM Pol I and 100 nM DNA ligase. Prolonged Pol III spots behind the replisome are no longer observed due to the action of Pol I in
Okazaki fragment processing. (F) Fluorescence intensity as a function of time of individual red Pol IIIs immobilized on the surface of a coverslip (lower
trace; black line is an exponential fit with lifetime = 14.1 ± 0.4 s), and of the replisomal spot in (C) (upper trace). The fluorescence lifetime of red Pol III at
the replisome is much longer than the photobleaching lifetime of the dye. The errors represent the standard errors of the mean.
DOI: 10.7554/eLife.23932.004
The following figure supplements are available for figure 2:
Figure supplement 1. Representative field of view of SYTOX orange-stained dsDNA from the single-molecule rolling-circle DNA replication assay.
DOI: 10.7554/eLife.23932.005
Figure supplement 2. Separation of proteolytic fragments of SNAP-a from full-length SNAP-a.
DOI: 10.7554/eLife.23932.006
Figure supplement 3. Comparison of activities of wild-type and SNAP-labeled Pol III cores.
DOI: 10.7554/eLife.23932.007
Figure supplement 4. Representative kymograph of simultaneous staining of double-stranded DNA and fluorescence imaging of Pol III in real time.
DOI: 10.7554/eLife.23932.008

                                       Pol III cores (Figure 3C). This result confirms that the functional unit exchanging at the replication
                                       fork is the entire Pol III* complex; the interaction between the t subunit of the CLC and a of Pol III
                                       must remain intact during DNA replication, thus challenging the previously suggested model of a t
                                       processivity switch on the lagging strand (Leu et al., 2003).
                                          We visualized exchange of Pol III* at the replication fork by measuring the fluorescence intensity
                                       at the replisome spot as a function of time using 1:1 mixtures of red and green Pol III*s (Figure 4A,
                                       B, Figure 4—figure supplement 1). At a total Pol III* concentration of 6.7 nM, the replisomal spot
                                       exhibits fast dynamics displaying both colors (Video 1), while at a lower concentration of 0.3 nM,

Lewis et al. eLife 2017;6:e23932. DOI: 10.7554/eLife.23932                                                                                                 4 of 17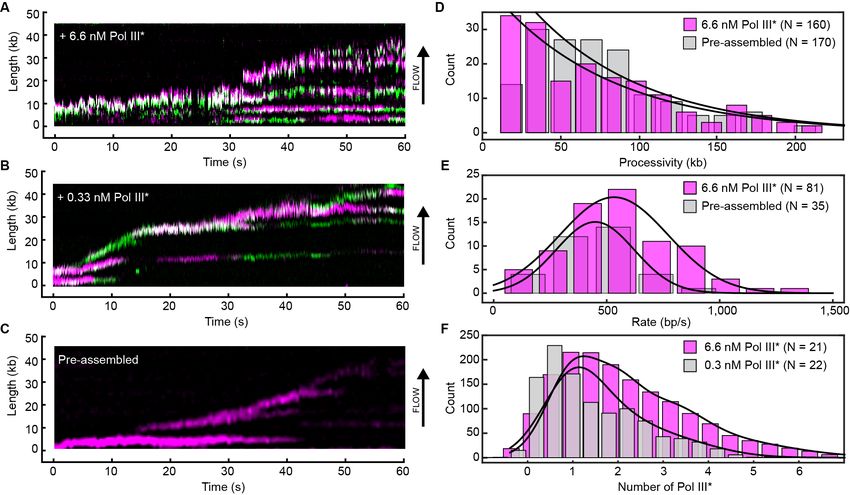
Research article                                                                                        Biophysics and Structural Biology

                                   Figure 3. Pre-assembled Pol III* complexes do not exchange Pol III core. (A) Red and green Pol III* are separately
                                   pre-assembled by treatment at 37˚C for 15 min (30 nM Pol III core and 10 nM t3-CLC). These are then mixed in
                                   equal ratios and kept at 37˚C for 1 hr prior to dilution to 6 pM Pol III* for imaging. (B) Red Pol III* complexes and
                                   green Pol III* complexes do not co-localize to produce any white spots as seen in Figure 3—figure supplement
                                   1, demonstrating the a–t interaction within the Pol III* complex remains intact for the duration of the DNA
                                   replication assays. (C) Pre-assembled red and green Pol III* complexes that have participated in DNA replication
                                   (at 3.3 nM of each) do not co-localize, demonstrating that the Pol III cores within a Pol III* do not exchange with
                                   cores from other Pol III*s at the replication fork during active DNA synthesis. White scale bars represent 5 mm.
                                   DOI: 10.7554/eLife.23932.009
                                   The following figure supplements are available for figure 3:
                                   Figure supplement 1. Pol III* complexes of mixed Pol III core composition (1:1) show co-localization.
                                   DOI: 10.7554/eLife.23932.010
                                   Figure supplement 2. Alkaline gel showing leading- and lagging-strand products using pre-assembled red and
                                   green Pol III*s.
                                   DOI: 10.7554/eLife.23932.011

                                   the dynamics appear slower and distinct exchange events are visible (Video 2). The longer persis-
                                   tence of a single color at the lower concentration demonstrates that Pol III* exchange is concentra-
                                   tion dependent. Given that Pol III* remains intact on time scales much longer than the duration of
                                   our experiment, these observations can only be explained by wholesale exchange of Pol III* at the
                                   replication fork.
                                      Our demonstration of rapid exchange of entire Pol III*s, however, seems difficult to reconcile with
                                   observations that both leading and lagging strand Pol III cores remain stably associated during cou-
                                   pled DNA replication (Yao et al., 2009; Tanner et al., 2011; Georgescu et al., 2011). Those studies
                                   used assays in which replisomes were assembled, replication initiated, and the reactions rapidly
                                   diluted to measure the stability of synthesizing replisomes on DNA. To place our observations of
                                   dynamic exchange of Pol III* in context of the previous work, we carried out single-molecule pre-
                                   assembly replication assays (Yao et al., 2009; Tanner et al., 2011) using the red Pol III*. In this
                                   experiment, the replisome is pre-assembled onto the rolling-circle template in solution. Subse-
                                   quently, the template is attached to the surface of a flow cell, which is then washed to remove all
                                   unbound proteins. Replication is initiated by introduction of a replication solution that omits Pol III*
                                   and helicase. Since the absence of free Pol III* in solution makes polymerase exchange impossible,
                                   we hypothesized that Pol III would be recycled within the replisome, enabling its sustained participa-
                                   tion in processive DNA replication. These conditions indeed support highly processive DNA replica-
                                   tion (Figure 4C), with synthesis rates and processivities identical to a situation with Pol III* in solution
                                   and consistent with values reported previously (Mok and Marians, 1987; McInerney et al., 2007;
                                   Tanner et al., 2009; Yao et al., 2009) (Figure 4D,E). Further, we observed photobleaching without
                                   recovery, consistent with the original, pre-assembled Pol III* remaining stably associated within the
                                   replisome. As further confirmation of the robustness of the pre-assembled replisome in the absence
                                   of competing polymerases and the easy displacement of Pol III* upon challenge, we initiate replica-
                                   tion by pre-assembly of replisomes, normally supporting highly processive synthesis, and challenge
                                   them with Pol III core. The observation of a sharp reduction in processivity is consistent with the

Lewis et al. eLife 2017;6:e23932. DOI: 10.7554/eLife.23932                                                                                       5 of 17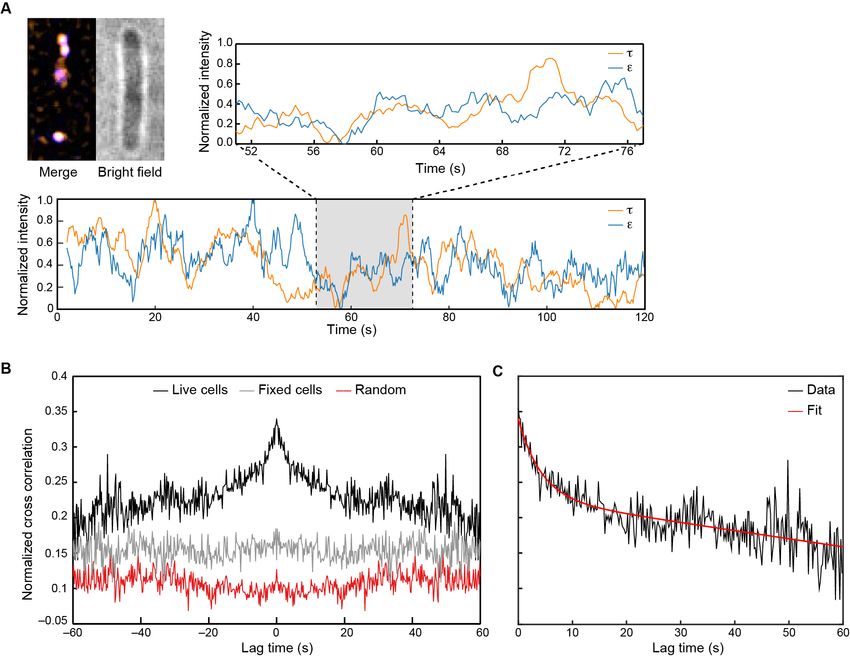
Research article                                                                                             Biophysics and Structural Biology

                                      displacement of the Pol III* from the replication fork by the Pol III cores, which are unable to support
                                      coordinated leading and lagging strand synthesis (Wu et al., 1992) (Figure 4—figure supplement
                                      2).

Figure 4. Rapid and frequent exchange of Pol III* is concentration dependent. (A) and (B), Kymographs of the distributions of red Pol III* (magenta)
and green Pol III* (green) on an individual DNA molecule at a total Pol III* concentration of 6.7 (A) or 0.3 nM (B). Co-localization of the two signals is
shown as a bright white fluorescent spot. (C) Kymograph of a pre-assembled replisome containing red Pol III*. The intensity of the signal from the
replisomal spot decreases after a Pol III* is left behind. It subsequently bleaches and the signal does not recover. (D) Histograms of the processivity of
replication with Pol III* present in solution (73 ± 25 kb) and under pre-assembly conditions (76 ± 26 kb), each fit with a single exponential decay
function. The errors represent the error of the fit. (E) Histograms of the rates of replication with Pol III* present in solution (561 ± 27 bp/s) and under
pre-assembly conditions (445 ± 33 bp/s), each fit to a Gaussian distribution. (F) Histograms of the stoichiometry of Pol III* at the replication fork, fit to
four (6.7 nM) or three (0.3 nM) Gaussians centered at integral numbers of Pol III* calculated from single Pol III core intensities (see Figure 4—figure
supplement 4). The black lines represent the sums of these distributions. The errors in (E) and (F) represent the standard errors of the mean.
DOI: 10.7554/eLife.23932.012
The following figure supplements are available for figure 4:
Figure supplement 1. Example kymographs.
DOI: 10.7554/eLife.23932.013
Figure supplement 2. Processivity of replication challenged by Pol III core.
DOI: 10.7554/eLife.23932.014
Figure supplement 3. Histograms of the stoichiometry of Pol III* at the replication fork.
DOI: 10.7554/eLife.23932.015
Figure supplement 4. Histograms of the intensity distribution of single Pol III cores.
DOI: 10.7554/eLife.23932.016
Figure supplement 5. Fluorescence intensity of replicating Pol III* complexes does not change at longer DNA lengths under near-TIRF imaging
conditions.
DOI: 10.7554/eLife.23932.017

Lewis et al. eLife 2017;6:e23932. DOI: 10.7554/eLife.23932                                                                                             6 of 17
Research article Biophysics and Structural Biology
Quantification of exchange time of Pol III* in vitro
To quantify the concentration-dependent exchange times of Pol III* during coupled DNA replication,
we performed in vitro single-molecule FRAP (fluorescence recovery after photobleaching) experi-
ments. We visualized red Pol III* entering and leaving the replication fork at different concentrations
using the same rolling-circle amplification scheme as described in Figure 1B. Instead of continuous
imaging at constant laser power, we periodically bleached all Pol III* at the replication fork using a
high-laser power (Figure 5A). By bleaching the fluorescence signal of Pol III* complexes, we can
monitor the recovery of the florescence signal as unbleached Pol III*s from solution exchange into
the replisome (Figure 5B). We monitored the recovery of the fluorescence signal and calculated the
average intensity after each FRAP pulse over time (Figure 5C, Figure 5—figure supplement 1). By
measuring the single-molecule FRAP of Pol III* over a concentration series spanning four orders of
magnitude and fitting the rate of signal recovery, we obtained the characteristic exchange time of
Pol III* into active replisomes (Figure 5D). At a total Pol III* concentration of 13 nM, the fluorescence
signal recovers rapidly (characteristic exchange time, t = 1.85 s), while at 30 pM the fluorescence sig-
nal is 20-fold slower to recover (t = 42 s). These observations are in agreement with our previous
two-color experiments, indicating that the rate of exchange is dependent on Pol III* concentration.
Exchange of Pol III* complexes in live cells
Inspired by our observations of rapid exchange of Pol III* in vitro, we used in vivo single-molecule
measurements to determine whether Pol III* exchange also occurs in live E. coli cells. We imaged
cells in which the clamp loader and core complexes were labeled at their C-termini with yellow and
red fluorescent proteins, respectively (t-YPet, e-mKate2). As observed previously, these fusions
remain fully functional (Reyes-Lamothe et al., 2010) (Figure 6—figure supplement 1). These cells
were immobilized on a (3-aminopropyl)triethoxysilane-treated coverslip and t-YPet and e-mKate2
foci were imaged simultaneously. Fluorescent proteins bound to large structures such as the nucle-
oid diffuse slowly and thus present in our images as diffraction-limited foci, whereas the signal from
proteins freely diffusing through the cytosol blurs over the entire cell (Robinson et al., 2015). To
monitor exchange of polymerase molecules at replisomes, the fluorescence intensity of individual
replication foci was tracked over time. We noticed that once the population of fluorescent molecules
had become partially nonfluorescent by irreversible photobleaching, instances of synchronized inten-
sity fluctuations of t-YPetand e-mKate2 within the replisome foci could be observed (Figure 6A). To
determine whether these intensity fluctuations were truly correlated, that is, whether they could be
explained by the exchange of Pol III*, we used cross-correlation analysis, a powerful unbiased
method that enables the calculation of (i) the extent of similarity between two fluctuating signals and
(ii) on which timescales that similarity occurs. The average cross-correlation function calculated for
1210 foci in 480 cells showed a clear positive cross-correlation peak, consistent with synchronous
exchange of t-YPet and e-mKate2 (Figure 6B, black line). To show that this peak arises due to pro-
tein dynamics, we fixed cells with formaldehyde to arrest all cellular processes and demonstrate the
absence of a cross-correlation peak (Figure 6B, gray line). To eliminate the possibility of correlated
intensity changes due to laser fluctuations, we calculated the cross-correlation function for random
pairs of t-YPet and e-mKate2 foci within the same field of view, but from different cells. Also here,
no cross-correlation peak was detected (Figure 6B, red line). Our experimental data cannot be
explained by exchange of core only, the uncoupled exchange of both e and t, or even the complete
absence of exchange (Figure 6—figure supplement 2). In support of Pol III* exchange, a positive
Video 1. Movie of red Pol III* (magenta) and green Pol Video 2. Movie of red Pol III* (magenta) and green Pol
III* (green) on an individual DNA molecule at a total III* (green) on an individual DNA molecule at a total
Pol III* concentration of 6.7 nM. This movie was used to Pol III* concentration of 0.3 nM. This movie was used to
generate the kymograph in Figure 4A. generate the kymograph in Figure 4B.
DOI: 10.7554/eLife.23932.018 DOI: 10.7554/eLife.23932.019
Lewis et al. eLife 2017;6:e23932. DOI: 10.7554/eLife.23932 7 of 17Research article Biophysics and Structural Biology
Figure 5. Quantification of Pol III* exchange time using single-molecule FRAP. (A) (Top panel) Imaging sequence used during the FRAP experiments.
Periodically, a FRAP pulse of high-laser power was used to rapidly photobleach all the Pol III* in the field of view. (Bottom panel) A representative
kymograph of red Pol III*s at the replication fork. After each FRAP pulse (indicated by the magenta line), all Pol III*s have bleached, but the
fluorescence intensity recovers as unbleached Pol III*s exchange into the replisome. (B) Normalized intensity over time for an individual replisome in the
presence of 3 nM Pol III* in solution. (C) The average intensity over time from 23 replisomes with 3 nM Pol III* in solution. (D) The three recovery phases
in (C) were averaged again to give the final averaged normalized intensity over time after a FRAP pulse. This curve was then fit to provide a
characteristic exchange time. This was done for four concentrations of Pol III* ranging from 13 to 0.03 nM. (E) Exchange time as a function of Pol III*
concentration.
DOI: 10.7554/eLife.23932.020
The following figure supplement is available for figure 5:
Figure supplement 1. Example kymographs for the single-molecule FRAP experiments.
DOI: 10.7554/eLife.23932.021
cross-correlation peak can, however, be explained by simultaneous exchange of e and t (Figure 6—
figure supplement 2).
We then calculated the in vivo exchange time by fitting the cross-correlation function with an
exponential decay. From this, we found an exchange time of 4 ± 2 s (Figure 6C), consistent with
measurements performed under similar experimental conditions (Beattie et al., 2017). Furthermore,
the concentration of t and e was determined in the cell (Figure 6—figure supplement 3). Similarly
to previous observations (Reyes-Lamothe et al., 2010), we found under our experimental conditions
a total concentration of 72 ± 3 nM of e and 67 ± 5 nM of t. Assuming all e and t form functional Pol
III* complexes within the cell, these concentrations of e and t would correspond to ~23 nM Pol III*
per cell. These in vivo measurements are consistent with exchange times measured for the highest
concentration of Pol III* in vitro (a few seconds at 13 nM). Given these observations, we conclude
that Pol III* exchange occurs during coupled DNA replication in vivo.
Discussion
We conclude that the E. coli replisome strikes a balance between stability and plasticity. In the
absence of Pol III* in solution, it retains its original polymerase and forms a highly stable complex
resistant to dilution. In its presence, Pol III* readily exchanges into the replisome at a rate that is
dependent on its concentration. Such a concentration-dependent exchange mechanism seems
Lewis et al. eLife 2017;6:e23932. DOI: 10.7554/eLife.23932 8 of 17Research article Biophysics and Structural Biology
Figure 6. Visualization of Pol III* exchange in vivo. (A) Left: image of t (orange) and e (blue) foci within a single E. coli cell, averaged over 40 s. Co-
localization of the two signals is shown as a white spot. Middle: bright field image of the same cell. Right and below: fluorescence intensity of t (orange)
and e (blue) over time. The trajectories are averaged using a 2 s moving average filter. (B) Averaged, normalized cross-correlation functions. The cross-
correlation function of 1210 pairs of foci in living cells shows a clear positive peak (black line). The cross-correlation function for 297 pairs of foci in fixed
cells (gray line) and the cross-correlation function of 1210 pairs of foci, randomized within the same field of view (red line) show no positive cross
correlation. Cross-correlation functions have been vertically offset for clarity. (C) Exponential fit (red) to the cross-correlation function in (B). We obtained
an exchange time scale of t = 4 ± 2 s. The error represents the error of the fit.
DOI: 10.7554/eLife.23932.022
The following figure supplements are available for figure 6:
Figure supplement 1. Growth curves for E. coli strains: wild-type E. coli (black), cells expressing both C-terminal derivatives of t (dnaX-YPet) and e
(dnaQ-mKate2) subunits under control from their endogenous promoters (green), and cells expressing only dnaX-YPet (blue) and dnaQ-mKate2
(orange).
DOI: 10.7554/eLife.23932.023
Figure supplement 2. Cross-correlation analysis of simulated intensity trajectories for pairs of e and t foci.
DOI: 10.7554/eLife.23932.024
Figure supplement 3. Measurement of concentrations of t and e in live cells.
DOI: 10.7554/eLife.23932.025
counterintuitive but can be rationalized through a complex protein–protein and protein–DNA inter-
action network controlled and maintained by multiple dynamic interactions. Under dilute conditions,
transient disruption of any one of these interactions would be followed by its rapid re-formation,
preventing dissociation. If, however, there are competing Pol III*s in close proximity to the fork, one
of these can bind at a transiently vacated binding site (e.g. on the b2 sliding clamp or DnaB helicase)
and consequently be at a sufficiently high local concentration to compete out the original Pol III* for
binding to the other sites. Such concentration-dependent exchange has recently been reported for
other systems (Loparo et al., 2011; Graham et al., 2011; Geertsema et al., 2014; Gibb et al.,
2014; Chen et al., 2015) and mathematically described by multisite competitive exchange mecha-
nisms (Sing et al., 2014; Åberg et al., 2016). Further evidence for a multisite mechanism comes
Lewis et al. eLife 2017;6:e23932. DOI: 10.7554/eLife.23932 9 of 17Research article Biophysics and Structural Biology
from comparison of the number of Pol III*s in or near the replisome at different concentrations. We
quantified the number of Pol III*s at the replication fork in the in vitro experiments by normalizing
the fluorescence intensity of the replisomal spot to the intensity of a single Pol III* (Figure 4—figure
supplement 3). The peaks of the distributions are at one Pol III* per replisome (Figure 4F), consis-
tent with in vivo observations (Reyes-Lamothe et al., 2010). Nevertheless, we find that often more
than one Pol III* is present in the replisome. As its concentration increases, the binding equilibria are
pushed toward occupancy of all binding sites and more than one Pol III* is associated with the repli-
some. At lower concentrations, Pol III* still exchanges, but the average number of Pol III*s is
reduced. Our observation of Pol III* exchange in living cells shows that such a multisite exchange
mechanism is a physiologically relevant pathway accessible to the replisome during coupled DNA
replication. Such a mechanism may have direct implications for the mechanisms used by the repli-
some to deal with obstacles such as DNA damage and transcription. The ability for the replisome to
rapidly exchange components in the presence of competing factors in a concentration-dependent
manner could allow for components to be easily replaced from solution and provide frequent but
limited access to other binding partners, such as translesion synthesis polymerases (Sutton, 2010),
without violating fundamental chemical and thermodynamic principles.
Materials and methods
Replication proteins
E. coli DNA replication proteins were produced as described previously: the b2 sliding clamp
(Oakley et al., 2003), SSB (Mason et al., 2013), the DnaB6(DnaC)6 helicase–loader complex
(Jergic et al., 2013), DnaG primase (Stamford et al., 1992), the Pol III t3dd’cy clamp loader
(Tanner et al., 2008) and Pol III aeq core (Tanner et al., 2008). Highly purified E. coli Pol I and DNA
ligase A were gifts of Yao Wang (Wang, 2015).
Expression plasmids for SNAP-a
Construction of plasmid pBOB1 (encoding w.t. a)
The tac promoter plasmid pND517 contains the dnaE gene between a pair of BamHI restriction sites
(Wijffels et al., 2004). In addition, the BamHI site following the gene overlaps with an NcoI site such
that previous digestion with NcoI eliminates it. To incorporate an NdeI site at the start codon of
dnaE, pND517 was used as template for PCR amplification of the 5’-portion of the dnaE gene using
primers 671 (5’-AAAAGGATCCTAAGGAGGTTTGCATATGTCTGAACCACGTTTC; BamHI and NdeI
sites are italicized, ribosome-binding site underlined) and 673 (5’-CGTTTGGCGATCTCAACGGTGT-
3’). The PCR product (Fragment I; 522 bp) was isolated from an agarose gel following digestion with
BamHI and XhoI. Next, pND517 was digested with NcoI, and the purified linearized product
digested independently with XhoI to generate Fragment II (3063 bp) and with BamHI to yield Frag-
ment III (5129 bp). Fragments I–III were ligated to yield pBOB1.
Construction of plasmid pJSL2197 (encoding SNAP-a)
A modified snap26b gene was amplified from pSNAP-tag(T7) 2 (New England Biolabs, Ipswich,
MA) by strand overlap PCR. In the first PCR, an NdeI site was incorporated at the start codon and an
internal MluI site was removed by silent mutation using primers 728 (5’-AAAAAAAACATATGGA-
CAAAGATTGCGAA) and 729 (5’-TGAAAATAGGCGTTCAGCGCGGTCGCC), yielding Fragment I. A
second PCR used primers 730 (5’-TGGCTGAACGCCTATTTTCATCAGCCGGAAGC) and 732 5’-
AAAAGGATCCGATAGAGCCAGACTCACGCGTTCCCAGACCCGG-3’) to generate Fragment II,
removing the TGA stop codon and incorporating a sequence encoding a flexible peptide linker
(sequence: TRESGSIGS [Williams et al., 2002]) flanked by MluI and BamHI sites at the 3’ end of
snap26bDMluI. Equimolar amounts of isolated Fragments I and II were then used as templates for
PCR with the outside primers 728 and 732 to generate a product that was digested with NdeI and
BamHI and isolated from a gel. This fragment was ligated with the 502 bp BamHI–XhoI fragment of
pKO1479wt (Ozawa et al., 2013) encoding the N-terminal segment of a and the large NdeI–XhoI
fragment of pBOB1, encoding the remainder of a, to generate pJSL2197, which directs overproduc-
tion of SNAP-a. Plasmid constructions were confirmed by nucleotide sequence determination.
Lewis et al. eLife 2017;6:e23932. DOI: 10.7554/eLife.23932 10 of 17Research article Biophysics and Structural Biology
Expression and purification of SNAP-a
An affinity resin for purification of full-length (unproteolysed) a was prepared by conjugation of bioti-
nylated tC16 (a-binding domain V of t) (Jergic et al., 2007) to high-capacity streptavidin-agarose
(Pierce Biotechnology, Waltham, MA). Biotinylated tC16 (15 ml; 12 mg) was added dropwise with
gentle stirring into a suspension of 6 ml of resin in 11 ml of 50 mM Tris–HCl pH 7.6, 2 mM dithio-
threitol, 1 mM EDTA, 50 mM NaCl at 6˚C over 20 min. Unconjugated streptavidin-agarose resin (2
ml) was added to a column and allowed to settle, then the suspension of tC16-conjugated resin was
poured over it. The column (1 10 cm) was then washed with 150 ml of 50 mM Tris-HCl pH 7.6, 2
mM dithiothreitol, 1 mM EDTA, 50 mM NaCl and stored at 4˚C in 50 mM Tris-HCl, 5 mM dithiothrei-
tol, 1 mM EDTA, 50 mM NaCl, 0.03% NaN3.
E. coli strain BL21(lDE3)recA/pJSL2197 was grown at 30˚C in LB medium supplemented with thy-
mine (25 mg/l) and ampicillin (100 mg/l). Upon growth to A600 = 0.6, 1 mM isopropyl-b-D-thiogalac-
toside (IPTG) was added and cultures were shaken for a further 3.5 hr, then chilled in ice. Cells (30 g
from 6 l of culture) were harvested by centrifugation, frozen in liquid N2 and stored at –80˚C. After
thawing, cells were lysed and SNAP-a was purified through Fraction IV essentially as described for
wild-type a (Wijffels et al., 2004). Fraction IV (50 ml) was dialysed against two changes of 2 l of
buffer Ca (25 mM Tris-HCl pH 7.6, 2 mM dithiothreitol, 1 mM EDTA, 10% (v/v) glycerol) and applied
at 1 ml/min onto a column (2.5 12 cm) of heparin-Sepharose (Wijffels et al., 2004) that had been
equilibrated with buffer Ca. The column was washed with 30 ml of buffer Ca and proteins were
eluted using a linear gradient (150 ml) of 0–400 mM NaCl in buffer Ca. SNAP-a eluted as a single
peak at ~40 mM NaCl. Fractions were collected and pooled to yield Fraction V, which was applied
directly at 1 ml/min onto the column of tC16-agarose affinity resin that had been equilibrated in
buffer Da (50 mM Tris-HCl pH 7.6, 10 mM dithiothreitol, 1 mM EDTA, 5% (v/v) glycerol) containing
20 mM MgCl2. After the column had been washed with 15 ml of buffer Da+0.6 M MgCl2 and
unbound proteins had been washed away, SNAP-a was eluted using a linear gradient (20 ml) of 0.6–
4.0 M MgCl2 in buffer Da. SNAP-a eluted as a single peak at ~2.8 M MgCl2 (Figure 2—figure sup-
plement 2B). Fractions under the peak were immediately pooled and dialysed against two changes
of 2 l of buffer Ea (50 mM Tris-HCl pH 7.6, 1 mM EDTA, 3 mM dithiothreitol, 100 mM NaCl, 20% (v/
v) glycerol) to give Fraction VI (40 ml, containing 68 mg of protein; Figure 2—figure supplement
2A). Aliquots were frozen in liquid N2 and stored at –80˚C.
Fluorescent labeling of SNAP-a
Two different fluorescent probes, SNAP-Surface 649 (red) and SNAP-Surface Alexa Fluor 488 (green;
New England Biolabs), were used to label SNAP-a. All labeling reactions were carried out using a
twofold molar excess of dye with 27 mM SNAP-a in 1 ml of 50 mM Tris-HCl pH 7.6, 2 mM dithiothrei-
tol, 100 mM NaCl, 5% (v/v) glycerol (buffer Fa) for 2 hr at 23˚C, followed by 6˚C overnight with gen-
tle rotation. Following the coupling, the reaction mixture was supplemented with 1 mM EDTA and
excess dye was removed by gel filtration at 1 ml/min through a column (1.5 10 cm) of Sephadex
G-25 (GE Healthcare, Chicago, IL) in buffer Fa+1 mM EDTA. Fractions containing the labeled SNAP-
a were pooled and dialysed against 2 l of buffer Ea, frozen in liquid N2 and stored in aliquots at –
80˚C. The degree of labeling was measured to be 90% for SNAP-a649 and 83% for SNAP-a488 by
UV/vis spectrophotometry.
Ensemble strand-displacement DNA replication assays
The flap-primed ssDNA template was made as previously described (Jergic et al., 2013). Conditions
for the standard coupled strand extension and Pol III strand-displacement (SD) reaction were
adapted from described methods (Jergic et al., 2013). Briefly, reactions contained 2.5 nM primed
DNA template, 1 mM ATP, 0.5 mM of each dNTP, 30 nM t3dd’cy, 150 nM Pol III (wild-type or
SNAP-labeled), 200 nM b2 and 800 nM SSB4 in 25 mM Tris-HCl pH 7.6, 10 mM MgCl2, 10 mM
dithiothreitol and 130 mM NaCl, in a final volume of 13 ml. Components (except DNA) were mixed
and treated at room temperature, then cooled in ice for 5 min before addition of DNA. Reactions
were initiated at 30˚C, and quenched at time points by addition of EDTA to ~100 mM and SDS
to ~1%. Products were separated by agarose gel electrophoresis and stained with SYBR-Gold (Invi-
trogen, Waltham, MA).
Lewis et al. eLife 2017;6:e23932. DOI: 10.7554/eLife.23932 11 of 17Research article Biophysics and Structural Biology
Ensemble leading and lagging strand DNA replication assays
Coupled leading and lagging strand DNA synthesis reactions were set up in replication buffer (25
mM Tris-HCl pH 7.9, 50 mM potassium glutamate, 10 mM Mg(OAc)2, 40 mg/ml BSA, 0.1 mM EDTA
and 5 mM dithiothreitol) and contained 1.0–1.5 nM of a 5’-biotinylated flap-primed 2 kb circular
dsDNA template (Geng et al., 2011), 1 mM ATP, 250 mM CTP, GTP, and UTP, and 50 mM dCTP,
dGTP, dATP, and dTTP, 6.7 nM wild-type or SNAP-labeled Pol III*, 30 nM b2, 300 nM DnaG, 100 nM
SSB4, and 30 nM DnaB6(DnaC)6 in a final volume of 12 ml. Components (except DNA) were mixed
and treated at room temperature, then cooled in ice for 5 min before addition of DNA. Reactions
were initiated at 30˚C, and quenched after 30 min by addition of 7 ml 0.5 M EDTA and 6 ml DNA
loading dye (6 mM EDTA, 300 mM NaOH, 0.25% (v/v) bromocresol green, 0.25% (v/v) xylene cyanol
FF, 30% (v/v) glycerol). The quenched mixtures were loaded into a 0.6% (w/v) agarose gel in alkaline
running buffer (50 mM NaOH, 1 mM EDTA). Products were separated by agarose gel electrophore-
sis at 14 V for 14 hr. The gel was then neutralized in 1 M Tris-HCl, pH 7.6, 1.5 M NaCl and stained
with SYBR Gold. The Okazaki fragment length distribution was calculated by normalizing the inten-
sity as a function of DNA length.
Reactions for testing the stability of the a–t interaction in Pol III* during replication were per-
formed as above with modifications. First, 125 mg streptavidin-coupled magnetic beads (Invitrogen)
were washed and equilibrated in replication buffer containing 200 mM AMP-PNP (replication buffer
B). DnaB6(DnaC)6 was first loaded at the fork by incubation of 7.5 nM rolling-circle DNA and 75 nM
DnaB6(DnaC)6 (reaction A) at 37˚C for 5 min in replication buffer B (40 ml), before being immobilized
on streptavidin-coupled magnetic beads for 30 min at room temperature (reaction B). Unbound
DNA was removed by washing reaction B three times in 200 ml replication buffer B. Replication was
initiated by resuspending reaction B in replication buffer containing 1.25 mM ATP, 250 mM CTP,
GTP and UTP, 200 mM dCTP, dGTP, dATP and dTTP, 3.35 nM each of red and green labeled Pol
III*, 200 nM b2, 300 nM DnaG, 50 nM SSB4, and 30 nM DnaB6(DnaC)6, and allowed to proceed for
20 min at 37˚C. Reactions were quenched with 2.1 ml of 2.5 M NaCl and 5 ml of 0.5 M EDTA. Follow-
ing quenching, the supernatant was removed, diluted 100-fold in replication buffer then imaged on
the surface of a coverslip at the single-molecule level. The remaining DNA products coupled to the
beads were washed three times in replication buffer, then resuspended in replication buffer (23 ml)
and 7 ml DNA loading dye then heated to 70˚C for 5 min. The DNA was loaded onto the alkaline
agarose gel, which was run under the same conditions as before.
In vitro single-molecule rolling-circle DNA replication assay
To construct the rolling circle template (Tanner et al., 2009), the 66-mer 5’-biotin-T36AATTCGTAA
TCATGGTCATAGCTGTTTCCT-3’ (Integrated DNA Technologies, Coralville, IA) was annealed to
M13mp18 ssDNA (New England Biolabs) in TBS buffer (40 mM Tris-HCl pH 7.5, 10 mM MgCl2, 50
mM NaCl) at 65˚C. The primed M13 was then extended by adding 64 nM T7 gp5 polymerase (New
England Biolabs) in 40 mM Tris-HCl pH 7.6, 50 mM potassium glutamate, 10 mM MgCl2, 100 mg/ml
BSA, 5 mM dithiothreitol and 600 mM dCTP, dGTP, dATP and dTTP at 37˚C for 60 min. The reaction
was quenched with 100 mM EDTA and the DNA was purified using a PCR purification kit (Qiagen,
the Netherlands). Microfluidic flow cells were prepared as described (Geertsema et al., 2015).
Briefly, a PDMS flow chamber was placed on top of a PEG-biotin-functionalized microscope coverslip
(Figure 1—figure supplement 1 inset). To help prevent non-specific interactions of proteins and
DNA with the surface, the chamber was blocked with buffer containing 20 mM Tris-HCl pH 7.5, 2
mM EDTA, 50 mM NaCl, 0.2 mg/ml BSA, and 0.005% Tween-20. The chamber was placed on an
inverted microscope (Nikon Eclipse Ti-E) with a CFI Apo TIRF 100x oil-immersion TIRF objective (NA
1.49, Nikon, Japan) and connected to a syringe pump (Adelab Scientific, Australia) for flow of buffer.
Conditions for coupled DNA replication under continuous presence of all proteins were adapted
from previously described methods (Tanner et al., 2008, 2009). All in vitro single-molecule experi-
ments were performed at least four times. Briefly, 30 nM DnaB6(DnaC)6 was incubated with 1.5 nM
biotinylated ds M13 template in replication buffer (25 mM Tris-HCl pH 7.9, 50 mM potassium gluta-
mate, 10 mM Mg(OAc)2, 40 mg/ml BSA, 0.1 mM EDTA and 5 mM dithiothreitol) with 1 mM ATP at
37˚C for 30 s. This mixture was loaded into the flow cell at 100 ml/min for 40 s and then at 10 ml/min.
An imaging buffer was made with 1 mM UV-aged Trolox, 0.8% (w/v) glucose, 0.12 mg/ml glucose
oxidase, and 0.012 mg/ml catalase (to increase the lifetime of the fluorophores and reduce blinking),
Lewis et al. eLife 2017;6:e23932. DOI: 10.7554/eLife.23932 12 of 17Research article Biophysics and Structural Biology
1 mM ATP, 250 mM CTP, GTP and UTP, and 50 mM dCTP, dGTP, dATP and dTTP in replication
buffer. Pol III* was assembled in situ by incubating t3dd’cy (410 nM) and SNAP-labeled Pol III cores
(1.2 mM) in imaging buffer at 37˚C for 90 s. Replication was initiated by flowing in the imaging buffer
containing 6.7 nM Pol III* (unless specified otherwise), 30 nM b2, 300 nM DnaG, 250 nM SSB4, and
30 nM DnaB6(DnaC)6 at 10 ml/min. Reactions were carried out 31˚C, maintained by an electrically
heated chamber (Okolab, Burlingame, CA).
Double-stranded DNA was visualized in real time by staining it with 150 nM SYTOX orange (Invi-
trogen) excited by a 568 nm laser (Coherent, Santa Clara, CA; Sapphire 568–200 CW) at 150 mW/
cm. The red and green Pol III* were excited at 700 mW/cm2 with 647 nm (Coherent, Obis 647–100
CW) and 488 nm (Coherent, Sapphire 488–200 CW) lasers, respectively (Figure 1—figure supple-
ment 1). The signals were separated via dichroic mirrors and appropriate filter sets (Chroma, Bellows
Falls, VT). Imaging was done with either an EMCCD (Photometics, Tucson, AZ; Evolve 512 Delta) or
a sCMOS camera (Andor, UK; Zyla 4.2). The analysis was done with ImageJ using in-house built plu-
gins. The rate of replication of a single molecule was obtained from its trajectory and calculated for
each segment that has constant slope.
Conditions for the pre-assembly replication reactions were adapted from published methods
(Tanner et al., 2011; Georgescu et al., 2011). Solution 1 was prepared as 30 nM DnaB6(DnaC)6, 1.5
nM biotinylated ds M13 substrate and 1 mM ATP in replication buffer. This was incubated at 37˚C
for 3 min. Solution 2 contained 60 mM dCTP and dGTP, 6.7 nM red Pol III*, and 74 nM b2 in replica-
tion buffer (without dATP and dTTP). Solution 2 was added to an equal volume of solution 1 and
incubated for 6 min at 37˚C. This was then loaded onto the flow cell at 100 ml/min for 1 min and
then 10 ml/min for 10 min. The flow cell was washed with replication buffer containing 60 mM dCTP
and dGTP. Replication was finally initiated by flowing in the imaging buffer containing 50 nM b2, 300
nM DnaG and 250 nM SSB4 at 10 ml/min.
Measurement of the stoichiometry of Pol III*s at the replisome
The average intensity of a single labeled Pol III core (6 pM) was calculated by immobilization on the
surface of a cleaned microscope coverslip in imaging buffer. The imaging was under the same condi-
tions as used during the single-molecule rolling-circle experiments. Using ImageJ with in-house built
plugins, we calculated the integrated intensity for every Pol III core in a field of view after applying a
local background subtraction. The histograms obtained were fit with a Gaussian distribution function
using MATLAB 2014b, to give a mean intensity of 5100 ± 2000 for the red and 1600 ± 700 for the
green Pol III core (Figure 4—figure supplement 4). To measure the intensity of the fluorescent spot
at the replication fork, we tracked its position and integrated the intensity for both colors simulta-
neously over time. Given there is no decay in fluorescence intensity of labeled Pol III cores as a func-
tion of DNA length under near-TIRF imaging conditions during DNA replication (Figure 4—figure
supplement 5), we calculated the total number of Pol III*s at every time point during coupled DNA
replication by dividing these intensities by the intensity of a single Pol III*. Subsequent histograms
were fit to four (6.7 nM) or three (0.3 nM) Gaussians centered at integral numbers of Pol III* (Fig-
ure 4—figure supplement 3) using MATLAB 2014b.
Fluorescent chromosomal fusions
The strain EAW192 (dnaQ-mKate2) was constructed using a modified version of the l RED recombi-
nation system (Huang et al., 1997), introducing a mutant FRT–KanR–wtFRT cassette. To select for
recombinants, cells were plated on LB-agar supplemented with 40 mg/ml of kanamycin and grown
overnight. Kanamycin-resistant strains were further screened for ampicillin sensitivity, to ensure that
cells had been cured of the l RED plasmid pKD46. The two-color strain EAW203 (dnaX-YPet, dnaQ-
mKate2) was constructed by P1 transduction. JJC5945 cells (dnaX-YPet) (Robinson et al., 2015)
were first treated with pLH29 (Huang et al., 1997) to remove existing KanR markers, then infected
with P1 grown on EAW192 (dnaQ-mKate2) cells. Transductants were selected for kanamycin
resistance.
Growth rates of fluorescent chromosomal fusions
Single colonies of wild-type E. coli MG1655 and derivatives containing the C-terminal chromosomal
dnaQ and dnaX fusions were used to inoculate 5 ml of LB broth (with 34 mg/ml kanamycin, if
Lewis et al. eLife 2017;6:e23932. DOI: 10.7554/eLife.23932 13 of 17Research article Biophysics and Structural Biology
required) and grown at 37˚C with shaking overnight. LB broth (100 ml) was inoculated with 1.0 105
cells/ml from overnight cultures. Subsequent growth of each strain was monitored at 37˚C with shak-
ing by determining OD600 every 30 min for 9.5 hr. The doubly labeled dnaX-YPet dnaQ-mKate2 cells
grew only slightly more slowly than wild-type cells (division time = 33 ± 4 min cf. 33 ± 8 min) (Fig-
ure 6—figure supplement 1), indicating that labeling the e and t components of the replisome
does not significantly disrupt DNA replication.
In vivo single-molecule visualization assays
The cells were grown at 37˚C in EZ rich defined medium (Teknova) that included 0.2% (w/v) glucose.
For imaging, a PDMS well was placed on top of a coverslip that was functionalized with (3-amino-
propyl)triethoxysilane (BioScientific, Australia) (Robinson et al., 2015). The cells were immobilized
on the surface of the well, which was then placed on the heated stage (Okolab) of the microscope.
Imaging was done at 37˚C. The t-YPet and e-mKate2 were excited at 0.03 mW/cm2 with 514 nm
(Coherent, Sapphire 514–150 CW) and 3 W/cm2 with 568 nm (Coherent, Sapphire 568–200 CW)
lasers, respectively. The signals were separated via a beam splitter (Photometrics, DVL Multichannel
Imaging System) and appropriate filter sets (Chroma). Imaging was done with an EMCCD camera
(Photometrics, Evolve Delta). The visualization of foci in living cells was performed in triplicate. The
image processing was done with ImageJ using in-house built plugins.
The concentrations or e and t were determined as described (Robinson et al., 2015) by measur-
ing the total fluorescence within each cell and dividing by the mean intensity of a single molecule.
To measure the total fluorescence, we first imaged 141 wild-type MG1655 cells to determine the cel-
lular autofluorescence (Figure 6—figure supplement 3A). We found the autofluorescence to be
constant for the duration of our measurements. We then imaged 273 t-YPet, e-mKate2 cells in 20
fields of view. The background fluorescence from the microscope coverslip was determined by fit-
ting the photobleaching per field of view with a single-exponential decay (Figure 6—figure supple-
ment 3B). The mean cellular intensities were corrected for the background and cellular
autofluorescence. We then fitted individual cell photobleaching curves to obtain the amplitudes (Fig-
ure 6—figure supplement 3C).
To find the intensity of a single-molecule, photobleaching trajectories of single foci were deter-
mined. The t and e foci were identified by making average projections of movies. The intensity over
time trajectories for each focus as it photobleached was measured. Next, the local background fluo-
rescence around each focus was subtracted. Trajectories showed step-wise intensity transitions cor-
responding to photobleaching of single fluorescent molecules (Figure 6—figure supplement 3D
inset). These transitions were fit by change-point analysis (Watkins and Yang, 2005;
Duderstadt et al., 2016). A histogram of the step sizes showed a relatively narrow distribution (Fig-
ure 6—figure supplement 3D). We found the mean intensity of a single molecule by fitting with a
Gaussian distribution. These were 158 ± 2 for e and 130 ± 5 for t (mean ± s.e.).
To find the total fluorescence intensity per cell, the mean cell intensity was multiplied by the area
of the cell. This was then divided by the single-molecule intensity. It was determined that there are
104 ± 3 copies of e and 96 ± 6 copies of t per cell. This corresponds to a concentration of 72 ± 3 nM
for e and 67 ± 5 nM for t. If we assume that all e and t are part of a Pol III* complex this tells us that
there is 23 nM Pol III* in the cell. The intensities of the foci were measured by integrating the inten-
sity of the peak and subtracting the mean local background intensity. The average cross-correlation
functions were calculated using MATLAB 2014b (Mathworks). The cross-correlation was fit with an
exponential decay and gave a characteristic time scale of 4 ± 2 s (mean ± error of the fit) (Figure 6).
Acknowledgements
We thank Harshad Ghodke for helpful discussions and Yao Wang and Zhi-Qiang Xu for contributing
reagents. This work was supported by the Australian Research Council: DP150100956 to AMvO and
NED, an Australian Laureate Fellowship to AMvO (FL140100027), and Australian Government
Research Training Program Scholarship to JSL.
Lewis et al. eLife 2017;6:e23932. DOI: 10.7554/eLife.23932 14 of 17Research article Biophysics and Structural Biology
Additional information
Competing interests
AMvO: Reviewing editor, eLife. The other authors declare that no competing interests exist.
Funding
Funder Grant reference number Author
Australian Government Re- Jacob S Lewis
search Training Program
Scholarship
Stichting voor Fundamenteel 12CMCE03 Lisanne M Spenkelink
Onderzoek der Materie
National Institutes of Health GM32335 Michael M Cox
Australian Research Council DP150100956 Nicholas E Dixon
Antoine M van Oijen
Australian Research Council FL140100027 Antoine M van Oijen
The funders had no role in study design, data collection and interpretation, or the decision to
submit the work for publication.
Author contributions
JSL, LMS, Conceptualization, Resources, Data curation, Formal analysis, Investigation, Visualization,
Methodology, Writing—original draft, Writing—review and editing; SJ, MMC, Resources, Writing—
review and editing; EAW, NPH, Resources, Conception and design of critical reagent protocols, and
contribution of essential reagents; EM, Resources, Methodology; KED, Conceptualization, Software,
Visualization; AR, Data curation, Software, Formal analysis, Visualization, Methodology, Writing—
review and editing; NED, AMvO, Conceptualization, Resources, Supervision, Funding acquisition,
Methodology, Writing—original draft, Project administration, Writing—review and editing
Author ORCIDs
Jacob S Lewis, http://orcid.org/0000-0002-9945-6133
Lisanne M Spenkelink, http://orcid.org/0000-0002-5511-8757
Nicholas E Dixon, http://orcid.org/0000-0002-5958-6945
Antoine M van Oijen, http://orcid.org/0000-0002-1794-5161
References
Åberg C, Duderstadt KE, van Oijen AM. 2016. Stability versus exchange: a paradox in DNA replication. Nucleic
Acids Research 44:4846–4854. doi: 10.1093/nar/gkw296, PMID: 27112565
Beattie TR, Kapadia N, Nicolas E, Uphoff S, Wollman AJ, Leake MC, Reyes-Lamothe R. 2017. Frequent exchange
of the DNA polymerase during bacterial chromosome replication. eLife 6:e21763. doi: 10.7554/eLife.21763,
PMID: 28362256
Blinkova A, Hervas C, Stukenberg PT, Onrust R, O’Donnell ME, Walker JR. 1993. The Escherichia coli DNA
polymerase III holoenzyme contains both products of the dnaX gene, tau and gamma, but only tau is essential.
Journal of Bacteriology 175:6018–6027. doi: 10.1128/jb.175.18.6018-6027.1993, PMID: 8376347
Chen TY, Santiago AG, Jung W, Krzemiński Ł, Yang F, Martell DJ, Helmann JD, Chen P. 2015. Concentration-
and chromosome-organization-dependent regulator unbinding from DNA for transcription regulation in living
cells. Nature Communications 6:7445. doi: 10.1038/ncomms8445, PMID: 26145755
Dohrmann PR, Manhart CM, Downey CD, McHenry CS. 2011. The rate of polymerase release upon filling the
gap between Okazaki fragments is inadequate to support cycling during lagging strand synthesis. Journal of
Molecular Biology 414:15–27. doi: 10.1016/j.jmb.2011.09.039, PMID: 21986197
Duderstadt KE, Geertsema HJ, Stratmann SA, Punter CM, Kulczyk AW, Richardson CC, van Oijen AM. 2016.
Simultaneous Real-Time imaging of leading and lagging strand synthesis reveals the coordination dynamics of
single replisomes. Molecular Cell 64:1035–1047. doi: 10.1016/j.molcel.2016.10.028, PMID: 27889453
Duderstadt KE, Reyes-Lamothe R, van Oijen AM, Sherratt DJ. 2014. Replication-fork dynamics. Cold Spring
Harbor Perspectives in Biology 6:a010157. doi: 10.1101/cshperspect.a010157, PMID: 23881939
Geertsema HJ, Duderstadt KE, van Oijen AM. 2015. Single-molecule observation of prokaryotic DNA replication.
Methods in Molecular Biology 1300:219–238. doi: 10.1007/978-1-4939-2596-4_14, PMID: 25916715
Lewis et al. eLife 2017;6:e23932. DOI: 10.7554/eLife.23932 15 of 17You can also read