Lanercost Farm ENVIRONMENTAL AUDIT REPORT 2018 - Future Farm
←
→
Page content transcription
If your browser does not render page correctly, please read the page content below
Lanercost Farm ENVIRONMENTAL AUDIT REPORT 2018
Lanercost
Environmental Audit
EXECUTIVE SUMMARY
The Beef + Lamb NZ Innovation Team is in the process of sourcing a farm to lease as part of a Future Farms
project. The farm would provide a testing ground for sheep and beef farming innovation and best practice
in action. The lease farm would be run to be commercially viable. The Beef + Lamb NZ Environment Team
was asked to undertake an environmental audit of the farm as part of the due diligence for leasing the
farm. The audit was to be supplied to the Innovation Team in the form of a report by 1 May 2018.

The scope of the audit was to provide a stocktake or baseline of Lanercost Farm, including natural features
on site (e.g. waterbodies and high value habitats), risk areas (e.g. critical source areas (CSA), erosion risks),
and current consents among other things; to build a reference point for the environmental context the
potential venture would start from. Two site visits and a desktop analysis were done to inform this report.

Lanercost Farm is a 1310ha dryland sheep and beef farm in the Hurunui District, North Canterbury; which
has been leased out for several years and managed by the lessee throughout that time. The farm boasts
a wealth of natural resources and features with existing or potential value from an environmental
perspective. There are extensive networks of waterbodies on the farm and the landscape is characterized
by loess hills, terrace plateaus and river-cut gullies.

Surface water bodies on farm were found to have potential as habitat in their own right or as part of a
network or corridor for native flora and fauna, however were degraded by bank erosion, sedimentation,
bed disturbance, and algal and macrophyte growth which would significantly limit habitat suitability. Point
sources for contaminants were found along both of the main waterways on farm which have a high risk
of discharging contaminants into those waterways, including offal pits and Hazardous Activities and
Industries List sites.

The soils were predominantly loess based and the land use capability (LUC) mapping of the farm found
erosion to be the greatest limiting factor for those soils, with the largest LUC class in hectares being 7e2.
Several forms of erosion were observed on farm. Both water body health and erosion have implications
beyond the boundaries of the property, as the waterways that run through the farm ultimately discharge
into the Leader River, which is a tributary of the Waiau River.

The regulatory context of the Hurunui is challenging for farming, at least in part because the catchment’s
nitrogen load is already overallocated. Based on the audit undertaken, the farm does not appear to be
complying with the four relevant plans: Canterbury Land and Water Plan, the Hurunui Waiau River
Regional Plan, the Canterbury Air Regional Plan, and the Hurunui District Plan. The farm does not have a
baseline Overseer® budget or baseline nitrogen loadings, and so farming is not permitted. It does not hold
a resource consent to use land for farming. Non-compliances could be addressed by changing practices or
mitigating, managing, or remedying the non-compliances or by obtaining resource consent to continue
using infrastructure and resources on farm legally.
Further investigation is recommended to inform a more detailed understanding of the state of the
resources and to quantify the effects, positive and adverse, that these resources have on farm and on the
wider catchment.

Should the decision be made to lease Lanercost Farm, a more in depth stocktake should also be done by
suitably qualified and experienced professionals to more detailed provide critical source area mapping,
water quality testing, ecological surveys, and a planning assessment that the Environment Team were
unable to undertake due to time constraints involved with the lease decision process.

                                                                                                       1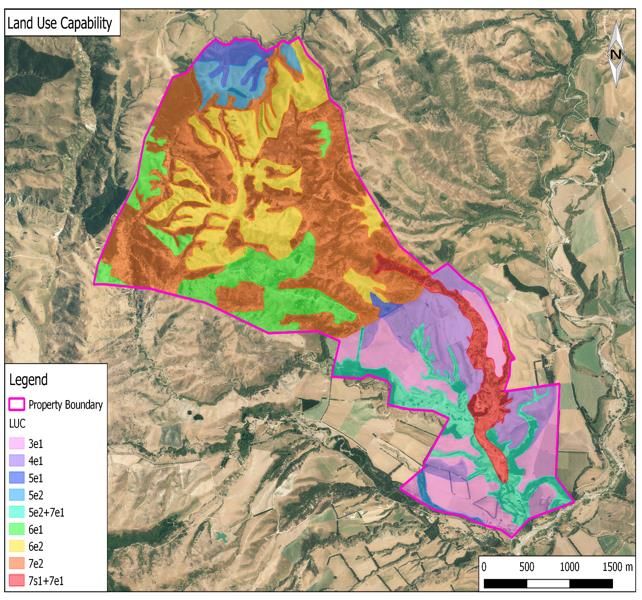
TABLE OF CONTENTS
Executive summary ....................................................................................................................................... 0
Table of Figures ............................................................................................................................................. 3
Introduction .................................................................................................................................................. 5
Background ................................................................................................................................................... 5
   Site visits ................................................................................................................................................... 6
Description of the environment ................................................................................................................... 6
   General...................................................................................................................................................... 6
Physical Resources ...................................................................................................................................... 10
   Land......................................................................................................................................................... 10
       Topography and Bedrock .................................................................................................................... 10
       Soils ..................................................................................................................................................... 11
       Land Use Capability ............................................................................................................................. 15
   Water ...................................................................................................................................................... 18
       Groundwater ....................................................................................................................................... 18
       Waterways .......................................................................................................................................... 18
       Ponds................................................................................................................................................... 22
       Wetlands ............................................................................................................................................. 22
       Dam ..................................................................................................................................................... 23
   Contamination ........................................................................................................................................ 24
       HAIL sites ............................................................................................................................................. 25
       Offal pits .............................................................................................................................................. 29
       Silage Bunkers and Critical Source Areas Sites ................................................................................... 31
   Biodiversity ............................................................................................................................................. 34
       Vegetation........................................................................................................................................... 34
       Waterbodies........................................................................................................................................ 36
Regulatory Matters ..................................................................................................................................... 41
   Regulatory Environment ......................................................................................................................... 42
   Resource Consents .................................................................................................................................. 43
   Compliance ............................................................................................................................................. 44
Conclusions ................................................................................................................................................. 46
Appendix One: Farm Map ........................................................................................................................... 47

                                                                                                                                                                   2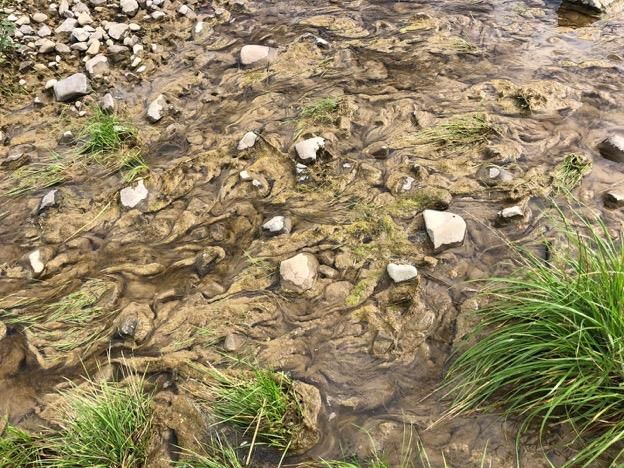
Appendix Two: Certificates of Title ............................................................................................................. 48
Appendix Three: Topography and Baserock Map....................................................................................... 49
Appendix Four: S-Map Soil Reports ............................................................................................................ 50
Appendix Five: Soil Map.............................................................................................................................. 51
Appendix Six: Land Use Capability Map ...................................................................................................... 52
Appendix Seven: Land Use Capability Descriptor Key ................................................................................ 53
Appendix Eight: Well Summaries and Bore Logs ........................................................................................ 54
Appendix Nine: Waterways Map ................................................................................................................ 55
Appendix Ten: Hazardous Industries and Activities List ............................................................................. 56
Appendix Eleven: CRC168022 Application .................................................................................................. 57

TABLE OF FIGURES
Figure 1: Lanercost Farm Map ...................................................................................................................... 5
Figure 2: General Environment Surrounding Lanercost (Source CanterburyMaps) ..................................... 7
Figure 3: Steep Ravine (left) and Gully Incised into Terrace Plateau (right) ................................................. 7
Figure 4: Wide River Bed Incised into Terrace Plateau with Steep Sides, Used to Hold Stock for Weaning.
...................................................................................................................................................................... 8
Figure 5: Crops Observed on Farm (Clockwise from Top Left: Lucerne, Rape, Cereal) ................................ 9
Figure 6: Lanercost Basement Rock and Topography (Source LRIS Portal and CanterburyMaps) ............. 10
Figure 7: Conglomerate Revealed by Erosion Adjacent Crichton's Creek .................................................. 11
Figure 8: Ubiquitous Juncus Rushes in Pasture on Plateau Flats Areas and Mottling in Topsoil ............... 12
Figure 9: Slip (left) and Gully (right) Erosion at Lanercost .......................................................................... 13
Figure 10: Slumping on Banks of a Pond (left) and Bank Erosion of Watercourse Exiting Wetland (right) 13
Figure 11: Map of Soils on Lanercost Farm (Source CanterburyMaps) ...................................................... 14
Figure 12: LUC Map of Lanercost Farm ....................................................................................................... 16
Figure 13: Typical Sediment Bed Waterway in Hills on Farm ..................................................................... 19
Figure 14: Pond and Waterway in Top Mackintosh .................................................................................... 19
Figure 15: Pond on Royal Stream Tributary (Source CanterburyMaps) ..................................................... 20
Figure 16: Brown Filamentous Algae in Royal Stream ................................................................................ 21
Figure 17: Source Tributaries of Leader River (Source CanterburyMaps) and Flowing Water in Vegetated
Soft Sediment Bed ...................................................................................................................................... 22
Figure 18: QEII Open Space Covenant ‘Le Cren’ Wetland........................................................................... 23
Figure 19: Map Showing Relative Position of Wetland and Dam (Source CanterburyMaps)..................... 23
Figure 20: Known Actual and Potential HAIL Sites on Farm (Source CanterburyMaps) ............................. 25
Figure 21: Concrete Footbath in Woolshed Paddock ................................................................................. 26
Figure 22: Landfill Gully Vegetation ............................................................................................................ 27
Figure 23: New Landfill / Burn Hole Looking Out Over Edge of Terrace..................................................... 28
Figure 24: Fertiliser Bunker in Top Paddock ............................................................................................... 29

                                                                                                                                                                      3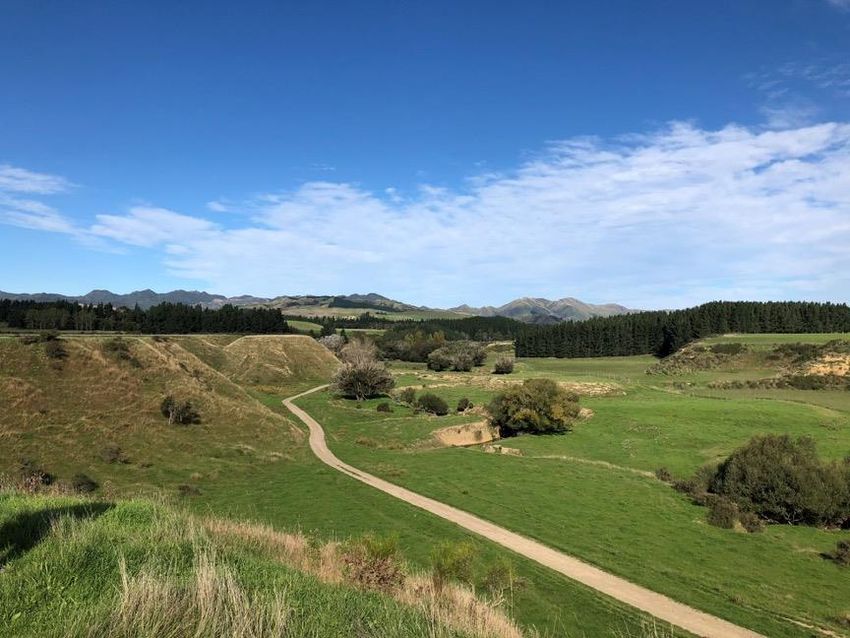
Figure 25: Offal Pits at Woolshed ............................................................................................................... 30
Figure 26: Offal Pit at No. 3 Creek Paddock ................................................................................................ 30
Figure 27: No 3 Creek Offal Pit Context ...................................................................................................... 31
Figure 28: Location of Silage Bunkers (Red Polygons) Relative to Other Structures and Waterways
(Source CanterburyMaps) ........................................................................................................................... 32
Figure 29: Silage Bunkers Between Silo Creek and Flat Hill Paddocks with 1.85cm Human for Scale ....... 32
Figure 30: Troughs on Farm as CSAs ........................................................................................................... 33
Figure 31: Vehicle and Stock Ford Crossing Through Crichton Creek ......................................................... 34
Figure 32: Native Scrub and Wetland Vegetation at the bottom of Jimmies Paddock .............................. 35
Figure 33: Native Vegetation in Gully Along Waterway and Pond ............................................................. 36
Figure 34: Royal Stream Tributary Between Le Cren Wetland and Dam – No Algae on Bed ..................... 38
Figure 35: Stockwater Storage Dam in Woodchester Drive ....................................................................... 39
Figure 36: Fish Sighted in Ford .................................................................................................................... 40
Figure 37:Cattle Faeces on the Concrete Flume Under Royal Stream Tributary Leaving Dam .................. 40
Figure 38: Scum on Water Leaving Flume, Algae in Waterway in Foreground .......................................... 41
Figure 39: Schedule 1 Catchment Nutrient Load Limits (Source HWRRP) ..... Error! Bookmark not defined.
Figure 40: Debris in Waterways Used to Strengthen Banks of Royal Stream (left) and as Groynes in
Crichton Creek (right).................................................................................................................................. 46

                                                                                                                                                         4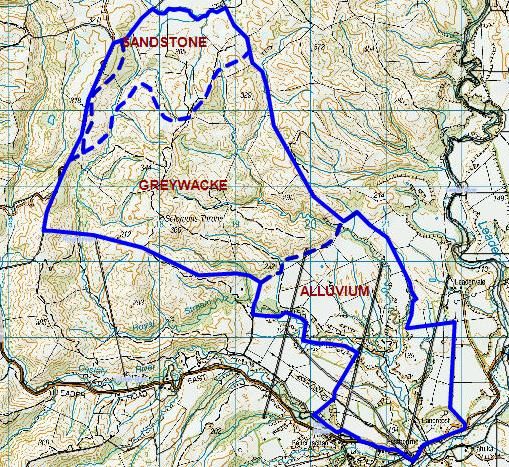
INTRODUCTION
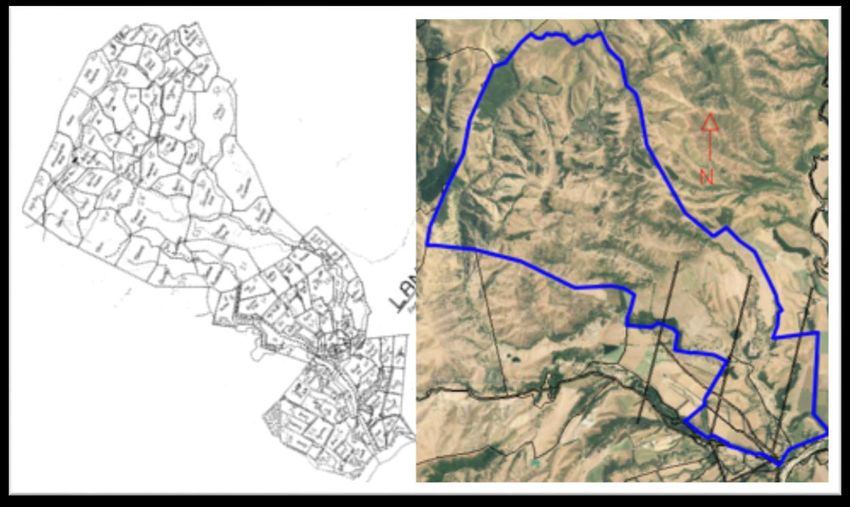
Figure 1: Lanercost Farm Map
Lanercost Farm is a 1310ha sheep and beef farm in the Hurunui District, North Canterbury. The farm has
been leased out for several years and managed by the lessee at this time. There are extensive networks
of waterbodies on the farm and the landscape is characterized by loess hills, terrace plateaus and river-
cut gullies. Two site visits were undertaken in autumn of 2018 which looked at the environmental
resources and risks on farm to establish a high level environmental snapshot stocktake or baseline to assist
Beef + Lamb NZ with its due diligence in determining whether or not to lease the farm.
A full size farm map with paddocks marked is annexed at Appendix One.
BACKGROUND
Beef + Lamb New Zealand (BLNZ) was considering a number of farms to lease as part of a Future Farm
project run by BLNZ’s Innovation team, which would provide a testing ground for innovation and best
practice in action. The lease farm would be run to be commercially viable.
The Environment Team was invited to participate in the due diligence process and agreed to provide an
environmental audit in the form of a report. The report would function as a stocktake, and establish an
environmental ‘baseline’ for the farm to be used as a reference point as the venture on farm progressed
over the years, should the farm be leased.
5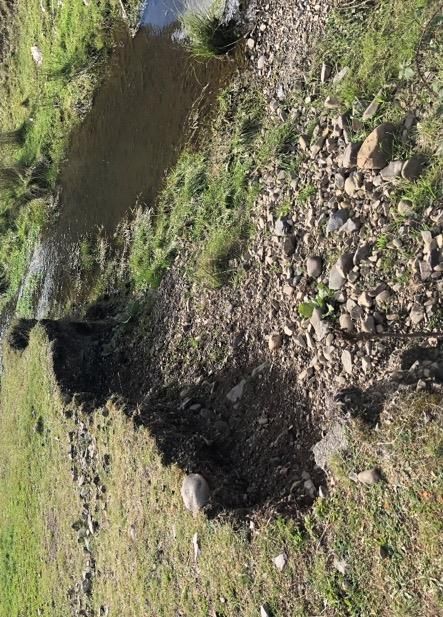
This environmental audit would encompass things including natural features on site (e.g. waterbodies and
high value habitats), risk areas (e.g. critical source areas (CSA), erosion risks), and current consents among
other things; to build a picture of the environmental context the venture would start from.

The audit was done as both a field work investigation and desktop analysis to produce a high level
snapshot baseline of the farm at the time of writing this report. Input was drawn from farm systems,
environmental science, ecology, and planning expertise. Should the decision be made to lease Lanercost
Farm, a more in depth stocktake should be done by suitably qualified and experienced professionals – this
will provide CSA mapping, water quality testing, and ecological surveys, that the current Environment
Team were unable to undertake due to time constraints involved with the lease decision process.

SITE VISITS
Site visits were undertaken by Lauren Phillips and Richard Parkes of the BLNZ Environment Team on 15
March 2018 (Site Visit 1) and 17 April 2018 (Site Visit 2).

At the time of Site Visit 1 there had been significant rainfall in the prior weeks but there had been no
rainfall of note in the week preceding, and there was little to no standing water or ponding on the heavier
soils. The weather was clear and warm with a light to no wind. On the day of Site Visit 2 the farm had seen
rain in the past 72 hours as evidenced by ponding and standing water on heavier soils, and wet tracks.
The weather was partly cloudy with a north-westerly wind that turned south-westerly by afternoon, and
cool to mild temperatures. The weather conditions and recent precipitation were taken into account when
assessing the farm and its natural resources, to allow for how those conditions might affect the state of
resources on the day.

This report is based on desktop analysis of the farm and the surrounding area, observations made during
the site visit, and information provided by the landowner, Julia Whelan, on site.

DESCRIPTION OF THE ENVIRONMENT

GENERAL
Lanercost Farm is located at 55 Mendip Road in Ferniehurst, Hurunui District, North Canterbury; 15km
west of the coast. The farm spans two Department of Conservation ecological districts, the Cheviot and
the Hunalee districts.

The surrounding environment is predominantly agricultural land in pasture or forage crop, grazed by
ruminants, which reflects one of the main economic activities in the Hurunui District. The majority of the
land surrounding Lanercost is hill country, with river flats and river terraces marking the path of current
or former waterways. Approximately 11km southwest of the farm is the Waiau Basin. The closest
settlement to Lanercost is Waiau, 13km due west of the farm. Mendip Road connects with State Highway
1 between Picton and Christchurch.

The wider landscape has major rivers running through it which are used for water supply and irrigation
purposes, including the Leader River, the Waiau River, the Conway River; the latter two containing
Wetlands of Representative Importance in Canterbury.

                                                                                                            6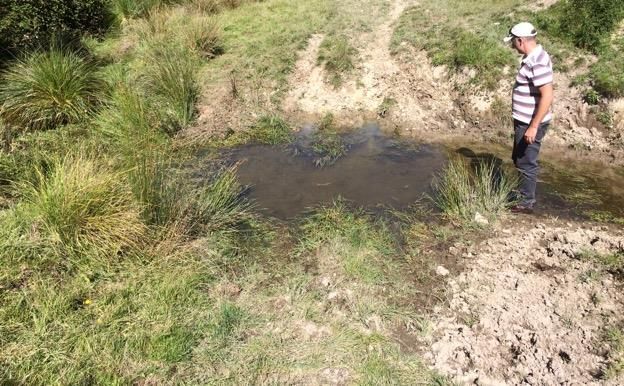
The farm falls within the rōhe of Te Rūnanga o Kaikōura. Both the Conway and Waiau Rivers are marked
as Rūnanga sensitive areas /wāhi taonga, however there are no silent files, statutory acknowledgement,
or NZ Archaeological Association sites marked in the vicinity of the farm.
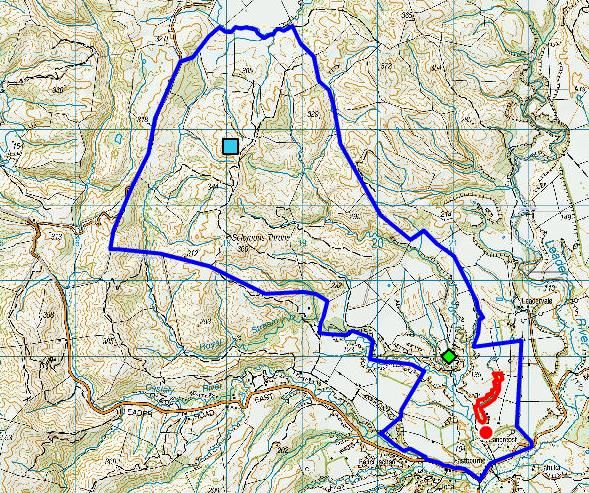
Figure 2: General Environment Surrounding Lanercost (Source CanterburyMaps)
The farm itself is predominantly hill country, ranging from gently rolling to steep. At the south eastern
end of the farm there are river terrace plateaus and wide river beds that form flats and downs. Rivers and
creeks have incised deep, steep gullies and ravines over time, making some waterways inaccessible. The
deep wider river beds that have been cut into the river terrace plateaus are used as stock holding pens
and to funnel stock through the farm during events such as weaning.
Figure 3: Steep Ravine (left) and Gully Incised into Terrace Plateau (right)
7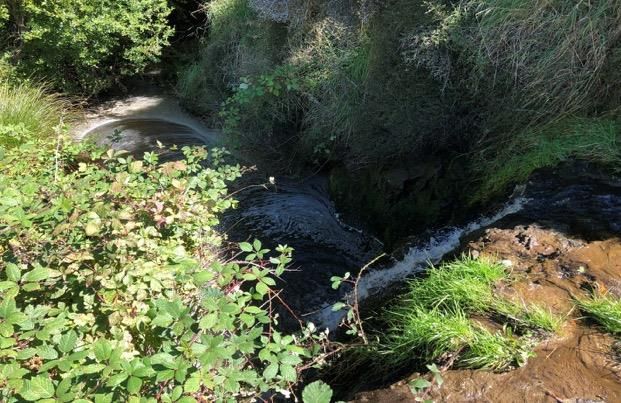
Figure 4: Wide River Bed Incised into Terrace Plateau with Steep Sides, Used to Hold Stock for Weaning.

There are several tracks running through the farm: the main tracks are maintained and allow for
reasonable access with 4wd vehicle, however much of the farm is accessible only on foot or by ATV/quad
motorbike due to topography, soil conditions or lack of maintained track.

The lessees on farm have run sheep and beef cattle on the property since the land owner opened the farm
to lease in around 2012/13. At Site Visit 1 the existing land owner was running Angus cattle, at Site Visit 2
a new leaseholder had taken over the farm and was running Hereford and Hereford/Angus cross cattle. It
was not evident what sheep were being run on farm, however the sheep observed on farm at both site
visits were meat breeds. The pasture was a mixed sward of unimproved hill pasture, ryegrass, clover,
browntop, and typical pasture herbs throughout. Crops grown on farm and observed at each site visit
included cereal crops which had recently been harvested; and forage crops including winter forage rape
and lucerne.

There is was no irrigation on Lanercost Farm at the time of writing this report.

Stockwater is taken from groundwater bores and from a dam at the top west end of the farm, and pumped
around to tanks and troughs throughout most of the farm excluding the eastern side. On the majority of
the eastern side water is not pumped for stock, and stock access the permanently flowing river that runs
nearly the length of the farm to drink.

                                                                                                           8
Figure 5: Crops Observed on Farm (Clockwise from Top Left: Lucerne, Rape, Cereal)
Lanercost Farm is comprised of several land parcels which are subject to interests relevant to this report
as per the certificates of title, which are annexed at Appendix Two.
For the purposes of this report, paper roads have been included in maps and areas calculated because
they are being farmed. Should a resource consent be sought for activities on that land, the paper roads
would be included in the area to be covered by the resource consent.
Table 1: Land Parcels and Relevant Interests
Parcel Size Interest Date of Interest
Part Lot 1 DP 2336 1213.2161ha QEII National Trust Open Space Covenant 1986 – Indefinite
Part Lot 4-5 DP 2335 99.2191ha Forestry Right 1996 – 2021
9PHYSICAL RESOURCES
LAND
Topography and Bedrock
Lanercost Farm starts in a river plain at Mendip Road and rises to river terrace plateaus to the northwest
towards the Mendip Hills. The plateau is largely flat or gently rolling, with steep gullies and ravines incised
into the deep loess as indicated by the topography and basement rock below in Figure 6 and at Appendix
Three. The basement rock under this area is alluvium. The flats end abruptly two-fifths of the way into the
farm and rise into rounded loess covered hills, which quickly become steeper as medium to steep hill for
the remaining three-fifths of the farm. The highest peak on farm is Solomon’s Throne at 360m altitude
above sea-level in the Throne paddock. The basement rock under the majority of this area is Greywacke,
except for the northernmost fifth of the farm which is sandstone, likely a remnant of the marine history
in Canterbury.
Figure 6: Lanercost Basement Rock and Topography (Source LRIS Portal and CanterburyMaps)
10Soils
The soils on farm are a predominantly loess in origin, and so the pale silt dominates the landscape
particularly in the hills. This has developed as deep loess over alluvium in the valleys and river basins, as
well as poorly sorted conglomerates.
Figure 7: Conglomerate Revealed by Erosion Adjacent Crichton's Creek
The majority of the soils on the ‘flats’ are imperfectly to poorly drained and well drained on the hills; with
drainage being a limiting factor on flatter land while erosion remains true to type for loess as a limiting
factor on the hills.
11Figure 8: Ubiquitous Juncus Rushes in Pasture on Plateau Flats Areas and Mottling in Topsoil
The majority of the erosion observed on farm was due to anthropogenic sources and activities associated
with the land use; although the waterways themselves naturally erode the stream banks to some extent.
Anthropogenic erosion forms observed on farm included:
Hills and terrace plateau
o Soil slips
o Sheet
o Gully
o Rills
o Wind
Waterbodies
o Stream bank erosion (from treading and grazing) (Figure 7)
o Deposition
o Bank slumping (from treading damage)
12Figure 9: Slip (left) and Gully (right) Erosion at Lanercost
Figure 10: Slumping on Banks of a Pond (left) and Bank Erosion of Watercourse Exiting Wetland (right)
13Soils were mapped using a combination of both S-Maps and New Zealand Fundamental Soils (NZFS).
The S-Map soil reports are annexed to this report at Appendix Four. A full sized soil map is available at
Appendix Five. The distribution of these soils over the farm are illustrated at Figure 11 with a key and
basic soil information tabled at Table 2.
Figure 11: Map of Soils on Lanercost Farm (Source CanterburyMaps)
14Table 2: Soils on Lanercost Farm (Source CanterburyMaps, NZFS, S-Map)
KEY Soil Ha Texture Drainage N Leaching P Leaching Source
Vulnerability Vulnerability
White Eyre 1 Silt loam Well drained Medium Medium S-Map
Yellow Waimakariri 14 Loam Well drained Low High S-Map
Orange Dumgree 58 Silt loam Well drained Low Medium S-Map
Pink Pahau 147 Silt loam Imperfectly Medium Medium S-Map
over clay drained
Red Darnley 2 Silt loam Moderately Very high High S-Map
well drained
Purple Claremont 159 Silt loam Poorly drained Medium Medium S-Map
over clay
Green Rakaia 80 Loam Well drained Very high Very high S-Map
Brown Brookstead 34 Silt loam Moderately Medium Medium S-Map
well drained
Blue Hurunui 759 Silt loam Well drained High Medium NZFS
Magenta Taiaroa 77 Clay Moderately Medium Medium NZFS
well drained
Land Use Capability
A coarse Land Use Capability (LUC) map was drawn up over the two site visits to assist with establishing
the capability of the land and its natural capital for future use, and as a comparison to its current and
historic use. The LUC gives an understanding of the landscape and the interconnected natural resources
at a high level, and can help with guiding expectations for any venture undertaken on farm. It is
recommended that a more in-depth and detailed LUC is done of the farm should Lanercost be selected
and leased as part of the Future Farm project.
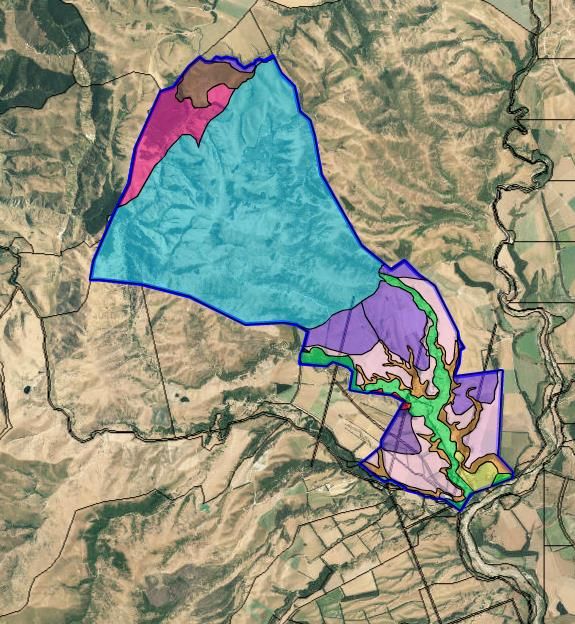
The map at Figure 12 shows the broad LUC categories observed on farm, and the large scale map and key
with sample photographs and descriptors can be found at Appendices Six and Seven respectively.
15Figure 12: LUC Map of Lanercost Farm
16Table 3: Lanercost Farm LUC Data
LUC Descriptor Approx.
Area
(ha)
3e1 High terraces with loess over old alluvium. Moderate physical limitations to 152
arable use. Risk of sheet and wind erosion particularly during cultivation, crop
and pasture establishment. Soil prone to wetness and water logging. Soil
structure vulnerable to cultivation and compaction resulting from pugging,
rolling, machinery etc.
4e1 As for 3e1 but dissected by ephemeral flow pathways – swales therefore 154
increasing the degree of limitation. Severe limitations to arable use requiring
intensive soil conservation controls and management including minimum tillage,
chemical cultivation, direct drilling etc. The grazing of winter crops presents
significant risk to soil structural decline and the connection of sediment,
nutrients and pathogens with water.
5e1 Stable gullies and dissected gully bottoms. High producing land with physical 29
limitations that make it unsuitable for arable cropping. Subject to sheet and
wind erosion and resulting deposition. Risk of erosion will increase significantly
with cultivation. This LUC is coupled with significant wetness limitation
particularly in gully bottoms.
5e2 Stable broad ridges and spurs. High producing land with negligible to slight 41
limitations or hazards to pastoral farming. Physical limitations make this unit
unsuitable for arable cropping.
5e2+7e1 Fresh alluvium intergrained with stony river channel subject to poor river bank 111
stability and undercutting, subject to debris deposition
6e1 Not suitable for arable use and has slight to moderate limitations and hazards 126
under a perennial vegetative cover. Suitable uses include grazed pasture, tree
crops and/or forestry. This LUC presents significant risk of sheet and wind
erosion along with soil slip. Slope 25o – 35o.
6e2 As for 6e1 but less steep with slope 16-25o. Subsequently a lower risk of erosion. 181
7e2 Steep faces with skeletal/bare and loessic. Unsuitable for arable use and has 471
severe physical limitations under perennial vegetation. Consequently, this class
of land is at high risk of soil and debris erosion and requires active management
to achieve sustainable production. It can be suited to grazing provided intensive
soil conservation measures and practices are in place and in many cases it is
more suitable for forestry. Steep slopes and low fertility combine to give high
risk of erosion and low productivity.
7s1 + Dissected floodway channel with undercutting banks including gravel/stony 64
7e1 river bars and steep scarp faces. Subject to debris deposition and stream bank
erosion.
17WATER
Waterbodies relevant to this report include surface water and groundwater. The groundwater relevant to
Lanercost Farm is the large unconfined/ semiconfined gravel aquifer that sits under much of Canterbury,
as well as groundwater that is not associated with an aquifer. Surface waterbodies identified on farm
during both site visits and desktop analysis include waterways and their source springs, ponds, wetlands,
and a dam.
Groundwater
Lanercost Farm is within the Environment Canterbury Parnassus Groundwater Allocation Zone. An
unconfined/ semiconfined aquifer is recorded under the Oats, Dip, and Horse paddocks by
CanterburyMaps. There are no other aquifers recorded under the rest of the farm.
Three current bores are recorded by Environment Canterbury on farm, Table 4 below provides details on
each bore, its location and its use. Well summaries and bore logs are available at Appendix Eight.
Table 4: Active Bores on Lanercost Farm
Well Use Depth Location Notes Status
Number
BU26/0022 Domestic 54m bgl. Dip Paddock Located over unconfined/semi- Active
and confined aquifer.
Stockwater
BU26/0023 Irrigation Not yet Trees 190m This well is part of a resource Proposed
drilled north of consent application to
Woolshed Environment Canterbury
CRC168023.
BU26/0024 Irrigation 92m bgl. Woolshed No irrigation currently on farm, Active
Terrace and no irrigation infrastructure or
Paddock resource consent allowing take
and use of water for irrigation.
From the site visits and desktop analysis there appear to be numerous springs on farm, especially in the
hills, which feed the tributaries of waterways and ponds.
Waterways
Lanercost Farm is in the Leader River Surface Water Allocation Zone.
Waterways for the purposes of this report refers to water courses with flowing water, as opposed to
ponds, soakholes, lakes, dams, or wetlands. Waterways observed on farm had either moderately coarse
(gravel to cobble sized) substrates or soft sediment substrate. The tributaries all appeared to be spring or
seep-fed, and most of them were marked as permanent waterways by LINZ Data Service and
CanterburyMaps. These waterways at their sources did not typically contain much flowing water, and
were vegetated with pasture species and Juncus sp. Figure 13 shows a typical fine sediment bed waterway
source. Closer investigation of that particular waterway showed that there was very slow-flowing water,
approximately 2-3cm in depth, which fed into the pond shown in Figure 14.
A map of waterways and the points where they were visited is annexed at Appendix Nine.
18Figure 13: Typical Sediment Bed Waterway in Hills on Farm
Figure 14: Pond and Waterway in Top Mackintosh
Three waterways of particular note run through Lanercost Farm; Royal Stream, Crichton Creek, and the
Leader River. Royal Stream has its source in the QEII wetland area at the very top of the farm. It runs
through a long gully between peaks close to the north western boundary of Lanercost. It feeds the water
storage dam before eventually leaving the farm and meandering back into the farm boundaries again
where the hills end and flat plateau begins. Between the QEII wetland and the dam the water is clear and
19free of undesirable biological growths (UBG), with a mixed gravel and sediment substrate. Other
tributaries of Royal Stream observed on the site visits appeared to be spring fed at their sources, with soft
sediment substrate beds, slow, shallow flow, or were simply indicated by very wet areas in gullies marked
by Juncus sp. And were grazed.
There is at least one pond observed on a Royal Stream tributary of approximately 200m2 in the lower
reaches of the catchment as shown in Figure 15. It then meanders in and out of the farm at the south-
western boundary before it converges with Crichton Creek and flows out at the entrance of the farm to
the Leader River. At the point where Royal Stream returns to the farm it has a gravel bed until the point
of discharge at the entrance of Lanercost.
Anecdotal evidence from the landowner stated that Royal Stream was ephemeral, however the nature of
the bed and the scale of UBG such as macrophytes and brown filamentous algae suggests that Royal
Stream is more likely to be intermittent; and it is likely that the majority of the flow is subsurface through
the drier parts of the year.
Pond
Figure 15: Pond on Royal Stream Tributary (Source CanterburyMaps)
Crichton Creek is not marked as such in publicly available topographical maps and the name has been
taken from the farm map provided. Crichton Creek has its source in the hills both on and off farm at the
northern end of the property. The sources are springs in gullies with very low flow and soft sediment
substrate, and are grazed.
The creek starts in the north eastern hills of the farm in the Scrubby paddock, flowing inside the eastern
boundary of the farm through steep country to the flats, where it has carved a deep gorge into the loess
plateau. The landowner advised that this waterway is permanently flowing and used for stockwater ‘as is’
on the eastern side of the farm. This creek flows on to converge with Royal Stream in Silo Creek paddock.
20Crichton Creek was slightly larger or comparative in width, depth and flow to Royal Stream on both site
visits. It is permanently flowing according to the landowner and showed similar levels of UBG and
sedimentation. Flow in Crichton Creek and Royal Stream and their larger tributaries was strong, with
gravel dominated waterways in particular exhibiting both runs and riffles throughout despite the UBG.
Figure 16: Brown Filamentous Algae in Royal Stream
The Leader River is a major river with a number of consented takes on it and discharges into the Waiau
River approximately 1.5km downstream of point where it converges with Royal Stream. The northernmost
paddocks of Lanercost hold tributaries of this river, as shown in Figure 17.
There is a pond noted on the main tributary within the farm boundaries, approximately 60m2 in size. This
pond is also depicted in Figure 10 and Figure 14.
All of the tributaries of the Leader River noted on farm were spring-fed, with fine sediment substrates in
broad gullies. They were vegetated and marked by Juncus sp. rushes, with slow, shallow flow observed as
shown in the corner of Figure 17 below. These tributaries are grazed by stock.
21Figure 17: Source Tributaries of Leader River (Source CanterburyMaps) and Flowing Water in Vegetated
Soft Sediment Bed
Ponds
The numerous small, shallow ponds scattered around the farm have fine sediment substrate beds and are
normally situated at the top of, or along small spring-fed tributaries of the larger waterways. The
landowner advised that these are not naturally formed ponds, they have been mechanically dug. The
ponds are used for stockwater; and the ponds observed demonstrated bank erosion, low water clarity
and high UBG levels.
Wetlands
There are a number of perennially wet areas on farm which could be considered wetlands. They are all
grazed but for one, a QEII covenant which is fenced off from stock and densely vegetated in native bush.
Approximately 30ha of the farm has been set aside as an Open Space Covenant, or QEII covenant,
depicted in Figure 18. This wetland area is recognized by the Department of Conservation as the Le Cren
Wetland.
The grazed wetlands typically had very little wetland vegetation other than Juncus sp. or cabbage trees
(Cordyline australis), and exhibited treading damage from cattle. They were often located in gullies, at
the bottom of hills, or in depressions and basins associated with waterways.
22Figure 18: QEII Open Space Covenant ‘Le Cren’ Wetland
Dam
The Royal Stream tributary that is fed by Le Cren wetland is dammed in Woodchester Drive paddock. This
dam is approximately 1,700m2 and up to 1.5 meters deep. The tributary exits the dam at the western end
via a concrete overflow flume. Stock have access to this dam and it is used as a stockwater source for part
of the farm, with water being pumped to water tanks.
Wetland
Dam
Figure 19: Map Showing Relative Position of Wetland and Dam (Source CanterburyMaps)
23CONTAMINATION
Production land is generally exempt from requiring resource consent for disturbing contaminated or
potentially contaminated soil under the Resource Management (National Environmental Standard for
Assessing and Managing Contaminants in Soil to Protect Human Health) Regulations 2011 (NES),
Regulation (5)(8):
Land covered
(7) The piece of land is a piece of land that is described by 1 of the following:
(a) an activity or industry described in the HAIL1 is being undertaken on it:
(b) an activity or industry described in the HAIL has been undertaken on it:
(c) it is more likely than not that an activity or industry described in the HAIL is being or
has been undertaken on it.
(8) If a piece of land described in subclause (7) is production land, these regulations apply if the
person wants to—
(a) remove a fuel storage system from the piece of land or replace a fuel storage system
in or on the piece of land:
(b) sample or disturb—
(i) soil under existing residential buildings on the piece of land:
(ii) soil used for the farmhouse garden or other residential purposes in the
immediate vicinity of existing residential buildings:
(iii)soil that would be under proposed residential buildings on the piece of land:
(iv) soil that would be used for the farmhouse garden or other residential
purposes in the immediate vicinity of proposed residential buildings:
(c) subdivide land in a way that causes the piece of land to stop being production land:
(d) change the use of the piece of land in a way that causes the piece of land to stop being
production land.
Contaminated land sites on Canterbury farms which would normally classify under the Ministry for the
Environment’s Hazardous Industries and Activities List (HAIL) (see Appendix Ten) are rarely listed on the
Environment Canterbury Listed Land Use Register (LLUR) (www.llur.ecan.govt.nz/Public/), a database
which records potentially contaminated sites. This is because on-farm HAIL sites are managed by the
individual farmers and are sometimes forgotten as land use changes, dump sites are filled in, or structures
are removed or abandoned to be replaced by new ones elsewhere on farm.
For all of these reasons above, contaminated land on farms is often overlooked and not accounted for.
The environment under, around, and over contaminated sites are still receptors for the contamination,
however, beyond the effects on human health or the requirement for a resource consent to disturb soil.
It is necessary to consider contaminated sites in evaluating the natural environment on farm to help build
an understanding of how these sites might affect receptors and ecosystems, and therefore one’s ability
to manage the health of those receptors and ecosystems. A number of contaminated sites and sources
were noted on farm over the two site visits, some of which are HAIL sites and others which function more
as point sources of contamination to waterbodies in particular.
1
Hazardous Activities and Industries List
24HAIL sites
Lanercost Farm is not listed on the LLUR as containing any known potential or actual HAIL sites.
The landowner was only able to provide information on potential HAIL sites as far as she had been advised
at the time of purchasing the farm. It is recommended that a check is done by a suitably qualified and
experienced professional in contaminated land (SQEP), using historic photos and records to identify other
potential HAIL sites like sheep dips and landfills.
Four HAIL sites were identified on farm with the assistance of the landowner. Two of these are known
landfills, one which was used up until the current land owner took possession of the farm and another
which is now used as a landfill. These landfills are discussed in more detail below. The third HAIL site is
the woolshed area, which still contains a concrete footbath. This paddock is a potential HAIL site for the
likely historic use as a sheep dip area. There may also be a historic sheep dip at the yards in Top Taylor’s
paddock, however there were no likely structures observed on Site Visit 1. The fourth is a fertiliser bunker
in Willy’s paddock next to the airstrip.
The sites are marked in Figure 20 and the footbath is shown in Figure 21.
Figure 20: Known Actual and Potential HAIL Sites on Farm (Source CanterburyMaps)
25Figure 21: Concrete Footbath in Woolshed Paddock
Landfills
Landfills are listed on the HAIL section G(3), and are known as a source of heavy metals and other
hazardous substances (e.g. batteries, petroleum products, greenwaste, plastic, dyes, pathogens, cleaning
chemicals, electrical etc.) depending on the nature of the refuse disposed of in them. These contaminants
are generally ecotoxic or affect the health of receiving ecosystems in other ways, for example through
nutrient discharge.
Previous owners of Lanercost disposed of rubbish in a deep, steep gully adjacent the current landowner’s
house which is now planted out in mature pine trees. The current landowner was not able to advise how
long they previous landowners had been doing this, however she had ceased the practice upon taking
possession the farm in 2009. Since that time, the gully has becom overgrown in brambles and creepers
and refuse is no longer visible, as can be seen below in Figure 22.
A waterway flows through that gully which is a tributary of Crichton Creek as marked in topographical
maps (see Figure 20), discharging from the gully 150m upstream of the convergence of Crichton Creek
and Royal Stream. The waterway was not safely accessible to establish whether flowing water was visible
or to assess the bed.
There are a number of environmental receptors which could be affected by this landfill, namely
groundwater, waterbodies, and soil. There is a high likelihood of contamninants being released by the
gully landfill contaminating groundwater in the area. If there is any hydraulic connectivity between the
groundwater under the gully and/or Crichton Creek at that point and the unconfined/ semi-confined
aquifer 200m south of it there is potential for the contaminants being released by the gully landfill to that
aquifer.
As the waterway flowing through the gully discharges into Crichton Creek, that creek and its banks are a
major direct receptor for contaminants from the landfill. Royal Stream is the next direct receptor for
contaminants after the two waterways converge, and so on until, ultimately, the Waiau River may be a
26receptor for contaminants from the landfill. A SQEP could confirm how far adverse effects of the landfill
might extend in light of the waterway running through the gully.
There is a very high likelihood that the landfill is contaminating the soil under and adjacent to it, as some
contaminants can migrate through soil via groundwater and overland flow.
Figure 22: Landfill Gully Vegetation
The landfill which replaced the gully landfill is located in Bottom Barn paddock on a terrace overlooking
the track. There nearest marked waterway is Royal Stream 160m west of the landfill.
This landfill is now used by all residents of the farm to dispose of refuse, furniture, whiteware, and other
unwanted material. The landfill is periodically burned to reduce the volume of content and to prolong the
life of the landfill. It is approximately 2.5m wide by 8-10m long, and of unknown depth. The site can be
seen in Figure 23.
The main likely receptor for contaminants from the new landfill is the soil under and around it. There is a
similar risk of contamination to the nearby aquifer as there is for the gully landfill, assuming groundwater
is in any way hydraulically connected to the aquifer. As stated earlier, a SQEP should be consulted on the
potential migration of the contaminants through that soil in order to establish the extent of the potentially
affected environment.
Smoke from burning rubbish and associated contaminant discharge also makes the air a receptor.
27Figure 23: New Landfill / Burn Hole Looking Out Over Edge of Terrace
Fertiliser Bunker
Places of bulk fertiliser storage are classified under the HAIL section (A)(6).
The fertiliser bunker noted on farm was approximately 80m2 in area and the landowner advised that it
had a concrete floor. Fertiliser is carted to the bunker and stored there to be spread by aeroplane, hence
its location at the end of the airstrip.
Closer investigation was not possible on either site visit due to time constraints on Site Visit 1 and track
conditions on Site Visit 2, although a photograph was taken on Site Visit from a nearby hilltop (see Figure
24).
It is not known whether fertiliser stored is protected from wind and rain on all sides. As such, and because
unloading, storage, and unloading practices were unknown it is difficult to identify potential
environmental receptors. Further investigation is recommended.
28Figure 24: Fertiliser Bunker in Top Paddock
Where HAIL sites are discharging into land or water, action may be required to either manage, mitigate
or remedy the discharge and/or HAIL site; or a resource consent is required.
Offal pits
Three main offal pit areas were observed on Site Visit One, although it is likely that there are more around
the farm from both current and historic use. The offal pits observed were:
Narrow pits with concrete caps
One current pit was found near the yards in a small unmarked paddock below Goat paddock, there
were likely more pits around the yards.
Twelve current and disused pits were found around the woolshed, although there were likely more
historic pits which have since filled in to the extent that they are no longer distinguishable from the
surrounding ground-level. A sample of these pits is illustrated in Figure 25.
There were no marked waterbodies within 100m of the offal pit below Goat paddock, however the
offal pits at the woolshed are within 100m of two tributaries of Royal Stream.
Pits were capped to keep stock and surface water runoff out.
A large open pit for miscellaneous offal
This pit is located in No 3 Creek paddock and is approximately 40m2 and of unknown depth and age.
Agricultural chemical containers, fertiliser and feed sacks were also sighted in the offal pit.
The pit is on a river terrace 2m high directly above the river flat. The edge of the pit is approximately
5m from the edge of the terrace which drops down to a channel of Royal Stream immediately adjacent
(see Figure 27). The stream channel is approximately 6m from the edge of the offal pit.
29 It is important to note that this pit possibly classifies as a HAIL site under category I due to the
agrichemical containers and other refuse dumped in it. Guidance was sought from Catherine Schofield
at the Ministry for the Environment, who confirmed that Category I can apply to offal pits where other
contaminants are disposed of in it. This would have serious implications due to the pit’s proximity to
the waterway.
Figure 25: Offal Pits at Woolshed
Figure 26: Offal Pit at No. 3 Creek Paddock
30Edge of terrace
Edge of offal pit
Edge of terrace
Figure 27: No 3 Creek Offal Pit Context
Silage Bunkers and Critical Source Areas Sites
Silage pits and CSAs were observed as point sources for contamination to waterbodies on farm due to
their inherent nature, location, and/or management.
Five silage bunkers were noted on the western side of the main track between Craig’s Gully and No 1
Creek paddock, as shown in Figure 28.
All of these bunkers were on a loess river terrace above the flat river plain that Royal Stream flows down.
They varied in size, but four of them were approximately 200-250m2 and the fifth was approximately
125m2. Figure 29 gives an indication of the scale of the bunkers.
The soil that the bunkers have been dug into is loess and poorly sorted gravel, ranging in size from less
than 1cm to cobble size.
The bunkers are unlined and within 30-35m of Royal Stream and its tributaries, so there is a high risk of
discharge from the silage entering the groundwater and the waterways as receiving environments. This
discharge will contain nutrients which affect water quality and ecosystem function, like nitrogen,
phosphorus and carbon.
31Figure 28: Location of Silage Bunkers (Red Polygons) Relative to Other Structures and Waterways (Source
CanterburyMaps)
Figure 29: Silage Bunkers Between Silo Creek and Flat Hill Paddocks with 1.85cm Human for Scale
CSAs are a feature of farms nationwide and the extent that they have adverse effects on the natural
environment is determined in large part by their management. CSAs are environmentally relevant as
32contaminant point sources of sediment, nitrogen, phosphorus, and pathogens. For the purposes of this
report, the Industry-agreed Good Management Practices relating to water quality (18 September 2015)
has been used to define a CSA with a focus on the connection between these CSAs and surface water
bodies:
Areas of enriched contaminant sources and hydrological activity that occur in small parts of a
catchment or farm such as a gully, swale or depression, but that contribute a disproportionately
large amount of contaminants to the environment
CSAs observed on Site Visit 1 and 2 which have not already been addressed in other sections included:
Areas under and around shelter trees
Areas around troughs
Areas around troughs and under shelter are often denuded of vegetation and then pugged or
compacted due to the comparatively high use or animal traffic, however their management can
reduce or exacerbate their impact. Many of the troughs sites were leaking, which would
compound the sediment and nutrient loss caused by that type of CSA (see Figure 30)
Fords
Fords which allow for vehicle and stock crossing like that depicted in Figure 36 contribute
disproportionally large amounts of contaminants due to the bed disturbance, sediment loss, and
animal excrement directly to the waterway.
Banks of water bodies (see Figure 7 and Figure 10)
In-situ grazing fodder crop paddocks (for example Figure 5)
Figure 30: Troughs on Farm as CSAs
33Figure 31: Vehicle and Stock Ford Crossing Through Crichton Creek
BIODIVERSITY
Ecological surveys of terrestrial and aquatic flora and fauna were not undertaken due to constraints in
time and resources; a high level evaluation of the farm in terms of habitat – actual and potential – was
undertaken in lieu of a specific survey. The rationale behind this was that without the appropriate habitat
the presence of many native species is unlikely, whereas the presence of certain habitats would attract
species which are mobile (either as terrestrial fauna or wind-blown seeds and spores) or which could
access the areas through waterways that connect to them. Incidentally, unidentified native fish and
fantails (Rhipidura fuliginosa) were noted in a Royal Stream tributary already described in this document
and in tall scrub in Driving Spur paddock, respectively.
The broad habitats that were considered include vegetation and waterbodies; including waterways, ponds,
wetlands, and the storage dam on the Royal Stream tributary. There was a bias in favour of native flora
and fauna in considering potential for high value habitats.
Discussions with the landowner suggests that large mammal pests including deer and pigs were not an
issue on the farm due to a consistent large mammal pest control programme implemented by the farm
workers. Smaller mammals were noted as present on both site visits, including rat and possum scat, and
sightings of rabbits and hares.
Vegetation
The vast majority of the vegetation observed on farm was exotic mixed sward pasture. As already
mentioned, Juncus sp. are noted throughout the farm in wet areas and marking areas that could otherwise
be considered as wetlands. Low to medium scrub, particularly Dicaria toumatou (matagouri) and Kunzea
ericoides (kanuka), was present in gullies, gorges and on the hills. Large trees on farm are almost entirely
34Pinus sp. and Eucalyptus sp. woodlots and shelter belts throughout the farm and in steep gullies; or
willows (Salix sp.) and poplars (Populus sp.).
Paddocks such as Scrubby, which were very steep had significant scrub growth which could provide
habitat for other native plants and terrestrial fauna if allowed to persist. The landowner advised that there
are plans to spray out Scrubby, which houses a major tributary for Crichton Creek, as it has been sprayed
out in the past (unclear who authorised the spraying previously and who would do so in the future).
In other areas the presence of waterways combined with steep topography has allowed native vegetation
to grow with more diversity and to greater densities and heights than other places. The western side and
bottom of Jimmies paddock along the track, for example, showed a mixed habitat of native scrub/bush
and wetland vegetation which could provide valuable habitat if managed well, as seen below in Figure 32
and Figure 33. It was noted on Site Visit 1 that water flowing into the wetland after flowing through
Jimmies Paddock was quite clear in comparison to the water downstream. The wetland seen in Figure 32
is the same wetland with the outflow shown in Figure 10.
Figure 32: Native Scrub and Wetland Vegetation at the bottom of Jimmies Paddock
35Figure 33: Native Vegetation in Gully Along Waterway and Pond
Waterbodies
There is a large network of waterbodies on farm which appear to be spring-fed, and which have the
potential to offer habitat to riparian, wetland, and aquatic native flora and fauna. Connection to Waiau
River tributaries means that there are a number of native and exotic freshwater fauna present in the
streams, creeks, and ponds, and these fish are listed in Table 5. This list was taken from records of fish
recorded in the New Zealand Freshwater Fish Database.
No fish were recorded by the New Zealand Freshwater Fish Database within the boundaries of the farm;
however, this may be due to the fact that a survey of fish within the boundaries of Lanercost Farm has
never been undertaken. The waterways as viewed on 15 March and 17 April 2018 had levels of
sedimentation and algae in most places that would make the beds largely uninhabitable for aquatic fauna.
36You can also read