Wahleach Project Water Use Plan Wahleach Reservoir Fertilization Program - BC Hydro
←
→
Page content transcription
If your browser does not render page correctly, please read the page content below
Wahleach Project Water Use Plan

Wahleach Reservoir Fertilization Program
Implementation Year 12

Reference: WAHWORKS-2

Wahleach Reservoir Nutrient Restoration Project

Study Period: 2019

Province of British Columbia, Ministry of Environment,
Ecosystems Protection & Sustainability Branch

January 27,2021
WAHLEACH RESERVOIR NUTRIENT RESTORATION
          PROJECT REPORT, 2019

                             by

H.E. Vainionpaa, J.A. Sarchuk, T. Weir and S.L. Harris

            Fisheries Project Report No. RD 169
                            2021

                  Province of British Columbia
     Ministry of Environment and Climate Change Strategy
                       Ecosystems Branch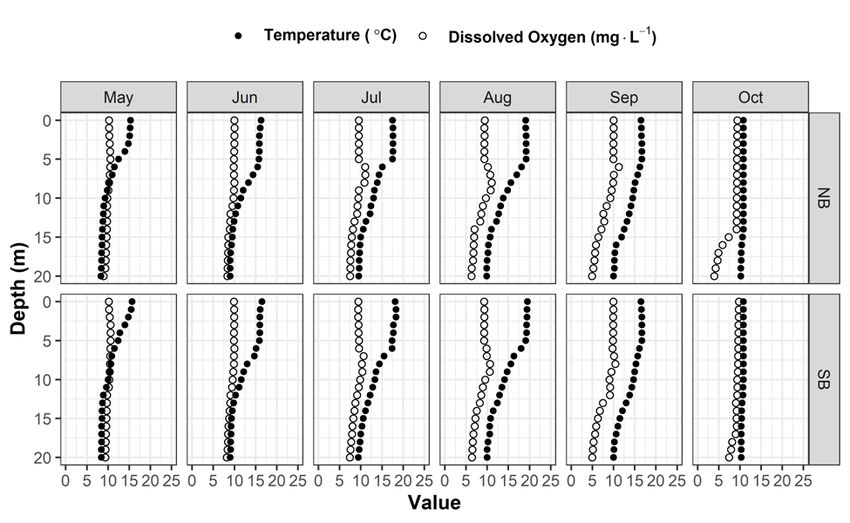
H.E Vainionpaa1, J.A. Sarchuk1, T. Weir2 and S.L. Harris1

1. Ministry of Environment and Climate Change Strategy; Ecosystems Branch, Conservation Science
   Section, 315 - 2202 Main Mall, University of British Columbia, Vancouver, BC V6T 1Z4
2. Ministry of Forests, Lands, Natural Resource Operations and Rural Development; Fish and Aquatic
   Habitat Branch, PO. Box 9365 Stn. Prov. Govt., Victoria, BC V8W 9M3

Data and information contained within this report are subject to change.

Copyright Notice
No part of the content of this document may be reproduced in any form or by any means, including
storage, reproduction, execution, or transmission without the prior written permission of the Province of
British Columbia.

Limited Exemption to Non-reproduction
Permission to copy and use this publication in part, or in its entirety, for non-profit purposes within British
Columbia, is granted to BC Hydro; and

Permission to distribute this publication, in its entirety, is granted to BC Hydro for non-profit purposes of
posting the publication on a publicly accessible area of the BC Hydro website.

Wahleach Reservoir Nutrient Restoration Project, 2019                                                     ii
Acknowledgements
This project was completed by the Ministry of Environment and Climate Change Strategy, Conservation
Science Section under a Memorandum of Understanding with BC Hydro.

Field assistance was provided by Robert W. Land, Jessica Bayley, Kevin Gould, Allison Hebert and
Claude Himbeault. Climate and hydrometric data were provided by BC Hydro Power Records staff.
Taxonomic identification and enumeration of phytoplankton samples were conducted by Darren Brandt,
Advanced Eco-Solutions. Identification and enumeration of zooplankton samples were conducted by
Lidija Vidmanic, Ecolab Ltd. David Johner and Tyler Weir with the Ministry of Forests, Lands, Natural
Resource Operations and Rural Development conducted the hydroacoustic survey. Kokanee spawner
enumerations were completed with assistance from Rachel Chudnow, Natasha Sharma, Thomas Smith
and Erin Stoddard. Terralink supplied fertilizer for application to Wahleach Reservoir and GFL
Environmental transported the fertilizer up the Jones Lake Forest Service Road. The Freshwater
Fisheries Society of British Columbia, especially Charlotte Lawson, was responsible for fish stocking,
including triploiding, rearing and marking of Cutthroat Trout. Thanks to Greg Andrusak with the Ministry
of Forests, Lands, Natural Resource Operations and Rural Development for his advice and snippets of R
code for the fish analyses.

Toby Michaud of BC Hydro provided support with administration of the project Memorandum of
Understanding; an additional thank you to Erin Stoddard, also of BC Hydro, for reviewing the final draft of
this report. A warm thank you to Kerry Baird with the British Columbia Conservation Foundation for
contract management. Our gratitude is also extended to Nick Collisson, financial analyst with Corporate
Services for the Natural Resource Sector. We thank the Jones Lake Cabin Association for their
continued support of our program and for allowing continued use of a lot for fertilizer and boat storage.
We also appreciate the support from Manjit Kerr-Upal and Dr. Brett van Poorten – Director of the
Conservation Science Section and (former) Unit Head of the Applied Freshwater Ecology Research Unit
at UBC.

Financial support for this project was provided by BC Hydro and the Ministry of Environment and Climate
Change Strategy.

Wahleach Reservoir Nutrient Restoration Project, 2019                                                iii
Executive Summary
The restoration of the Wahleach Reservoir Kokanee population continued in 2019 based on a strategy of
nutrient addition in combination with biomanipulation of the food web via stocking of sterile Cutthroat
Trout. Physical, chemical and biological parameters were monitored to assess the ecosystem’s response
to treatments and to adaptively manage the program. This document is a summary data report for the
2019 monitoring year.

In 2019, Wahleach Reservoir was characterized as ultra-oligotrophic using nutrient concentrations and as
oligotrophic to mesotrophic using Secchi depths. Patterns and concentrations of nitrogen and
phosphorus in the epilimnion were consistent with the seasonal growth of phytoplankton and suggested a
rapid uptake and assimilation of useable forms of these nutrients by phytoplankton. The phytoplankton
community consisted primarily of edible species throughout the season, except in June and July when
increased biomass of inedible blue-green algae, belonging to the class Cyanophyceae, occurred. Small
blooms of blue-green algae are common in Wahleach during the summer as water temperatures increase
and have not been observed to negatively impact higher trophic levels. The seasonal mean
phytoplankton abundance was 3,665 cells∙mL-1 (SD = 2,541) and biomass was 0.59 mm3∙L-1 (SD = 0.56).
At the secondary trophic level, Daphnia densities averaged 1.5 individuals∙L-1 and biomass averaged 28
µg∙L-1; Daphnia accounted for 43% of the total zooplankton density and 61% of the total biomass. Both
abundance and biomass of other cladocerans was strong early in the season. It is important to stress that
the results observed provide a “snapshot” of the plankton community at a given point in time and
ultimately reflect a combination of factors that increase or decrease the abundance of the community
such as flushing, sinking and grazing.

Project monitoring data show that nutrient addition has had a positive bottom-up effect on lower trophic
levels, and subsequently on the Kokanee population. Once considered extirpated, Kokanee are now a
self-sustaining population in the reservoir. Threespine Stickleback abundance based on hydroacoustic
estimates remains relatively low at 78,504, suggesting predation by stocked sterile Cutthroat Trout has
had the intended impact on the population density and in turn reduced competition for zooplankton
resources. In 2019, the age 0 and age ≥1 Kokanee populations were 26,673 and 10,008 individuals
respectively and the escapement estimate was 9,595 spawners. Cutthroat Trout catch from fall 2019
gillnetting included a range of ages from age 1+ to age 8+, with a mean length of 284 ± 56 mm (range
202 to 408 mm) and mean condition factor of 0.92 ± 0.06.

Overall, data from Wahleach Reservoir have demonstrated that seasonal nutrient additions are
associated with positive ecological effects, particularly for the pelagic food web. Seasonal in situ data are
required to adaptively manage nutrient additions and inform restoration actions to ensure that desired
outcomes are achieved.

Wahleach Reservoir Nutrient Restoration Project, 2019                                                  iv
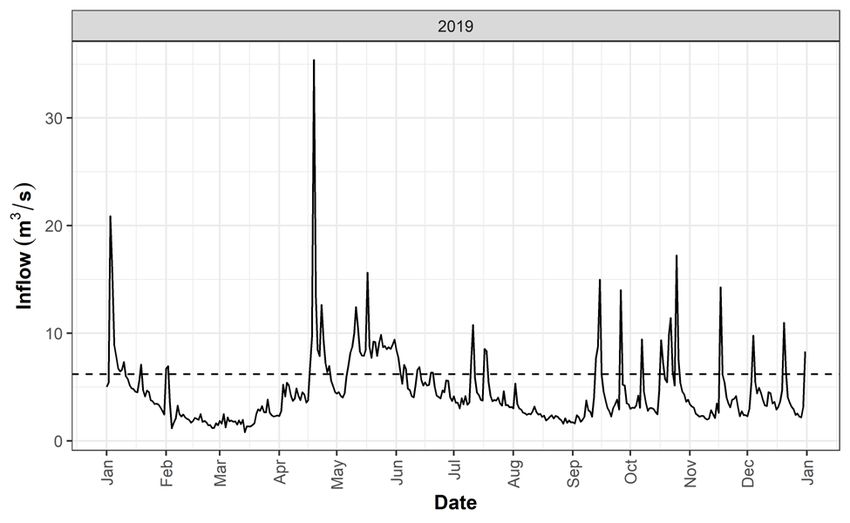
Table of Contents
List of Figures ......................................................................................................................................... vii
List of Tables ........................................................................................................................................... x
List of Appendices .................................................................................................................................. xii
1.     Introduction ...................................................................................................................................... 1
2.     Study Area ....................................................................................................................................... 2
3.     Methodology .................................................................................................................................... 4
       3.1       Restoration Treatments ...................................................................................................... 4
       3.1.1     Nutrient Additions ............................................................................................................... 4
       3.1.2     Fish Stocking ...................................................................................................................... 5
       3.2       Monitoring .......................................................................................................................... 6
       3.2.1     Climate ............................................................................................................................... 6
       3.2.2     Hydrometrics and Reservoir Operations .............................................................................. 6
       3.2.3     Physical and Chemical Limnology ....................................................................................... 6
       3.2.4     Phytoplankton ..................................................................................................................... 6
       3.2.5     Zooplankton........................................................................................................................ 7
       3.2.6     Fish Populations ................................................................................................................. 7
           3.2.6.1 Gillnet and Minnow Trap Surveys ................................................................................. 7
           3.2.6.2 Kokanee Spawner Surveys ........................................................................................... 8
           3.2.6.3 Hydroacoustic Surveys ................................................................................................. 8
4.     Results........................................................................................................................................... 10
       4.1       Hydrometrics and Reservoir Operations ............................................................................ 10
       4.1.1     Inflow................................................................................................................................ 10
       4.1.2     Discharge ......................................................................................................................... 11
       4.1.3     Reservoir Elevation........................................................................................................... 12
       4.2       Climate ............................................................................................................................. 13
       4.2.1     Air Temperature................................................................................................................ 13
       4.2.2     Precipitation...................................................................................................................... 13
       4.3       Physical and Chemical Limnology ..................................................................................... 15
       4.4       Phytoplankton ................................................................................................................... 22
       4.5       Zooplankton...................................................................................................................... 25
       4.6       Fish .................................................................................................................................. 27
       4.6.1     Catch & CPUE.................................................................................................................. 27
       4.6.2     Kokanee ........................................................................................................................... 27
           4.6.2.1 Spawners ................................................................................................................... 29
       4.6.3     Rainbow Trout .................................................................................................................. 32
       4.6.4     Cutthroat Trout ................................................................................................................. 34
       4.6.5     Threespine Stickleback ..................................................................................................... 36
       4.6.6     Hydroacoustic Fish Distribution ......................................................................................... 37
       4.6.7     Population and Biomass Estimates ................................................................................... 38
5.     Discussion ..................................................................................................................................... 38
6.     Conclusion ..................................................................................................................................... 40
7.     Recommendations ......................................................................................................................... 41

Wahleach Reservoir Nutrient Restoration Project, 2019                                                                                               v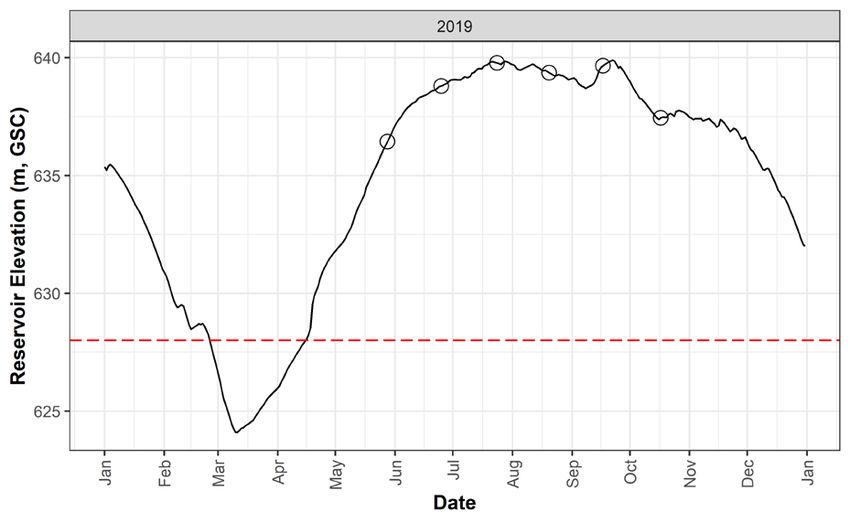
8.   References .................................................................................................................................... 43
9.   Appendices .................................................................................................................................... 47

Wahleach Reservoir Nutrient Restoration Project, 2019                                                                                         vi
List of Figures
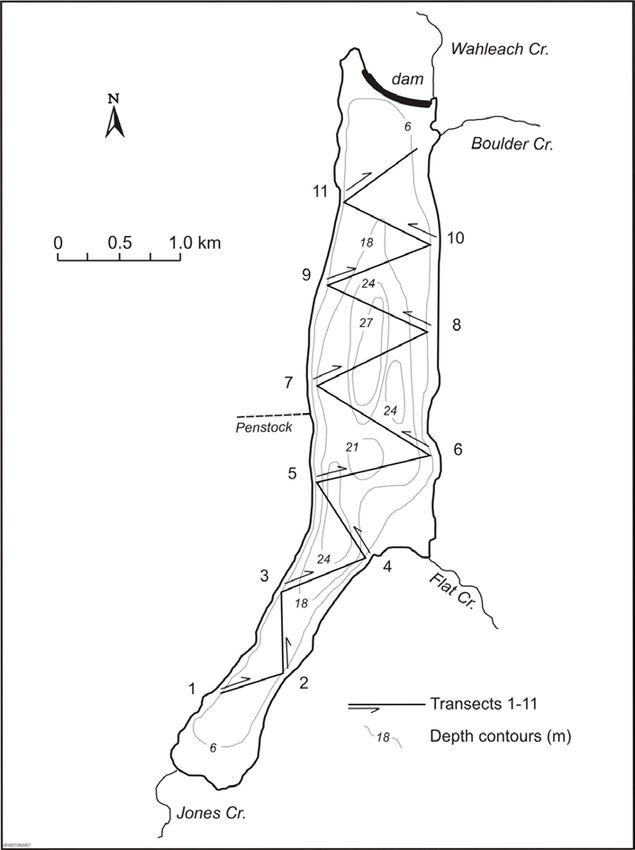
Figure 1. Map of Wahleach Reservoir, BC, including select sampling locations. LS2- SB and LS1-NB are
limnological sample locations and 1S, 2F, 3F, 4F, 5S, and 6S are gillnetting locations, with
S=Sinking net and F=Floating net. Bathymetric contour depths (m) represent the reservoir at
full pool. ................................................................................................................................... 3
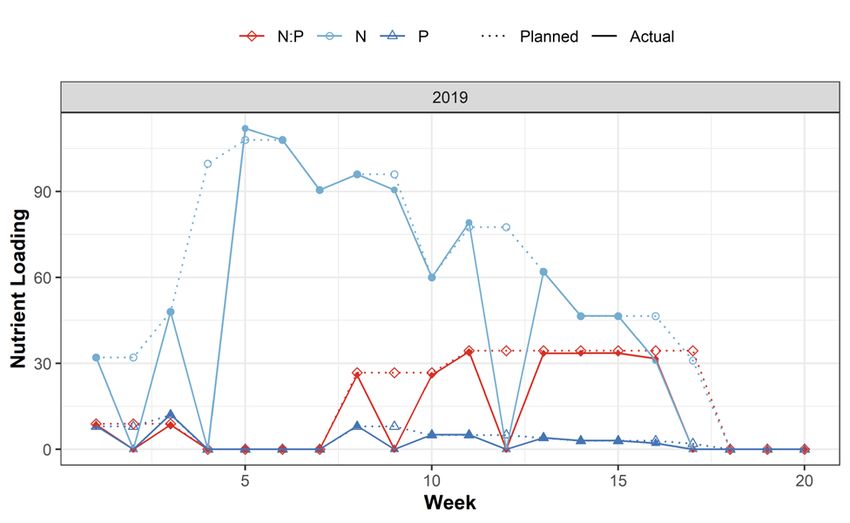
Figure 2. Seasonal planned and actual nutrient additions for Wahleach Reservoir, including areal
nitrogen and phosphorus loading as well as molar N:P ratios, 2019; planned values are
represented by hollow points and dashed line, while actual values are represented by solid
points and solid line. ................................................................................................................ 5
Figure 3. Locations of standardized hydroacoustic transects, Wahleach Reservoir, BC. .......................... 9
Figure 4. Daily inflow (m3·s-1), 2019, Wahleach Reservoir, BC. Dashed line is the long-term mean from
1993-2019 for daily inflows..................................................................................................... 11
Figure 5. Daily discharge (m3·s-1), 2019, Wahleach Reservoir, BC. ....................................................... 12
Figure 6. Daily reservoir surface elevation (m, Geodetic Survey of Canada), 2019, Wahleach Reservoir,
BC. Open circles represent limnology sampling dates. The red dashed line represents
minimum operating level of 628 m.......................................................................................... 13
Figure 7. Boxplot of daily mean air temperatures (°C) during each month, 2019, Wahleach Reservoir, BC.
Black dots represent outliers. ................................................................................................. 14
Figure 8. Boxplot of daily total precipitation (mm) during each month, 2019, Wahleach Reservoir, BC.
Black dots represent outliers. ................................................................................................. 15
Figure 9. Water temperature (°C) and dissolved oxygen (mg∙L-1) profiles at the north basin (NB-LS1) and
south basin (SB-LS2) limnology sampling stations May to October, 2019, Wahleach Reservoir,
BC. ........................................................................................................................................ 16
Figure 10. pH values from 1 m water chemistry samples at the north basin (NB) and south basin (SB)
limnology stations May to October, 2019, Wahleach Reservoir, BC. Horizontal bars represent
seasonal mean for each station.............................................................................................. 17
Figure 11. Alkalinity (mg CaCO3.L-1) values from 1 m water chemistry samples at the north basin (NB)
and south basin (SB) limnology stations May to October, 2019, Wahleach Reservoir, BC.
Horizontal bars represent seasonal mean for each station...................................................... 17
Figure 12. Secchi depths (m) at the north basin (NB) and south basin (SB) limnology sampling stations
May to October, 2019, Wahleach Reservoir, BC. Horizontal bars represent seasonal means for
each station. .......................................................................................................................... 18
Figure 13. Total phosphorus concentration (µg·L-1) from 1 m water chemistry samples at the north basin
(NB) and south basin (SB) limnology stations May to October, 2019, Wahleach Reservoir, BC.
.............................................................................................................................................. 19
Wahleach Reservoir Nutrient Restoration Project, 2019 vii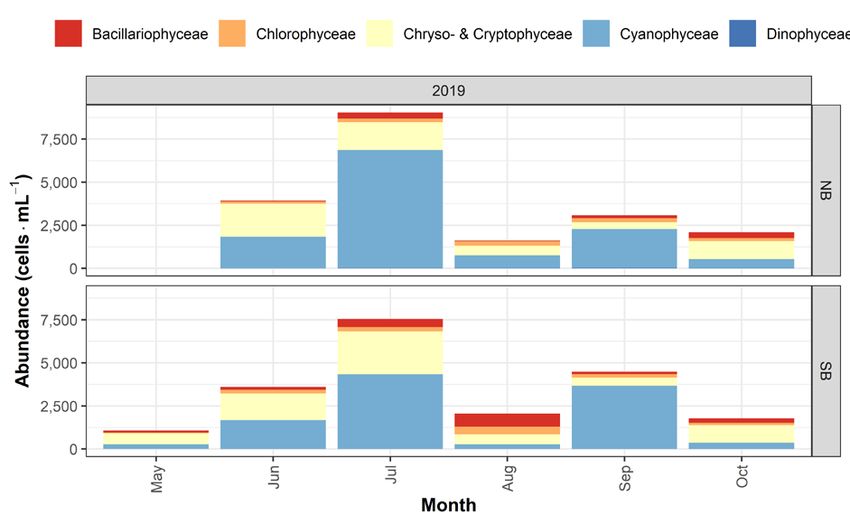
Figure 14. Low level orthophosphate concentrations (µg·L-1) from 1 m water chemistry samples at the
          north basin (NB) and south basin (SB) limnology stations May to October, 2019, Wahleach
          Reservoir, BC. ....................................................................................................................... 19

Figure 15. Total nitrogen concentrations (µg·L-1) from 1 m water chemistry samples at the north basin
          (NB) and south basin (SB) limnology stations May to October, 2019, Wahleach Reservoir, BC;
          horizontal lines represent seasonal means for each station. ................................................... 20

Figure 16. Low level nitrate + nitrite nitrogen concentrations (µg·L-1) from 1 m discrete water chemistry
          samples at the north basin (NB) and south basin (SB) limnology stations May to October, 2019,
          Wahleach Reservoir, BC; black dashed line at 20 µg·L-1 represents the limiting concentration
          for phytoplankton growth. ....................................................................................................... 21

Figure 17. Total nitrogen (TN) to total phosphorus (TP) ratios based on 1 m water chemistry samples
          from the north basin (NB) and the south basin (SB) limnology stations May to October, 2019,
          Wahleach Reservoir, BC. Points above dashed line at 50 were likely in a state of P limitation,
          while points below dashed line at 20 were likely in a state of N limitation (Guildford and Hecky
          2000). .................................................................................................................................... 21

Figure 18. Seasonal phytoplankton abundance (cells·mL-1) by class at the north basin (NB) and south
          basin (SB) limnology stations May to October, 2019, Wahleach Reservoir BC. No sample was
          collected in May at the north basin due to unfavourable sampling conditions. ......................... 23

Figure 19. Seasonal phytoplankton abundance (cells·mL-1) by edibility (E=edible, I=inedible, B= both
          edible and inedible forms) at the north basin (NB) and south basin (SB) limnology station May
          to October, 2019, Wahleach Reservoir, BC. No sample was collected in May at the north basin
          due to unfavourable sampling conditions. ............................................................................... 23

Figure 20. Seasonal phytoplankton biovolume (mm3·L-1) by class at the north basin (NB) and south basin
          (SB) limnology stations May to October, 2019, Wahleach Reservoir, BC. No sample was
          collected in May at the north basin due to unfavourable sampling conditions. ......................... 24

Figure 21. Seasonal phytoplankton biovolume (mm3.L-1) by edibility (E= edible, I=inedible, B= both edible
          and inedible forms) at the north basin (NB) and south basin (SB) limnology station May to
          October, 2019, Wahleach Reservoir, BC. No sample was collected in May at the north basin
          due to unfavourable sampling conditions. ............................................................................... 24

Figure 22. Monthly zooplankton density (individuals·L-1) by major group (Copepoda, Daphnia and other
          Cladocera) at the north basin (NB) and south basin (SB) limnology stations, 2019, Wahleach
          Reservoir, BC. ....................................................................................................................... 26

Figure 23. Monthly zooplankton biomass (µg·L-1) by major group (Copepoda, Daphnia and other
          Cladocera) at the north basin (NB) and south basin (SB) limnology stations, 2019, Wahleach
          Reservoir, BC. ....................................................................................................................... 26

Figure 24. Length frequency distribution by age class of Kokanee, 2019, Wahleach Reservoir, BC. ...... 28

Figure 25. Natural logarithm of length weight linear regression (LN W = LN a * LN Lb) of Kokanee, 2019,
          Wahleach Reservoir, BC. ....................................................................................................... 29

Wahleach Reservoir Nutrient Restoration Project, 2019                                                                                        viii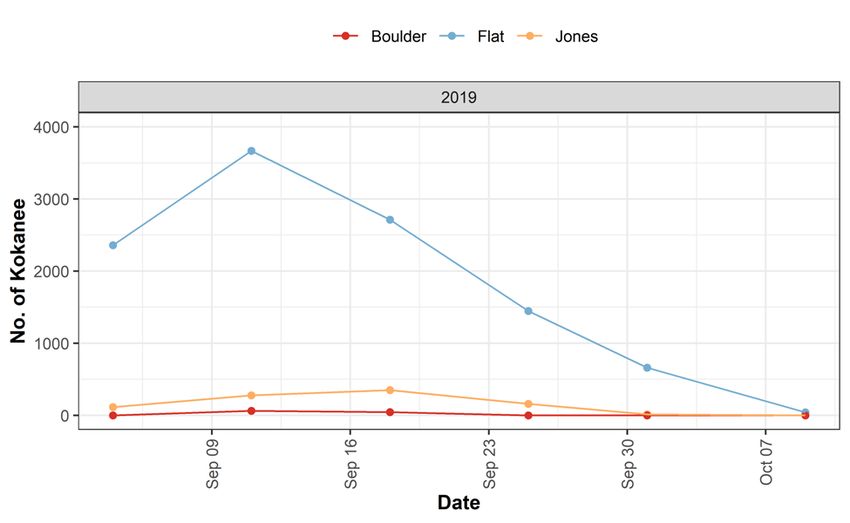
Figure 26. Kokanee spawner counts from each index stream (Boulder Creek, Flat Creek, and Jones
          Creek), 2019, Wahleach Reservoir, BC. ................................................................................. 30

Figure 27. Age frequency of Kokanee spawners in index streams (Boulder Creek, Flat Creek and Jones
          Creek), 2019, Wahleach Reservoir, BC. ................................................................................. 31

Figure 28. Length frequency distribution by age class of Kokanee spawners in index streams (Boulder
          Creek, Flat Creek and Jones Creek), 2019, Wahleach Reservoir, BC..................................... 31

Figure 29. Length frequency by age class of Rainbow Trout in fall nearshore gillnets, 2019, Wahleach
          Reservoir, BC. ....................................................................................................................... 33

Figure 30. Length weight plot and relationship (Ln W=b · Ln L + Ln a) of Rainbow Trout, 2019, Wahleach
          Reservoir, BC. ....................................................................................................................... 33

Figure 31. Length frequency of age classes of Cutthroat Trout in fall nearshore gillnets, 2019, Wahleach
          Reservoir, BC. ....................................................................................................................... 35

Figure 32. Length weight plot and relationship (Ln W = b · Ln L + Ln a) of Cutthroat Trout, 2019,
          Wahleach Reservoir, BC. ....................................................................................................... 35

Figure 33. Length frequency of Threespine Stickleback caught in fall 2019, Wahleach Reservoir, BC. .. 36

Figure 34. (a) Distribution of ‘All fish’ group densities by size group (small = -66 to -47 dB, large ≥ -46 dB)
          and depth layer based on hydroacoustic survey, 2019, Wahleach Reservoir, BC. (b)
          Distribution of Kokanee densities by size group (small = -55 to -47 dB, large ≥ -46 dB) and
          Kokanee depth layer (8-30 m) based on hydroacoustic survey, 2019, Wahleach Reservoir, BC.
          .............................................................................................................................................. 37

Wahleach Reservoir Nutrient Restoration Project, 2019                                                                                          ix
List of Tables
Table 1. Annual nutrient additions by weight and areal loading, 2019, Wahleach Reservoir, BC. ............. 5
Table 2. Locations of standard nearshore gillnet and minnow trap stations, 2019, Wahleach Reservoir,
BC. .......................................................................................................................................... 7
Table 3. Summary of equipment and conditions for hydroacoustic surveys, 2019, Wahleach Reservoir,
BC. .......................................................................................................................................... 8
Table 4. Summary of analysis parameters for hydroacoustic data, 2019, Wahleach Reservoir, BC........ 10
Table 5. Summary statistics for seasonal zooplankton density and biomass of each major group
(Copepoda, Daphnia and other Cladocera), 2019, Wahleach Reservoir, BC........................... 25
Table 6. Summary of fall nearshore gillnetting catch and percentage (%), 2019, Wahleach Reservoir, BC.
Species include Cutthroat Trout (CT), Rainbow Trout (RB), Kokanee (KO), and one unknown
Trout (UK) which could not be clearly identified due to consumption by Crayfish (Pacifastacus
leniusculus). .......................................................................................................................... 27
Table 7. Summary of fall nearshore gillnetting catch for standard RISC panels vs. 1.25” panel, 2019,
Wahleach Reservoir, BC. The 1.25” panel was added in 2014. ............................................. 27
Table 8. Summary of Kokanee biometric data, including length, weight, and condition factor (K), 2019,
Wahleach Reservoir, BC. ....................................................................................................... 28
Table 9. Summary of Kokanee biometrics by age, 2019, Wahleach Reservoir, BC. ................................ 28
Table 10. Summary of variables in R for Kokanee length weight relationships (Ln W = b · Ln L + Ln a),
2019, Wahleach Reservoir, BC. ............................................................................................. 29
Table 11. Summary of biometric data from spawning Kokanee collected during spawner surveys, 2019,
Wahleach Reservoir, BC. Data are for all three index streams (Boulder Creek, Flat Creek, and
Jones Creek) were combined as differences between systems were not significant. If fork
length (FL) was not measured for an individual, it was calculated based on a regression
equation (y = 1.3775x + 27.749, R² = 0.9578) for years (2003-2019) when both POHL and FL
were measured. ..................................................................................................................... 30
Table 12. Summary of Kokanee fork length by age, 2019, Wahleach Reservoir, BC............................... 30
Table 13. Summary of Rainbow Trout biometric data from fall nearshore gillnetting, including length,
weight, and condition factor (K), 2019, Wahleach Reservoir, BC. ........................................... 32
Table 14. Summary of Rainbow Trout biometrics by age, 2019, Wahleach Reservoir, BC. ..................... 32
Table 15. Summary of variables in R for Rainbow Trout length weight relationships (Ln W = b · Ln L + Ln
a), 2019, Wahleach Reservoir, BC. ........................................................................................ 34
Table 16. Summary of Cutthroat Trout biometric data, including length, weight, and condition factor (K),
2019, Wahleach Reservoir, BC. ............................................................................................. 34
Wahleach Reservoir Nutrient Restoration Project, 2019 xTable 17. Summary of Cutthroat Trout biometrics by age, 2019, Wahleach Reservoir, BC. .................... 34
Table 18. Summary of variables in R for Cutthroat Trout length weight relationships (Ln W = b · Ln L + Ln
a), 2019, Wahleach Reservoir, BC. Cutthroat Trout were not present in Wahleach Reservoir
prior to nutrient restoration. .................................................................................................... 36
Table 19. Summary of Threespine Stickleback length and weight data from minnow trapping, 2019,
Wahleach Reservoir, BC. ....................................................................................................... 36
Table 20. Population estimates with upper and lower confidence intervals for all fish and Kokanee based
on hydroacoustic survey, 2019, Wahleach Reservoir, BC. ...................................................... 38
Table 21. Trophic state classification using criteria defined by Wetzel (2001) and Wetzel (1983). Blue
shading is indicative of Trophic Classifications during nutrient restoration, 2019, Wahleach
Reservoir, BC. ....................................................................................................................... 39
Wahleach Reservoir Nutrient Restoration Project, 2019 xiList of Appendices
Appendix A. Phytoplankton species detected during 2019, Wahleach Reservoir, BC............................. 47
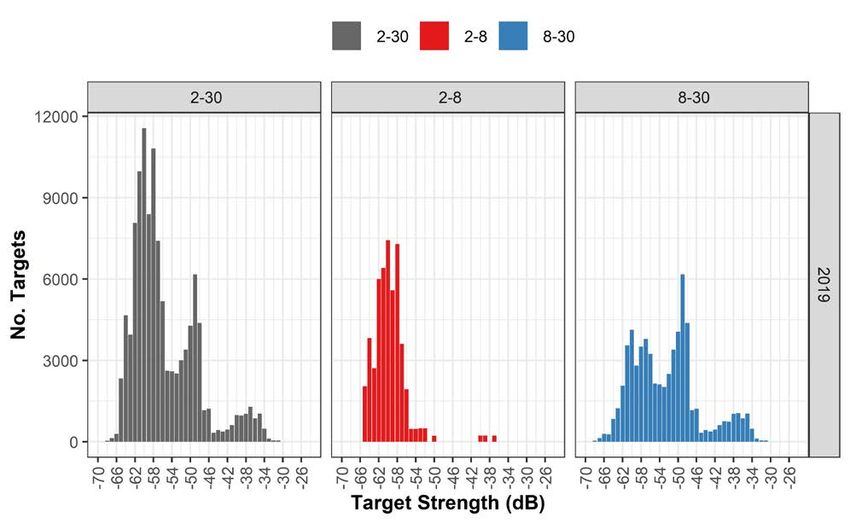
Appendix B. Target strength distributions by depth range (m) from hydroacoustic survey, 2019, Wahleach
Reservoir, BC. ....................................................................................................................... 48
Appendix C. Acoustic density distribution by size group (small = -55 to -47 dB, large ≥ -46 dB) and
transect, 2019, Wahleach Reservoir, BC. ............................................................................... 49
Appendix D. Zooplankton species detected during 2019, Wahleach Reservoir, BC. .............................. 49
Wahleach Reservoir Nutrient Restoration Project, 2019 xii1. Introduction The Wahleach Reservoir Nutrient Restoration Project was originally developed as part of a fisheries management strategy focused primarily on the restoration of Kokanee (Oncorhynchus nerka). The first phase of restoration was initiated in 1993, at a time when the recreational fishery on Wahleach Reservoir had collapsed; Rainbow Trout (O. mykiss) were
Restoration Project (WAHWORKS-2) until 2014 (BC Hydro 2004) when the WUP Order was to be
reviewed. The objective of the restoration project as stated in the WUP Terms of Reference (TOR) was
to restore and maintain the reservoir’s Kokanee population (BC Hydro 2005, 2006). Various monitoring
programs have been completed using an adaptive management approach to assess whether restoration
actions have been effective; these programs were generally outlined in the original TOR and in
subsequent revisions and addendums (BC Hydro 2005, 2006, 2008, 2010). Although the last year of the
WUP was scheduled for 2014, the Province and BC Hydro agreed that the project needed to continue
until completion of the WUP Order Review when a long-term decision on the project could be made. As
such, an addendum to the TOR was submitted to the Comptroller of Water Rights to continue the project
until the WUP Order Review is completed and was approved on April 27, 2015 (BC Hydro 2015). Due to
delays in the WUP Order Review process, a three-year Memorandum of Understanding (valid until
December 2020) was signed by BC Hydro and the Province to continue the project until the review is
completed.

This summary report presents data from the 2019 monitoring season.

2. Study Area
Wahleach Reservoir is located at 49°13’N, 121°36’W, approximately 100 km east of Vancouver, British
Columbia within the traditional territory of the Sto:lo First Nation (Figure 1). It has a drainage area of 88
km2 with elevations in the basin ranging from 640 m to 2,300 m. The reservoir was created for
hydroelectric power generation in 1953 with the construction of a dam at the original lake's outlet stream.
Wahleach Reservoir has a surface area of 460 ha, volume of 66 million m3, maximum depth of 29 m and
mean depth of 13.4 m. The maximum water surface elevation is 641.6 m (equal to the elevation of the
crest of the dam), and the minimum operating elevation is constrained at 628 m (BC Hydro 2004). Inflow
into the reservoir is largely uncontrolled occurring via the tributaries of upper Jones Creek, Flat Creek and
several unnamed streams. One of the main tributaries situated at the north end of the reservoir near the
dam is Boulder Creek. Boulder Creek has been modified with a berm and diversion channel to divert flow
from its natural channel (which originally flowed into lower Jones Creek below the dam) into the reservoir.
Flows can also be diverted back into the original Boulder Creek channel to meet flow requirements in
lower Jones Creek downstream of the dam. At the dam, discharge can be controlled through a water
release siphon to lower Jones Creek when the reservoir surface elevation is above 637 m; the dam
spillway is ungated and will freely spill when water levels are above the crest elevation. Discharge is also
controlled via a power intake and tunnel on the west side of the reservoir that is released into the Fraser
River in the Herrling Island Side Channel. Wahleach Reservoir is dimictic with two seasons of complete
mixing within the water column (spring and fall), and two seasons of thermal stratification (summer and
winter). Ice cover generally occurs from December through March. Fish species in Wahleach Reservoir
include: Kokanee, Rainbow Trout, sterile Cutthroat Trout and Threespine Stickleback.

Wahleach Reservoir Nutrient Restoration Project, 2019                                               2
6S

                                                                               - NB

                                                                       5S

                                                                         4F

                                                                                - SB

                                                    2F
                                                               3F

                                      1S

Figure 1. Map of Wahleach Reservoir, BC, including select sampling locations. LS2- SB and LS1-
NB are limnological sample locations and 1S, 2F, 3F, 4F, 5S, and 6S are gillnetting locations, with
S=Sinking net and F=Floating net. Bathymetric contour depths (m) represent the reservoir at full
pool.

Wahleach Reservoir Nutrient Restoration Project, 2019                                       3
3. Methodology All figures and analyses contained in this report were completed using R version 3.6.1 (R Core Team 2019). Supporting R packages included doBy and tidyverse. The reported long-term mean values were calculated for the duration of the Wahleach Reservoir Nutrient Restoration Project from 1993-2019. Values used in a comparative context represent baseline conditions from 1993-1994, and nutrient restoration conditions from 1995-2019. Summary statistics were reported as means ± standard deviations. Methods were consistent with those reported in Sarchuk et al. (2019a). 3.1 Restoration Treatments 3.1.1 Nutrient Additions Agricultural grade liquid ammonium polyphosphate (10-34-0: N-P2O5-K2O; % by weight) and urea- ammonium nitrate (28-0-0: N-P2O5-K2O; % by weight) were added on a weekly basis to Wahleach Reservoir from the first week of June (after thermal stratification) for a period of twenty weeks or until stratification in the reservoir had broken down. The ammonium polyphosphate and urea-ammonium nitrate were blended on-site immediately prior to dispensing. Seasonal ratios of fertilizer blends, timing of the additions, and total amounts added to the reservoir were adjusted seasonally to mimic natural spring phosphorus loadings, compensate for biological uptake of dissolved inorganic nitrogen, and maintain optimal nitrogen to phosphorus ratios for growth of edible phytoplankton. Based on recommendations by Perrin et al. (2006), planned annual phosphorus loading rates for Wahleach Reservoir in past years were kept near 200 mg P·m-2 to improve the production of Daphnia. Beginning in 2016 actual phosphorus loading rates were reduced to approximately half this rate to manage dissolved inorganic nitrogen concentrations and growth of undesirable phytoplankton species. Despite this reduction in phosphorous loading rates, no negative effects on Daphnia growth were observed (Sarchuk et al. 2019a). Nitrogen was added concurrently to keep epilimnetic concentrations above 20 µg∙L-1 (the concentration considered limiting to phytoplankton growth; Wetzel 2001), and to maintain suitable nitrogen to phosphorus ratios. Fertilizer additions during 2019 included nitrogen-only applications (weeks 5-7, 9 and 12) in an effort to prevent nitrogen limitation (Figure 2). Nutrient addition programs in British Columbia (i.e. Arrow Lakes, Kootenay Lake, Alouette Reservoir and Wahleach Reservoir) are adaptively managed based on the results of comprehensive monitoring programs delivered in concert with nutrient applications. In-season modifications are made based on in situ conditions of the system (e.g. Secchi disc transparencies, littoral algal accumulation, weather forecast) and results of the limnological monitoring program. While reservoir productivity is largely governed by nutrient loading, climate also strongly influences the ecosystem response. In 2019, no fertilization occurred during week 2 due to logistical issues (Figure 2, Table 1). During weeks 4 and 12 fertilization was cancelled after assessment of in situ conditions. Actual nutrient loading rates were modified in week 9 when phosphorus loading was omitted, again based on in situ conditions. Overall, weekly areal loading rates for phosphorus were greatest at the start of the season with a maximum of 12.3 mg P·m-2. Nitrogen loading increased rapidly during the first five weeks of the season with a maximum of 112 mg N·m-2 (Figure 2). The weekly molar nitrogen to phosphorus ratio peaked at 34.1 during the latter half of the season when both phosphorus and nitrogen loading rates were being ramped down (Figure 2). Wahleach Reservoir Nutrient Restoration Project, 2019 4
Figure 2. Seasonal planned and actual nutrient additions for Wahleach Reservoir, including areal
nitrogen and phosphorus loading as well as molar N:P ratios, 2019; planned values are
represented by hollow points and dashed line, while actual values are represented by solid points
and solid line.

Table 1. Annual nutrient additions by weight and areal loading, 2019, Wahleach Reservoir, BC.
    Year               Date Range                  Fertilizer           Total                Total
                                              10-34-0      28-0-0    Phosphorus             Nitrogen
                                                 t            t     Kg       mg·m-2       Kg       mg·m-2
    2019            7-Jun to 17-Sep            1.38        12.4     470       51.4       3,609        902

3.1.2   Fish Stocking

Stocking of sterile (triploid) Cutthroat Trout was continued to maintain top-down pressure on the
Threespine Stickleback population. In 2019, a total of 2,000 sterile (triploid) Cutthroat Trout (average
weight 85.38 g) were stocked into the reservoir. Stocking decisions are evaluated annually based on the
previous year’s monitoring results; specifically, indicators include the condition and growth of Cutthroat
Trout captured during the fall gillnetting program, as well as acoustic population estimates.

Wahleach Reservoir Nutrient Restoration Project, 2019                                             5
3.2 Monitoring 3.2.1 Climate Data were provided by BC Hydro. Analysis methods followed Sarchuk et al. (2019a). 3.2.2 Hydrometrics and Reservoir Operations Data were provided by BC Hydro. Analysis methods followed Sarchuk et al. (2019a). 3.2.3 Physical and Chemical Limnology Two sites were sampled monthly from May to October: one in the north at LS1 (EMS ID#E219070; also known as the north basin) and one in the south at LS2 (EMS ID#E219074; also known as the south basin; Figure 1). All physical and chemical limnology data, as well as phytoplankton and zooplankton data were collected from these locations. Parameters measured included water temperature and dissolved oxygen profiles, Secchi disc transparencies and water chemistry (i.e. dissolved and total nutrient concentrations). Discrete water chemistry samples were collected at 1 m (epilimnion) and 20 m (hypolimnion) and a depth- integrated sample of the epilimnion was also collected. All reported values, unless explicitly defined, were from the 1 m epilimnetic samples. Water chemistry samples were analyzed by ALS Laboratory in Burnaby, BC. Samples below detection limits were assigned a value equal to one half of the detection limit for analyses. For additional field sampling and analysis methods refer to Sarchuk et al. (2019a). 3.2.4 Phytoplankton Depth-integrated samples of the epilimnion were collected monthly from May to October using tygon tubing. Samples were then transferred to glass amber bottles and preserved with acid-Lugol’s solution. Samples were stored in a cool and dark location until analysis. In previous reports phytoplankton analysis was conducted by John Stockner, Eco-Logic Ltd; however, in 2019, analysis was performed by Darren Brandt, Advanced Eco-Solutions. Counts of phytoplankton cells by taxa were completed using an Olympus© inverted plankton microscope. Counting was completed by first examining several random fields (5-10) at low power (250x magnification) for large microplankton (20 to 200 µm), such as colonial diatoms, dinoflagellates, and filamentous blue-green algae. Second, all cells were counted within a single random transect 10 to 15 mm long at high power (900x magnification). High magnification allowed for quantitative enumeration of minute (
3.2.5     Zooplankton
Zooplankton sampling (duplicate 0-20 m vertical hauls) was conducted monthly from May to October
using a Wisconsin plankton net with 150 µm mesh. Samples were analyzed by taxa for density, biomass
and fecundity. Values are reported based on taxonomic groups: Daphnia spp. (order Cladocera), other
species belonging to the order Cladocera, and species belonging to the subclass Copepoda. For
additional field sampling and analysis methods, refer to Sarchuk et al. (2019a).

3.2.6     Fish Populations
Fish populations were assessed through a combination of different survey types: gillnet, minnow trap,
hydroacoustic, and spawner counts. A trawl survey was conducted for 2019 but was unsuccessful in
capturing targets. For simplification, abbreviated fish species names are used in tables and graphs; these
include Kokanee (KO), Rainbow Trout (RB), Cutthroat Trout (CT), and Threespine Stickleback (TSB).

3.2.6.1    Gillnet and Minnow Trap Surveys
Nearshore gillnet and minnow trap sampling sites are shown on Figure 1, with exact coordinates for 2019
in Table 2. Although exact coordinates may vary slightly, the general locations of sampling sites remain
consistent from year to year.

Table 2. Locations of standard nearshore gillnet and minnow trap stations, 2019, Wahleach
Reservoir, BC.
 Station        Gear    Latitude        Longitude       Station       Gear    Latitude      Longitude
 1S             GN      49°12.465 N     121°38.022 W    4F            GN      49°13.434 N   121°36.247 W
 2F             GN      49°13.213 N     121°37.173 W    5S            GN      49°14.139 N   121°36.232 W
 3F             GN      49°13.048 N     121°36.707 W    6S            GN      49°14.682 N   121°36.855 W
 1M             MT      49°14.039 N     121°37.120 W    4M            MT      49°13.427 N   121°37.141 W
 2M             MT      49°13.756 N     121°37.147 W    5M            MT      49°12.161 N   121°37.882 W
 3M             MT      49°13.356 N     121°37.143 W    6M            MT      49°12.141 N   121°37.851 W

Standardized annual nearshore gillnet sampling was completed after Kokanee spawners had moved out
of the reservoir from October 22 to 23, 2019. Each station was set with one standard seven panel gillnet
(measuring a total of 106.4 m long by 2.4 m deep) with mesh sizes of 25 mm, 89 mm, 51 mm, 76 mm, 38
mm, 64 mm, and 32 mm (i.e. 1", 3.5", 2", 3", 1.5", 2.5”, 1.25“). In 2014, the provincial standard net
composition changed to include a panel of 32 mm (1.25”) mesh to better sample fish in the age-1 size
range. All fish captured in the 32 mm mesh panel were recorded separately, so annual comparisons can
be made throughout the length of the monitoring data set.

Minnow trap sampling targeting Threespine Stickleback was completed at the same time as gillnet
sampling. In 2019, six minnow traps baited with salmon roe were set on the bottom of the reservoir in 1
to 3 m of water at standard littoral habitat stations.

For additional field sampling and analysis methods, refer to Sarchuk et al. (2019a).

Wahleach Reservoir Nutrient Restoration Project, 2019                                            7
3.2.6.2     Kokanee Spawner Surveys
Kokanee spawner escapement in three index streams - Boulder Creek, Flat Creek, and Jones Creek -
was estimated using standardized visual surveys. Surveys were conducted weekly on index streams
from September 4 to October 9, 2019. For additional field sampling and analysis methods, refer to
Sarchuk et al. (2019a).

3.2.6.3     Hydroacoustic Surveys
A hydroacoustic survey was completed in the summer within one week of the new moon along eleven
standardized transects (Figure 3, Table 3) using a Simrad EK60 120 kHz split beam system. Survey
conditions for 2019 are shown in Table 3. Additional details on field and analysis methods can be found
in Sarchuk et al. (2019a).

Table 3. Summary of equipment and conditions for hydroacoustic surveys, 2019, Wahleach
Reservoir, BC.
        Year               Survey Date                   Sounder                 Reservoir         Avg Transect
                                                                               Elevation1 (m)   Start/End Depth (m)
        2019                  August 7                     EK60                   639.55                8.1
1. Maximum elevation of 641.6 m (equivalent to the spillway crest elevation)

Wahleach Reservoir Nutrient Restoration Project, 2019                                                       8
Figure 3. Locations of standardized hydroacoustic transects, Wahleach Reservoir, BC. Population and Biomass Data were analyzed using Sonar 5 post processing software (version 606.16; Balk and Lindem 2019), from -70 dB to -24 dB, a target size range expected to include all fish within the Reservoir. Data were analyzed from the surface to reservoir bottom while applying a 0-2 m surface exclusion layer. Evaluation of the acoustic target distribution identified -66 dB as the minimum range of the fish size distribution (Appendix B); accordingly, the ‘All Fish’ population was defined as all targets >-66 dB from 2-30 m. The ‘All Fish data’ were separated into two components by visual identification of the inflection point where the more abundant small fish met the remainder of the distribution of larger fish; in 2019 the inflection point was -46 dB (Table 4). Within the ‘All Fish’ group, the small fish component (-66 to -47 dB) included age 0 Wahleach Reservoir Nutrient Restoration Project, 2019 9
Kokanee (i.e. fry) and Threespine Stickleback while the larger size group (≥ -46 dB) represented age ≥1
Kokanee, as well as lesser numbers of Cutthroat Trout and Rainbow Trout.
Acoustic data were then partitioned by depth and again by size to further differentiate between species
and refine the kokanee population estimates. Depth stratification of acoustic data assumed that targets
distributed where water temperatures were 5 mg∙L-1 were
primarily Kokanee, as supported by results of previous pelagic gillnetting and directed trawling (Sarchuk
et al. 2019a). In 2019, the depth range that met these criteria was 8-30 m. The acoustic distribution
within the Kokanee depth range of 8-30 m showed two modes within the small fish component;
accordingly, to further refine the age 0 Kokanee population estimate a lower threshold was set at -55 dB
to omit the smaller Threespine Stickleback targets. This partitioning was supported by trawl data from
previous years that demonstrated size differences between the majority of Threespine Stickleback and
age 0 Kokanee, where the Kokanee are generally larger. Appendix C illustrates the acoustic target size
distributions portioned by depth, and Table 4 summarizes the depth and size criteria applied. In this
report, the 8-30 m estimates are referred to simply as Kokanee populations, specifically age 0 Kokanee
and as age ≥1 Kokanee and all Kokanee (all ages combined).
Table 4. Summary of analysis parameters for hydroacoustic data, 2019, Wahleach Reservoir, BC.
Analysis Depth Small Fish (Age 0) Large Fish (Age ≥1+)
Group
Range (m) Kokanee dB Thresholds Kokanee dB Thresholds
All Fish 2-30 -66 to -47 ≥ -46
Kokanee 8-30 -55 to -47 ≥ -46
Fish populations were estimated with confidence intervals using a stochastic simulation approach (a
Monte Carlo method). Simulations were done in R (R Core Team 2019), producing estimates for all fish
size categories within the reservoir, as well as within the Kokanee depth range. Additional details can be
found in Sarchuk et al. (2019a).
Initial biomass (kg) estimates for Wahleach Reservoir were presented in detail in Sarchuk et al. (2019a);
methods were based on a novel approach developed specifically for Wahleach Reservoir and vary from
typical biomass estimates reported by the Province for other large lakes and reservoirs in BC. Biomass
densities (kg/ha) were not reported for this reason. Methods for this report were consistent with the
approach taken in Sarchuk et al. (2019a).
4. Results
4.1 Hydrometrics and Reservoir Operations
4.1.1 Inflow
Mean daily inflow into Wahleach Reservoir during 2019 was 4.6 ± 3.3 m3·s-1 (range 0.8 to 35.4 m3 s-1),
which was lower than the long-term mean of 6.2 ± 5.4 m3·s-1 (range 0 to 96.1 m3·s-1). During the nutrient
addition period (June to September, inclusive), mean daily inflow was 4.2 ± 2.2 m3·s-1 (range 1.6 to 15.0
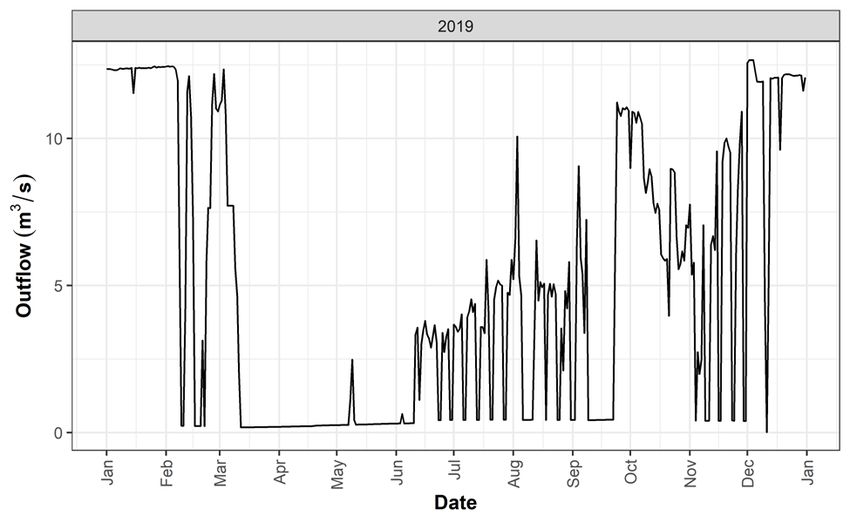
Wahleach Reservoir Nutrient Restoration Project, 2019 10m3·s-1). Peak flows were observed during spring freshet, while consistently high flows were also observed during the fall and winter storm season (Figure 4). Figure 4. Daily inflow (m3·s-1), 2019, Wahleach Reservoir, BC. Dashed line is the long-term mean from 1993-2019 for daily inflows. 4.1.2 Discharge Mean daily discharge from Wahleach Reservoir in 2019 was 5.1 ± 4.8 m3·s-1 (range 0 to 12.7 m3·s-1), which was lower than the long-term mean of 6.2 ± 4.7 m3·s-1 (range 0 to 78.6 m3·s-1). During the nutrient addition period, mean daily discharge was 3.3 ± 2.9 m3·s-1 (range 0.3 to 11.2 m3·s-1). Figure 5 shows the annual pattern in discharge, which was highly variable. Generally, discharge was the greatest during high inflow periods associated with fall and winter storms, as well as during spring freshet. Wahleach Reservoir Nutrient Restoration Project, 2019 11
Figure 5. Daily discharge (m3·s-1), 2019, Wahleach Reservoir, BC.

4.1.3   Reservoir Elevation
Wahleach Reservoir typically reaches its minimum water elevation during the month of April or May; the
reservoir is recharged during the annual spring freshet, reaching its maximum water elevation during June
or July (which corresponds with the onset of nutrient additions), and then the reservoir is slowly drawn
down until April or May the following year. Surface water elevations are generally stable throughout the
nutrient addition season, as was observed during 2019; however, particularly low reservoir levels were
observed in March when the reservoir elevation fell below the minimum standard operating level of 628
m. The drawdown was 15.8 m in 2019, which was higher than the long-term (1993-2019) mean of 12.1 m
(Figure 6).

Wahleach Reservoir Nutrient Restoration Project, 2019                                           12
Figure 6. Daily reservoir surface elevation (m, Geodetic Survey of Canada), 2019, Wahleach
Reservoir, BC. Open circles represent limnology sampling dates. The red dashed line represents
minimum operating level of 628 m.

4.2 Climate
4.2.1   Air Temperature
Seasonal air temperatures in 2019 were highest in July and lowest in February (Figure 7). Overall, the
mean daily temperature in 2019 (7.0 ± 7.0°C, range -15.7 to 30.2°C) was similar to the long-term mean
(7.1 ± 6.8°C, range -22.3 to 33.9°C). During the nutrient addition period (June through September), mean
daily temperature was 14.0 ± 3.3°C (range 1.5 to 30.2°C), which was similar to the long-term mean (14.2
± 3.9°C, range 0.8 to 33.9 °C).

4.2.2   Precipitation
Precipitation generally followed the inverse trend of air temperature; May through August had low
precipitation while the fall and winter months generally had high precipitation (Figure 8). Rainfall was
highest in April during spring freshet. In 2019, mean daily (6 ± 11 mm, range 0 to 76 mm) precipitation
was similar to the long-term mean of 7 ± 13 mm (range 0 to 130 mm), but mean monthly precipitation was
lower at 174 ± 98 mm (range 58 to 345 mm) compared to the long-term mean of 217 ± 123 mm (range 7
to 733 mm). A total of 2,084 mm of precipitation fell in 2019, which was the lowest annual precipitation on
record and less than the long-term mean of 2,605 ± 283 mm (range 2,084 to 3,124 mm). During the
nutrient addition period (June through September), the daily and monthly means for precipitation in 2019
were 4 ± 9 mm (0 to 46 mm) and 134 ± 68 mm (58 to 224 mm), respectively, which were similar to the
long-term means of 4 ± 9 mm (0 to 114 mm), and 124 ± 76 mm (8 to 335 mm), respectively. Total

Wahleach Reservoir Nutrient Restoration Project, 2019                                             13
seasonal precipitation during the nutrient addition period in 2019 was 537 mm, which was also similar to
the long-term mean (495 ± 126 mm, range 202 to 746 mm).

Figure 7. Boxplot of daily mean air temperatures (°C) during each month, 2019, Wahleach
Reservoir, BC. Black dots represent outliers.

Wahleach Reservoir Nutrient Restoration Project, 2019                                            14
Figure 8. Boxplot of daily total precipitation (mm) during each month, 2019, Wahleach Reservoir,
BC. Black dots represent outliers.

4.3 Physical and Chemical Limnology
Wahleach Reservoir exhibits a seasonal pattern of thermal stratification typical of higher elevation
temperate systems (Wetzel 2001), as shown in Figure 9. A thermocline begins to develop in June with
strong thermal stratification in July and August, and then stratification begins to weaken by September.
Generally, the water column is well-mixed (isothermal) in the spring (May) and fall (October). In 2019, the
thermocline ranged between 3-15 m (Figure 9). Water temperatures were similar between the north
basin and the south basin with a combined mean temperature of 12.6 ± 3.1°C (range 8.3 to 19.5°C) for
the upper 20 m of the water column. No instances of water temperatures at or above 25°C were
observed, which is the lethal temperature for most resident salmonids (Ford et al. 1995).

Mean dissolved oxygen concentration in 2019 for both basins combined was 9.0 ± 1.4 mg∙L-1 (range 3.9
to 11.2 mg∙L-1) for the upper 20 m of the water column. During the latter half of the growing season,
dissolved oxygen concentrations in the lower depths (>14 m) of the hypolimnion were often below 6.5
mg∙L-1 (Figure 9). This is below the federal guidelines for dissolved oxygen in cold water lakes for
salmonid early life stages (9.5 mg∙L-1) and other life stages (6.5 mg∙L-1; CCME 1999); however, negative
impacts to the fish population are unlikely as the majority of the water column was consistently at
sufficient dissolved oxygen concentrations.

Wahleach Reservoir Nutrient Restoration Project, 2019                                             15
Figure 9. Water temperature (°C) and dissolved oxygen (mg∙L-1) profiles at the north basin (NB-
LS1) and south basin (SB-LS2) limnology sampling stations May to October, 2019, Wahleach
Reservoir, BC.

The pH in Wahleach Reservoir, as taken from 1-m water samples, was neutral with a mean of 7.3 ± 0.1
(range 7.2 to 7.4; Figure 10), which was similar to baseline pH levels (7.1 ± 0.3, range 6.6 to 7.8).
Alkalinity is the buffering capacity of water to resist changes in pH and involves the inorganic carbon
components present in most freshwater (Wetzel 2001). Alkalinity in Wahleach Reservoir had a mean of
10.8 ± 0.6 mg CaCO3.L-1 (range 9.7 to 11.6 mg CaCO3.L-1) in 2019 (Figure 11); this was lower than
alkalinity measured in 1993 (13.8 ± 2.4 mg CaCO3.L-1, range 11.7 to 16.5 mg CaCO3.L-1) but higher than
the long-term mean of 9.9 ± 1.7 mg CaCO3.L-1 (range 4 to 16.5 mg CaCO3.L-1). Alkalinity values of less
than 10 are considered to have high chemical sensitivity to acidic inputs, while values between 10-20 are
considered moderately sensitive (Swain 1987).

Secchi disk transparencies during 2019 averaged 5.5 ± 1.1 m (range 4.1 to 7.4 m) and were similar
between the two basins (Figure 12). This year’s average was shallower compared to the 1994 baseline
average of 7.0 ± 0.4 m (range 6.2 to 7.6 m).

Wahleach Reservoir Nutrient Restoration Project, 2019                                            16
You can also read


