RENAISSANCE survey on renewable energies and community-based solutions - survey report
←
→
Page content transcription
If your browser does not render page correctly, please read the page content below

survey report
RENAISSANCE survey
on renewable energies
and community-based
solutions

Rebecca Hueting (Deep Blue Italy)
                            Margherita Minissi (Deep Blue Italy)
                               Daniele Ruscio (Deep Blue Italy)
                           Alessandra Tedeschi (Deep Blue Italy)
                         Maria Luisa Lode (Vrije Universiteit Brussel)

This project has received funding from the European Union’s H2020 research and innovation programme under the grant agreement No 824342.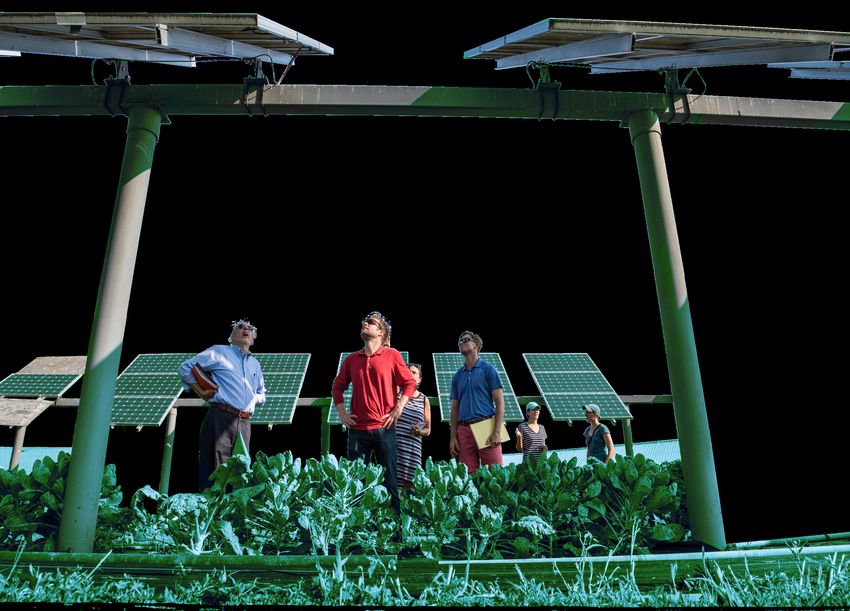
source: https://www.pexels.com// || author: Pixabay

RENAISSANCE survey on renewable energies and community-based solutions - Glossy Report

Table of contents
EXECUTIVE SUMMARY                                                                     7
  1.1. Why a survey on the RENAISSANCE approach acceptance?                           7
  1.2. Survey distribution                                                           8
  1.3. Survey design                                                                 9
  1.4. Methodology                                                                   11
   1.4.1. Expected Outcomes                                                         13
   1.4.2. Target                                                                    13
  1.5. Survey analysis                                                               15
   1.5.1. BACKGROUND INFORMATION                                                     15
   1.5.2. SECTION I – AWARENESS                                                      19
   1.5.3. SECTION II – LOCAL, NATIONAL AND EUROPEAN POLICIES                        26
   1.5.4. SECTION III – PERCEIVED RISKS                                             34
   1.5.5. SECTION IV – PERCEIVED BENEFITS                                            41
   1.5.6. SECTION V – BUSINESS MODELS                                               45
   1.5.7. SECTION VI – SOCIAL CONTEXT                                               49
   1.5.8. SECTION VII – ACCEPTANCE                                                  53
  1.6. Main findings and recommendations                                            57
  1.7. Conclusions                                                                  57
Annex I: Business models descriptions                                               59
Annex II: Links to the full translatted texts of the survey                         62

                                                                                          4
source: https://www.pexels.com// || author: Gustavo Fring

RENAISSANCE survey on renewable energies and community-based solutions - Glossy Report

1   PROJECT OVERVIEW

    The RENAISSANCE project is an Innovation Action (IA) funded by
    the European Commission under the Horizon 2020 programme.
    RENAISSANCE aim is to deliver a community-driven scalable and
    replicable approach, to implement new business models and
    technologies supporting clean production and shared distribution
    of energy in local communities. In the first phase the Consortium
    collected data to identify stable and equitable business cases in
    four Local Energy Communities (LEC) across Europe. The resulting
    scenarios supported the co-design of the ReEnergise tool, which
    will help identifying the optimal configuration for integrated and
    decarbonised Local Energy Systems (LES).

    The tool will be tested in each Pilot Site and followed by a financial
    viability assessment. Thereafter an innovative platform for the
    integrated management and value delivery across all actors will
    be implemented in each pilot and interoperability realised. As a
    consequence, the energy communities at demonstrator sites will be
    fully connected and the use of RES will likely increase beyond 27%.

    In the last phase, the RENAISSANCE approach will be simulated under
    market conditions connecting 10 sites across the globe, to demonstrate
    its scalability and replicability potential.

      “Renaissance project supports the shift from technology-driven
      approaches to consumer-driven approaches, fostering the activation
      of communities”

                                                                                              6
1. PROJECT OVERVIEW         RENAISSANCE survey on renewable energies and community-based solutions - Glossy Report

 EXECUTIVE SUMMARY         Within the RENAISSANCE project context, in                    LOCATE YOUR CAMERA
                           addition to technical and economic aspects,                   ON THE QR CODES
                           it is deemed essential to include an analysis of
                                                                                         PROVIDED TO EXPLORE
                           the social aspects that influence the acceptance
                                                                                         THE ANIMATED PROJECT
                           of clean technologies and measures, including
                                                                                         PRESENTATION IN HTML
                           renewable energy generation technologies.
                           Technologies        that   are   technically      and         AND THE LATEST NEWS
                           economically feasible in a given context may                  ABOUT THE PROJECT
                           not be successfully implemented due to social
                           resistance, lack of awareness of the technology,
                           low engagement and so forth. This survey on
                           social acceptance of potential end-users (pilot
                           sites inhabitants, stakeholders, further energy
                           market actors involved) has a two-fold role: it allows
                           identifying end-users needs while also offering
                           an initial set of information which can guide them
                           through the energy transition process. Last but
                           not least, the survey is a substantial part of the
                           wider RENAISSANCE stakeholder engagement
                           strategy, which includes several workshops,
                           institutional events, video-interviews, webinars
                           and gamified data collection.

                              WHAT IS SOCIAL ACCEPTANCE?

                              Social or public acceptance is generally defined, as a positive
                              attitude towards a technology or measure, which leads to supporting
                              behaviour if needed or requested, and the counteracting of resistance
                              by others.

                           Renewable energy communities are going to be a reality in Europe soon,
 1.1 Why a survey on the   pushed by the recent Clean Energy Directive approved in late 2019. The EU
 RENAISSANCE approach
                           Commission is showing an increasing commitment towards sustainability
 acceptance?
                           and several European projects are purposely focusing on direct consumers’
                           engagement in the energy transition.
                           Connected energy communities are the key players in the RENAISSANCE
                           project, which explores and tests in real-life conditions the innovative
                           business models and technologies towards a prosumer-consumer future
                           energy market.
                           The RENAISSANCE survey on renewable energies and community-based
                           solutions assesses European citizens awareness and expectations
                           concerning emerging business models in the energy market: Local Energy
                           Communities (LECs) and Renewable Energy Communities (RECs).

                                                                                                                     7
1. PROJECT OVERVIEW          RENAISSANCE survey on renewable energies and community-based solutions - Glossy Report

                              WHAT ARE THE MOST RECENT UPDATES CONCERNING ENERGY
                              COMMUNITIES IN EUROPE?

                              The directive “Clean energy for all Europeans” obliges Member
                              States to ensure a more competitive, customer-centred, flexible and
                              non-discriminatory EU electricity market with market-based supply
                              prices. It strengthens existing customer rights, introduces new ones
                              and provides a framework for energy communities of prosumers.
                              Currently Member States are working on the transposition of the
                              Directive into national regulations.

                              WHAT DOES “PROSUMER” MEAN?

                              In the context of renewable energies, a prosumer is someone
                              that both consumes and produces energy, mainly based on
                              distributed systems installed in households or within minigrid
                              community networks.

  1.2 Survey distribution   The "Survey on social acceptance of RENAISSANCE solutions" assessed
                            the social aspects influencing the acceptance of renewables, including
                            local energy generation technologies. Moreover, the survey promoted the
                            awareness on renewable energy generation systems and on regulatory
                            measures activated in the European Union to facilitate the energy
                            transition. Its main objective is to compare awareness and acceptance
                            levels and track how they change over time across different segments
                            of respondents, distributed in European Member States. To this aim the
                            survey has been translated in 6 different European languages and its
                            distribution was planned in three different phases of the project:

                            FIRST RUN (May-June 2020): a first version of the survey was distributed in
                            early 2020 and it offered insights from the early stages of implementation
                            of RENAISSANCE solutions. The results are presented in this report and
                            they represent a baseline both for general awareness and acceptance of
                            recent European energy directives and of the specific solutions proposed
                            by RENAISSANCE.

                            SECOND RUN (November-January 2021): the survey will be distributed a
                            second time, this time focusing on the pilot sites stakeholders segment,
                            especially local energy consumers, in order to assess if and how their
                            attitude shows substantial differences compared to the full set of
                            respondents. From this second set of answers the project will gain a
                            consolidated overview of most relevant awareness and acceptance
                            indicators, resulting not only in a validation of the engagement strategies
                            put in place by the project, but more importantly how awareness and
                            acceptance levels change over time.
                            THIRD RUN (end of 2021): towards the end of the project the survey will be
                            distributed once again to the wide public and to pilot sites stakeholders,
                            to receive final insights about awareness and acceptance levels. Indeed,
                            while on one hand respondents not directly involved in the project will
                            likely show unvaried trends, on the other those participating in pilot sites
                            activities and all other involved actors (ESG members, project’s followers,
                            researchers) will hopefully disclose higher levels of awareness and interest.

                                                                                                                      8
1. PROJECT OVERVIEW                RENAISSANCE survey on renewable energies and community-based solutions - Glossy Report

  1.3 Survey design               We referred to Wüstenhagen et al.1, and the 3 main sub-components of
                                  social acceptance, forming the so-called “triangle of social acceptance”:

                                  Community acceptance

                                  Market acceptance

                                  Socio-political acceptance

                                  From the recent literature²³⁴ we derived the most relevant aspects
                                  influencing social acceptance in all the 3 above-mentioned components.

                                  Awareness
                             1    Awareness of environmental and energy problems (climate change,
                                  pollution, energy consumption, etc.)
                             2    Energy production and distribution issues perception
                             3    Knowledge of the technology/innovative business models and regulations
                             4    Efficacy of the technology/innovative business models and regulations

                                  Local Context influencing decision making
                             5    Social norms and community influence (herding behaviour, are your
                                  neighbour/friends/colleagues/relatives in favour and/or adopting the
                                  technology?))

                             6    Facilitating conditions (public incentives/discounts)
                             7    Trust in decision-makers and other relevant stakeholders;
                             8    Fairness of the decision-making process

                                  Individual factors influencing decision making
                             9    Perceived costs in implementing the technology
                             10
                                  Perceived risks in implementing the technology
                            11    Perceived benefits and usefulness in implementing the technology

                                  Acceptance and Adoption
                            12
                                  Citizen acceptance: in favour               of     public   innovations,      collective
                                  implementation of technologies
                            13
                                  Consumer acceptance: Intention to use and adopt the technology;

1 Wüstenhagen, Rolf, Maarten Wolsink, and Mary Jean Bürer. "Social acceptance of renewable energy innovation: An
  introduction to the concept." Energy policy 35.5 (2007): 2683-2691.
2 Polimp.eu - 1ST POLICY BRIEF June 2014 Acceleration of clean technology deployment within https://climatepolicyinfohub.eu/

3 The social acceptance of wind energy, Ellis Geraint, Ferraro Gianluca, JRC, 2016

4 Huijts, Nicole MA, Eric JE Molin, and Linda Steg. “Psychological factors influencing sustainable energy technology
  acceptance: A review-based comprehensive framework.” Renewable and sustainable energy reviews 16.1 (2012): 525-531.

                                                                                                                            9
RENAISSANCE survey on renewable energies and community-based solutions - Glossy Report

Starting from questionnaires developed by Moula, Munjur et al.5, complemented also with additional
questions67 to cover all the dimensions above, we developed the following questionnaire to assess
social acceptance of renewable energies and of innovative community-based production and
consumption models.

Moreover, we refer directly to proceedings of Intergrid project, more specifically to their D1.4 Design
of Consumer’s Engagement Strategies , where the project identifies as a main barrier to citizens’
engagement and acceptance the fact that users are not aware of how energy systems work and that
providing such information in advance may contribute to device solutions for potential problems
(Natural Resources, 2014).

source: https://www.comreg.ie/

5 Moula, Md Munjur E., et al. “Researching social acceptability of renewable energy technologies in Finland.” International
  Journal of Sustainable Built Environment 2.1 (2013): 89-98.

6 http://unfccc.org.mk/content/FBUR/Climate%20change%20survey%20FBUR.pdf

7 https://www.questionpro.com/survey-templates/climate-change-awareness-survey-template/

                                                                                                                              10
1. PROJECT OVERVIEW RENAISSANCE survey on renewable energies and community-based solutions - Glossy Report
1.4 Methodology The online survey was distributed via the Survey Monkey platform. See 1.4.3
for details on the recruitment strategies used to build the sample.
The survey was composed of 47 questions, organised around the factor
described in the section 1.3.
The survey presented 6 multiple-choice questions, 25 items requiring the
respondent to declare the level of agreement on a 5-point Likert scale,
7 items that required the respondent to rank the order of perceived
importance of elements and 9 open-ended response.
Example of items can be seen in the table below (TABLE 1).
Example of
Item Category Example of item
response
Multiple Choice Among the following Geothermal
energy sources, please Natural Gas
select the ones you Biofuels
think are renewable: Biomass
Hydroelectric
Coal
Oil
Wind
Nuclear
Solar
Likert-Scale “I would switch to 1-Very unlikely
renewable-only energy 2-Unlikely
providers, if it would 3-Neither likely nor
result in a slightly unlikely
higher bill” 4-Likely
5-Very likely
Ranking Among the following [#] Hidden or unknown
risks, please rank costs.
the ones which [#] Too much hassle to
would prevent you switch.
from switching to a [#] Low maturity of
renewable energy-only service
provider. [#] Market resulting
from the most in lower quality of
impactful service.
(1st) to the least (5th): [#] Transparency
issues and distributive
justice.
Open-ended Do you want to Free-text box
comment or add
something concerning
the above scenarios?
Table 1. Example of Items
5 Moula, Md Munjur E., et al. "Researching social acceptability of renewable energy technologies in Finland." International
Journal of Sustainable Built Environment 2.1 (2013): 89-98.
6 http://unfccc.org.mk/content/FBUR/Climate%20change%20survey%20FBUR.pdf
7 https://www.questionpro.com/survey-templates/climate-change-awareness-survey-template/
8 https://integrid-h2020.eu/uploads/public_deliverables/D1.4%20Consumers%20engagement%20strategies.pdf last visited on
20/12/2020
11RENAISSANCE survey on renewable energies and community-based solutions - Glossy Report
The first part of the survey introduced the project and the aims of the survey as well as all the
references to privacy policy, consent forms and GDPR compliance pages and information (Figure 1).
Figure 1. Example of the survey's User Interface.
The second section collected 10 socio-demographic variables (such as: gender, age, country, level
of education and other background information, like household composition). This information was
analysed in an aggregated and anonymised way, in order to cluster the response of the factors in
the analysis part.
The third part of the survey would collect 9 questions about the Awareness factor; 10 questions
about national and local policies; 3 on individual decision making; 7 on perceived risks and benefits;
3 on social context and 3 on acceptance; as well as final 2 questions on the communication channel
that were used to contact the respondent.
All of the questions in the second and third part of the survey were mandatory, so the respondent
could not proceed with the survey, if some item was not responded to. To partially mitigate this
effect, the option “other” and open-ended questions were always inserted, to enable the respondent
to express additional information or comments and integrate their responses.
The survey has been distributed in seven different European languages from 28th April 2020 until
31st July 2020. The sample size of the first run (See section 1.2) was N=212 respondents.
Additional information on the sample size will be detailed in the section 1.5.1.1 Background Information.
The plan for the statistical analysis is presented in section 1.5 Survey Analysis.
12RENAISSANCE survey on renewable energies and community-based solutions - Glossy Report
The comparison between initial and final answers, collected among the
1.4.1 Expected Outcomes different segments of respondents, will inform the project Consortium
about the project success in terms of:
Awareness level concerning renewables and energy communities
Acceptance level concerning renewables and energy communities
Customer engagement level linked to specific business models
Overall assessment of the project dissemination strategy
Both citizens and energy stakeholders will benefit of the results. We strongly
believe stakeholder engagement is truly efficient only if bottom-up flow of
information is ensured, since it shortens the distance among the expert
community and citizens. Indeed, it encourages the exchange of knowledge,
needs and ambitions.
This questionnaire was distributed across a wide basin of respondents:
1.4.2. Target
General audience
Pilot sites stakeholders
European citizens, entrepreneurs and industry representatives
Consortium members’ contacts and networks
The scientific community of experts in the energy sector
Decision makers and policy makers
In order to reach out for our targeted audience, 4 main groups were used
as first points of contact:
The European pilot sites stakeholders (inhabitants, enterprises and
industry representatives, ESG members including policy experts via
direct email)
The International pilot sites stakeholders (inhabitants, enterprises and
industry representatives, via promotional email)
The Consortium members’ contacts and networks (via direct e-mail)
The project followers (via project website, newsletter and social media
channels)
The energy related online press agencies (press release)
Email networking
The invitation to participate to the survey was circulated broadly via a Mail
Delivery Platform to all newsletter subscribers and within the Consortium.
Press release
In April 2020 a press release was circulated among project partners, who
took care of translating and sharing the news with local press agencies
and online news providers. The launch was also promoted via the EU
research results platform Cordis.Europa.eu news section9.
9 https://cordis.europa.eu/article/id/418036-renaissance-survey-on-renewable-energy-and-community-solutions-how-much-
do-you-know-about-ren
13RENAISSANCE survey on renewable energies and community-based solutions - Glossy Report
Social media
To ensure widespread distribution of the survey we selected a set of hype keywords already used on
social media when informing the audience about surveys or engagement activities about energy
topics. A press-kit was developed using a recognizable graphic identity and QR codes have been
provided for each translated version of the survey (Figure 2 and Figure 3).
Figure 2. LinkendIn promotional social card
Figure 3. Twitter promotional social card
14RENAISSANCE survey on renewable energies and community-based solutions - Glossy Report
1.5 Survey analysis This section introduces the general Statistical Analysis Plan, together
with the results of the statistical analysis. Depending on the nature of the
variable considered, the data analysis process can be described as follows:
Calculate descriptive statistics for both independent (IV) and all
dependent variables (DV). More precisely the IV and IV considered for
the different analysis are described in paragraphs: 1.5.1.2, 1.5.1.3, 1.5.1.4,
1.5.1.5, 1.5.1.6, 1.5.1.7 and 1.5.1.8.
For Independent variables: split group on median split / quartile
split will be performed, in order to reduce the levels for independent
variables for inferential analysis. The main independent variables are
described in the section 1.5.1.1 Background Information
For the variable to be ranked: the Mode of the most frequent ranked
position will be calculated
For the Multiple-choices answers: frequencies will be calculated, along
with Chi-Squared, analysis to assess the statistical significance of the
difference in the observed cases, for different IV (median-splitted).
For the Likert scales: perform descriptive and inferential analysis:
General Linear Model (GLM), repeated measures on multiple
dependent variables.
The open-ended questions will be used to gain insight for the colcusions.
Details on the statistical analysis performed for each variables, together
with the results, are presented in the 1.5.1.1- to 1.5.1.8 sections, while the
Discussions are presented in Section1.6 and the Conclusions will be
presented in Section 1.7.
The background information section collected information such as age,
1.5.1 BACKGROUND
country of residence, level of education and socio-economic context.
INFORMATION
The questions focused on aspects which could influence individual
behaviour related to energy procurement. Namely age, income, level of
education, residing country, population density of the surrounding area,
and type of energy consumer have been identified as key factors.
Age and Gender
Age and Gender distribution of the respondent can be seen in Table 3, which
shows that the overall sample covered gender in almost balanced way (42% Male,
57% Female, 1% Other). Age distribution presented more than 10 responders
for each cell, and it reached almost the 50% percentile by responders younger
than 34 years (cumulate percentage: 46%) while the rest of responders can be
described as older than 34 years old (cumulate percentage: 54%). Thus, 35
years old will be used to split in two the independent variable “age” into equally
distributed levels: Younger responders (34 years old). It must be, then, noted that “older responders” in the context
of the present research accounts mainly responders aged between 35 and
64 years old (cumulate percentage: 94%), while older than 65 years included
in the “older responders” category, represent 6% of the overall sample. Age x
Gender interaction did not produced an equally distributed categorisation
X2 (1, N=210) = 6.553, p = .010), lacking in male respondents older than 54 years
old, compared to female responders of the same age-range. For this reason,
when Gender and Age will be used as Independent Variables, the “Gender x
Age” interaction effect will not be included in the Multivariate Model, but Age,
recoded in two levels (younger vs. older responders), and Gender (Male vs.
Female), as main effects only (Figure 2).
15RENAISSANCE survey on renewable energies and community-based solutions - Glossy Report
Other Total Cumulative
Age Female Male Percentage
Gender Frequency Percentage
18-24 7 13 1 21 10% 10%
25-34 39 37 1 77 36% 46%
35-44 29 24 0 53 25% 71%
45-54 19 7 0 26 12% 84%
55-64 16 7 0 23 11% 94%
65+ 11 1 0 12 6% 100%
Total 121 89 2 212 100% 100%
Table 2. Age and Gender distribution
Figure 4. Age and Gender distribution
Education
Almost all respondents’ education level varied between bachelor degrees’ and PhD (Cumulative
Percentage: 90%). More precisely “College diploma/Bachelor degree or higher” is, by far, the most frequent
category (Mode: N=170), followed by “Doctorate” (N=20) and “Secondary school/Upper secondary” (N=18).
No statistical differences were noted in the Gender x Education distributions X2 (12, N=210) = 9.572, p =
.653), as it can be seen in Figure 5.
Figure 5. Gender x Education interaction
16RENAISSANCE survey on renewable energies and community-based solutions - Glossy Report
Type of consumers
The full sample was composed almost entirely by household consumers (Mode: N=128), tenants/ leasehold
consumers (N=57) and landowner consumers (N=21): all categories with similar power behaviours. No
industrial or commercial consumers participated in this first run of the survey (Figure 6).
Figure 6. Among the following energy consumer types, which one
best represents your current position?
Geographical Area
In terms of residing country, the geographical distribution of the responders is shown in Figure 7 a
and 7b. Looking at the variance of the distribution, two main geographical groups could be identified
(Table 3), since some degree of polarization emerged around topics related with policies awareness
and perception of risks and benefits. The group hereafter called “Northern Group” (N=97) included
respondents from Germany, The Netherlands, United Kingdom, Belgium, Switzerland, Poland, France.
The group hereafter called “Southern Group” (N=114) included Albania, Slovenia, Hungary, Italy,
Bulgaria, Portugal, Spain, Greece. It must be noted that it can not be possible within this resarch to
determine wether this data-driven polarization depends directly on the difference between northen
vs southern climatic areas, or if it is rather related with socio-economic conditions such as GDP pro
capita. Most likely it is related with both, plus other complex motivations such as power-distance and
trust in institutions and regulations. As it can be seen from Table 3, the geographical distribution
of the respondent is not perfectly even by region and performing a t-test for unique sample, the
two levels appear to differ significantly in distribution t(211) = 45.515, p = .001 (North < South). To allow
inferential statistics, correction for homogeneity of the groups will be considered.
Figure 7a. Geographical distributions of respondents Figure 7b. Geographical distributions of respondents
10 A slight correspondence with the two groups can be identified across countries with GDP pro capita below or above 35.000$
source: https://ourworldindata.org/grapher/average-real-gdp-per-capita-across-countries-and-
regions?tab=table&time=2016..latest®ion=Europe
17RENAISSANCE survey on renewable energies and community-based solutions - Glossy Report
Region Country Frequency Region Country Frequency
Poland 44 Italy 51
Belgium 28 Spain 35
The Netherlands 6 Greece 19
France 5 Portugal 3
Northern Germany 5 Southern Bulgaria 2
Switzerland 4 Slovenia 2
U.S.A. 2 Angola 1
United Kingdom 2 Albania 1
Hungary 1
Total 97 Total 114
Table 3. Geographical distributions by region Table 3.1. Geographical distributions by region
Also, two groups based on the population density of the surroundings of living area were identified,
since choices related to innovative solutions for renewable energy systems were plausibly expected to
differ among high density areas and low to intermediate density areas.
The respondents live mainly in densely populated area (Mode: N=113) and intermediate density area
(N=81), while the minority of the sample lives in thinly populated area (N=18).
In order to use “Density” as a two-level independent variable, the Intermediate and thinly populated
areas categories were considered together in order to create an equally distributed variable: High
Density (N=113) vs. Low Density (N=99) areas.
Income
Regarding the annual net income, the distribution of the Annual net income is represented in Figure
8. The most frequent category is represented by respondents with an annual net income between
€15,000 and €29,999 (N=70). The 75% of the overall sample declare an Annual income net inferior to
€50,000, while 11% of the sample prefer not to answer to this question.
Figure 8. Annual net income
Current Knowledge of Renewable Energy
When asked to select, among a list, only the renewable energy sources, participants responded as
visible in Figure 9. The most frequently selected Renewable Energy Source was “Solar” (N=193), followed
by “Wind” (N=189), “Hydroelectric” (N=177) and “Geothermal” (N=160) that presented no ambiguous
judgement by the overall sample (more than 75% of correct answers). On the other hand, “Biofuel” and
“Biomass” were more controversial, as almost 50% of the overall sample considered them Renewable
and 50% Non-renewable.
Finally, Nuclear, Natural Gas, Oil and Coil, were correctly identified as non-renewable energy sources
by almost the entire sample.
18RENAISSANCE survey on renewable energies and community-based solutions - Glossy Report
Figure 9. Current knowledge of Renewable Energy Sources
The first section of the survey involved questions about awareness of the
1.5.2. SECTION I –
environmental issues, of the current incentives toward a more sustainable
AWARENESS
energy production model and the general awareness about renewable
energies.
Concern of Global Issues
The first awareness-item asked to express, on a 5-point Likert scale, the
concern about a list of global issues. The average concern for each global
issue is shown in Figure 10. Climate change is considered, by far, the most
concerning issue by the respondents (M=4.7, SD=1.0), followed by poverty (M=3.7,
SD=1.3). A group with equally concerning global issues followed, composed
by: Violence/War (M=3.5, SD=1.3), Economic situation (M=3.4, SD=1.1), Infectious
Diseases (M=3.4, SD=1.3), Unemployment (M=3.3, SD=1.3), Overpopulation
(M=3.0, SD=1.5). Finally, a group of less concerning global issue was identified
by the respondent in: Terrorism (M=2.4, SD=1.4) and Crime (M=2.4, SD=1.4). It
must be noted that the survey was launched before the COVID-19 pandemic.
Figure 10. Average ranking of importance for global risks
19RENAISSANCE survey on renewable energies and community-based solutions - Glossy Report
A repeated multivariate analysis of variance (MANOVA) for Gender, Age and Geographical area was
performed on the rating of Global Issues (9-level variable). The average difference in the concern
demonstrated significant difference among the different issues, with Climate Change as being
significantly considered more concerning than the other F(8,179)=41.689, p=.001, ηp2=.196. As it can be
seen from Table 4, there were no significant differences in the concern among male and females
F(8,179)=.837, p=.570, ηp2=.005 nor for younger and older respondents F(8,179)=.519, p=.843, ηp2=.003.
However, significant difference in the concerns for global issues were found for Northern vs. Southern
areas F(6.8,179)=3.024, p=.004, ηp2=.017.
Partial Eta Observed
Variables df F Sig.
Squared Power
Assuming
8 41.692 .000 .196 1.000
Sphericity
Global Issues Huynh-
6.825 41.692 .000 .196 1.000
Feldt
Assuming
Gender 8 .837 .570 .005 .397
Sphericity
Assuming
Age 8 .519 .843 .003 .245
Sphericity
Geographical Huynh-
6.825 3.024 .004 .017 .937
Area Feldt
Table 4. Multivariate Analysis for Global Issues Variance
Partial Eta squared indicate a small significance, but looking at contrast analysis, it appears that
Southern countries are more concerned compared to Northern countries to the following issues:
Unemployment F(1,179)=19.188, p=.001; Economic Situation F(1,179)=11.040, p=.001; Poverty F(1,179)=10.197,
p=.002; Infectious Diseases F(1,179)=6.269, p=.013; and also Climate Change F(1,179)=4.289, p=.040 ( Figure 11).
We assume such higher concern of the Southern Europe respondents derives from the actual harsher
conditions in those Member States.
Figure 11. Global Issue concerns for Geographical Areas
NOTE
The survey was open from April 2020 until the end of July 2020, exactly in the middle of the first
global wave of Covid-19 disease. Climate change and global violence were considered more
important despite the huge impact of the pandemic bulletins and restrictions on people’s
daily lives. Further evaluation of the above indicators in the near future would allow a direct
evaluation of how the level of concern changes across time.
20RENAISSANCE survey on renewable energies and community-based solutions - Glossy Report
Concern of Environmental Issues
The second item deepens the analysis looking at the environmental issues of most concern, asking
the respondents to express their concerns on a series of specific environmental issue (Table 5).
Cumulate Percentage
M SD Sum 25% 50% 75%
Rising of
4.31 .98 771 4.0 5.0 5.0
temperatures
Air pollution 4.24 .84 759 4.0 4.0 5.0
Environmental
resource 4.21 .86 753 4.0 4.0 5.0
exploitation
Pollution of rivers
4.21 .85 753 4.0 4.0 5.0
and seas
Loss of
4.19 .95 750 4.0 4.0 5.0
biodiversity
Waste disposal 3.98 .94 713 3.0 4.0 5.0
Soil pollution 3.89 .95 697 3.0 4.0 5.0
Extreme weather
3.85 1.04 690 3.0 4.0 5.0
conditions
Acidification of
3.59 1.06 642 3.0 4.0 4.0
rain and oceans
Traffic 3.35 1.06 600 3.0 3.0 4.0
congestions
Table 5. Environmental Issues rated as Most Concerning
A Repeated multivariate analysis of variance (MANOVA) performed for Gender, Age and Geographical
area was performed on the rating of Environmental Issues (10-level variable). The average difference in the
concern demonstrated significant difference among the different issues, F(9,179)=29.275, p=.001, ηp2=.146. No
statistical differences emerged for the Independent variables Gender, Age or Geographical Area (Table 6),
meaning that no influence of such variables is present when considering environmental issues.
21RENAISSANCE survey on renewable energies and community-based solutions - Glossy Report
Partial Eta Observed
Variables df F Sig.
Squared Power
Assuming
9 29.275 .000 .146 1.000
Sphericity
Environmental
Issues Huynh-Feldt 8.057 29.275 .000 .16 1.000
Assuming
Gender 9 1.374 .195 .008 .674
Sphericity
Assuming
Age 9 .417 .926 .002 .211
Sphericity
Geographical
Huynh-Feldt 8.057 .867 .544 .005 .413
Area
Table 6. Multivariate Analysis of Environmental Issues Concerns
Considering the answers to the previous question about the global issues of most concern (See
“Concern of Global Issue”), it was possible to divide the sample in respondents that presented high
scores when evaluating their level of concern for Climate change vs. lower scores on the topic. The
objective of this analysis is that of assessing if a different level of concern has any relevant influence
on the perceived impact of current energy system on the environment and on the individual opinion
about who should take the first steps towards the energy transition to renewables.
The “higher concern” group (HC) includes all the respondents who ranked as high importance the issue
of climate change (N=152 respondents), while the “lower concern” group (LC) gave a low importance
ranking to climate change (N=30 respondents). The numerosity of the two groups is unbalanced, so no
inferential analysis was performed, yet this distinction was taken into consideration when presenting
the results of the specific environmental issue concerns Descriptive Statistics (Figure 12).
Figure 12. Average ranking of environmental issues of most concern – Q16
The most interesting differences between the two groups are visible in the level of concern related
with Rising of temperatures, acidifications of rain and oceans, and extreme weather conditions.
Such issues are considered by lc group less concerning than loss of biodiversity, pollution of rivers
and seas and traffic congestion. The HC group, instead, selected the rising of temperatures as the
most concerning environmental issues. Numbers suggest that projects, such as RENAISSANCE and
scientific dissemination at large, do not only have to inform their target audience about specific topics
or detailed research objectives: bridging knowledge and attempting correlations between different
phaenomena (e.g. between acidification of rain and oceans, soil pollution and the extensive extraction
22RENAISSANCE survey on renewable energies and community-based solutions - Glossy Report
and use of fossil fuels) is an important responsibility to support a more holistic comprehension of
our planet’s complex echosystems.
Perceived impact of the current energy production model on the environmental issues
Figure 13. Perceived importance of the current energy production model on the environmental issues - Q17
When it comes to the perceived impact of energy production a polarization between the HC and LC
responders emerges. Figure 13 shows how the level of concern about environmental issues influences
perception: 44.7% of the HC group tend to believe that the production model is extremely important
in impacting climate change, while only 6.7% of LC group tends to considers it as important.
Nevertheless, the majority of respondents are aware that the production of energy has a strong
impact on the environment, no matter how concerned they are.
USEFUL REFERENCES
https://ec.europa.eu/energy/topics/energy-efficiency/energy-efficient-buildings/energy-
performance-buildings-directive_en
23RENAISSANCE survey on renewable energies and community-based solutions - Glossy Report
First steps towards renewable energy production
As last question of this section, respondents were asked: “Who should take the first step towards
renewable energy production models” (Multiple-choiche). Most respondents (141) answered that
the national policy makers should be the firsts to commit for a more sustainable future, followed
by energy producers (99) and regional policy makers (62), while the least are environmental groups
and energy distributors.
Regulators (national and regional policy makers) are mentioned basically by 50% of the sample
and together with energy producers they represent the 75% of the actors that are believed to be
in charge taking the first steps. European regulators are paying more and more attention to the
requests and needs of the stakeholders, especially those coming from the civil society and rely on
the European research results and public consultations. This survey is confirming the expectations
that citizens have on the regulatory bodies. Nevertheless, a large part of respondents expect
energy producers to do their part, recognizing the responsibility of investors in that sense.
Figure 14. Who should take the first steps towards renewable energy production models – Q20
Analysing the answers of respondents belonging to differently populated areas (High Density N=113 vs.
Low Density N=99) it is noticeable that people living in high density areas, consider the national policy
makers hold larger responsibility compared to the people living in low density areas. The latter, on the
other hand, gives more importance to the regional policy makers, even though, in absolute terms, this
category is considered less important (Figure 15).
Figure 15. Actors considered responsible for taking first actions on sustainable models by population density
24RENAISSANCE survey on renewable energies and community-based solutions - Glossy Report
Conclusions
1 Despite the Covid-19 pandemic, Climate Change is the most concerning global issue.
2 Respondents with lower concern of Climate Change, rank the pollution of soil and water,
notably caused by human activities, as the environmental issues of most concern.
3 The majority of respondents are aware that the production of energy has a strong impact on
the environment, no matter how concerned they are about the environmental issues.
4 The majority of respondents think that first Policy Makers and Energy Producers should take
the first steps in the energy transition.
5 People living in rural areas do expect more impactful action from regional policy makers,
while people living in higher density areas rely more on National bodies.
source: https://www.pexels.com// || author: Rodolfo Clix
25RENAISSANCE survey on renewable energies and community-based solutions - Glossy Report
The section II of the survey focuses on the awareness about existing
1.5.3. SECTION II –
incentives and facilitating measures both at the national and local level.
LOCAL, NATIONAL AND
The aim was find out if there is a gap between the current policies and the
EUROPEAN POLICIES
level of awareness of citizens about their existence.
Local Initiatives
Figure 16. Awareness about the existence of local initiatives supporting renewable energy
production – Q21
In the above chart we can see the general awareness regarding the
initiatives supporting the energy transition. One the one hand it can be
considered a positive trend that almost 54% of respondents knows there
are initiatives, no matter if they recall their content and names or not. On
the other hand, as much as 31% is not aware of any existing initiatives and
14% of the respondents believes there are no initiatives at all (Figure 16).
Table 8 shows the distribution on the awareness of local initiatives, divided
per independent variables. Performing Chi-Squared analysis on the
distributions of the response to these questions, showed that there are no
differences in the responses neither for Age X2 (4, N=172) = 8,512, p = .075;
Geography X2 (4, N=172) = 6,268, p = .180; nor Population Density X2 (4, N=172) =
4,792, p = .309.
26RENAISSANCE survey on renewable energies and community-based solutions - Glossy Report
Population
Age Geography
Density
Low High
Younger Older Northern Southern
Density Density
There are no
10% 13% 12% 11% 13% 10%
initiatives
I am not
aware
39% 29% 32% 39% 32% 40%
of any
initiatives
Total
49% 42% 44% 50% 45% 50%
(Unaware)
There
are some
initiatives,
10% 6% 9% 9% 5% 12%
but I can
not recall
the name
There
are some
initiatives
and I know 16% 35% 30% 16% 24% 19%
the names
but not the
content
There
are some
initiatives
25% 17% 17% 26% 27% 19%
and I know
the names
and content
Total
41% 52% 47% 42% 51% 38%
(Aware)
Table 7. Distribution of respondent on awareness of initiatives
27RENAISSANCE survey on renewable energies and community-based solutions - Glossy Report
The fact that there are no differences in the distribution among different categories, can be explained
by the fact that almost half of the Younger respondents state that there are no initiatives, or are not
aware of any initiatives (49%) and 51% of the Younger respondents is aware of the initiatives (name
and/or content), and in a similar way 42% of the Older respondents are not aware of initiatives and
58% are aware (name and/or content). The same goes for Geography and Density.
To this concern, it would be important to reinforce communication strategies targeted for specific
initiatives, since there are no significant general trends, overall, to explain differences in awareness
levels. Each initiative should be promoted at different levels and channels in order to ensure citizens
are aware of all available options for the energy transition or, in case they are not in place, support
their development. To go the extra mile, it is worth mentioning how systemic and behavioural change
strategies at the individual, collective and societal level have to be activated, in order to engage
European Citizens on the long-term and empower them as proactive members of the transition.
Local Communities
When asked about the number one issues and the decisions they would like to be more involved-in when
renewable energy production systems are introduced, the majority of respondents (58%) agreed that the
most important decision-making process in which local communities should be involved is the assessment
of the “environmental impact”. All the other decision making processes did not reach the 50% agreement
level: “social aspects” (both risks and benefits) was the second most agreed process (47%) followed by “health
and safety concerns” (45%). “Siting issues” reached the lower agreement score, yet is worth mentioning that
a lower score does not mean at all that they are of no interest at all. (Table 8).
In your opinion, in which
decision making processes
should local communities be Yes No
more involved in?
Siting issues
(property value, disruption of 39% 61%
place).
Environmental impact. 58% 42%
Health and safety concerns. 45% 55%
Societal risks and benefits. 47% 53%
Table 8. Involvement of Local Communities
source: https://www.giuffrefrancislefebvre.it/ || author: Sefa Ozel
28RENAISSANCE survey on renewable energies and community-based solutions - Glossy Report
No significant differences were found in the Chi-Squared analysis on the levels of different Independent
Variables considered, showing that there is a level of agreement that goes beyond differences in
Population Density (high vs. low density), Income Range (high vs. low income), Geography Area (northern
vs. southern), nor Age (younger vs. older) (Table 9).
Population
Chi-Squared Income Range Geography Age
Density
analysis
X2 p X2 p X2 p X2 p
Siting issues
(property
value, .046 .830 .018 .894 1.414 .234 .001 .971
disruption
of place).
Environmental
.000 .994 .331 .565 .343 .558 .908 .341
impact.
Health
and safety 3.103 .078 .041 .840 .001 .973 .661 .416
concerns.
Societal risks
.004 .949 1.563 .211 1.166 .280 .024 .876
and benefits.
Table 9. Chi-Squared analysis on Ind. Variables levels for involvement of Communities
Public incentives and facilitating measures
Concerning the perceived number of National initiatives that work as incentives for consumers
transition to renewable energy sources, 23% of the respondents believes that there are no initiatives
or she/he is not aware of them, while an additional 20% knows that initiatives exist, but the content
is unknown to her/him. The remaining 57% of the sample, instead is aware and proactive about the
incentives for consumer transition (Figure 17). Considering the 57% of the respondents that are aware
of National Initiatives, 88% of them believe that the number of incentives or facilitating measures
supporting consumers' transitions to renewable energy sources in their country is too little or
moderate, while only 12% believe that the incentives are a lot or a great deal (Figure 18).
Figure 17. Awareness of National Initiatives for consumers transition to renewable energy sources
29RENAISSANCE survey on renewable energies and community-based solutions - Glossy Report
Figure 18. Perceived amount of incentives at National Level
When considering the independent variables impact in an Univariate analysis of the Variance, no
significant differences appears on the “national initiatives” (Table 10), neither for Age (younger vs.
older), Population Density (high vs. low), Geographical Area (north vs. south) nor Income (high vs. low).
Independent Partial Eta Observed
df F Sig.
Variable Squared Power
Geographical
1 2.958 .089 .031 .398
Area
Age Group 1 .740 .392 .008 .136
Population
1 .065 .799 .001 .057
Density
Income 1 .292 .590 .003 .083
Table 10. Statistical difference in Variance Distribution for National Initiatives
"Clean Energy for All Europeans" Directive
When asked about their knowledge about the
existence of the directive "CLEAN ENERGY FOR
ALL EUROPEANS" approved in 2019, 54% of
respondents declared to be aware about it, while
46% declared she/he is not aware of it (Figure 19).
NOTE
The Clean Energy for All Europeans12 obliges
Member States to ensure a more competitive,
consumer-centered, flexible and non-
discriminatory EU electricity market with
market-based supply prices. The package
consists of eight legislative acts and they
must be transposed into national laws of EU
countries within 2 years from its approval by
the EU parliament. Figure 19. Awareness of the Clean Energy for All Europeans
directive – Q24
12 https://ec.europa.eu/energy/topics/energy-strategy/clean-energy-all-europeans_en
30RENAISSANCE survey on renewable energies and community-based solutions - Glossy Report
Table 11 shows that there are no differences in the awareness of the directive among groups with
different Income range, Geography and Population density Areas, but for Age X2 (1, N=172) = 4,124,
p = .042. The awareness of the directive, in fact resulted significantly unequally distribute in the Age
groups, with Younger responders NOT being aware of the directive significantly more compared to the
Older responders, significantly more aware of the directive. No other independent variables were able
to explain the variance of frequency in a significant way.
Population Density Income Range Geography Age
Chi-Squared
analysis X2 p X2 p X2 p X2 p
Awareness
of the “Clean
Energy for All .156 .693 .069 .792 .519 .471 4.124 042
Europeans”
Directive
Table 11. Chi-Squared analysis for Directive Awareness, on Ind. Variables levels
Figure 20. Significant difference in Clean Energy for All Europeanst awareness by Age groups
Regarding the perceived importance of such directive, it must be noted that 75% of the sample
considered the Directive as “Very” or “Extremely” important, while only 2% of the sample consider the
directive as not “so” or important “at all”. Similar distribution can be found among the respondents
that were previously aware of the directive, before being introduced to it by the survey, as in the ones
that previously were not aware of the directive, before reading its brief description and links at this
point of the survey: both groups consider the directive extremely and very important, and that opinion
is significantly higher than the ones that do not consider it important, which are the very minority,
in both conditions X2 (5, N=172) = 18,175, p = .003. It can, also, be noted that the relative majority of the
respondents that considered the Directive very important were the ones that previously were not
aware about it. (Figure 21).
31RENAISSANCE survey on renewable energies and community-based solutions - Glossy Report
Figure 21. Perceived importance of the Directive
As a conclusion, an evenly distributed weak knowledge regarding measures supporting the transition
to a sustainable energy system doesn’t derive from a low consideration of the importance of such
initiative but most likely from the unclear amount of existing ones or, more significantly, from the lack
of appropriate information about them.
32RENAISSANCE survey on renewable energies and community-based solutions - Glossy Report
Conclusions
1 Almost half of respondents, independently from their age, income or geographic distribution,
are not aware of any existing local or regional initiatives and 10% to 13% of the respondents
believes there are no initiatives at all. Such data clearly indicates there are gaps in the
effective citizens’ outreach by such initiatives.
2 Respondents agree on the need for a higher involvement of local communities into decision-making
processes when it comes to environmental impact, followed by societal risks and benefits.
3 A vast majority of respondents believe that the amount of incentives or facilitating measures
for the consumers’ transition to renewable energy sources are moderate to low.
4 All respondents, previously aware of the Directive or not, consider it extremely or very
important. Plus, the relative majority of the responders that considered the Directive very
important were the ones that previously were not aware about it.
source: https://www.pexels.com// || author: slon_dot_pics
33RENAISSANCE survey on renewable energies and community-based solutions - Glossy Report
The section III of the survey focuses on the perceived risks preventing
1.5.4. SECTION III –
respondents to switch to renewable energy technologies.
PERCEIVED RISKS
Economic drivers for changing to a renewable energy only provider only
In general, as expected, the participants would be more likely to switch to a
renewable energy provider, if that would involve lower costs (Figure 22).
Figure 22 I would switch to renewable-only energy provider if.. – Q34
A Repeated multivariate analysis of variance (MANOVA) for Income, Age
Population density and Geographical Area was performed on the driver
“cost on the bills” (3-level variable: Less, Unvaried, Higher costs). Table 13
shows that the levels “cost of bills” are indeed impacting significantly the
decisions F(2, 124), F= 10.997, p= .001, ηp2=.092.
Partial
Observed
Variables df F Sig. Eta
Power
Squared
Assuming
2 10.997 .000 .092 .991
Sphericity
Cost of Bills
Huynh-
1.778 10.997 .000 .092 .984
Feldt
Population Assuming
2 .791 .455 .007 .184
Density Sphericity
Assuming
Income 2 1.303 .274 .012 .280
Sphericity
Huynh-
Geography 1.778 4.538 .015 .040 .732
Feldt
Assuming
Age 2 1.074 .344 .010 .237
Sphericity
Table 12. Multivariate Analysis for cost on the bill factor
34RENAISSANCE survey on renewable energies and community-based solutions - Glossy Report
Looking closely at age ranges, people belonging to the 45Y group
(Figure 23), but the difference was not significant.
However, a significant difference can be found when considering the Geographical Area of the
respondents: while both Northern and Southern Europe respondents agree that “Less Expensive” bills
are the first driver, a significant difference appears for the “Unvaried costs”, with Southern respondents
more willing to accept no variances in price for renewable only supplier, while Northern respondents
less keen to accept unchanged or higher bills (Figure 24).
Figure 23. Driver of cost of the bills before switching to a renewable only energy
provider by Age Group – Q34
Figure 24. Driver of cost of the bills before switching to a renewable only energy provider by
Geographical Area
35RENAISSANCE survey on renewable energies and community-based solutions - Glossy Report
Switching to a renewable energy only provider
In terms of ranking of “Risks preventing acceptance to switch to a renewable energy only provider”, on
average, respondents ranked as the first blockers the hidden or unknown costs (Mode = 1st); followed by
transparency issues (Mode = 2nd) and fear of lower maturity of services (Mode = 2nd).
Considering the ranking as a continuous scale (four-point Likert scale on agreement of the main
risk) a repeated multivariate analysis of variance (MANOVA) for income, age population density and
geographical area was performed on the switch-risks identified (4-level variable: low maturity of service;
hidden or unknown costs; too much hassle to switch; transparency issues). Table 13 shows that the
levels “cost of bills” are indeed impacting significantly the decisions F(2, 124), F= 6.708, p= .001, ηp2=.057.
More precisely Geography Area is, once again, a significant factor, with Southern respondents overall
fearing most the cost, and Northern respondents fearing significantly lower quality services (Figure 25).
Partial
Observed
Variables df F Sig. Eta
Power
Squared
Assuming
3 6.708 .000 .057 .974
Sphericity
Cost of Bills
Huynh-
2.888 6.708 .000 .057 .971
Feldt
Population Assuming
3 .401 .752 .004 .129
Density Sphericity
Assuming
Income 3 2.151 .094 .019 .546
Sphericity
Huynh-
Geography 2.888 3.095 .029 .027 .708
Feldt
Assuming
Age 3 .355 .785 .003 .120
Sphericity
Table 13. Multivariate Analysis for “switch risks” factor
Figure 25. Ranking of the top risks before switching to a renewable-only energy provider by
Geographical Area – Q35
36RENAISSANCE survey on renewable energies and community-based solutions - Glossy Report
Install small or medium sized renewable production systems in own property
The metrics show a detailed description of the most impactful risks tied to the possibility to install a
small to medium sized renewable energy production system in own property (e.g. photovoltaic panel).
Figure 26 shows the ranking of the main perceived impact, with high maintenance costs as first,
followed by environmental and safety concerns.
Figure 26. Ranking of the top risks preventing installation of
a small renewable energy production system in own property
(Mode) – Q36
Considering the ranking as a continuous scale (six-point Likert scale on agreement of the main
impact), a repeated multivariate analysis of variance (MANOVA) for Income, Age Population density
and geographical area was performed on the Impact of the risks identified (6-level variable: Safety;
high maintenance costs; aesthetical; environmental; health; hassle). Table 14 shows the different risk
factors are indeed impacting in a different way on the the decisions F(5, 124), F= 4.451, p= .001, ηp2=.039.
No additional significant differences were found when considering Age, Geographical Area, Population
density nor Income (Figure 27).
Partial
Observed
Variables df F Sig. Eta
Power
Squared
Assuming
5 4.451 .001 .039 .970
Sphericity
Impact
Huynh-
5.000 4.451 .001 .039 .970
Feldt
Population Assuming
5 .453 .811 .004 .172
Density Sphericity
Assuming
Income 5 1.001 .417 .009 .359
Sphericity
Huynh-
Geography 5.000 1.870 .098 .017 .638
Feldt
Assuming
Age 5 .408 .844 .004 .158
Sphericity
Table 14. Multivariate Analysis for Impact of the risks factors on istallation
37RENAISSANCE survey on renewable energies and community-based solutions - Glossy Report
Figure 27. Ranking of the top risks preventing installation of a small renewable energy production system in own property
by Age and Geographical Area
In general, looking at the non statistically-significant tendencies, the high maintenance costs tend
to be the most impactful risks taken in consideration by Northern and Southern European citizens,
followed by safety and health concerns equally distributed between the two geographic groups. In
fourth position there are the environmental concerns, on which the Northern countries show higher
sensitivity. The difficulties to switch to a renewable energy system tend to be more concerning for the
youngers of the Southern Europe, while the aesthetical issues are taken in higher consideration from
the elders of Northern Europe, almost as much as the environmental issues.
Accept a local medium renewable production plant for collective consumption
When asked to imagine that a renewable energy production plant was going to be built in the local
village/neighbourhood for collective consumption of local community (Figure 28) the main risks ranked
as the ones that would prevent them from accepting such decision were hidden or unknown costs and
health (e.g. glare effect, noise and infrasound, electromagnetism) impact, followed by safety concerns
(e.g. potential adverse events related to malfunctions and/or damaged systems).
Figure 28. Risks preventing the acceptance of a small to
medium renewable energy production plant in own village/
neighbourhood for collective consumption (Mode) – Q37
38You can also read