Dynamics of pattern formation and emergence of swarming in Caenorhabditis elegans - eLife
←
→
Page content transcription
If your browser does not render page correctly, please read the page content below
RESEARCH ARTICLE

                                     Dynamics of pattern formation and
                                     emergence of swarming in Caenorhabditis
                                     elegans
                                     Esin Demir1†, Y Ilker Yaman2†, Mustafa Basaran1, Askin Kocabas1,2,3,4*
                                     1
                                      Bio-Medical Sciences and Engineering Program, Koç University, Sarıyer, Istanbul,
                                     Turkey; 2Department of Physics, Koç University, Sarıyer, Istanbul, Turkey; 3Koç
                                     University Surface Science and Technology Center, Koç University, Sarıyer, Istanbul,
                                     Turkey; 4Koç University Research Center for Translational Medicine, Koç University,
                                     Sarıyer, Istanbul, Turkey

                                     Abstract Many animals collectively form complex patterns to tackle environmental difficulties.
                                     Several biological and physical factors, such as animal motility, population densities, and chemical
                                     cues, play significant roles in this process. However, very little is known about how sensory
                                     information interplays with these factors and controls the dynamics of pattern formation. Here, we
                                     study the direct relation between oxygen sensing, pattern formation, and emergence of swarming
                                     in active Caenorhabditis elegans aggregates. We find that when thousands of animals gather on
                                     food, bacteria-mediated decrease in oxygen level slows down the animals and triggers motility-
                                     induced phase separation. Three coupled factors—bacterial accumulation, aerotaxis, and
                                     population density—act together and control the entire dynamics. Furthermore, we find that
                                     biofilm-forming bacterial lawns including Bacillus subtilis and Pseudomonas aeruginosa strongly
                                     alter the collective dynamics due to the limited diffusibility of bacteria. Additionally, our theoretical
*For correspondence:                 model captures behavioral differences resulting from genetic variations and oxygen sensitivity.
akocabas@ku.edu.tr
†
 These authors contributed
equally to this work
                                     Introduction
Competing interests: The             Some animals have remarkable abilities to form complex patterns to cope with environmental chal-
authors declare that no
                                     lenges (Sumpter, 2010; Martı́nez et al., 2016; Miller and Gerlai, 2012; Szopek et al., 2013;
competing interests exist.
                                     Ioannou et al., 2012; Stabentheiner et al., 2003; Peleg et al., 2018; Tennenbaum et al., 2016;
Funding: See page 18                 Gregor et al., 2010). Formation of these biological patterns is particularly initiated by aggregation.
Received: 16 October 2019            At high population density, animals tend to aggregate as animal-to-animal interactions cause insta-
Accepted: 05 April 2020              bility in uniform distribution (Gregor et al., 2010; Buhl et al., 2006; Liu et al., 2016; Vicsek et al.,
Published: 06 April 2020             1995). Different factors such as motility of animals and chemical cues can trigger these instabilities
                                     by altering the behavior of animals. In particular, sensory information plays a primary role in control-
Reviewing editor: Sandeep
                                     ling behaviors. Elucidating how environmental factors interplay with the sensory information is essen-
Krishna, National Centre for
Biological Sciences-Tata Institute
                                     tial to improve our understanding of pattern formation in biological systems. However, this is a
of Fundamental Research, India       challenging problem in complex organisms.
                                         Nematode Caenorhabditis elegans allows the use of sophisticated experimental tools and the
   Copyright Demir et al. This
                                     results provide very precise information regarding the relation between genes, neural circuits, and
article is distributed under the
                                     behaviors (Bargmann and Marder, 2013; Gray et al., 2005; Chalasani et al., 2007; Calarco and
terms of the Creative Commons
Attribution License, which           Samuel, 2019; Kocabas et al., 2012; Lee et al., 2019). This study is motivated by the possibility of
permits unrestricted use and         developing a platform that combines both neuronal information and the collective dynamics in this
redistribution provided that the     model system.
original author and source are           C. elegans shows a variety of collective responses including, social feeding (de Bono and Barg-
credited.                            mann, 1998; de Bono et al., 2002; Macosko et al., 2009; Coates and de Bono, 2002), starvation-

Demir et al. eLife 2020;9:e52781. DOI: https://doi.org/10.7554/eLife.52781                                                              1 of 21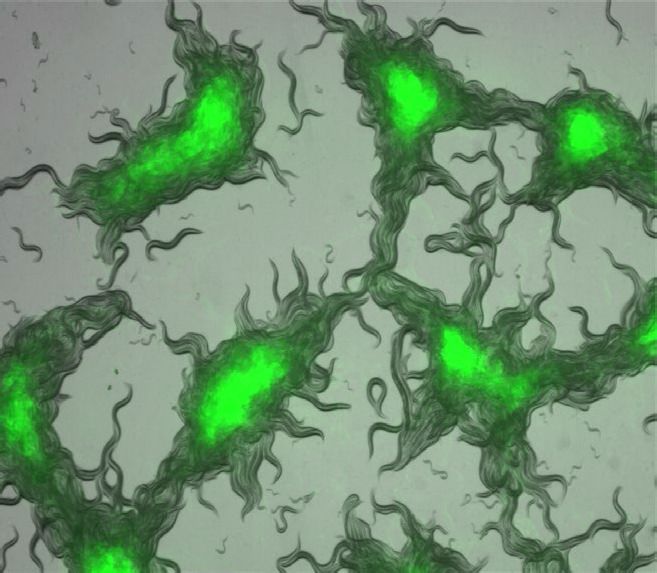
Research article                                                                                         Physics of Living Systems

                                   induced clustering (Artyukhin et al., 2015), hydrodynamic networking (Sugi et al., 2019) and collec-
                                   tive swimming (Yuan et al., 2014; Gray and Lissmann, 1964). Recent studies have shed light on
                                   some physical (Sugi et al., 2019; Ding et al., 2019; Oda et al., 2017) and biological (Rogers et al.,
                                   2006; Busch et al., 2012; Zhao et al., 2018) aspects of these behaviors and their variations. Oxygen
                                   sensitivity is particularly the main source of the variation. Laboratory strain (N2) is known to be soli-
                                   tary nematode with a broad range of oxygen preference while natural isolates exhibit strong aggre-
                                   gation and sharp aerotaxis (Rogers et al., 2006; Persson et al., 2009). Further, oxygen sensing,
                                   feeding and aggregation behavior are all intricately related in C. elegans. Bacteria utilize oxygen for
                                   growth and C. elegans seeks low oxygen levels for locating the bacteria as a food source. However,
                                   in a dense population, all these factors become extremely coupled (Tuval et al., 2005; Gray et al.,
                                   2004; Nichols et al., 2017). In this study, we aimed to develop a general model dealing with the
                                   dynamics of all these factors.
                                       Here, we report that, C. elegans including the laboratory strain (N2), forms complex patterns dur-
                                   ing feeding. When thousands of worms are forced to feed together, aggregation-induced bacterial
                                   accumulation and oxygen depletion create unstable conditions and further trigger phase separa-
                                   tions. The principle of phase separation is mainly based on a sudden change in the animal’s motility
                                   (Liu et al., 2016; Cates and Tailleur, 2015). We also found that the dynamics of the entire process
                                   is controlled by the sensitivity of the oxygen-sensing neurons, which gives rise to strong variations in
                                   animals’ collective response. Further, we also observe the convergence of self-organized patterns to
                                   the motile swarming body as a result of complex interactions between oxygen diffusion, bacterial
                                   consumption, and motility of animals. Finally, we studied the effects of bacterial diffusibility and bio-
                                   film formation of the lawn on the collective dynamics of animals.

                                   Results
                                   To investigate the collective response of C. elegans, we began by imaging animals during food
                                   search in a crowded environment. We collected thousands of animals (N2) in a droplet and let it dry
                                   on an agar plate. The droplet was put a few centimeters away from food. After drying, worms
                                   spread and searched for food by tracing the attractive chemicals. This experimental procedure
                                   allowed us to increase the worm density around a bacterial lawn to observe their collective move-
                                   ment. When animals found the bacteria, they usually slowed down and penetrated the lawn. How-
                                   ever, we observed that, at high densities the majority of the worms did not penetrate the lawn.
                                   After reaching the lawn, they suddenly stopped and started accumulating (Figure 1a). As the worms
                                   accumulated, they formed a huge aggregate that covered the entrance. Eventually, this large aggre-
                                   gate gained motility and swarmed across the lawn (Figure 1a,b,c, Video 1). This observation was
                                   quite different from the previously reported response of the reference strain N2 which generally
                                   behaves solitarily (de Bono and Bargmann, 1998; Gray et al., 2004). Further, we tested different
                                   mutant strains deficient in several sensing mechanisms and essential neuromodulators; we observed
                                   similar aggregation and swarming responses in a wide range of animals (Figure 1—figure supple-
                                   ment 1). We also used various types of food sources including B. subtilis biofilm, filamentous bacte-
                                   ria, or extremely thick bacterial lawns. Surprisingly, animals showed a very rich collective response
                                   ranging from complex pattern formations to large scale swarming (Figure 1d,e,f, Figure 1—figure
                                   supplement 2). Altogether, these results suggest that the conditions observed in a dense popula-
                                   tion can broadly trigger the collective response in C. elegans.
                                       This collective response only occurs on a bacterial lawn. Previous studies reported the same con-
                                   ditions for aggregating strains (de Bono and Bargmann, 1998; Gray et al., 2004). However, how
                                   the presence of bacteria contributes to this process is unclear. To clarify this point, we used GFP
                                   expressing bacteria (OP50, E. coli) to follow the entire dynamics. Time-lapse fluorescence micros-
                                   copy revealed that the bacteria are concentrated within the aggregates. This bacterial accumulation
                                   further promotes the collective behavior of animals (Figure 1f, Figure 1—figure supplement 3, Fig-
                                   ure 1—video 1; Video 2). Following the accumulation of bacteria, the motility of animals is strongly
                                   suppressed. The naı̈ve hypothesis explaining this observation is that the process is mainly based on
                                   the capillary meniscus around the animals (Rabets et al., 2014; Gart et al., 2011). When animals
                                   form aggregates, the structure becomes porous. Thus, due to the capillary effect, the porous aggre-
                                   gate can hold more bacterial suspension. Eventually, concentrated bacteria could make the forma-
                                   tion of aggregate more favorable by conditioning the oxygen levels. We can conclude that

Demir et al. eLife 2020;9:e52781. DOI: https://doi.org/10.7554/eLife.52781                                                            2 of 21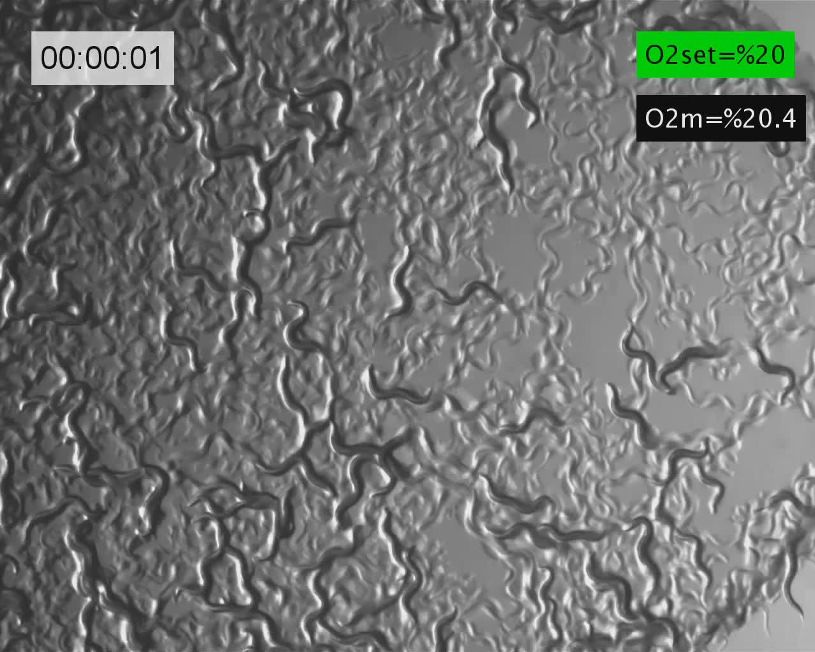
Research article Physics of Living Systems
b) c)
a)
Mole swarm
5 mm
d) e) f)
Figure 1. Collective response and pattern formations in C. elegans. (a, b) Thousands of animals collectively swarm on a bacterial lawn. (a) While
searching for food, worms aggregate around the edge of the bacterial lawn. Small aggregates merge and form a massive swarm. (b) Swarming body
eventually gains motility and moves across the lawn while consuming the bacteria. (c) A cryo-SEM image of the swarming body. The heads and the tails
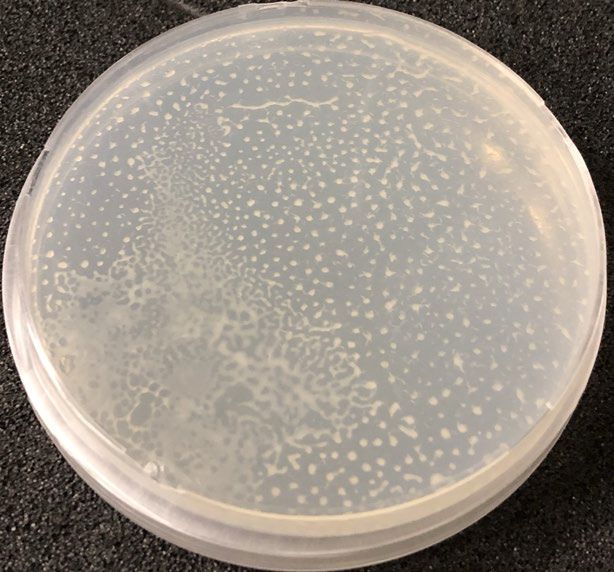
of the animals are buried, and the bodies extend on the surface of the swarm. (d, e) Sample images of Turing-like patterns formed by animals on an
agar surface under various conditions, such as starvation-induced and on a biofilm. The magnified version of the image is given in the supplementary
information. Scale bar, 1 cm (f) Fluorescent image of worms aggregating near the GFP-labeled bacteria. Due to the capillary effect and diffusion of
bacteria, worms concentrate the bacteria within the aggregates. Scale bar, 1 mm.
The online version of this article includes the following video and figure supplement(s) for figure 1:
Figure supplement 1. Average swarm area formed by different mutant strains.
Figure supplement 2. Sample patterns formed under different bacterial conditions.
Figure supplement 3. Worm density and bacterial concentration.
Figure 1—video 1. Emergence of swarming response of npr-1 mutant around a GFP labeled bacterial lawn.
https://elifesciences.org/articles/52781#fig1video1
Figure 1—video 2. Response of the swarm to the placement of cover glass.
https://elifesciences.org/articles/52781#fig1video2
Figure 1—video 3. Measurement of O2 diffusion on an agar surface.
https://elifesciences.org/articles/52781#fig1video3
Figure 1—video 4. Accumulation of worms around Na2SO3 containing agar chunk.
https://elifesciences.org/articles/52781#fig1video4
Figure 1—video 5. Response of npr-1 animals on very thick bacterial lawn.
https://elifesciences.org/articles/52781#fig1video5
concentrated bacteria is the primary factor triggering the formation and the maintenance of the
aggregation.
We then focused on the effects of oxygen on the entire process. Previous studies have already
shown that the bacterial lawn can decrease oxygen concentration [O2] (Rogers et al., 2006;
Gray et al., 2004). To directly observe this effect, we used fiber optic sensors to measure [O2] in
both bacterial suspensions and in the swarming body. We observed that the oxygen level drops
below 0.1% in the bacterial suspension (Figure 2—figure supplement 1). Moreover, we found simi-
lar depletion in [O2] in the swarming body (Figure 2a, Video 3). These results imply that concen-
trated bacteria deplete [O2] in the swarming body. It should be noted that the fiber optic sensor can
only be used to record the oxygen levels in the swarm liquid. Although [O2] is very low, the animals’
bodies can extend on the surface of the swarm and they can get sufficient O2 from the environment.
Besides the ambient environment, wet agar surface can also provide oxygen by lateral surface
Demir et al. eLife 2020;9:e52781. DOI: https://doi.org/10.7554/eLife.52781 3 of 21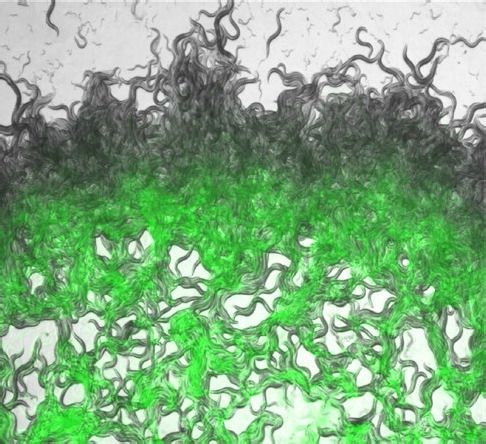
Research article                                                                                           Physics of Living Systems

                                                                                            diffusion. We independently validated these con-
                                                                                            tributions by covering the aggregate with a glass
                                                                                            slide and by using an agar chunk containing oxy-
                                                                                            gen depleting chemical Na2SO3, (Figure 2—fig-
                                                                                            ure supplement 2, Figure 1—video 2 and
                                                                                            Figure 1—video 3 ). Moreover, we observed that
                                                                                            Na2SO3 based oxygen depletion on the agar sur-
                                                                                            face could initiate aggregation behavior in the
                                                                                            bacteria-free region (Figure 1—video 4). We also
                                                                                            tested animals responses on a very thick bacterial
                                                                                            lawn which can significantly decrease the oxygen
                                                                                            level. We found that npr-1 worms did not form
                                                                                            clusters on the thick bacterial lawn and they
                                                                                            avoided extremely thick regions of the lawn (Fig-
                                                                                            ure 1—video 5). As a final control experiment we
                                   Video 1. Typical swarming response of a laboratory
                                   strain (N2) C.elegans. The video is played 600 X speed
                                                                                            tested the aggregation responses of worms on a
                                   and the real elapsed time is indicated in the video (h:  dead OP50 lawn. Interestingly, dead bacterial
                                   min: sec). This video is associated with Figure 1a,b.    suspensions have different oxygen kinematics
                                   https://elifesciences.org/articles/52781#video1          and result in small clustering (more discussions
                                                                                            about dead bacteria are available in the review
                                                                                            file). From these results, we can conclude that
                                                                                            animals effectively experience the average O2
                                   levels defined by the ambient environment and the swarm liquid. Altogether, ambient oxygen levels
                                   and oxygen depletion are essential factors for aggregation.
                                       To quantify the effects of [O2] on the motility of animals, we measured the response of the ani-
                                   mals under changing oxygen concentrations. Figure 2b compares the velocity profiles V(O) of both,
                                   aggregating strain npr-1 (DA609) and solitary strain N2 and the velocity of the animals moving in the
                                   bacteria-free region (off-food). Both strains responded to very low [O2] by increasing their velocities,
                                   which mainly triggers dispersive behavior (Video 4). On the contrary, npr-1 suppressed its motility
                                   around intermediate oxygen levels (7–10%) and showed a sharp response when oxygen levels
                                   exceeded 15%. In contrast, N2 suppressed its motility in more broader range of oxygen levels, but
                                                                                             their velocity slowly increased as [O2] reached
                                                                                             21% or more. These differences appear to be
                                                                                             originating from the sensitivity of the oxygen-
                                                                                             sensing neurons URX, AQR and PQR that shape
                                                                                             the overall oxygen preferences of the animals
                                                                                             (Oda et al., 2017; Busch et al., 2012;
                                                                                             Zimmer et al., 2009). Although both npr-1 and
                                                                                             N2 perform aerotaxis at 7–10% oxygen, N2
                                                                                             shows a weaker aerotactic response, thus, they
                                                                                             have a broader range of oxygen preference. All
                                                                                             these critical features of the strains can be
                                                                                             extracted from oxygen-dependent response
                                                                                             curve V(O) which is directly related to neuronal
                                                                                             sensitivity.
                                                                                                 Motility suppression behavior has been
                                                                                             observed in a variety of organisms ranging from
                                                                                             bacteria to mussels (Cates and Tailleur, 2015;
                                   Video 2. Emergence of swarming response of
                                                                                             Cates et al., 2010; Liu et al., 2013; Liu et al.,
                                   laboratory strain (N2) around a GFP-labeled bacterial
                                                                                             2014; Dervaux et al., 2017; Liu et al., 2011;
                                   lawn. Worms accumulate around the lawn and form
                                   large aggregates. As large aggregates merge, swarm
                                                                                             Garfinkel et al., 2004). Generally, animals tend
                                   body appears and gains motility. Bacteria accumulate      to slow down when they come together. The
                                   within the aggregates. The video is played 250 X speed entire process is represented by the density
                                   and the real elapsed time is indicated in the video (hr:  dependence of the animal movement which can
                                   min: s).                                                  lead to the formation of patterns. However, in C.
                                   https://elifesciences.org/articles/52781#video2           elegans we observed indirect density-dependent

Demir et al. eLife 2020;9:e52781. DOI: https://doi.org/10.7554/eLife.52781                                                              4 of 21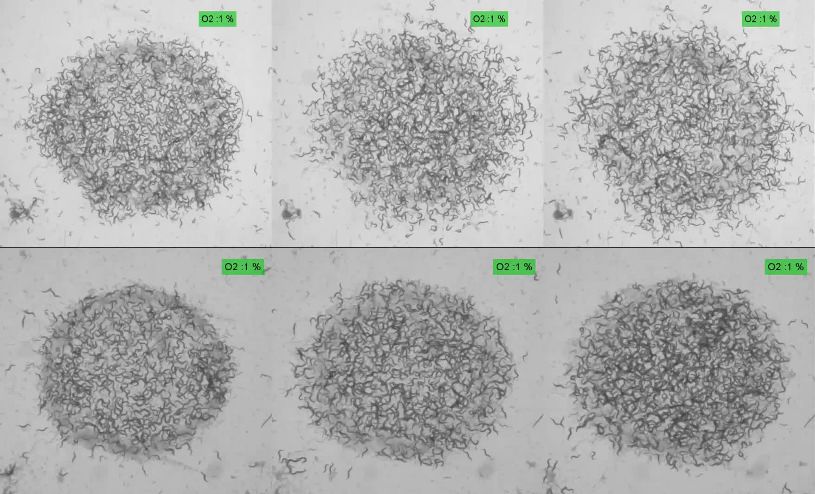
Research article                                                                                                                            Physics of Living Systems

                                       a)                                                   b)
                                               20                                                              220
                                                                                                               200

                                                                                            Speed (mic./sec)
                                                                                                               180
                                               15                                                              160

                                        [O2] (%)
                                                                                                               140                        Off N2
                                                                                                               120                        npr-1
                                               10                                                              100                        N2
                                                                                                                80
                                                                                                                60
                                                   5                                                            40
                                                                                                                20
                                                                                                                 0
                                                   0
                                                                                                                     0    10         20           30
                                                       20   30     40     50    60   70                                   [O2] (%)
                                                                   Time (min)
                                       c)
                                                            Dispersive          Sta!onary                                Aggrega!on

                                                                 D>0                 D~0                                   D>0
                                                                 β< 0                β~0                                   β> 0

                                                        Low              Animal Density (a.u.)
                                                                                                                               High
                                       d)

                                       e)
                                                       N2

                                       f)
                                                       npr-1

                                                                                                                                     1cm

                                   Figure 2. Oxygen sensitivity and the dynamics of pattern formation. (a) Accumulation of bacterial suspension
                                   depletes oxygen in worm aggregates. Oxygen levels measured by the fiber optic sensor while the swarm passes
                                   through the sensor. Initially fiber optic sensor records ambient [O2] on the surface and the sudden drop is
                                   originating from the complete coverage of the fiber by the swarm body. (b) Oxygen-dependent motility of
                                   animals. The average speed of the worms as a function of ambient oxygen. The slope of the curve defines the
                                   aerotactic response of the animals. The comparison of velocity profiles of N2 (red) (on food), npr-1(blue) (on food),
                                   and off-food-N2 (green) response show the difference between the strains. Colored regions indicate the
                                   dispersive, stationary and aggregation phases. Error bar indicates the s.e.m. = ± 18 mm/s. For each experiment, 25
                                   individual animals were imaged. Measurement error is defined by the error in image processing steps. (c)
                                   Schematic representation of each phase. The competition between animal dispersion (D) and aerotactic response
                                   (b) defines the collective behavior of worms. (d) Simulation results of the model at time 10 min after randomization
                                   of the patterns with various initial animal densities. The pattern formation strongly depends on worm density. At
                                   Figure 2 continued on next page

Demir et al. eLife 2020;9:e52781. DOI: https://doi.org/10.7554/eLife.52781                                                                                               5 of 21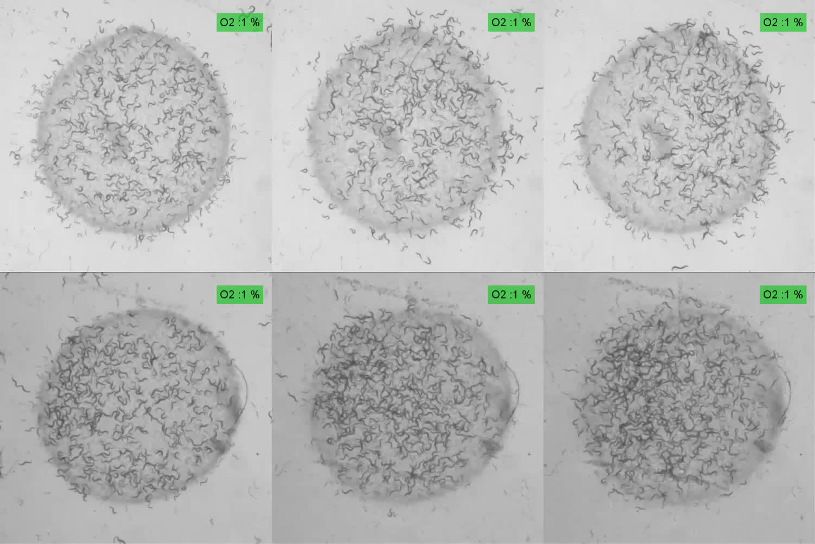
Research article Physics of Living Systems
Figure 2 continued
low density, worms create clusters. As the worm density increases, clusters converge to stripes and hole
patterns. (e, f) Experimental results of density-dependent pattern formation. (e) At low worm densities (500 worms/
cm2), N2 worms do not form patterns. As the density increases, we observed stripes (2000 worms/cm2) and holes
(6000 worms/cm2). (f) The strong aerotactic response of npr-1 strain enables worms to form patterns even at low
densities. An increase in the worm density causes a change in the instability conditions and tunes the patterns.
Scale bar, 1 mm.
The online version of this article includes the following figure supplement(s) for figure 2:
Figure supplement 1. Oxygen measurement in a bacterial suspension[O2] in a bacterial suspension as a function
of time (in blue).
Figure supplement 2. Contributions of surface penetration and lateral diffusion of oxygen.
Figure supplement 3. Effects of thick bacterial lawn.
Figure supplement 4. Imaging system.
suppression. Without bacteria, animals move fast (Figure 2b). In striking contrast, the presence of
bacteria results in oxygen depletion and motility suppression. These findings suggest that in the
dynamics of oxygen, bacterial concentration and animal motility are the essential physical factors
controlling the collective behaviors of C. elegans.
To gain a more quantitative representation of pattern formation, we developed a mathematical
model. Many different models have been used to describe the dynamics of pattern formation. Partic-
ularly, dryland vegetation models share similarities in terms of dynamic variables and feedbacks
(Gilad et al., 2007; Gilad et al., 2004). However, in our system, we have to implement the activity
of the worms based on oxygen concentrations. To do so, we followed the notation and the frame-
work developed for active chemotactic particles (Liebchen and Löwen, 2018). We set two separate
differential equations to represent worm density (W) and oxygen kinematics (O) in two-dimensional
space. V(O) is the oxygen-dependent motility response of individual animals. This factor served as an
experimentally measurable sensory curve of the animals. This curve defines competition between dif-
fusivity and aerotactic motility. Both effects became minimal around the optimum oxygen level (7–
10%) at which the animals were almost in a stationary phase (Figure 2b). In low oxygen region, dis-
persion and reversal of aerotaxis promoted motility. On the other hand, at high oxygen levels, aero-
taxis dominated the dynamics and promoted aggregation (Figure 2c). These are the Keller-Segel
like equations (Keller and Segel, 1970; Wang, 2010) with both, nonlinear diffusion and chemotactic
sensitivity (Materials and methods);
qW
¼ r½DW rW þ r½bWrO (1)
qt
qO
¼ DO r2 O þ f ðOam OÞ kc W (2)
qt
2
Here, DW ¼ V 2t represents motility-dependent
dispersion of the worms, DO is the diffusion
qV
coefficient of oxygen on the surface, b ¼ 2Vt qO is
the aerotactic coupling coefficient indicating the
strength of the animal response to oxygen gradi-
ent. f is the penetration rate of the oxygen from
the air to the water surface, Oam is the ambient
oxygen level, and kc is the rate of oxygen con-
sumption by worms and bacteria. kc W term in
Video 3. Measurement of [O2] in a swarming body. The
the model covers the hydrodynamics related to
fiber optic sensor is placed on a bacterial lawn and
the bacterial concentration. Here, we assume ambient [O2] is set to 21%. Ambient set [O2] and
that bacterial density is linearly proportional to measured [O2] are indicated in the video as O2 set
worm density (Figure 1—figure supplement (green) and O2m (black), respectively. This video is
3b). Furthermore, the time scale of the bacterial associated with Figure 2a.
consumption is much longer than the https://elifesciences.org/articles/52781#video3
Demir et al. eLife 2020;9:e52781. DOI: https://doi.org/10.7554/eLife.52781 6 of 21
Research article                                                                                              Physics of Living Systems

                                                                                           Video 5. Typical structural patterns formed by the
                                                                                           animal at high population density under different
                                                                                           oxygen levels. Top images show N2 and bottom
                                   Video 4. Oxygen-dependent motility response of          images corresponds to npr-1 strain. The circular region
                                   individual animals (npr-1). In order to minimize the    is the bacterial lawn. This video is associated with
                                   animal to animal interaction isolated bacterial slots   Figure 2d–f and Figure 3.
                                   were used. This video is associated with Figure 2b.     https://elifesciences.org/articles/52781#video5
                                   https://elifesciences.org/articles/52781#video4
                                                                                           aggregation time, thus we ignore the bacterial
                                                                                           consumption term in the equations.
                                       First, we focused on the instability criteria. Following the linear stability analysis of the solution in
                                   the uniform phase, we predicted that instability occurs when Weq bkc >fDW . The detailed derivations
                                   are given in Materials and methods. This criterion suggests that population density and aerotactic
                                   response favor instability; however, dispersion of animals opposes it. To verify these conditions, we
                                   performed simulations by tuning initial worm density. Depending on the density, we observed the
                                   formation of uniform distribution, dots, stripes, and holes (Figure 2d). These are the basic patterns
                                   that are frequently seen in many biological systems (Liu et al., 2016; Chen et al., 2012).
                                       Our simulations also predict that under low aerotactic response, the increase in population den-
                                   sity could complement the instability criteria and give rise to pattern formation. This is because the
                                   multiplication of density and aerotactic response simply shifts the dynamics to a new instability zone.
                                   This prediction could explain the response of solitary N2 in a dense population. N2 shows weak
                                   aerotactic response which results in broad oxygen preference and patterns only appear in a dense
                                   environment. On the other hand, the strain npr-1 with sharp aerotactic response can form similar
                                   patterns even at low population density. We tested this hypothesis experimentally (Figure 2e and f,
                                   Videos 5 and 6) and found that N2 forms stripes and hole-like patterns only at high population den-
                                   sity, whereas npr-1 could form small aggregation patterns even at a low density.
                                       Ambient oxygen is the second experimentally controllable factor driving the dynamics of the sys-
                                   tem. The onset of the pattern formation can be controlled by tuning the ambient oxygen levels at a
                                   fixed population density. Further, we tested the contribution of ambient oxygen levels to pattern
                                   formation. To be able to control the [O2], we performed the experiments in a chamber where the
                                   flow of O2/ N2 mixture is precisely controlled (Figure 2—figure supplement 3). First, we measured
                                   the [O2] in a large aggregate accumulated around the bacterial lawn. We started the experiment at
                                   21% O2 and sequentially decreased the [O2] to 1%. We observed that the aggregates respond to
                                   decreasing O2 level by increasing their surface area (Figure 3a, Figure 3—figure supplement 1,
                                   Video 7). However, [O2] in the aggregate remained low until it reached 7% (Figure 3b). Below this
                                   level, the pattern became very porous and oxygen would directly leak into the fiber sensor which led
                                   to small fluctuations in readings. It should be noted that the [O2] at 1% completely randomized the
                                   patterns by increasing motility and reversing aerotaxis. Subsequently, we increased the [O2] which
                                   resulted in similar stripe and hole patterns across the region (Figure 3c, Figure 3—figure supple-
                                   ment 2). We noticed that patterns formed by N2 strain did not change significantly during oxygen
                                   scans (Figure 3—figure supplement 3). This was expected, because N2 exhibits low and almost flat
                                   aerotactic response within the same range of oxygen levels.
                                       We further explored the combinatorial effects of oxygen and worm density on pattern formation.
                                   As predicted by the instability criterion, in two-dimensional parameter space, the onset of dot, stripe

Demir et al. eLife 2020;9:e52781. DOI: https://doi.org/10.7554/eLife.52781                                                                   7 of 21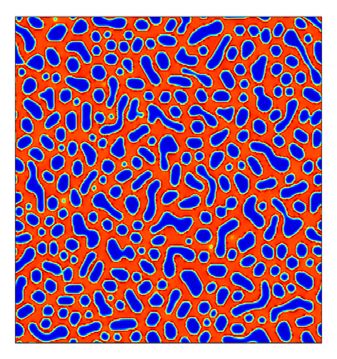
Research article                                                                                                             Physics of Living Systems

                                                                                                                           21%
     a)                                                                                       b)                20
                                                O2
                                                                                                                15

                                                                                                     [O2] (%)
                                                                                                                                 10%
                                                                                                                10
                                                                                                                                       7%
                                                                                                                5                           3%
                                                                                                                                                 1%

                                                                                                                0
                                                                                                                     40   45      50              55         60
    c)                                                                                         d)                                  Time (min)
                                                     Ambient [O2]
                                                                                                     1%                   7%                          16 %              21 %
                                                                                             np
                                                                                             npr-1
                               120
   Animal Density (Worm/mm2)

                               100

                               80

                               60

                               40

                               20
                                                                                                                                                                               1cm

Figure 3. Combinatorial effect of ambient oxygen and worm density. (a) Schematics show the response of worm aggregates to changing ambient
oxygen levels. As oxygen level increases, the size of the clusters shrink and form circular aggregates which balance the oxygen penetration and
diffusion. (b) Measured oxygen concentration in worm aggregates. The dashed red line shows the ambient oxygen level. Error bar indicates the s.e.
m. = ± 0.1% (c, d) Simulation and experimental results of pattern formation under various worm densities and ambient oxygen levels. Patterns are
formed when the instability criterion is satisfied. The instability zone is bounded by the uniform stable population. Scale bar, 1 cm. Image snapshots
representing simulation results are taken at time 10 min after randomization of the patterns. Worm densities vary between 5–60 worms / mm2
(Martı́nez et al., 2016) in the experiments.
The online version of this article includes the following figure supplement(s) for figure 3:
Figure supplement 1. Response of the swarm to changing oxygen.
Figure supplement 2. Sample patters formed by npr-1, under different oxygen levels.
Figure supplement 3. Sample patterns formed by N2, under different oxygen levels.
Figure supplement 4. Simulation results of worm density and oxygen profiles through the crossection of the clusters.

                                                             and hole patterns is observed around the zone bounded by high and low uniform animal densities
                                                             (Figure 3d). An increase in worm density or a decrease in ambient oxygen levels transforms the dot-
                                                             shaped structure to stripe and hole patterns.
                                                                 The other interesting feature of the pattern formation is the coarsening event. We sought to
                                                             know how the shape of the patterns evolves in time at a fixed oxygen level. Our time-lapse imaging
                                                             and simulation results validate the coarsening of characteristic domain size (Bray, 1994; Figure 4a–
                                                             c, Figure 4—figure supplement 3, Videos 8,9). In later stages, patterns merge and form a large
                                                             cluster. This type of a large cluster shares visual similarities with our initial swarming experiments
                                                             (Figure 1a and b). Interestingly, unlike simulation the width of the of the cluster reaches saturation
                                                             before they dissociate. Arrested phase seperation was also observed in bacterial system due to birth
                                                             and death dynamics (Cates et al., 2010). We noticed that, in our case, the consumption of bacteria
                                                             is significant within the cluster and may limit the growth of the clusters. The similar effect of bacterial
                                                             depletion was also proposed to explain the motion of the aggregating strain npr-1 (Ding et al.,
                                                             2019). To investigate the details, we measured the bacterial concentration. GFP signal revealed

Demir et al. eLife 2020;9:e52781. DOI: https://doi.org/10.7554/eLife.52781                                                                                                           8 of 21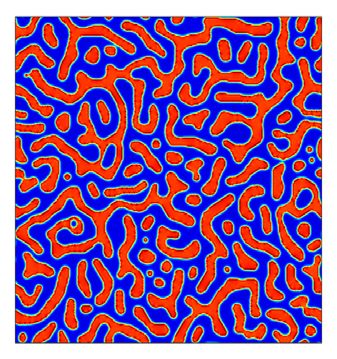
Research article                                                                                                Physics of Living Systems

                                   different bacterial concentrations across the swarm; the front edge of the swarm has more bacteria
                                   than the back (Figure 4d–f). Worms in the swarm consumed bacteria and the food continually dif-
                                   fused from the front edge toward the back. As the swarm grows, the gradient profile gradually
                                   extends into the swarming body with the average decay length of around l ~2–4 mm (Figure 4g–h).
                                   l the characteristic length scale of the gradient profile can be simply defined by the bacterial diffu-
                                   sion coefficient (Db) and consumption rate (fb), l 2 = Db/fb. This decay length defines the width of
                                   the swarm body. The small clusters show symmetric GFP distribution and do not form a gradient
                                   profile (Figure 4—figure supplement 1d).
                                       Next, we tested whether this concentration profile could change the activity of the animals. The
                                   activity of the animals increased towards the back which suggests that the animals crawling at the
                                   front edge encountered more bacteria than those at the back. To quantify the activity profile, we
                                   measured the mean velocity of animals using Particle Image Velocimetry (PIV) analysis. Indeed, the
                                   velocity increased toward the back (Figure 4—figure supplement 1a–c). This response is consistent
                                   with our V(O) curve where the animals perform off-food response. Without the availability of bacte-
                                   ria, animals start moving fast. On the whole, due to the balance between bacterial consumption and
                                   diffusion, swarm body gains motility and moves across the bacterial lawn (Figure 4—figure supple-
                                   ment 2).
                                       So far we have studied the interplay between oxygen levels and animal density. Our observations
                                   suggest that diffusion of bacteria on the lawn and swarm fluid is an essential factor and physical
                                   properties of the bacterial lawn could also play a significant role during pattern formation. To gain
                                   more understanding, we tested the responses of the animals on different biofilm-forming bacterial
                                   lawns. B. subtilis can form a biofilm which consists of an elongated chain of cells. Due to their long
                                   chaining structure, diffusibility of the bacteria could be relatively limited. We used GFP-labeled B.
                                   subtilis and overexpressed sinI protein (Yaman et al., 2019) to drive biofilm formation on regular
                                   NGM plates. Figure 5 shows the time evolution of animal accumulation on this chaining biofilm.
                                   Interestingly, as animals accumulate dark regions appear across the lawn. These regions indicate the
                                   bacteria depleted domains that eventually grow and form open holes (Video 10). The appearance
                                   of these holes triggered by local bacterial depletion which can be considered as noise in the concen-
                                   tration. These structures Tjhung et al., 2018 strongly resemble the noise-induced bubbly phase sep-
                                   eration (Tjhung et al., 2018) in active particles. In order to get more insights we tested the
                                   dynamics of holes in a swarming body moving on isolated E. coli lawn (OP50). Interestingly, on E.
                                   coli based swarm, holes gradually disappeared (Figure 5—figure supplement 1). This difference
                                   suggests that the dynamics of holes depend on the physical properties of the bacterial lawn. This dif-
                                   ference could be related to the reversal of Ostward process observed in active fluids (Tjhung et al.,
                                   2018). We leave the details of this process for future work. The naı̈ve explanation behind this pro-
                                                                                        cess is that on biofilms the diffusibility of the

                                   Video 6. Typical structural patterns formed by the
                                   animal at low population density under different
                                   oxygen levels. Top images show N2 and bottom
                                   images corresponds to npr-1 strain. The circular region
                                   is the bacterial lawn. This video is associated with      Video 7. Typical response of the swarm formed by N2
                                   Figure 2d–f and Figure 3.                                 to changing ambient oxygen.
                                   https://elifesciences.org/articles/52781#video6           https://elifesciences.org/articles/52781#video7

Demir et al. eLife 2020;9:e52781. DOI: https://doi.org/10.7554/eLife.52781                                                                     9 of 21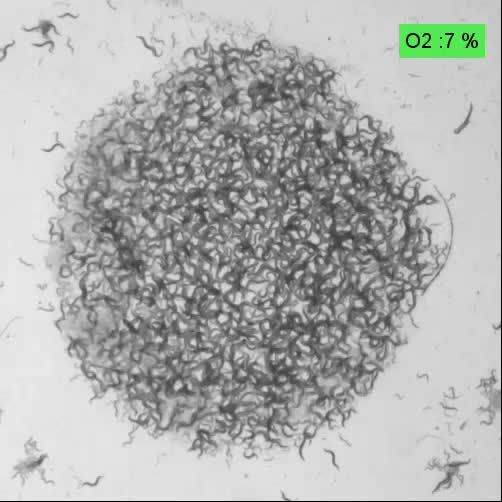
Research article                                                                                                       Physics of Living Systems

                                       a)                       b)                                        c)

                                       d)                       e)                                        f)

                                                Banding               Concentra on                               Swarming
                                       g)
                                                                         h)
                                                                         GFP Intensity (a.u.)

                                                                                                6   5       4     3   2   1   0
                                                                                                        Distance (mm)

                                   Figure 4. Coarsening event and the emergence of swarming behavior. (a, b, c) After the formation of patterns,
                                   animals locally consume bacteria which eventually increases the motility of animals. (b) Further, patterns merge
                                   and coarsen. (c) Consumption of food eventually results in the formation of a large aggregate which resembles the
                                   swarming body. Scale bar, 1 cm. (d, e, f) Different stages of a swarming response observed during food search
                                   behavior in a dense population. (d) Worms accumulate around the lawn. Unlike isolated worms, diffused bacteria
                                   cause the worms to slow down and then the worms form a band around the edge of lawn which eventually
                                   converges to aggregates. (e) Small aggregates concentrate bacteria and further accumulate the incoming worms.
                                   Consumption and diffusion of bacteria from the lawn leads to a bacterial gradient within the aggregate. (f)
                                   Following the formation of a gradient, large aggregate gains motility. The swarm moves through the lawn until
                                   finishing the entire lawn and then dissociates. (g) Superposition image of swarming animals and GFP-labeled
                                   bacteria indicating the gradient formation across the swarm. (h) A gradient profile gradually extends into the
                                   swarm at different time points.
                                   The online version of this article includes the following figure supplement(s) for figure 4:
                                   Figure supplement 1. Gradient profile of bacterial concentration.
                                   Figure supplement 2. Center of mass velocities of the swarm (blue) and small aggregates (colored) as a function
                                   of time.
                                   Figure supplement 3. Coarsening dynamics of both simulation and experimentally measured worm clusters in (a)
                                   logarithmic and (b) linear plots.

                                   bacteria decreases and could not compensate the local oxygen penetration which further promotes
                                   animal motility around these depleted domains.
                                      As a final step, we focused on the collective response of animals on pathogenic bacteria. It has
                                   been known that pathogenic bacteria Pseudomonas aeruginosa (PA14) trigger immune response

Demir et al. eLife 2020;9:e52781. DOI: https://doi.org/10.7554/eLife.52781                                                                        10 of 21
Research article Physics of Living Systems
and avoidance behavior in C. elegans (Reddy et al., 2011; Zhang et al., 2005). In order to analyze
the collective dynamics, we first measured the V(O) curves of both N2 and npr-1 strains on the lawn
formed by PA14. The responses of these strains are very different from the behaviors observed on
regular OP50; N2 animals are always active on the lawn, on the other hand npr-1 shows a narrowed
slowing down window between 3% and 5% oxygen (Figure 6a,c). Further, we tested their swarming
behaviors in a dense population. As expected from the V(O) curves N2 does not swarm but npr-1
shows accumulation around the lawn (Figure 6—video 1 and Figure 6—video 2). Long-time lapse
imaging experiments showed that the consumption of pathogenic bacteria is extremely slow which
takes more than a day to finish the lawn completely.
The striking feature we observed in these experiments is the accumulation of N2 worms around
the edge of the lawn (Figure 6—video 1). Figure 6b shows these clusters. The most parsimonious
hypothesis explaining this observation is that bacteria can diffuse from the biofilm lawn and form a
thin layer of isolated bacteria which is sufficient to change the oxygen concentration in the liquid
layer on NGM surface. Previous studies showed the instability of the edge of bacterial biofilms
(Yaman et al., 2019; Semmler et al., 1999). Thus, pathogenic PA14 show substantial structural dif-
ferences between biofilms and edges. The bacteria in the biofilm are tightly packed and attached to
the extracellular polymeric substances (EPS) matrix, however around the edge they are motile, and
they can disperse using their fimbriae. Further we used GFP-labeled PA14 and observed single layer
finger-like structures around the lawn (Figure 6—figure supplement 1). The width of this layer is
about 1.6 mm for 3 days old PA14 bacterial lawn.
In contrast to N2, npr-1 animals form a large aggregate (Figure 6d). When we randomize the pat-
tern and set the ambient oxygen to a higher level, we also observed transient clustering on the lawn
(Figure 6—video 2). This observation is consistent with our diffusion concept. Animals can initially
concentrate the isolated bacteria available on the surface but eventually they cannot get enough
bacteria from the biofilm to sustain the aggregation.
Finally, in order to gain more information about the differences between OP50 and PA14, we
imaged the dynamics of the bacteria around a single worm during locomotion. We observed that on
the OP50 lawn, worms could concentrate the bacteria (Video 11). In contrast, on the PA14 biofilm
animals only make a trench but do not concentrate the bacteria (Figure 6—video 3). However,
around the edge of the PA14 biofilm animals can concentrate the isolated bacteria (Figure 6—video
4). Altogether these observations suggest that biofilm structure and diffusibility of the bacteria play
essential roles during aggregation and pattern formation.
Discussion
The dynamics of pattern formation in biological systems depend on many intricately related factors.
The theory of pattern formation in active particles provides a powerful framework to explain the
complex interactions between these factors (Cates et al., 2010; Liebchen and Löwen, 2018). Using
Keller-Segel model (Keller and Segel, 1970; Wang, 2010) and motility-induced phase separation
principles (Liu et al., 2016; Cates and Tailleur, 2015), this study throws light upon new physical and
a) b) c) d)
Figure 5. Emergence of periodic holes on biofilms. (a–d) Snapshots of aggregating N2 animals on GFP labeled B. subtilis biofilm. Limited diffusibility of
the chaining bacteria allows local bacterial depletion and oxygen penetration. An increase in the local oxygen concentration results in periodic hole
structures by triggering the animals’ motility.
The online version of this article includes the following figure supplement(s) for figure 5:
Figure supplement 1. Time evolution of holes in a swarm body.
Demir et al. eLife 2020;9:e52781. DOI: https://doi.org/10.7554/eLife.52781 11 of 21Research article Physics of Living Systems
Video 8. Sample simulation results of representing the
coarsening process.
https://elifesciences.org/articles/52781#video8
biological insights of this complex dynamics. We Video 9. Typical response of npr-1 to changing
revealed four essential factors; First, hydrody- ambient oxygen. Bacterial depletion promotes
namic interactions between worms initiate the coarsening and the emergence of swarming. This video
process of bacterial accumulation within the is associated with Figure 4.
aggregates, which is the first, and a critical step https://elifesciences.org/articles/52781#video9
in the pattern formation. Second, the oxygen-
dependent motility of the animals controls the
competition between aerotaxis and animal dispersion. This competition links the neuronal sensitivity
to the collective response of the animals. Third, the population density can compensate for the neu-
ronal sensitivity to convert the behavior of solitary animals to aggregation. Further, a gradient profile
is formed across the aggregate due to the consumption of bacteria, which leads to the initiation of
forward motility and swarming behavior. Finally, we observe that bacterial diffusibility and biofilm
formation of the lawn strongly alter the collective dynamics of animals. Our results show that collec-
tive dynamics and pattern formation of C. elegans is particularly driven by slowing down response of
animals. Our work also raises the questions of how the activities of sensory neurons coordinate motil-
ity and slowing down response of worms. Particularly how head and tail neurons separately sense
the oxygen levels and synchronize forward and backward locomotion. Moreover, the relation
between slowing down response and pathogenic avoidance behavior should be investigated. Future
experiments will help identify the details of the circuit dynamics controlling these behaviors. Alto-
gether, experimental results and mathematical models of this study will shed light on understanding
the complex dynamics of biological systems.
Materials and methods
Derivation of the mathematical model
The motion of worms is described as a random walk with oxygen-dependent speed of worms
denoted by V ðOÞ. Worms can change their direction at a rate of t . The continuity equation reads as:
qW
¼ rJ (3)
qt
where W is the density of worms and J is the worm flux and given by the following expression:
V ðOÞ
J¼ rðV ðOÞW Þ (4)
nt
n is the dimensionality and equals to 2 in our 2-D model. Substituting Equation 4 into Equation 3
leads to:
Demir et al. eLife 2020;9:e52781. DOI: https://doi.org/10.7554/eLife.52781 12 of 21Research article Physics of Living Systems
qW V ðO Þ
¼ r rðV ðOÞW Þ (5)
qt 2t
1 2
¼ r V rW þ VWrV (6)
2t
1 2 qV
¼ r V rW þ VW rO (7)
2t qO
¼ r½DW rW þ r½bWrO (8)
2
qV
In the equation above, DW ¼ V2t is worm diffusivity and b ¼ 2Vt qO is the aerotactic coupling coeffi-
cient. The oxygen kinematics can be controlled by three contributing factors. First, oxygen diffuses
a) b)
220
200 N2 PA14
180 N2 OP50
160
PA14
Speed (mic./sec)
140
120
100
80
60
40
20
0
0 10 20
[O2] (%)
c) 200
d)
180 npr-1 PA14
160 npr-1 OP50
Speed (mic./sec)
140
120
100 PA14
80
60
40
20
0
0 10 20
[O2] (%)
Figure 6. Dynamics of collective response of both N2 and npr- one on pathogenic bacteria Pseudomonas
aeruginosa (PA14). Oxygen-dependent motility of the laboratory strain N2 (a) and (c) npr-1 on PA14. Error bar
indicates the s.e.m. = ± 18 mm/s. Snapshots of distribution high-density animals N2 (b) and np1-1 (d) on PA14. For
each experiment N = 25 individual animals were imaged.
The online version of this article includes the following video and figure supplement(s) for figure 6:
Figure supplement 1. Unstable edge of a bacterial biofilm.
Figure 6—video 1. Collective response of N2 animals on a biofilm-forming patghogenic PA14 bacterial lawn.
https://elifesciences.org/articles/52781#fig6video1
Figure 6—video 2. Collective response of npr-1 animals on a biofilm-forming patghogenic PA14 bacterial lawn.
https://elifesciences.org/articles/52781#fig6video2
Figure 6—video 3. Dynamics of bacteria around a single worm moving on the GFP-labeled PA14 biofilm.
https://elifesciences.org/articles/52781#fig6video3
Figure 6—video 4. Dynamics of bacteria around a single worm moving on the edge of PA14 biofilm.
https://elifesciences.org/articles/52781#fig6video4
Demir et al. eLife 2020;9:e52781. DOI: https://doi.org/10.7554/eLife.52781 13 of 21Research article Physics of Living Systems
Video 10. Accumulation of N2 animals on a biofilm- Video 11. Dynamics of bacteria around a single worm
forming B. Subtilis bacterial lawn. GFP-labeled bacteria on a GFP-labeled OP50. Bacteria can diffuse and the
show the concentrated and depleted regions. worm accumulates the bacteria around the trench left
Depleted regions converge to periodic open holes. behind.
This video is associated with Figure 5. https://elifesciences.org/articles/52781#video11
https://elifesciences.org/articles/52781#video10
through the two-dimensional wet agar surface.
The second is the penetration of the ambient oxy-
gen from the air to the aggregate. The last contribution is the consumption of oxygen by worms and
bacteria. Since the local density of worms and bacteria are linearly correlated as shown in Supple-
mentary Figure 3b, the oxygen consumption can be described with the worm density. Hence, the
following equation accounts for the oxygen dynamics on an agar surface:
qO
¼ DO r2 O þ f ðOam OÞ kc W (9)
qt
Here, DO is the diffusion coefficient of the oxygen on the surface, f is the penetration rate of the
oxygen from the air to the water, Oam is the ambient oxygen level and kc is the rate of oxygen con-
sumption by worms and bacteria. We ignore the distribution of the bacteria, since it is linearly corre-
lated with the local worm density.
Linear stability analysis
Our equations are:
qW
¼ r½DW rW þ r½bWrO (10)
qt
qO
¼ DO r2 O kc W þ f ðOam OÞ (11)
qt
At the homogeneous equilibrium state, where W and O are constant over time and space, we
have the following solution:
kc W ¼ f ðOam OÞ (12)
We denote the equilibrium state as:
kc
Weq ; Oeq ¼ Weq ; Oam Weq (13)
f
Then we introduce small perturbations into this homogeneous equilibrium condition as follows:
W ð x; tÞ ¼ Weq þ DW ð x; t Þ (14)
Demir et al. eLife 2020;9:e52781. DOI: https://doi.org/10.7554/eLife.52781 14 of 21Research article Physics of Living Systems
Oðx; t Þ ¼ Oeq þ DOð x; t Þ (15)
By applying these variable replacements to Equation 10 and Equation 11, we obtain
qDW q q q q kc
¼ DW Weq þ DW þ b Weq þ DW Oam Weq þ DO (16)
qt qx qx qx qx f
q q q q
¼ DW ðDW Þ þ b Weq þ DW ðDOÞ (17)
qx qx qx qx
qDW qDW q2 DW qb qDO q2 DO
¼ þ DW þ Weq þ bWeq (18)
qx qx qx2 qx qx qx2
q2
qDO kc kc
¼ DO 2 Oam Weq þ DO kc Weq þ DW þ f Oam Oam Weq þ DO (19)
qt qx f f
q2 DO
¼ Do kc DW f DO (20)
qx2
Second-order terms in perturbations are neglected. We assume:
DW ð x; tÞ ¼ DW ðt Þ sin kx (21)
DOð x; tÞ ¼ DOðt Þ sin kx (22)
By doing so, we have decoupled spatial structure and temporal dynamics. By definition, DW and
b are:
V2
DW ¼ (23)
2t
V qV
b¼ (24)
2t qO
Therefore, the partial derivatives of diffusivity and aerotactic coupling coefficient with respect to
x are:
qDW 1 qV
¼ 2V (25)
qx 2t qx
V qV qO
¼ (26)
t qO qx
qb 1 qV qV q qV
¼ þV (27)
qx 2t qO qx qx qO
2 !
q2 V qO
1 qV qO
¼ þV 2 (28)
2t qO qx qO qx
In terms of perturbations around the equilibrium, the equation (12) becomes:
qDW V qV qDO
¼ (29)
qx t qO qx
Demir et al. eLife 2020;9:e52781. DOI: https://doi.org/10.7554/eLife.52781 15 of 21Research article Physics of Living Systems
2 !
q2 V qDO
qb 1 qV qDO
¼ þV 2 (30)
qx 2t qO qx qO qx
Since each term in the expressions of diffusivity and aerotactic coupling coefficient parameter is
first order in small perturbations, their multiplication with another first-order term will be negligible.
Therefore, we neglect all higher order terms in Equation 18. Finally, these equations become:
qDW
sin kx ¼ DW k 2 sin kxDW bWeq k 2 sin kxDO (31)
qt
qDW
¼ DW k 2 DW bWeq k 2 DO (32)
qt
qDO
sin kx ¼ DO k 2 sin kxDO kc sin kxDW f sin kxDO (33)
qt
qDO
¼ DO k 2 DO kc DW f DO (34)
qt
Using a linear algebra notation:
q DW DW k 2 bWeq k 2 DW
¼ (35)
qt DO k DO k 2 f DO
We need to find the eigenvalues of the matrix at Equation 35 and check the signs of their real
parts.
DW k 2 l bWeq k 2
¼0 (36)
kc DO k 2 f l
DW k 2 DO k 2 bWeq k 2 kc ¼ 0
l f l (37)
l2 þ DW k 2 þ DO k 2 þ f l þ DW k 2 DO k 2 þ f bWeq k 2 kc ¼ 0
(38)
1 qffiffiffiffiffiffiffiffiffiffiffiffiffiffiffiffiffiffiffiffiffiffiffiffiffiffiffiffiffiffiffiffiffiffiffiffiffiffiffiffiffiffiffiffiffiffiffiffiffiffiffiffiffiffiffiffiffiffiffiffiffiffiffiffiffiffiffiffiffiffiffiffiffiffiffiffiffiffiffiffiffiffiffiffiffiffiffiffiffiffiffiffiffiffiffiffiffiffiffiffiffiffiffiffiffiffi
l¼ DW k 2 þ DO k 2 þ f ðDW k 2 þ DO k 2 þ f Þ2 4 DW k 2 ðDO k 2 þ f Þ bWeq k 2 kc (39)
2
Eigenvalue must be positive for an unstable condition. Since all the terms before ± are negative,
the square root term must be positive and sufficiently large in order to make the real part of the
eigenvalue positive. Therefore, the condition for a positive real part is:
qffiffiffiffiffiffiffiffiffiffiffiffiffiffiffiffiffiffiffiffiffiffiffiffiffiffiffiffiffiffiffiffiffiffiffiffiffiffiffiffiffiffiffiffiffiffiffiffiffiffiffiffiffiffiffiffiffiffiffiffiffiffiffiffiffiffiffiffiffiffiffiffiffiffiffiffiffiffiffiffiffiffiffiffiffiffiffiffiffiffiffiffiffiffiffiffiffiffiffiffiffiffiffiffiffiffi
DW k 2 þ DO k 2 þ f < ðDW k 2 þ DO k 2 þ f Þ2 4 DW k 2 ðDO k 2 þ f Þ bWeq k 2 kc (40)
2 2
DW k 2 þ DO k 2 þ f < DW k 2 þ DO k 2 þ f 4 DW k 2 DO k 2 þ f bWeq k 2 kc
(41)
DW k 2 DO k 2 þ f DO k 2 (43)
DW
Since k 2 and DO are positive, we get the following result for instability:
Demir et al. eLife 2020;9:e52781. DOI: https://doi.org/10.7554/eLife.52781 16 of 21Research article Physics of Living Systems
Weq bkc >fDW (44)
Numerical solution
We used numerical methods to solve the coupled partial differential equations. To solve the equa-
tions in time and space, we used COMSOL Multiphysics, finite element methods and periodic
boundary conditions in space. The coupled partial differential equations are implemented by using
general form coupled differential equations:
2
qW V V qV
¼r rW þ WrO (45)
qt 2t 2t qO
qO
¼ DO r2 O þ f ðOam OÞ kc W (46)
qt
Here, we replaced the dispersion and aerotactic coupling coefficients with their definition. In our
simulations, we used V as a parabolic function of O which has the following expression:
V ¼ aO2 þ bO þ c (47)
At the beginning of the simulations, worms are uniformly distributed with additional noise. The
parameters used in the simulations are given below. f and kc are chosen to acquire the width of
experimentally observed domain boundaries and time dynamics. DO , DW ; b, Weq ; Oam and velocity
parameters are experimentally defined. Realistic worm densities and diffusion were measured by
imaging the worms cluster by setting ambient oxygen to 0.
Parameters of velocity (m/s): a ¼ 1:89E 2; b ¼ 3:98E 3; c ¼ 2:25E 4
Tumbling rate: t ¼ 0:5 1/s
Oxygen diffusion coefficient: DO ¼ 2E 5 cm2 =sec
Oxygen penetration rate: f ¼ 0:65 1=sec
Oxygen consumption rate by worms and bacteria: kc ¼ 7:3 E 10 1=sec
Ambient oxygen level Oam ranges between 0 and 0.21
Worm density W, in the uniform stage is around ~ 1–90 worms/mm2
Width and height of the simulation window; L ¼ 2cm
C. elegans strains
Strains were grown and maintained under standard conditions unless indicated otherwise. All the
strains were obtained from Caenorhabditis Genetics Center (CGC).
Strain List: npr1 (DA609), npr1 (CX4148), gcy35 (AX1295), cat2 (CB1112), tph1 (MT15434), bas1
(MT7988), bas1 and cat4 (MT7983), tax2 (PR694), tax4 (PR678), tax2 and tax4 (BR5514), nsy1 (AWC
off killed-CX4998), eat2 (DA465), mec4 (CB1611), mec10 (CB1515), osm9 (VC1262), trpa1 (RB1052),
dig1 (MT2840), trp4 (VC1141), lite1 (ce314), daf19 and daf12 (JT6924), npr-1(ad609) X.
Swarming protocol
Nematode growth media (NGM) plates having a diameter of 9 cm were used for maintaining the
worms. NGM plates were seeded with 1 ml of OP50 culture. After the worms consumed the bacte-
ria, three NGM plates were washed with 1 M9 buffer and the wash was centrifuged twice at 2000
rpm for 30 s. Centrifugation was repeated (up to six times) until a clear supernatant was obtained.
Since multiple centrifugation cycles might affect the activity of worms, the cycles subsequent to the
first two cycles were carried out for 10 s at 2000 rpm. After cleaning the worms, a 150 ml worm drop-
let was put on a 6 cm plate seeded with 100 ml (0.5 1 cm) of OP50 culture. The optimum swarming
pattern was observed in 6-day-old plates and hence 6-day-old plates were used in all further experi-
ments unless indicated otherwise. For NGM plates, M9 buffer preparation and worm synchronization
were done based on the standard protocols given in the wormbook.
Oxygen control and measurements
A plexiglass chamber was used to control the ambient [O2] (Figure 2—figure supplement 4). A 50
sccm mixture of O2 and N2 was used and flow rates were controlled by a flow controller. [O2] was
Demir et al. eLife 2020;9:e52781. DOI: https://doi.org/10.7554/eLife.52781 17 of 21Research article Physics of Living Systems
measured by using a normal oxygen sensor (PreSens, Microx TX3). During [O2] measurements the
sensor probe should be inserted entirely into swarm fluid in order to read valid signals. The fiber
optic sensor has a polymer coating and O2 can easily diffuse from the open air-exposing regions
and can quench the fluorescence signal. During fiber optic removal, capillary meniscus around the
fiber also affects the reading, we only read the ambient signal [O2] when the meniscus breaks.
At the beginning of the swarming experiments, the oxygen levels in the chamber were adjusted
to 21%. After swarming was first observed, oxygen levels were sequentially decreased to 10%, 7%,
3%, and 1% at an interval of ten minutes. Then, oxygen levels were increased in reverse order. The
experiments were recorded using Thorlabs DCC1545M CMOS camera with a Navitar 7000 TV zoom
lens.
Acknowledgements
This work was supported by an EMBO installation grant (IG 3275); The Science Academy,
Turkey, (BAGEP) young investigator award and TUBITAK (project no115F072 and 115S666). We
thank Tevfik Can Yuce for computational support. We thank Mario de Bono and his group members
for discussions and suggestions about the initial observation of the swarming response. We thank
Prof FM Ausubel for providing GFP labeled PA14 strain. We also thank H Kavakli, M Iskin, F Balci, P
A Ramey for the comments and critical reading of the manuscript.
Additional information
Funding
Funder Grant reference number Author
European Molecular Biology IG 3275 Askin Kocabas
Organization
The funders had no role in study design, data collection and interpretation, or the
decision to submit the work for publication.
Author contributions
Esin Demir, Data curation, Formal analysis, Observed the swarm response, Performed swarning
experiments and mutant screens, Wrote the manuscript; Y Ilker Yaman, Conceptualization, Data
curation, Software, Formal analysis, Investigation, Methodology, Performed the pattern formation
experiments, designed the imaging systems, developed the mathematical models, performed the
simulations and carried out image processing analysis of experiments, Wrote the manuscript; Mus-
tafa Basaran, Conceptualization, Data curation, Software, Formal analysis, Investigation, Methodol-
ogy, Performed biofilm experiments, Developed the COMSOL implementation, Wrote the
manuscript; Askin Kocabas, Conceptualization, Resources, Data curation, Software, Formal analysis,
Supervision, Funding acquisition, Validation, Investigation, Visualization, Methodology, Project
administration, Performed the pattern formation experiments, designed the imaging systems, devel-
oped the mathematical models, performed the simulations and carried out image processing analy-
sis of experiments, Performed biofilm experiments, Wrote the manuscript
Author ORCIDs
Y Ilker Yaman https://orcid.org/0000-0003-4094-616X
Mustafa Basaran https://orcid.org/0000-0002-1895-254X
Askin Kocabas https://orcid.org/0000-0002-6930-1202
Decision letter and Author response
Decision letter https://doi.org/10.7554/eLife.52781.sa1
Author response https://doi.org/10.7554/eLife.52781.sa2
Demir et al. eLife 2020;9:e52781. DOI: https://doi.org/10.7554/eLife.52781 18 of 21Research article Physics of Living Systems
Additional files
Supplementary files
. Transparent reporting form
Data availability
All data generated or analyzed during this study are included in the manuscript and supporting files.
References
Artyukhin AB, Yim JJ, Cheong Cheong M, Avery L. 2015. Starvation-induced collective behavior in C. elegans.
Scientific Reports 5:10647. DOI: https://doi.org/10.1038/srep10647, PMID: 26013573
Bargmann CI, Marder E. 2013. From the connectome to brain function. Nature Methods 10:483–490.
DOI: https://doi.org/10.1038/nmeth.2451, PMID: 23866325
Bray AJ. 1994. Theory of phase-ordering kinetics. Advances in Physics 43:357–459. DOI: https://doi.org/10.1080/
00018739400101505
Buhl J, Sumpter DJ, Couzin ID, Hale JJ, Despland E, Miller ER, Simpson SJ. 2006. From disorder to order in
marching locusts. Science 312:1402–1406. DOI: https://doi.org/10.1126/science.1125142, PMID: 16741126
Busch KE, Laurent P, Soltesz Z, Murphy RJ, Faivre O, Hedwig B, Thomas M, Smith HL, de Bono M. 2012. Tonic
signaling from O2 sensors sets neural circuit activity and behavioral state. Nature Neuroscience 15:581–591.
DOI: https://doi.org/10.1038/nn.3061, PMID: 22388961
Calarco JA, Samuel ADT. 2019. Imaging whole nervous systems: insights into behavior from worms to fish.
Nature Methods 16:14–15. DOI: https://doi.org/10.1038/s41592-018-0276-8, PMID: 30573822
Cates ME, Marenduzzo D, Pagonabarraga I, Tailleur J. 2010. Arrested phase separation in reproducing Bacteria
creates a generic route to pattern formation. PNAS 107:11715–11720. DOI: https://doi.org/10.1073/pnas.
1001994107, PMID: 20498087
Cates ME, Tailleur J. 2015. Motility-Induced phase separation. Annual Review of Condensed Matter Physics 6:
219–244. DOI: https://doi.org/10.1146/annurev-conmatphys-031214-014710
Chalasani SH, Chronis N, Tsunozaki M, Gray JM, Ramot D, Goodman MB, Bargmann CI. 2007. Dissecting a
circuit for olfactory behaviour in Caenorhabditis elegans. Nature 450:63–70. DOI: https://doi.org/10.1038/
nature06292, PMID: 17972877
Chen T-H, Guo C, Zhao X, Yao Y, Boström KI, Wong MN, Tintut Y, Demer LL, Ho C-M, Garfinkel A. 2012.
Patterns of periodic holes created by increased cell motility. Interface Focus 2:457–464. DOI: https://doi.org/
10.1098/rsfs.2012.0001
Coates JC, de Bono M. 2002. Antagonistic pathways in neurons exposed to body fluid regulate social feeding in
Caenorhabditis elegans. Nature 419:925–929. DOI: https://doi.org/10.1038/nature01170, PMID: 12410311
de Bono M, Tobin DM, Davis MW, Avery L, Bargmann CI. 2002. Social feeding in Caenorhabditis elegans is
induced by neurons that detect aversive stimuli. Nature 419:899–903. DOI: https://doi.org/10.1038/
nature01169, PMID: 12410303
de Bono M, Bargmann CI. 1998. Natural variation in a neuropeptide Y receptor homolog modifies social
behavior and food response in C. elegans. Cell 94:679–689. DOI: https://doi.org/10.1016/S0092-8674(00)
81609-8, PMID: 9741632
Dervaux J, Capellazzi Resta M, Brunet P. 2017. Light-controlled flows in active fluids. Nature Physics 13:306–312.
DOI: https://doi.org/10.1038/nphys3926
Ding SS, Schumacher LJ, Javer AE, Endres RG, Brown AE. 2019. Shared behavioral mechanisms underlie C.
elegans aggregation and swarming. eLife 8:e43318. DOI: https://doi.org/10.7554/eLife.43318, PMID: 31021320
Garfinkel A, Tintut Y, Petrasek D, Boström K, Demer LL. 2004. Pattern formation by vascular mesenchymal cells.
PNAS 101:9247–9250. DOI: https://doi.org/10.1073/pnas.0308436101, PMID: 15197273
Gart S, Vella D, Jung S. 2011. The collective motion of Nematodes in a thin liquid layer. Soft Matter 7:2444–
2448. DOI: https://doi.org/10.1039/c0sm01236j
Gilad E, von Hardenberg J, Provenzale A, Shachak M, Meron E. 2004. Ecosystem engineers: from pattern
formation to habitat creation. Physical Review Letters 93:098105. DOI: https://doi.org/10.1103/PhysRevLett.93.
098105, PMID: 15447146
Gilad E, von Hardenberg J, Provenzale A, Shachak M, Meron E. 2007. A mathematical model of plants as
ecosystem engineers. Journal of Theoretical Biology 244:680–691. DOI: https://doi.org/10.1016/j.jtbi.2006.08.
006, PMID: 17007886
Gray JM, Karow DS, Lu H, Chang AJ, Chang JS, Ellis RE, Marletta MA, Bargmann CI. 2004. Oxygen sensation
and social feeding mediated by a C. elegans guanylate cyclase homologue. Nature 430:317–322. DOI: https://
doi.org/10.1038/nature02714, PMID: 15220933
Gray JM, Hill JJ, Bargmann CI. 2005. A circuit for navigation in Caenorhabditis elegans. PNAS 102:3184–3191.
DOI: https://doi.org/10.1073/pnas.0409009101, PMID: 15689400
Gray J, Lissmann HW. 1964. The locomotion of nematodes. The Journal of Experimental Biology 41:135–154.
PMID: 14161604
Demir et al. eLife 2020;9:e52781. DOI: https://doi.org/10.7554/eLife.52781 19 of 21You can also read