Kinematics and Timing Constraints in a Transpressive Tectonic Regime: The Example of the Posada-Asinara Shear Zone (NE Sardinia, Italy)
←
→
Page content transcription
If your browser does not render page correctly, please read the page content below
geosciences
Article
Kinematics and Timing Constraints in a Transpressive
Tectonic Regime: The Example of the Posada-Asinara
Shear Zone (NE Sardinia, Italy)
Rodolfo Carosi 1 , Alessandro Petroccia 1, * , Salvatore Iaccarino 1 , Matteo Simonetti 1 ,
Antonio Langone 2 and Chiara Montomoli 1,3
 1    Department of Earth Sciences, University of Turin, Via Valperga Caluso 35, 10125 Torino, Italy;
      rodolfo.carosi@unito.it (R.C.); salvatore.iaccarino@unito.it (S.I.); matteo.simonetti@unito.it (M.S.);
      chiara.montomoli@unito.it (C.M.)
 2    IGG-CNR Pavia, Via Ferrata 1, 27100 Pavia, Italy; langone@crystal.unipv.it
 3    IGG-CNR Pisa, Via Moruzzi 1, 56124 Pisa, Italy
 *    Correspondence: alessandrogiovannimichele.petroccia@unito.it

 Received: 14 July 2020; Accepted: 27 July 2020; Published: 29 July 2020

 Abstract: Detailed geological field mapping, integrated with meso- and microstructural investigations,
 kinematic of the flow and finite strain analyses, combined with geochronology, are fundamental tools
 to obtain information on the temperature–deformation–timing path of crystalline rocks and shear
 zone. The Posada-Asinara shear zone (PASZ) in northern Sardinia (Italy) is a steeply dipping km-thick
 transpressive shear zone. In the study area, located in the Baronie region (NE Sardinia), the presence
 of mylonites within the PASZ, affecting high- and medium-grade metamorphic rocks, provides an
 opportunity to quantify finite strain and kinematic vorticity. The main structures of the study area are
 controlled by a D2 deformation phase, linked to the PASZ activity, in which the strain is partitioned
 into folds and shear zone domains. Applying two independent vorticity methods, we detected an
 important variation in the percentage of pure shear and simple shear along the deformation gradient,
 that increases from south to north. We constrained, for the first time in this sector, the timing of the
 transpressive deformation by U–(Th)–Pb analysis on monazite. Results indicate that the shear zone
 has been active at ~325–300 Ma in a transpressive setting, in agreement with the ages of the other
 dextral transpressive shear zones in the southern Variscan belt.

 Keywords: Sardinian basement; transpression; strain partitioning; vorticity; in situ monazite
 geochronology

1. Introduction
     Shear zones are characterized by strain localization at different scales and the complex behavior of
the involved rocks [1–4]. The activity of shear zones controls the exhumation of crystalline complexes
during the collisional and post-collisional stages of orogenic belts [5–9]. Their geometry and kinematics
strongly affect the way by which large crustal blocks are exhumed [7,10,11]. Structural geologists have
long been interested in the kinematic reconstruction of the crustal-scale shear zones, which is thought to
be one of the most effective ways to constrain key aspects of the tectonic evolution of collision orogens.
Deformation in shear zones is often approximated to simple shear, especially in high-strain zones [7].
However, an important component of pure shear has been detected in many regional-scale shear
zones developed in different tectono-metamorphic conditions [5–7,12–18]. Several vorticity gauges
have been developed and used to quantitatively assess kinematic vorticity in natural shear zones [19].
During progressive deformation, the common pattern of vorticity path along transpressive shear zones
suggests a strain partitioning deformation, characterized by a steep, narrow domain of simple-shear

Geosciences 2020, 10, 288; doi:10.3390/geosciences10080288                         www.mdpi.com/journal/geosciences
Geosciences 2020, 10, 288                                                                            2 of 26

deformation and a wider domain mostly pure-shear dominated [20]. Shear zones contain valuable
information that can be extracted by the analysis of small-scale structures and with implications for
larger-scale tectonics. Field-based studies, supported by further analytical tools, are still necessary when
exploring shear zone evolution. We need to involve detailed microstructural work and high-resolution
techniques to constrain intrinsic and extrinsic factors [21] such as temperature, pressure, mineralogy,
deformation mechanisms and timing. Many works confirm the importance of a multidisciplinary
approach to study shear zones [4,7,9,18,22–26]. In this view, field observations, geochronological data,
deformation microstructures and the vorticity of the flow and finite strain measurements are necessary.
      The Variscan belt is one of the best examples of orogenic belts, where it is possible to
investigate the tectonic mechanisms affecting the crust during its evolution from perpendicular
collision to orogen-parallel transpression. In particular, the Variscan Sardinian basement shows well
preserved exposures of folded and sheared rocks, not overprinted by the Alpine age orogenesis.
Transpressive deformation in the study area (Posada Valley, northern Sardinia, Italy) is linked to an
about 6 km-thick high-strain zone known as Posada-Asinara shear zone (PASZ). We present a new
dataset of field measurements, meso- and microstructural data, kinematics of the flow, finite strain
data combined, and for the first time in this sector of the PASZ, in situ U–Th–Pb (texturally- and
chemically-controlled) geochronology. This paper aims to improve the existing knowledge of this sector
of the PASZ [8,17,27–29]. A deeper investigation of the tectonic evolution of the PASZ is fundamental
to enhance the correlations between the other Variscan fragments in the Mediterranean area.

2. Geological Setting
      The shape of the Variscan belt in Europe is the result of a Devonian–Carboniferous continent–
continent collision between Laurentia–Baltica and Gondwana. Between these two continents,
small microplates known as Avalonia and Armorica, broken away from Gondwana, existed
(Figure 1a) [30,31]. The Variscan belt is characterized by a composite orocline consisting of two main
branches: the western Ibero–Armorican arc [30,32,33] and a minor eastern branch, delimited, to the east,
by a regional-scale shear zone, known as the East Variscan Shear Zone (EVSZ, Figure 1a) [9,18,34,35].
The Corsica–Sardinia Block is located in the southeastern part of the Variscan belt (Figure 1a).
      The lack of the Alpine age overprint makes Sardinia island an important locality to investigate
a sector of the Southern Variscan belt and the transpressive deformation associated with the EVSZ
(Figure 1a).
      The Cambrian to Lower Carboniferous rocks, affected by a prograde Barrovian metamorphism,
from anchizone (SW) to amphibolite facies metamorphism (NE), are characterized by folds and thrusts
indicating a SW tectonic transport [29,36–39]. Carmignani et al. (1994, 2001) [36,40] divided the Sardinian
Variscan chain into three main tectono-metamorphic zones (Figure 1b). From SW to NE they are:
(i) the External Zone (foreland area, southwestern Sardinia), a thrust and fold belt foreland consisting
of a sedimentary sequence from pre-Cambrian(?)–Cambrian to Lower Carboniferous in age [36,40],
showing very low-grade metamorphism; (ii) the Nappe Zone, subdivided into External (central to
southern Sardinia) and Internal Nappes (northern to central Sardinia), results from southward thrusting
with km-scale isoclinal folding and syn-tectonic metamorphism [36]. The External Nappe is made
of a Paleozoic metasedimentary sequence bearing a thick continental Middle Ordovician arc-related
volcanic suite [36]. This zone was deformed mainly under low-grade metamorphic conditions.
The Internal Nappe is constituted by two main metamorphic complexes: the Low-Grade Metamorphic
Complex (LGMC) and the Medium-Grade Metamorphic Complex (MGMC). The LGMC consists of
a Cambrian meta-sedimentary sequence, Ordovician arc-related volcanic rocks, Silurian black-shale
and Devonian marble [36,40]. This complex equilibrated mainly under greenschist facies conditions,
except for the Monte Grighini Unit (Figure 1b) where amphibolite-facies conditions were detected [41].
The MGMC consists of a Cambrian(?) to Ordovician [36] metasedimentary and Ordovician orthogneiss
reaching amphibolite-facies conditions. The orthogneiss crystallization ages are 458 ± 31 Ma and
441 ± 33 Ma [42]; 457 ± 13 Ma [43]; (iii) the Axial or Inner zone characterized by the Migmatitic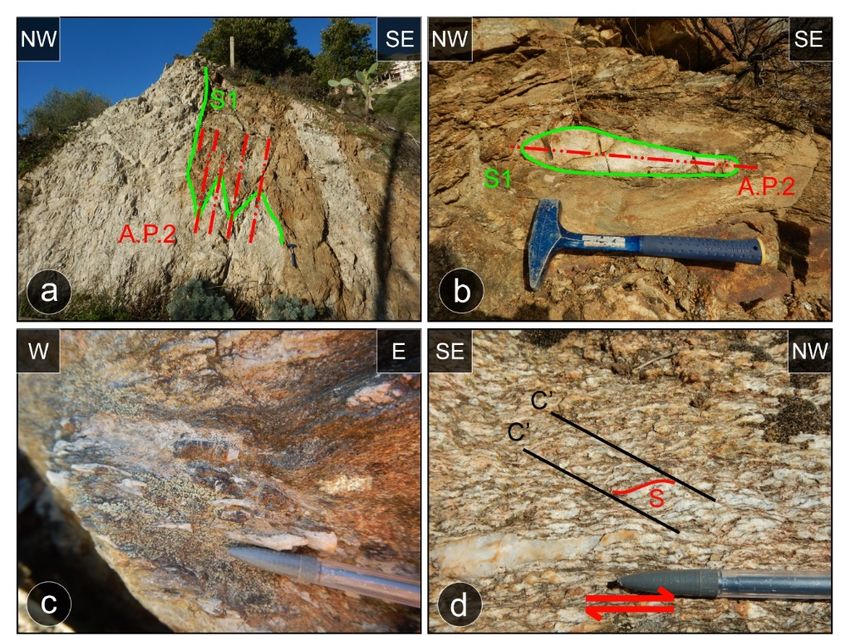
Geosciences 2020, 10, 288 3 of 26
Complex (High-Grade Metamorphic Complex: HGMC) is made up of Cambrian(?) micaschist, para-
and Ordovician ortho-derived migmatite [44]. Migmatite contains mafic bodies preserving a complex
metamorphic evolution, from eclogitic stage up to greenschist re-equilibration, related to Variscan
history [45,46].
Geosciences 2020, 10, x FOR PEER REVIEW 3 of 29
Figure 1. (a) Reconstruction of the Variscan Belt during the late Carboniferous age (modified from
Figure 1. (a) Reconstruction of the Variscan Belt during the late Carboniferous age (modified from
Carosi et al. 2012
Carosi et [9] and[9]Simonetti
al. 2012 et al.
and Simonetti 2018
et al. 2018[18]). Thegeographic
[18]). The geographic location
location of the Sardinian
of the Sardinian island is island is
shown; (b)shown;
the simplified geological
(b) the simplified map ofmap
geological the Variscan basement
of the Variscan in Sardinia
basement showing
in Sardinia showing thethe
distribution
distribution
of the different of the different tectono-metamorphic
tectono-metamorphic zones (modified zones after
(modified after Carmignani
Carmignani et al.et1994
al. 1994 [36]).The PASZ
[36]).
The PASZ high-strain zone is showed by the red shadow.
high-strain zone is showed by the red shadow.
The lack of the Alpine age overprint makes Sardinia island an important locality to investigate
The boundary zone
a sector of the between
Southern the Low-
Variscan belt andtothe
Medium Grade
transpressive Metamorphic
deformation Complex
associated with the(L–MGMC)
EVSZ and
the HGMC is marked
(Figure 1a). by the Posada-Asinara shear zone (PASZ) [8,17,23,47], a nearly 150 km-long
transpressive The Cambrian
Variscan to Lower
shear zoneCarboniferous
affecting both rocks,complexes.
affected by a prograde Barrovian metamorphism,
The metamorphic basement is widely
from anchizone (SW) to amphibolite facies metamorphism (NE), are characterized by folds and
intruded by Late Carboniferous–Early Permian granitoids constituting the Sardinian batholith, and/or
thrusts indicating a SW tectonic transport [29,36–39]. Carmignani et al. (1994, 2001) [36,40] divided
unconformably overlain
the Sardinian by the
Variscan Late
chain intoCarboniferous–Early Permian
three main tectono-metamorphic sedimentary
zones basins
(Figure 1b). From SW[48].
to NEDuring the
syn-collisional shortening
they are: andZone
(i) the External thickening
(forelandstage, both L–MGMC
area, southwestern anda HGMC
Sardinia), thrust andunderwent high-pressure
fold belt foreland
consisting of a related
(HP) metamorphism, sedimentary sequence
to the from pre-Cambrian(?)–Cambrian
D1 deformation to Lower Carboniferous
phase, with metapelites in
reaching pressures of
age [36,40], showing very low-grade metamorphism; (ii) the Nappe Zone, subdivided into External
nearly 1.7 GPa [49]. The HP metamorphic signature [49], allows linking the prograde metamorphism
(central to southern Sardinia) and Internal Nappes (northern to central Sardinia), results from
to underthrusting
southward and nappe
thrusting withstacking. The different
km-scale isoclinal portions
folding and of the
syn-tectonic metamorphic
metamorphism basement in
[36]. The
northern Sardinia show
External Nappe different
is made P–T trajectories,
of a Paleozoic metasedimentary in sequence
response to the
bearing diachronous
a thick metamorphic
continental Middle
evolution Ordovician arc-related
of the different volcanic
areas suite but
[50–52], [36].the
Thisgeneral
zone was deformed
trend mainly under
is a clockwise P–T low-grade
path, typical of
metamorphic conditions. The Internal Nappe is constituted by two main metamorphic complexes:
subduction/collisional belts [53]. A northward increase in the Barrovian metamorphism has been
the Low-Grade Metamorphic Complex (LGMC) and the Medium-Grade Metamorphic Complex
recognized [39,50].The
(MGMC). Barrovian
LGMC consistsminerals began tometa-sedimentary
of a Cambrian grow at the end of theOrdovician
sequence, collisional stage (D1 phase).
arc-related
Sometimes they rocks,
volcanic growSilurian
syn-kinematically at the beginning
black-shale and Devonian of This
marble [36,40]. transpressive stage (D
complex equilibrated 2 phase) [17].
mainly
under greenschist
In the L–MGMC, the Barrovianfacies conditions,
metamorphism except for
hasthe
beenMonte
dated Grighini Unit (Figure
at ~350–330 1b) where
Ma, based on Ar–Ar on
mica in meta-pelitic rocks and U–Th–Pb monazite datings on para- and ortho-derivate metamorphic
rocks [9,28,54]. The D1 collision-related deformation is well recorded in the L–MGMC, where it
is associated with a penetrative S1 axial plane foliation of SW-facing folds. Towards the north,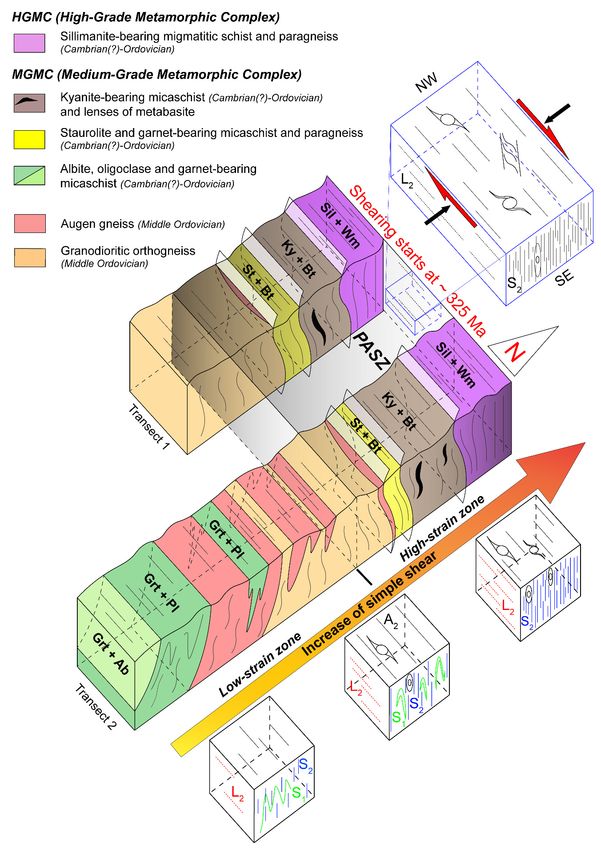
Geosciences 2020, 10, 288                                                                                                               4 of 26

the S1 foliation is progressively transposed by the D2 phase developed in an orogen-parallel dextral
transpression regime [17]. This was responsible for most of the exhumation of high-grade metamorphic
rocks with initial increasing temperature followed by decompression and cooling [8,23,27,29]. The onset
of the transpression, giving rise to the PASZ [8,15,17,55], developed in amphibolite-facies metamorphism
and it has been constrained at ~320–315 Ma (Ar–Ar on white mica and U–Th–Pb on monazite [9,28]).
The transpressive activity of the PASZ continued during the D3 phase under shallower crustal
conditions. D3 deformation phase is characterized mainly by metric chevron and/or asymmetric folds,
associated with an S3 axial plane crenulation cleavage [56]. The post-transpressional evolution was
characterized by the inversion from contractional to extensional tectonics. The end of the orogenic
activity is characterized by the collapse of the belt (D4 phase), associated with open folds, brittle-ductile
shear zones and locally by the emplacement of syn-tectonic granites [45,57].
     The study area, located in the north-eastern Sardinia between the MGMC and the HGMC, extends
for nearly 200 km2 between the Posada lake and the Montalbo Massif (Figure 2a) and comprises the
south-eastern sector of the PASZ (Figure 1b). An updated geological map of the area, derived from a
new detailedGeosciences 2020, 10, x FOR PEER REVIEW
               geological       survey at the 1:10.000 scale, is shown in Figure 2.       5 of 29

      Figure 2. (a) Geological sketch map of the study area (Baronie area, see Figure 1). The two sampling
                    Figure 2. (a) Geological sketch map of the study area (Baronie area, see Figure 1). The two sampling
      transects (1 and    2) and the low- and high-strain zone are indicated. The Posada-Asinara shear zone
                    transects (1 and 2) and the low- and high-strain zone are indicated. The Posada-Asinara shear zone
      (PASZ) is also(PASZ)
                      displayed.       A geological
                            is also displayed.          cross-section,
                                               A geological                notinin
                                                            cross-section, not   thethe
                                                                                     samesame    scale
                                                                                           scale of      of the
                                                                                                    the map,      map,below;
                                                                                                             is present is present below;
      (b) the details
                    (b)of
                        thethe  two
                            details of studied    areas.
                                       the two studied     Labels
                                                       areas. Labelsofof the  selected
                                                                         the selected     study
                                                                                      study  samplessamples      and the corresponding
                                                                                                       and the corresponding
                    types of analysis are reported; (c) 3D simplified block diagram showing the final structural
      types of analysis   are reported; (c) 3D simplified block diagram showing the final structural architecture
                    architecture related to the superposition of different deformation phases. Stereoplot (equal angle,
      related to thelower
                     superposition       of different
                           hemisphere projections)       deformation
                                                    of the main structuralphases.
                                                                            elements Stereoplot
                                                                                      are given.      (equal angle, lower hemisphere
      projections) of the main structural elements are given.
                        The Paleozoic metasedimentary sequence of this sector, consisting of micaschist and paragneiss,
                 is characterized by a metamorphic zonation showing an increase in metamorphic grade from south
                 to north. Four metamorphic zones occur, marked by the growth of: (i) garnet; (ii) staurolite + biotite;
                 (iii) kyanite + biotite; (vi) sillimanite + white mica. The garnet zone is further subdivided into garnet +
                 albite and garnet + oligoclase sub-zones [39,51,58]. Granodioritic and granitic augen orthogneiss and
                 amphibolite lenses within the kyanite-bearing micaschist are also present. From the southern (low-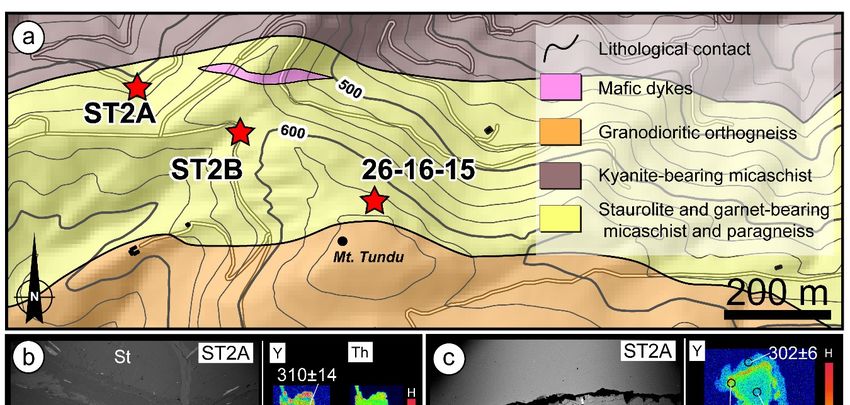
Geosciences 2020, 10, 288                                                                              5 of 26

       The Paleozoic metasedimentary sequence of this sector, consisting of micaschist and paragneiss,
is characterized by a metamorphic zonation showing an increase in metamorphic grade from south to
north. Four metamorphic zones occur, marked by the growth of: (i) garnet; (ii) staurolite + biotite;
(iii) kyanite + biotite; (vi) sillimanite + white mica. The garnet zone is further subdivided into garnet
+ albite and garnet + oligoclase sub-zones [39,51,58]. Granodioritic and granitic augen orthogneiss
and amphibolite lenses within the kyanite-bearing micaschist are also present. From the southern
(low-strain zones) to the northern sector (high-strain zones), the rocks become progressively more
sheared (Figure 2a).

3. Field Data, Deformation History and Mesoscale Observations
       In the study area, four deformation phases were recognized (Figure 2c). The oldest deformation
phase (D1 ) is testified by an older penetrative relict foliation (S1 ) mainly recognizable at the microscale,
and poorly developed at the mesoscale, observed only in the hinges of D2 structures. F2 folds are tight,
isoclinal to locally ptygmatic. They are both cylindrical (Figure 3a) and non-cylindrical (sheath fold;
Figure 3b). They show rounded and thickened hinges with stretched limbs (class 2 [59]), that can be
classified as B5 according to Hudleston (1973) [60]. F2 km-scale folds (Lodè Antiform and Mamone
Synform; Figure 2a) are developed at the map scale. A2 fold axes show a main E–W to NNE–SSW
trend gently plunging with quite scattered values (Figure 2c).
       F2 axial planes, parallel to the S2 foliation, dip moderately toward S–SSE, with a local variation
toward N–NNW (Figure 2c). A well developed and penetrative S2 foliation is the main planar structural
element recognized in the study area. The S2 foliation shows a general E–W to WNW–ESE strike
and dips at high angles both to the N–NE and to the S–SW (Figure 2c). S2 changes from an F2 axial
plane foliation, classified as a disjunctive cleavage with sub-parallel cleavage domains, in the southern
part of the area, to a mylonitic continuous foliation, toward the northern sector. In migmatitic gneiss,
the S2 is defined by biotite- and sillimanite-rich layers. The L2 object lineation [61] is represented by
both grain and aggregate lineation. L2 becomes prominent as the shearing increases. It is defined by
elongate biotite and muscovite crystals, by millimetre to centimetre-scale quartz ribbons, elongate
quartz-feldspar aggregates and elongated and boudinated staurolite (Figure 3c). The L2 shows a
N80–N120 main trend and gently plunges toward both E and W (Figure 2c). The lithotypes located
in the southern sector of the study area show few kinematic indicators, whereas, approaching the
high-strain zone of the PASZ in the northern sector, they become more frequent. Shear sense indicators
have been observed at the mesoscale on a section parallel to the XZ plane of the finite strain ellipsoid
(i.e., perpendicular to the S2 foliation and parallel to the L2 lineation). The main kinematic indicators are
represented by C–S and C’–S fabrics (Figure 3d), σ- and δ-type porphyroclasts (Figure 3e), asymmetric
strain fringes around staurolite and garnet porphyroclasts and shear bands boudins. All kinematic
indicators indicate a top-to-the-NNW sense of shear. F3 folds, affecting the S2 foliation, are the main
evidence of D3 phase in the study area. The F3 folds show kink (Figure 3f), chevron and/or asymmetric
geometry (Figure 3g), with rounded hinges and locally asymmetric profiles. The D3 deformation
phase increases in intensity moving toward the high-strain zone. F3 fold axes, A3 , generally trend
parallel both to the F2 fold axes and to the L2 object lineation, with higher plunging values (Figure 2c).
In some areas, an intersection lineation, between F3 axial planes and S2 foliation occurs. An axial
plane foliation is generally not well developed, but a D3 -related crenulation cleavage (S3 ) is locally
present. A syn-kinematic growth of chlorite in the hinges of F3 folds was observed. The F2 –F3 fold
interference pattern shows parallel axes and sub-orthogonal axial planes (Type 3 [59]). During the D4
deformation phase, metric- and decimetre-scale F4 open folds developed with both sub-horizontal axes
and axial planes (Figure 3h). A4 axes plunge at low angles toward E or W with very high dispersion
(Figure 2c). F4 folds re-orient and deform the original attitude of both the D2 and D3 previous structural
elements, causing a variation in the orientation of the S2 mylonitic foliation. D4 phase is not associated
with the development of foliations and object lineations. In some sectors, folds often coupled with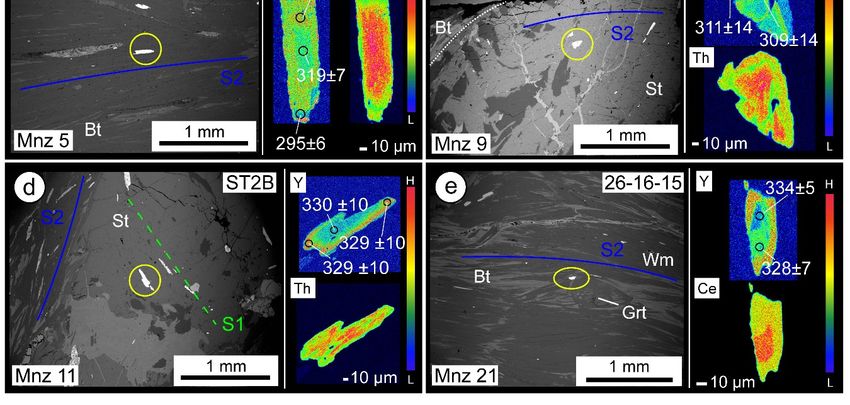
3. Field Data, Deformation History and Mesoscale Observations
         In the study area, four deformation phases were recognized (Figure 2c). The oldest deformation
   phase (D1) is testified by an older penetrative relict foliation (S1) mainly recognizable at the microscale,
   and poorly developed at the mesoscale, observed only in the hinges of D2 structures. F2 folds are tight,
Geosciences 2020, 10, 288                                                                                  6 of 26
   isoclinal to locally ptygmatic. They are both cylindrical (Figure 3a) and non-cylindrical (sheath fold;
   Figure 3b). They show rounded and thickened hinges with stretched limbs (class 2 [59]), that can be
   classified
thin,          as B5 according
       millimetre-scale,           to Hudleston (1973)
                             brittle/brittle-ductile    [60].
                                                     shear    F2 km-scale
                                                            planes,        folds (Lodè
                                                                     developed   along Antiform
                                                                                       the axial and  Mamone
                                                                                                  plane surfaces.
   Synform;    Figure   2a) are developed  at the map scale. A2 fold axes show a main E–W to NNE–SSW trend
These observations suggest that the D4 phase developed at a shallower structural level.
   gently plunging with quite scattered values (Figure 2c).

     Figure
        Figure3. 3.(a)
                    (a)FF22 cylindrical
                            cylindricalfolds,
                                          folds,ininthethe granodioritic
                                                        granodioritic     orthogneiss
                                                                      orthogneiss      and leucogneiss,
                                                                                  and leucogneiss,        deforming
                                                                                                   deforming  an olderan
     older   relict  foliation   (S   ) (40 ◦ 350 30.900 N–9◦ 310 52.500 E); (b) F non-cylindrical folds (sheath fold)
                                    1
        relict foliation (S1) (40°35′30.9″                                        2
                                                N–9°31′52.5″ E); (b) F2 non-cylindrical folds (sheath fold) deforming
     deforming the older foliation (S1 ) in the garnet-bearing micaschist (40◦ 380 3900 N–9◦ 380 2300 E); (c) L2
     sub-horizontal object lineation, defined by staurolite crystals, in staurolite-garnet-bearing micaschist
     (40◦ 360 600 N–9◦ 340 5700 E); (d) mesoscopic aspect of D2 deformation. C’–S fabric in granodioritic
     orthogneiss, pointing to a top-to-the NW sense of shear (40◦ 350 4500 N–9◦ 350 2900 E); (e) sheared augen
     gneiss with C–S fabric showing a dextral sense of shear (top-to-the NW). σ-type porphyroclast pointing
     a top-to-the NW sense of shear is also present (40◦ 350 5800 N–9◦ 330 5000 E); (f) kink folds (F3 fold) in
     granodioritic orthogneiss affecting the S2 mylonitic foliation (40◦ 350 2900 N–9◦ 290 5600 E); (g) asymmetric
     F3 folds in garnet-bearing micaschist that affect the S2 mylonitic foliation (40◦ 340 5800 N–9◦ 370 4400 E);
     (h) late open folds (F4 ) with sub-horizontal axes and axial planes deforming the main foliation in
     staurolite-garnet-bearing micaschist (40◦ 360 600 N–9◦ 350 200 E).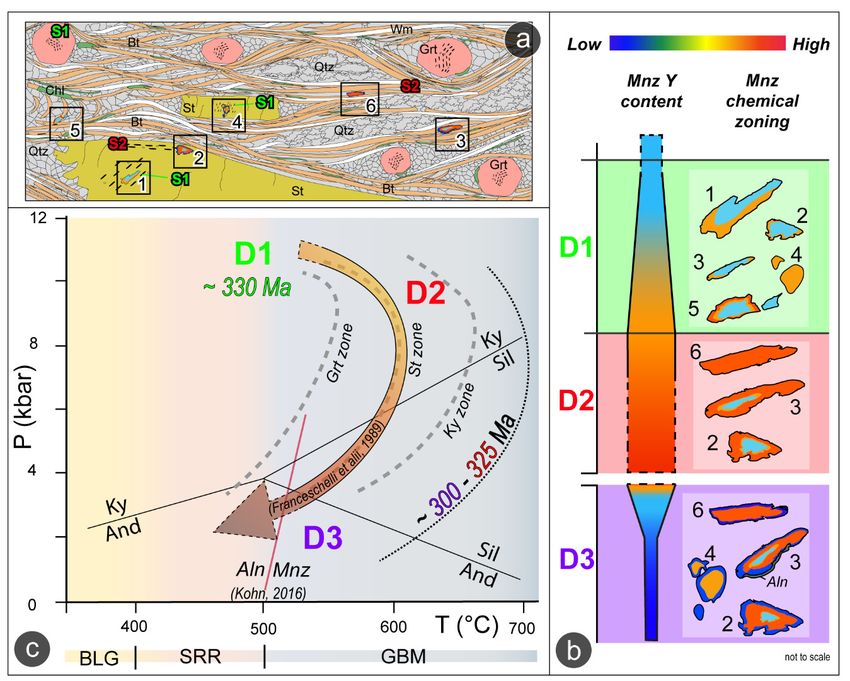
Geosciences 2020, 10, 288                                                                                                       7 of 26

4. Microstructures
     Microstructural analysis was performed on samples collected along two parallel transects
(Figure 2b) perpendicular to the shear zone boundaries and the deformation gradient. The summary
of the microstructural and petrographic investigation is reported in Figure 4. Microstructures are
described according to the different lithologies. Mineral abbreviations are after Whitney and Evans
(2010) [62].Geosciences 2020, 10, x FOR PEER REVIEW                                    8 of 29

      Figure 4. Summary       diagram
                 Figure 4. Summary        where
                                      diagram      metamorphic
                                                where                paragenesis,
                                                       metamorphic paragenesis,       quartz
                                                                                  quartz       recrystallization
                                                                                         recrystallization           mechanism,
                                                                                                            mechanism,
                 vorticity number
      vorticity number      and theandrelated
                                        the related percentageof
                                                percentage      of pure
                                                                   pure shear
                                                                          shearareare
                                                                                   shown  and are
                                                                                       shown    and plotted against the
                                                                                                      are plotted     against the
                 distance from the core of the PASZ. SRR = subgrain rotation recrystallization, GBM = grain boundary
      distance from the core of the PASZ. SRR = subgrain rotation recrystallization, GBM = grain boundary
                 migration. The distribution of the samples shows increasing Wk values (i.e., increase in the simple
      migration.shear
                   Thecomponent)
                         distribution    of the
                                    toward  theshear
                                                 samples    shows
                                                      zone (trend:   increasing
                                                                   grey area).     Wk values (i.e., increase in the simple
      shear component) toward the shear zone (trend: grey area).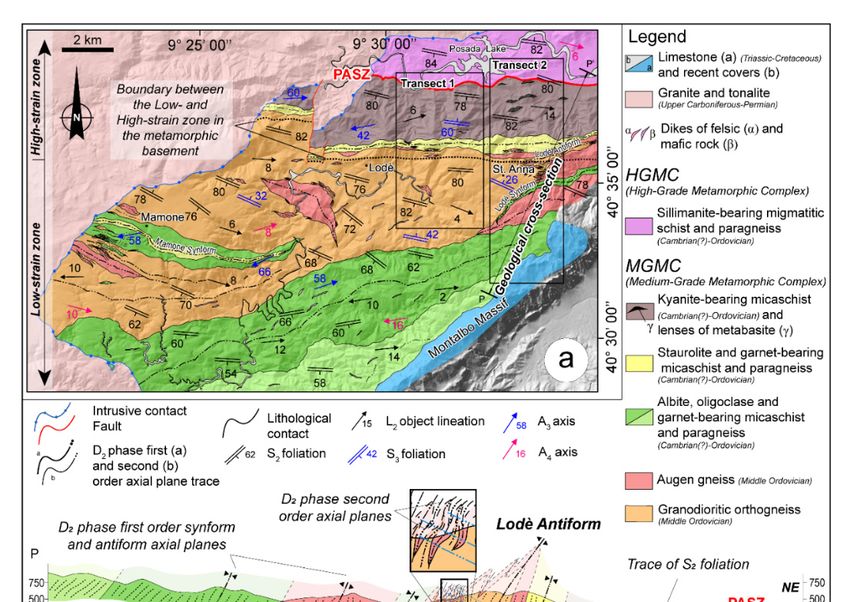
Geosciences 2020, 10, 288                                                                                                            8 of 26

      Geosciences 2020, 10, x FOR PEER REVIEW                                                                                  9 of 29
     Micaschist and paragneiss are characterized by both a disjunctive cleavage, with sub-parallel
          Micaschist and
cleavage domains,    and paragneiss are characterized
                         a continuous                 by both made
                                         schistosity mainly   a disjunctive cleavage,
                                                                     of biotite       withmica
                                                                                + white    sub-parallel
                                                                                               and quartz
     cleavage domains, and a continuous schistosity mainly made of biotite + white mica and quartz
(Figure 5a).
      (Figure 5a).

      Figure   5. (a) Dynamically recrystallized quartz in staurolite-bearing micaschist showing lobed and
            Figure 5. (a) Dynamically recrystallized quartz in staurolite-bearing micaschist showing lobed and
      irregular  boundaries
            irregular           indicative
                         boundaries         of grainofboundary
                                        indicative                  migration migration
                                                           grain boundary          (GBM). Subgrain
                                                                                                 (GBM).rotation
                                                                                                           Subgrain recrystallization
                                                                                                                         rotation
      (SRR)recrystallization
             overprinting is(SRR)highlighted   by the
                                       overprinting      presence ofby“core
                                                     is highlighted             and mantle”
                                                                           the presence          structure.
                                                                                          of “core           An structure.
                                                                                                    and mantle”    oblique foliation,
                                                                                                                              An
      Sb, defined
            obliqueby   elongated
                     foliation,       quartz,by
                                 Sb, defined   is elongated
                                                  present (XPL);
                                                              quartz,(b)    oligoclase
                                                                        is present        porphyroclast,
                                                                                     (XPL);  (b) oligoclasein  oligoclase-bearing
                                                                                                             porphyroclast,     in
      micaschist,   showing anmicaschist,
            oligoclase-bearing     internal foliation
                                               showingSan  1 (green
                                                              internalline),   defined
                                                                          foliation  S 1  by ilmenite
                                                                                         (green  line), +  graphite.
                                                                                                        defined   by    Oligoclase
                                                                                                                      ilmenite   +  is
            graphite.
      wrapped          Oligoclase
                  by the            is wrapped
                          main foliation         by the
                                            S2 (blue      main
                                                       line)    foliation
                                                             defined                  + white
                                                                             2 (blue line)
                                                                        bySquartz           defined
                                                                                                 micaby+quartz
                                                                                                          biotite+ white
                                                                                                                   (XPL);mica    +
                                                                                                                            (c) garnet
            biotite (XPL);
      porphyroclast,     in (c) garnet porphyroclast,
                            garnet-bearing      mylonitic in garnet-bearing
                                                              micaschist, showingmyloniticanmicaschist,  showing an
                                                                                               internal foliation     S1 internal
                                                                                                                          (green line)
            foliation S 1 (green line) defined by ilmenite + elongated quartz. Garnet is wrapped by the main
      defined by ilmenite + elongated quartz. Garnet is wrapped by the main foliation S2 (blue line) defined
            foliation S2 (blue line) defined by white mica + biotite (PPL); (d) staurolite in staurolite-bearing
      by white mica + biotite (PPL); (d) staurolite in staurolite-bearing micaschist, showing an internal
            micaschist, showing an internal foliation S1 (green line), discordant with respect to the foliation in the
      foliation S1 (green line), discordant with respect to the foliation in the rim which is in continuity with
            rim which is in continuity with the external foliation S2 (blue line). This observation point to an inter-
      the external foliation S2 (blue line). This observation point to an inter- to early-syn tectonic growth of
            to early-syn tectonic growth of staurolite (PPL); (e) dynamically recrystallized quartz in staurolite-
      staurolite (PPL); (e) dynamically recrystallized quartz in staurolite-bearing micaschist showing lobate
      and irregular grain boundaries indicative of GBM (XPL); (f) C’–S fabric (S plane = red dashed line,
      C’ plane = black line) in garnet-bearing micaschist, indicating a top-to-the NW sense of shear (PPL).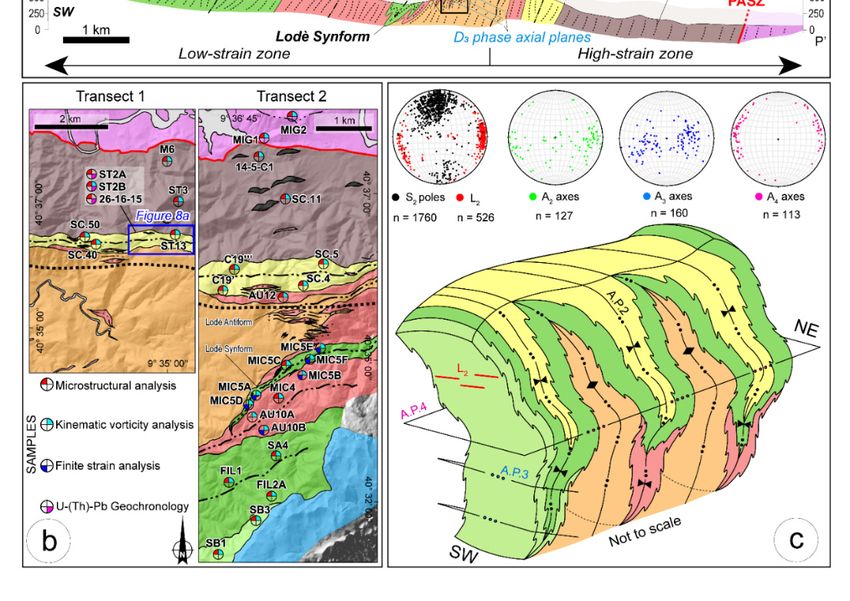
Geosciences 2020, 10, 288                                                                            9 of 26

      The S2 foliation wraps around albite/oligoclase (Figure 5b), garnet (Figure 5c), staurolite and
kyanite porphyroclasts. Barrovian minerals show an internal foliation (S1 ), mainly made by quartz,
white mica, ilmenite, rutile and graphite, generally not continuous concerning the external one.
These observations indicate an inter-kinematic growth of Barrovian minerals (i.e., between the D1 phase
and the D2 mylonitic shearing). In some staurolite crystals, two internal foliations are recognizable.
In the core of the grains, an internal foliation S1 is present. The core is characterized by the presence of
an internal foliation S1, discordant with respect to the external foliation. In the rims, another internal
foliation, concordant with the external one, is present (Figure 5d). These observations indicate an
inter- to syn-tectonic (syn-S2 ) growth of the staurolite (i.e., between the D1 and D2 phase and during
the early D2 phase). Quartz in mylonite displays undulose extinction and tilt walls. Quartz lobate
and ameboid grain boundaries suggest dynamic recrystallization by grain boundary migration
(GBM, [63,64] (Figure 5e). In some samples, quartz shows new grains of smaller size surrounding larger
crystals forming a “core and mantle structure” [65], with weakly bimodal grain size. This indicates an
overprinting of subgrain rotation recrystallization (SRR) on GBM [66]. A top-to-the-NW sense of shear
is highlighted by oblique foliation in recrystallized quartz domains, by mica-fish and S–C–C’ fabric
(Figure 5f) and asymmetric strain fringes around porphyroclasts. In granodioritic and the granitic
augen orthogneiss, the S2 disjunctive cleavage is marked by biotite ± white mica. The occurrence of
asymmetric myrmekites and asymmetric K-feldspar porphyroclasts points to a top-to-the-NW sense of
shear. In the migmatite gneiss, the mylonitic foliation is defined by biotite, white mica, ± fibrolitic
sillimanite and wraps around sheared leucosomes consisting of quartz and feldspar. Sillimanite,
growing parallel to the S2 foliation, is syn-kinematic with the D2 phase. However, sillimanite is
frequently retrogressed to fine-grained white mica. In migmatite gneiss, the chessboard extinction of
quartz is also recognizable, indicating deformation temperatures above 650 ◦ C [64]. Feldspar shows
mechanical twinning, undulose extinction and sometimes fractures. At the microscale, amphibolite
lenses hosted in kyanite-bearing rocks are constituted by the alternations of plagioclase-rich and green
amphibole-rich levels intercalated with quartz + plagioclase and garnet bands.

5. Vorticity and Finite Strain of the PASZ

5.1. Methodology
      A total of 34 samples (micaschist, para- and orthogneiss) from the PASZ were analyzed (Figure 2b,
Figure 4). Vorticity analyses were performed on the samples poorly affected by post-D2 deformation,
on sections parallel to the L2 lineation and perpendicular to the S2 mylonitic foliation (XZ plane of the
finite strain ellipsoid). The complete list of the samples selected for vorticity and strain analyses and
the corresponding results are summarized in Table 1.
      The flow regime of the PASZ was investigated, applying two independent kinematic vorticity
gauges: the C’ shear band method [22] for 26 samples, and the stable porphyroclasts method [12,66] on
eight samples. The first method is based on the observation of whether C’ plane nucleates are parallel
to the bisector of the angle between the two apophyses of the flow [67–70]. If so, the orientation of C’
planes concerning the shear zone boundaries, approximated by the C planes, is related to the kinematic
vorticity (Wk) of the flow. It is, therefore, possible to measure the angle ν between the C and C’ planes
and to estimate the Wk, according to the relation:

                                               Wk = cos 2ν                                              (1)

    The maximum value of ν is preferable as it is representative, or close to, the original angle of
nucleation of C’ planes [22].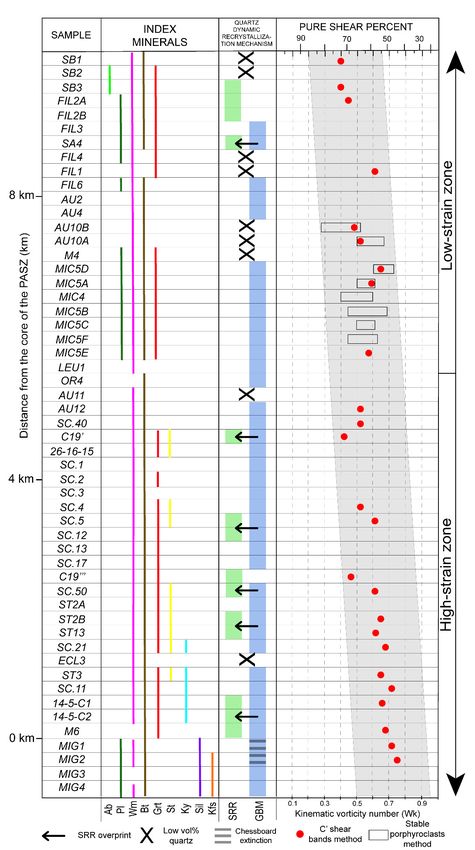
Geosciences 2020, 10, 288                                                                                                                                                                   10 of 26

              Table 1. Results of the kinematic vorticity and the finite strain calculations collected along the two study transects (see Figure 2 for samples location).

                                 C’ Shear Bands Method                           Porphyroclasts Method                               Finite Strain Analysis                Convergence Angle
   SAMPLE        N     ν ANGLE         2ν Angle           θ Angle   N     Rc      Rc      Rc     Wk      Wk     Wm     Rxz    Ryz        K     Stretching     Shortening   Shear    Convergence
    NAME                  (◦ )            (◦ )     Wk       (◦ )          min     max     m      min     max                                       %             %         Strain     Angle
     SB1         39       33              66       0.40      12      -     -       -       -      -       -      -      -      -         -          -             -           -         -
      SB3        21         33            66       0.40     12       -     -        -      -      -       -      -      -      -         -          -             -          -          -
     FIL1        17         26            52       0.61     19       -     -        -      -      -       -      -      -      -         -          -             -          -          -
     FIL2A       24         32            64       0.44     13       -     -        -      -      -       -      -      -      -         -          -             -          -          -
      SA4        18         27            54       0.59     18       -     -        -      -      -       -      -      -      -         -          -             -          -          -
    MIC5A        16         27            54       0.59     18      154   1.73     2.00   1.86   0.50    0.60   0.55   2.40   1.91      0.29       37            29         0.55       54◦
    MIC5B        -          -              -        -        -      219   1.64     2.37   2.00   0.45    0.69   0.57   1.96   1.69      0.24       31            24         0.38       57◦
    MIC5C        -          -              -        -        -      231   1.75     2.10   1.92   0.51    0.63   0.57    -      -         -          -             -          -          -
    MIC5D        18         25            50       0.64     20      259   2.00     2.63   2.31   0.60    0.74   0.67   2.59   1.81      0.53       41            30         0.58       51◦
    MIC5E        22         28            56       0.57     17       -     -        -      -      -       -      -     1.67   1.30      0.97       21            18         0.27       59◦
    MIC5F        -          -              -        -        -      67    1.63     2.12   1.87   0.45    0.63   0.54   2.25   1.96      0.16       39            29         0.42       57◦
     MIC4        -          -              -        -        -      49    1.37     2.00   1.68   0.41    0.60   0.50    -      -         -          -             -          -          -
     SC.4        44         29            58       0.53     16       -     -        -      -      -       -      -      -      -         -          -             -          -          -
     SC.5        26         26            52       0.61     19       -     -        -      -      -       -      -      -      -         -          -             -          -          -
     C19’        61         32            64       0.44     13       -     -        -      -      -       -      -      -      -         -          -             -          -          -
     C19”’       67         31            62       0.47     14       -     -        -      -      -       -      -      -      -         -          -             -          -          -
     SC.50       61         26            52       0.61     19       -     -        -      -      -       -      -      -      -         -          -             -          -          -
     ST13        17         26            52       0.61     19       -     -        -      -      -       -      -      -      -         -          -             -          -          -
     SC.40       59         29            58       0.53     16       -     -        -      -      -       -      -      -      -         -          -             -          -          -
     ST2B        32         25            50       0.64     20       -     -        -      -      -       -      -      -      -         -          -             -          -          -
    AU10A        29         29            58       0.53     16      183   1.71     2.20   1.95   0.50    0.66   0.58    -      -         -          -             -          -          -
    AU10B        41         31            62       0.47     14      126   1.30     1.75   1.52   0.27    0.51   0.39   2.05   1.84      0.14       38            28         0.34       60◦
     AU12        17         29            58       0.53     16       -     -        -      -      -       -      -      -      -         -          -             -          -          -
     SC.21       77         23            46       0.69     21       -     -        -      -      -       -      -      -      -         -          -             -          -          -
      ST3        26         25            50       0.64     20       -     -        -      -      -       -      -      -      -         -          -             -          -          -
      M.6        56         23            46       0.69     21       -     -        -      -      -       -      -      -      -         -          -             -          -          -
     SC.11       40         22            44       0.72     22       -     -        -      -      -       -      -      -      -         -          -             -          -          -
    14-5-C1      36         24            48       0.67     20       -     -        -      -      -       -      -      -      -         -          -             -          -          -
     MIG1        23         22            44       0.72     22       -     -        -      -      -       -      -      -      -         -          -             -          -          -
     MIG2        30         21            42       0.74     24       -     -        -      -      -       -      -      -      -         -          -             -          -          -
Geosciences 2020, 10, 288 11 of 26
The second vorticity gauge is based on the rotational behavior of rigid objects within a flowing
matrix [8,12,14,71]. The stable porphyroclasts method is based on three main assumptions ([15] and
references therein): (i) porphyroclasts are considered to be rigid objects in a Newtonian viscous matrix
constantly deformed; (ii) clasts and matrix should be perfectly coupled together and slips do not
occur between them; and (iii) there is no interference or interaction between clasts. To prove that the
first condition has been assessed, it must be verified that the porphyroclasts do not show internal
deformation and they are harder to deform compared to the matrix [15]. The second condition was
tested by plotting porphyroclast distribution against the theoretical curves of Mulchrone [72,73],
calculated for different Wk values for a system in which the slip between porphyroclasts and matrix
occurs, as suggested by Iacopini et al. (2011) [15]. The third condition is satisfied if the porphyroclasts
are positioned far from each other and are free to rotate. This method consists in the identification of a
critical aspect ratio (Rc) that separates the porphyroclasts that reached a stable position from the ones
that experienced a continuous rotation. According to Passchier (1987) [12] and Wallis et al. (1993) [66],
Rc is related to Wm according to the relation:
Rc2 − 1
Wm = (2)
Rc2 + 1
Measurements were performed using the software EllipseFit 3.2 [74] on the samples with an
adequate amount of garnet and K-feldspar porphyroclasts. Examples of the applications of the two
vorticity gauges are given in Figure 6a,b.
The full dataset, related to the vorticity calculations and also containing the Mulchrone tests [72,73]
is given in Figures S1–S5. To check the type of deformation of the shear zone, according to Fossen
and Tikoff, (1993) [75] and Fossen et al. (1994) [76], we calculated the θ angle formed between the
maximum instantaneous stretching axis (ISAmax) in the horizontal plane and the shear zone boundary.
The θ angle calculation was performed using the formula [19]:
sin−1 Wk
θ= (3)
2
Finite strain analysis was performed with the centre-to-centre method [77,78] on both the XZ and
YZ sections of the finite strain ellipsoid. The complete finite strain results are reported in Figure S6.
Selected examples are reported in Figure 6c. To quantify the amount of shortening perpendicular
to the mylonitic zone, finite strain and vorticity data from the same sample were combined [7,66].
Convergence angles were estimated according to Fossen and Tikoff (1998) [79]. The proposed relation is:
kx
−1 ky
α = tan ln (4)
γ
where α is the convergence angle, kx and ky are the X and the Z axis of the finite strain, respectively,
and γ is the shear strain.Geosciences2020,
Geosciences 10,x 288
2020,10, FOR PEER REVIEW 1312ofof2926
Figure 6. Example of vorticity and finite strain results in a garnet-bearing micaschist: (a) polar
histogram
Figure used to derive
6. Example the angle
of vorticity between
andν,finite theresults
strain C’ andin C planes, and the corresponding
a garnet-bearing micaschist: (a)kinematic
polar
vorticity number,
histogram Wk. A1
used to derive the = flowν,apophysis
angle between the 1; C' = flow
A2and apophysis
C planes, and the n = total number
2; corresponding of data;
kinematic
(b) example
vorticity of the
number, Wk.plotA1
compiled to determine
= flow apophysis the=minimum
1; A2 (Rcmin)
flow apophysis 2; and maximum
n = total numbercritical (Rcmax)
of data; (b)
axial ratio
example andplot
of the the compiled
resulting Wk values; (c)the
to determine example
minimum of a (Rcmin)
Fry diagram for the XZ critical
and maximum and YZ(Rcmax)
sectionsaxial
of the
finiteand
ratio strain
the ellipsoid
resulting(MIC5D sample).
Wk values; N = number
(c) example of centres
of a Fry considered
diagram for the XZin and
the analysis.
YZ sections of the
finite strain ellipsoid (MIC5D sample). N = number of centres considered in the analysis.
5.2. Vorticity and Finite Strain Results and Implications
The full dataset,
Vorticity related to
values obtained thethe
with vorticity
C’ shear calculations
band method and alsobetween
range containing
0.40the
andMulchrone
0.74 (mean tests
value
[72,73]
of 0.58isand
given in Figures
a modal valueS1–S5. To These
of 0.53). check the typeindicate
results of deformation of theofshear
a component pure zone,
shear according
between 73%to
Fossen and Tikoff, (1993) [75] and Fossen et al. (1994) [76], we calculated the θ angle formed
and 48%. The stable porphyroclasts method gives values ranging from 0.27 to 0.74, indicative of pure between
the maximum
shear betweeninstantaneous
82% and 48%, stretching axis (ISAmax)
in good agreement in results
with the the horizontal
obtainedplane andprevious
with the the shear zone
vorticity
boundary. The θ4).
gauge (Figure angle calculation
Comparison was performed
between the flowusing
regime theand
formula [19]:
the structural position of the studied
samples (see Figure 2b for sample location) reveal a variation of the component of simple shear along
the deformation gradient from SW to NE (from = 27% up to 52%; Figure 7a) approaching the high-strain (3)
2
zone. In the Flinn diagram, most of the strain ellipsoids have an oblate shape, except one sample
Finite strain analysis was performed with the centre-to-centre method [77,78] on both the XZ
(MIC5E) falling near the plane-strain conditions (Figure 7b).
and YZ sections of the finite strain ellipsoid. The complete finite strain results are reported in Figure
S6. Selected examples are reported in Figure 6c. To quantify the amount of shortening perpendicular
to the mylonitic zone, finite strain and vorticity data from the same sample were combined [7,66].
Convergence angles were estimated according to Fossen and Tikoff (1998) [79]. The proposed relation
is:value of 0.58 and a modal value of 0.53). These results indicate a component of pure shear between
73% and 48%. The stable porphyroclasts method gives values ranging from 0.27 to 0.74, indicative of
pure shear between 82% and 48%, in good agreement with the results obtained with the previous
vorticity gauge (Figure 4). Comparison between the flow regime and the structural position of the
studied samples (see Figure 2b for sample location) reveal a variation of the component of simple
shear along the deformation gradient from SW to NE (from 27% up to 52%; Figure 7a) approaching
Geosciences 2020, 10,the
288
high-strain zone. In the Flinn diagram, most of the strain ellipsoids have an oblate shape, except 13 of 26
one sample (MIC5E) falling near the plane-strain conditions (Figure 7b).
Figure 7. (a) Percentage of pure shear
Figure 7. (a) Percentage (PS)(PS)
of pure shear and andsimple shear
simple shear (SS) (SS) in relation
in relation to the
to the calculated calculated maximum
maximum
and minimum Wk values; (b) Flinn diagram showing how the analyzed samples (blue dots) fall
and minimum Wk values; (b) Flinn diagram showing how the analyzed samples (blue
mostly in the apparent flattening field; (c) curves representing the shortening perpendicular to flow
dots) fall mostly
in the apparent flattening field; (c) curves representing the shortening perpendicular to flow plane
versus the extension in the transport direction for general flattening with 0–60% stretch along the Y
axis of the finite strain ellipsoid (modified from Law, 2010 [80]); (d) diagram showing the relationship
between the orientation of the maximum instantaneous stretching axis (ISAmax) with respect to the
shear zone boundary (angle θ) related to the kinematic vorticity number Wk (modified after Fossen
and Tifoff, 1993 [75]). Samples mostly fall in the field of pure shear-dominated transpression.
Finite strain data suggest a general flattening, in agreement with pure shear-dominated
transpression [75,76,81]. The scatter in strain geometry indicates that deformation in the shear
zone was slightly heterogeneous. Combining Wk values and finite strain estimates from the same
sample, following Wallis et al. (1993) [66] and Law et al. (2004) [7], we calculated 18–30% shortening,
respectively. Since the studied samples are not deformed in the plane strain conditions, it is necessary
to correct the shortening and stretching values [19,82,83]. Applying the aforementioned correction
(Figure 7c), the stretching parallel to the transport direction is between 21% and 41%. According to the
calculated θ angles, most of the studied samples (Figure 7d) plot in the field of pure shear-dominated
transpression, and only two samples fall in the simple shear-dominated transpression area. Combining
kinematic vorticity and finite strain, as stated before, a convergence angle, ranging between 51◦ and
60◦ , was estimated.
6. U–(Th)–Pb Monazite Geochronology
6.1. Methods and Analytical Techniques
To obtain time constraints on the evolution of the studied sector, monazite geochronology was
performed [84,85]. Grain locations, internal features (inclusions, fractures, etc.) and Backscattered-
Electron (BSE) images were obtained with the aid of a scanning electron microscope (JEOL JSM IT300LV;
JEOL Ltd. Japan Electron Optics Laboratory Co. Ltd, Akishima, Tokyo, Japan) at the University of
Torino (Italy). Mineral chemistry and X-ray compositional maps, to highlight the compositional zoningGeosciences 2020, 10, 288 14 of 26
required for the correct interpretation of monazite grains and ages, were investigated with a JEOL
8200 Super Probe electronic microprobe hosted at the University of Milano (Italy). We followed the
working conditions of Montomoli et al. (2013) [25]. Isotopic dating was performed at the CNR–Istituto
di Geoscienze e Georisorse U.O. Pavia (Italy), using the laser ablation inductively coupled plasma
mass spectrometry (LA-ICP-MS) directly on 30 µm-thick sections. The instrument consists of a Ar–F
193-nm excimer laser (GeolLas 102 from Micro-Las) coupled with a magnetic sector ICP-MS (Element
I from Thermo-Finnigan). The full description of the analytical procedures is reported in [86,87].
Single analyses were performed by a one-minute procurement of the background signal followed by
recording, for at least 30 s, the ablation signal of the masses: 238 U, 232 Th, 206 Pb, 207 Pb, 208 Pb, 202 Hg
and 204 (Hg + Pb). The analysis conditions were a spot size of 10 µm in diameter, an energy density of
8 J cm−2 and with a repetition frequency of 3 Hz. Matrix-matched external monazite standard (Moacir
monazite) [88,89] was used for correcting the laser-induced elemental fractionation and mass bias.
Monazite EMP analysis and isotopic results for standards and unknown are reported in Tables S1–S3.
IsoplotR software [90,91] was used for the data processing and plotting.
6.2. Monazite Mineral Chemistry, Zoning and Isotopic Results
A total of 17 monazites grains, collected in three samples of staurolite- and garnet-bearing
micaschist (ST2A, ST2B and 26-16-15; Figure 8a), were selected for LA-ICP-MS dating. The modal
amount of garnet was 3 vol.% for sample ST2A, 2 vol.% for sample ST2B and 8 vol.% for sample
26-16-15. Examples of the main features of selected monazites are reported in Figure
Geosciences 2020, 10, x FOR PEER REVIEW
8b–e.
16 of 29
Figure 8. (a)
Figure 8. (a) Location ofLocation
the threeof theselected
three selected samples for
samples forgeochronological
geochronological analysis on the geological
analysis on the geological
sketch map displayed in Figure 2b. (b–e) Representative textural position and zoning of monazite
sketch map displayed in Figure 2b. (b–e) Representative textural position and zoning
grains selected for in situ dating. Color bar scale qualitatively points lower (L) to higher (H) Y-Th
of monazite grains
selected for in situ dating. Color
concentration, bar ST2A
for sample scaleandqualitatively
ST2B and Y–Cepoints lower (L)
concentration to higher
for sample (H) U–Pb
26-16-15. Y-Th concentration,
concordant date with 2σ uncertainties has been displayed. (b) Mnz5 in sample ST2A, located along
for sample ST2A and ST2B and Y–Ce concentration for sample 26-16-15. U–Pb concordant date with
the main S2 foliation; (c) Mnz9 in sample ST2A, included in staurolite porphyroclast parallel the S2
2σ uncertaintiesfoliation;
has been displayed.
(d) Mnz11 (b)included
in sample ST2B, Mnz5ininstaurolite
sample ST2A, located
porphyroclast, along
laying along the S1 the main S2 foliation;
foliation;
(e) Mnz21 in sample 26-16-15, located along the main S2 foliation near a garnet porphyroclast.
(c) Mnz9 in sample ST2A, included in staurolite porphyroclast parallel the S2 foliation; (d) Mnz11 in
sample ST2B, included in staurolite
Monazite grains are mostlyporphyroclast, laying
subhedral to anhedral with along the S180100
a size between foliation; (e) Mnz21
µm (ST2A), 70–150 in sample
26-16-15, located along
µm (ST2B), andthe main
40–80 S2 foliation
µm (26-16-15). nearST2A,
In sample a garnet porphyroclast.
five grains (Mnz5, Mnz11, Mnz13, Mnz21 and
Mnz24; Figure 8b) lie along the S2 foliation; one grain (Mnz9; Figure 8c) is included in staurolite and
is oriented parallel the S2 foliation. In sample ST2B, three grains (Mnz2, Mnz10 and Mnz21) are along
the S2 foliation and two grains (Mnz11 and Mnz12; Figure 8d) are included in staurolite with Mnz11
parallel to the S1 internal foliation, and Mnz12 located near the intragranular fractures. In sample 26-
16-15, five grains (Mnz10, Mnz20, Mnz21, Mnz22 and Mnz24; Figure 8e) lie along the S2 foliation or
are included within syn-kinematic biotite and white mica; one grain (Mnz9) is included in staurolite,
but near fractures connecting it with the matrix. Locally, monazite grains from sample ST2A and 26-Geosciences 2020, 10, 288 15 of 26
Monazite grains are mostly subhedral to anhedral with a size between 80100 µm (ST2A), 70–150 µm
(ST2B), and 40–80 µm (26-16-15). In sample ST2A, five grains (Mnz5, Mnz11, Mnz13, Mnz21 and
Mnz24; Figure 8b) lie along the S2 foliation; one grain (Mnz9; Figure 8c) is included in staurolite
and is oriented parallel the S2 foliation. In sample ST2B, three grains (Mnz2, Mnz10 and Mnz21)
are along the S2 foliation and two grains (Mnz11 and Mnz12; Figure 8d) are included in staurolite
with Mnz11 parallel to the S1 internal foliation, and Mnz12 located near the intragranular fractures.
In sample 26-16-15, five grains (Mnz10, Mnz20, Mnz21, Mnz22 and Mnz24; Figure 8e) lie along the S2
foliation or are included within syn-kinematic biotite and white mica; one grain (Mnz9) is included
in staurolite, but near fractures connecting it with the matrix. Locally, monazite grains from sample
ST2A and 26-16-15 show a partial replacement by a fine-grained allanite ± apatite aggregate. Thirteen
elements were analyzed for 17 monazite grains within the three samples (Table S1). In order to get
information about correlation within and among samples we applied a Principal Component Analyses
(PCA) to the multivariate dataset (Figure S7). The two main components PC1 and PC2 account for
63.8% of total data variance. Eigenvectors for Ca, Ce, La and Pr drive PC1 whereas Gd, Sm and U
drive PC2. Combining the information from the two main components, monazite grains within ST2A
are characterized by a higher Ca and Si content and lower P, according to PC1, and higher U and
Pb concentrations, according to PC2, concerning the monazite from other samples. In sample ST2A,
the CaO ranges between 0.6 and 1.4 wt.%, whereas in the other two samples, it is generally lower
than 0.2 wt.% with a few values ranging from 1.0 to 1.4 wt.% (Table S1). Analogously, the UO2 and
PbO concentrations of monazite from ST2A are significantly higher (UO2 > 0.4 wt.%; PbO > 0.06 wt.%)
than those reported for monazite within the other samples (UO2 < 0.1 wt.%; PbO < 0.01 wt.%).
Monazite data from sample 26-16-15 show a major correlation according to PC2, positively correlated
to light-rare-earth elements (i.e., La, Ce, Pr). Grains from the sample ST2B have an average higher Y
absolute content with respect to the other two samples (Table S1). The X-ray maps of Ca, P, Y, Ce, La, Pr,
Th, and U revealed a complex zoning consistent within each sample. We noted that, in both the ST2A
and ST2B samples, monazite is characterized by the apparent zoning of Y and Ca that are generally
inversely correlated to Th. Monazite from 26-16-15 is characterized by the marked zoning of Y, Ca,
Ce, Th and U, where Y and Ca are generally inversely correlated with the other elements. In order
to unravel a possible correlation between monazite and garnet, we focused on Y–Th–Ca zoning and
chemistry. Combining the zoning features with quantitative chemical analyses, we observed that
monazite shows concentric Y–Th–Ca zoning (Mnz5, Mnz9, Mnz21 and Mnz24 in sample ST2A; Mnz2,
Mnz11 and Mnz21 in sample ST2B; Mnz21 and Mnz24 in sample 26-16-25) defining four compositional
domains: (i) low-Y inner cores (between ~0.02 and ~0.08 wt.% of Y2 O3 ) with high- to medium-Th
contents (between ~5.02 and ~6.21 wt.% of ThO2 ) and to low-Ca concentrations (between ~0.04 and
~0.10 wt.% of CaO); (ii) medium- to high-Y and medium- to high-Ca outer cores (between ~1.06 and
~1.3 wt.% of Y2 O3 ; ~0.62 and ~1.15 wt.% of CaO) with medium- to low-Th contents (between ~0.08
and ~2.12 wt.% of ThO2 ); (iii) medium- to high-Y inner rims (between ~0.45 and ~2.13 wt.% of Y2 O3 )
corresponding to low- to very low-Th contents (between ~0.02 and ~0.07 wt.% of ThO2 ) and to high-Ca
concentrations (between ~0.71 and ~1.38 wt.% of CaO); iv) low- to very low-Y, often discontinuous,
outer rims (between ~0.01 and ~0.19 wt.% of Y2 O3 ) characterized by medium- to high-Th values
(between ~3.92 and ~5.63 wt.% of ThO2 ) and to low-Ca contents (between ~0.01 and ~0.10 wt.% of
CaO). Monazites included in staurolite (Mnz11 and Mnz12, sample ST2B; Mnz9, sample 26-16-15)
generally do not show both high-Y and low- to very low-Th inner rims. However, when monazite
is near to the fracture and thus not completely shielded, both the inner- and outer rim domains are
present (e.g., Figure 8b; Mnz9, sample ST2A). Most monazite along the main foliation or included in
syn-kinematic minerals generally present either all the compositional domains described above or a
homogeneous high-Y and high-Ca composition (chemically corresponding to the inner rim domain).
The 206 Pb/238 U and 207 Pb/235 U isotopic ratios resulted as mainly discordant up to 10% (Figure 9a,b),
whereas the discordance between 206 Pb/238 U and 208 Pb/232 Th data was generally better (Geosciences 2020, 10, 288 16 of 26
from 334 ± 6 Ma to 297 ± 5 Ma. These ages were taken from the ST2A and 26-16-15 samples, whereas
the sample ST2B records a smaller age range between 332 ± 5 and 322 ± 5 Ma (206 Pb/238 U ages) and
332 ± 4 to 317 ± 4 Ma (208 Pb/232 Th). Taking into account the microstructural position of the grains and
the chemical composition of the dated domains, we distinguished two main 206 Pb/238 U and 208 Pb/232 Th
data clusters from ~325–315 Ma and at ~330 Ma. The most common age cluster mainly comprises
high-Y rims/domains along the S2 mylonitic foliation and within staurolite rims (syn-S2 ) from ST2A and
26-16-15 samples. The oldest 206 Pb/238 U and 208 Pb/232 Th data cluster is generally defined by monazite
included both in the staurolite crystals (parallel to the S1 ) and within the matrix. The youngest ages
(~310–300 Ma), were mainly found in discontinuous low and very low-Y outer rims, generally observed
in grains where a retrograde allanite ± apatite formation is documented (several grains in the matrix
and fewGeosciences
in staurolite,
2020, 10, xwhere monazites
FOR PEER REVIEW are not completely shielded due to late fractures).18 of 29
(a,b)9. Distribution of the 206 206 238 208 Pb/ 232
Figure 9.
Figure (a,b) Distribution of the Pb/ Pb/238U
U and
and 208Pb/ 232Th Th
agesages
of theof three
the three
analyzedanalyzed
samples. samples.
Different textural
Different position
textural of the
position monazite
of the monazitegrains
grains included within
included within thethe staurolite
staurolite parallel
parallel (//)Sto
(//) to the 1 the S1
and the S are indicated; (c,d) Dispersion diagrams showing the relations between
and the S2 are indicated; (c,d) Dispersion diagrams showing the relations between Y2 O3 –CaO (wt.%)
2 Y 2 O 3 –CaO (wt.%)
with respect to
to the 206the
206Pb/238U–208Pb/232Th ages with the relative error. Symbols and colors indicate
with respect Pb/238 U–208 Pb/232 Th ages with the relative error. Symbols and colors indicate
different samples and textural positions, respectively.
different samples and textural positions, respectively.
7. Discussion
7.1. Geometry and Strain Partitioning of the PASZ
Fieldwork and microstructural analysis allowed us to recognize four deformation phases in the
study area. The only evidence of D1 structures was the S1 relict foliation both in the hinge of F2 folds
or as an internal foliation in the Barrovian index minerals. A progressive increase in metamorphicGeosciences 2020, 10, 288 17 of 26
7. Discussion
7.1. Geometry and Strain Partitioning of the PASZ
Fieldwork and microstructural analysis allowed us to recognize four deformation phases in the
study area. The only evidence of D1 structures was the S1 relict foliation both in the hinge of F2 folds or
as an internal foliation in the Barrovian index minerals. A progressive increase in metamorphic grade,
as suggested by the progressive occurrence of Barrovian metamorphism (Figure 4), can be recognized
from SW to NE in the studied sector, in agreement with Carmignani et al. (1994) [36] and Franceschelli
et al. (1989) [51]. Barrovian index minerals mainly grew between the collisional (D1 ) [17,92,93] and the
transpressional D2 event. However, we recognized that part of the staurolite growth is syn-kinematic
with the D2 shearing (Figure 4). The syn-kinematic mineral assemblage (sillimanite + biotite, biotite +
white mica) parallel to the S2 mylonitic foliation, is indicative of amphibolite-facies. This metamorphic
condition is also in agreement with the occurrence of grain boundary migration as the main dynamic
recrystallization mechanism of quartz, indicative of temperatures ≥500 ◦ C ([61]; Figure 4) and of
feldspars [64]. The syn-kinematic chlorite in the hinges of F3 folds, grown at the expense of biotite,
testifies a decreasing temperature during deformation. Furthermore, local incipient subgrain rotation
recrystallization, overprinting GBM in quartz, has been recognized, supporting a decrease in the
temperature down to the greenschist-facies condition, as also noted by Graziani et al. (2020) [56].
The PASZ developed under conditions of decreasing temperature, starting from the amphibolite-facies
(D2 ) down to greenschist-facies conditions (D3 ).
The principal structures of the study area are controlled by the D2 progressive deformation phase,
linked to the PASZ activity, in which the strain is partitioned into F2 tight and isoclinal folds (low-strain
zone) and shear zone domains (high-strain zone). We highlight the development of shearing domains
that gradually increase in number and dimension moving toward the PASZ. In the same direction,
D2 folds become smaller and less frequent, while the mylonitic foliation becomes gradually more
penetrative and continuous (strain partitioning, [94]; Figure 10).
The presence of a sub-vertical S2 foliation, parallel to the boundaries of the shear zone, and F2 fold
axes, parallel to the sub-horizontal L2 object lineation, led us to assume the simultaneous development
of D2 shear and F2 fold domains. Kinematic indicators, both at the meso and microscale, point to a
top-to-the-NW sense of shear, in agreement with Carosi and Palmeri (2002) [17]. The geometry and
kinematics of the PASZ are compatible with a transpressive regime, as a consequence of dextral shear
deformation with a shortening component perpendicular to the shear zone boundaries [8]. F2 and
F3 fold axes parallelism suggests that the transpressive regime was active until the end of the D3
deformation phase. Subsequent post-collision and post-transpression gravitational instability was
characterized by the development of open folds (F4 ) and low-angle brittle-ductile shear zones.
7.2. Kinematics of the PASZ
The kinematic of the flow allowed us to characterize the deformation, in terms of the percentage
of pure and simple shear components of the D2 phase, linked to the PASZ activity. Two independent
methods were used. The mean kinematic vorticity number ranges from 0.27 to 0.74 (stable porphyroclasts
method) and between 0.40 and 0.74 (C’ shear bands method). Taking into account uncertainties in
the estimates of the vorticity number, the two methods return consistent results (Figure 4). Despite
the analyzed lithotypes along the studied transects being different, i.e., gneiss and micaschist, and
thus have different rheology and possibly strain memory, a progressive northward increase in the
amount of simple shear component (from ~ 27% up to ~ 52%) approaching both the high-strain zone
and the HGMC was observed and highlighted by both the vorticity gauges. Finite strain data suggest
a general flattening, in agreement with pure shear-dominated transpression [75,76,81]. Kinematic
vorticity and finite strain analysis confirm that the deformation along the PASZ occurred under a
general shear condition with a major component of pure shear acting together with simple shear in a
transpressive regime.You can also read