The Effect of Freeze-Drying on the Properties of Polish Vegetable Soups - MDPI
←
→
Page content transcription
If your browser does not render page correctly, please read the page content below
applied
              sciences
Article
The Effect of Freeze-Drying on the Properties of Polish
Vegetable Soups
Ewa Jakubczyk *                and Aleksandra Jaskulska

                                           Department of Food Engineering and Process Management, Institute of Food Sciences, Warsaw University of Life
                                           Sciences (WULS_SGGW), 02-787 Warsaw, Poland; aleksandra.jaskulska@o2.pl
                                           * Correspondence: ewa_jakubczyk@sggw.edu.pl

                                           Abstract: The aim of this study was to investigate selected physical and biochemical properties of four
                                           vegetable freeze-dried soups. The water content, water activity, pH, color parameters, antioxidant
                                           activity (EC50), total polyphenolic content of fresh tomato, pumpkin, beetroot, and cucumber, and
                                           freeze-dried soups were measured. Sensory analysis was applied to compare sensory attributes
                                           of fresh and rehydrated soups. The sorption isotherms of freeze-dried soups were obtained with
                                           the application of the static and dynamic vapor sorption (DVS) method. The application of the
                                           freeze-drying method enabled the obtaining of dry soups with a low water content of 2–3%. The
                                           drying caused a significant change of color of all soups. The redness of soups decreased after drying
                                           for the beetroot soups from +39.64 to +21.91. The lower chroma value of 25.98 and the highest total
                                           color change ∆E*ab = 36.74 were noted for freeze-dried beetroot soup. The antioxidation activity
                                           and total polyphenolic content were reduced after drying, especially for the cucumber and tomato
                                           soups. The Peleg model was selected to describe the sorption isotherms of dried soups. The sorption
                                           isotherm of freeze-dried cucumber and beetroot soups had a sigmoidal shape of type II. The shape of
                                           the moisture sorption isotherm for freeze-dried tomato and pumpkin soups corresponded more with
                                           type III isotherms. The DVS method can be used to characterize the moisture sorption isotherms of
                                           freeze-dried products.

                                    Keywords: lyophilization; soup; sorption isotherms; DVS; water activity; color; antioxidant activity;
Citation: Jakubczyk, E.; Jaskulska, A.     sensory properties
The Effect of Freeze-Drying on the
Properties of Polish Vegetable Soups.
Appl. Sci. 2021, 11, 654. https://
doi.org/10.3390/app11020654                1. Introduction
                                                Soups are made by combining different ingredients such as vegetables, poultry, meat,
Received: 7 December 2020
                                           or seafood. The selected compounds are boiled in water until the flavors are extracted.
Accepted: 8 January 2021
                                           Food manufacturers supply a wide range of these products on the market: smooth and
Published: 11 January 2021
                                           particulate soups, clear soups (broth, bouillons), as well as soups thickened with milk,
                                           cream, and vegetable purees [1].
Publisher’s Note: MDPI stays neu-
                                                The food industry offers soups in the form of powder, liquid, or canned [2]. Powder
tral with regard to jurisdictional clai-
ms in published maps and institutio-
                                           soups can be prepared by mixing different dry powdered ingredients, such as ground
nal affiliations.
                                           dried vegetables, spices, flavors, and yeast extracts with oil and fat powder [3]. Dried
                                           soup powder can be stored for a long time (6–12 months) at room temperature because
                                           enzymatic and oxidative spoilage is restricted [4]. Powder soup also has advantages such
                                           as being available throughout the year and readiness for rehydration [5]. However, this
Copyright: © 2021 by the authors. Li-      technology includes the soaking (e.g., lentil, chickpea), blanching, cooking, and drying of
censee MDPI, Basel, Switzerland.           different vegetables separately. Then dried vegetables are milled, sieved, and blended to
This article is an open access article     formulate dry soup mixtures [5,6]. Drying methods and grinding conditions greatly influ-
distributed under the terms and con-
                                           ence the quality of vegetable ingredients [7]. Dehydration methods of vegetables include
ditions of the Creative Commons At-
                                           convective [8–10], vacuum [11,12], microwave [13,14], desiccant [15,16], ultrasonic [17–19],
tribution (CC BY) license (https://
                                           infrared [20,21], freeze-drying [22,23], as well as osmotic dehydration [24,25] and hybrid
creativecommons.org/licenses/by/
                                           (or combination) [10,26,27] drying. Mondal et al. [28] obtained different instant soups
4.0/).

Appl. Sci. 2021, 11, 654. https://doi.org/10.3390/app11020654                                                 https://www.mdpi.com/journal/applsci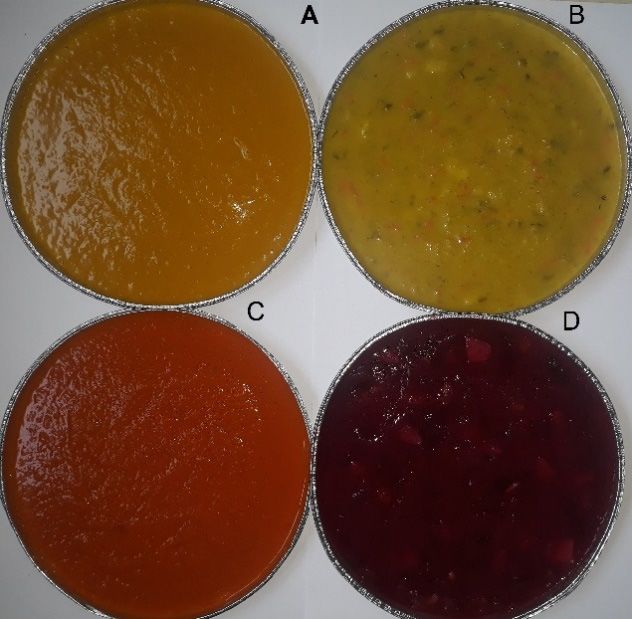
Appl. Sci. 2021, 11, 654                                                                                           2 of 20

                           composed of corn flour, milk powder, and leafy vegetable powders. Three leafy vegetables
                           namely Kolmou, Jatilao, and Pui were dried separately using the air-drying technique at
                           temperature 50–70 ◦ C, and then milled. The same drying method was also used to prepare
                           the soup mixtures, which contained green pea, chickpea, lentil, potatoes, tomatoes, carrot.
                           After drying, all vegetables were milled into powdered form and mixed with seasonings [6].
                           Soy–mushroom–moringa soup powder was prepared by mixing of soy flour mushroom
                           and moringa leaf powder. The mushroom and soybean were dried in a convective-dryer
                           but moringa leaves were dried with the application of a solar-dryer [5]. Spray-drying
                           technique was selected to produce the mushroom (paste)-whey soup powder [29] and
                           powdered product from soup, which consisted of an extract from ham byproducts [30]. The
                           mixtures of instant soup powders were also prepared by mixing the grounded ingredients
                           (particles of chickpea, mushroom, parsley, dill, celery freeze-dried individually) with olive
                           oil and corn starch [22].
                                 The dried soups with the pieces of vegetable can be obtained by preparation of a soup
                           with the vegetable ingredients and drying of the product. Recent studies show that these
                           kinds of soups have been dried by freeze-drying or with application of hybrid drying
                           methods [31–34]. Wang et al. [31,35] applied the microwave-freeze-dried technology to
                           obtain the instant vegetable soups. The vegetable soup mix contained cabbage, tomato,
                           carrot, spinach and mushroom, water, salt, sugar, and sodium glutamate, and was cooked,
                           cooled, and frozen. The soups were freeze-dried (at a pressure of 100 Pa) with the mi-
                           crowave heating system at frequency 2450 MHz. Liu et al. [34] explored the hybrid strategy
                           for preparation of dried soups. The frozen soups with pieces of mushroom and bacon
                           were dehydrated by freeze-drying (at a shelf temperature of 30, 50 and 70 ◦ C) and using
                           microwave drying. The freeze-drying method was applied to obtain different instant
                           vegetable and meat soups [32,33]. Freeze-dried soups with chopped vegetables exhibited
                           significantly higher rehydration ratios than products with pieces of vegetables, meat, or
                           fish [32].
                                 Presently, consumers expect high-quality meals, which can be prepared in a short
                           time. Instant soup obtained with the application of the freeze-drying process can be a
                           product that meets these requirements [31]. Freeze-drying is a gentle dehydration method,
                           which consists of major steps, such as freezing of the material, sublimation of frozen water
                           during primary drying under vacuum, and desorption of remaining water at secondary
                           drying [36,37]. The freeze-drying of vegetables is a technique providing products with a
                           quality greater than offered by any other drying method [7]. This drying method enables
                           maintenance of the color, flavor, and nutrients (antioxidants, vitamins) of freshly prepared
                           soup [31]. Freeze-dried products are characterized by high porosity and low density, while
                           shrinkage and structure collapse are negligible [37]. However, freeze-drying of vegetables
                           with β-carotene, lycopene, vitamin E, unsaturated oils may lead to the deterioration of the
                           quality of these biocompounds due to the acceleration of oxidative reactions at a low water
                           activity of freeze-dried material. The main disadvantage of freeze-drying is the high cost of
                           equipment and maintenance. Freeze-drying also known as lyophilization is an expensive
                           preservation method due to high energy consumption at vacuum conditions and the long
                           drying time. However, this drying method enables the obtaining of products with a low
                           water content and the best protection of nutritional value [36]. Additionally, the freeze-
                           dried product can be more competently reconstituted to the original state by the addition of
                           water in comparison to samples dried by other methods [7]. The porous structure of freeze-
                           dried material is a main factor that influence the reconstitution properties. Ratti [38] noted
                           a rehydration ratio up to 4–6 higher for freeze-dried than air-dried materials. Moreover,
                           the minimal color deterioration and the highest lightness were observed for freeze-dried
                           vegetables [10,39]. Freeze-drying technique by low operating temperature is the best choice
                           to dehydrate vegetables to retain the biocompounds content in the products [36]. Freeze-
                           drying is a suitable method for dehydration of liquid or semi-liquid products with pieces of
                           biological materials. Even though the production of freeze-dried soups may come at a high
                           cost, these products have great potential as outdoor food for consumers practicing sailing,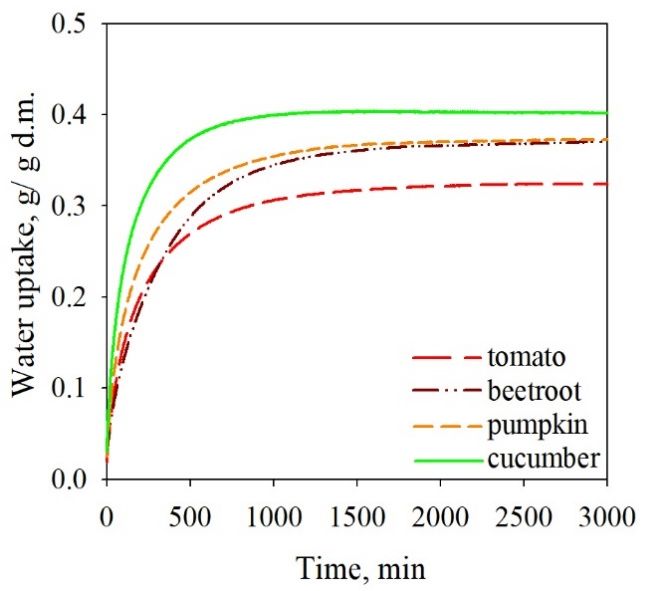
Appl. Sci. 2021, 11, 654                                                                                                                  3 of 20

                                    camping, trekking, backpacking. Due to the specificity of outdoor food, freeze-dried soups
                                    can be situated in places at different humidity conditions, which may affect the products’
                                    properties and their stability.
                                          The moisture sorption isotherms describe the sorption behavior of material stored
                                    in an environment of varying humidity. The moisture isotherms represent the relation
                                    between the equilibrium water content and the water activity of the product. The different
                                    mathematical models are applied to describe the moisture sorption isotherms; these in-
                                    clude kinetics models based on monolayer sorption (Brunauer–Emmett–Teller-BET model),
                                    models referring to multilayer sorption, and condensed film (Guggenheim–Anderson–de
                                    Boer-GAB model, Lewicki model), semi-empirical (Peleg model, Hasley model), and empir-
                                    ical models (Oswin model) [40]. The methods that describe the moisture sorption isotherms
                                    can be divided into static and dynamic techniques. The static gravimetric method uses the
                                    desiccators for setting the relative humidities. The dynamic vapor sorption system (DVS)
                                    automatically generates the different humidity levels for measuring the sorption isotherms.
                                    The DVS devise records the change of mass over time (dm/dt) and when dm/dt is close
                                    to 0 the next humidity level is automatically selected [41]. The determination of moisture
                                    sorption isotherms is crucial for designing and optimizing the drying process and selecting
                                    appropriate packaging materials, especially for foods with low moisture content [42–44].
                                          Numerous studies on the moisture sorption behavior of different freeze-dried foods
                                    described by many mathematical models can be found in the literature [40,45–49]. However,
                                    studies on the moisture sorption properties of freeze-dried soups are very limited. In
                                    addition, there is little experimental data on the influence of the type of soup on their
                                    properties.
                                          The research aimed to study the moisture sorption properties and some selected
                                    physical and biochemical as well as sensory features of freeze-dried soups.

                                    2. Materials and Methods
                                    2.1. Materials and Technological Methods
                                    2.1.1. Materials
                                         The thermally preserved soups were provided by a local manufacturer (Firma Bracia
                                    Urbanek, Łowicz, Poland). The main composition of four vegetable (cucumber, pumpkin,
                                    tomato, red beetroot) soups declared by the manufacturer was presented in Table 1. The
                                    blended tomato and pumpkin soups had a creamy texture, whereas the beetroot and
                                    cucumber soups contained small pieces of vegetables (including carrots, chickpeas, onions,
                                    parsley, leek, celery roots, potatoes). Seasonings such pepper, sugar, garlic, bay leaf, basil
                                    (tomato soup) and ginger (pumpkin soup) were also added to soups.

                           Table 1. Main ingredients and composition of selected commercial vegetable soups.

             -              Tomato Soup (Cream)                Beetroot Soup              Pumpkin Soup (Cream)            Cucumber Soup
    Main ingredients:                  -                              -                               -                           -
                           Tomato pulp, tomato paste               Water,
                                                                                                   Water,                       Water,
                            and diced tomato (64%)          red beetroot (31%),
                                                                                               pumpkin (35%),         pickled cucumbers (21%),
             -                water, a mixture of          string and red beans,
                                                                                            a mixture of chopped        a mixture of chopped
                             chopped vegetables,           a mixture of chopped
                                                                                           vegetables, rapeseed oil    vegetables, rapeseed oil
                                 rapeseed oil             vegetables, rapeseed oil
                                                  Concentration of solid constituents (g/100 g):
      Carbohydrates                   3.7                            7.8                             3.7                        2.3
    -including sugars                 3.6                            4.3                             3.1                         0.9
           Fiber                      1.6                            1.2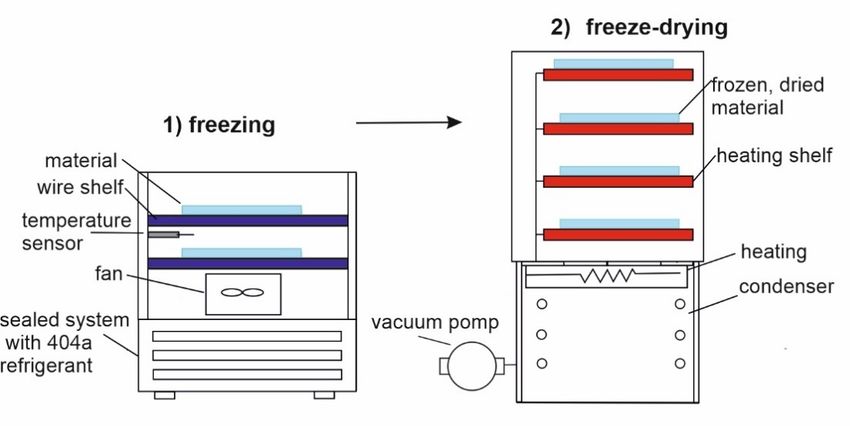
Carbohydrates                       3.7                       7.8                       3.7                      2.3
-including sugars                     3.6                       4.3                       3.1                      0.9
       Fiber                          1.6                       1.2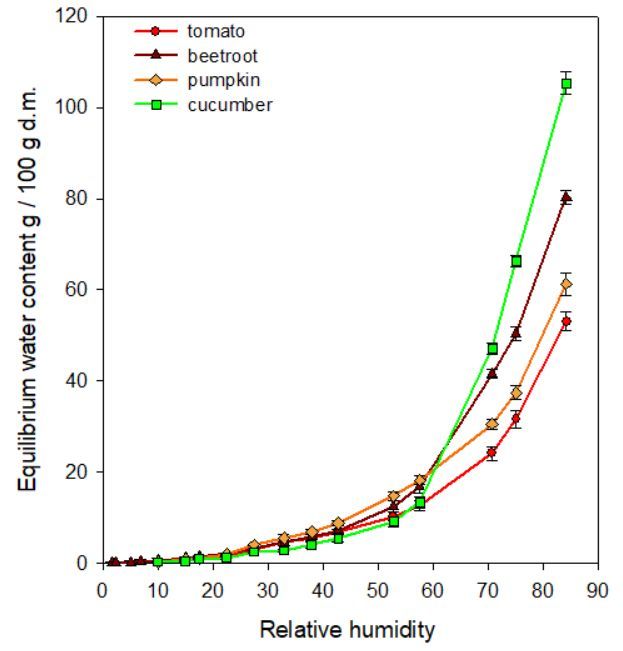
Appl. Sci. 2021, 11, 654                                                                                                 5 of 20

                           The ∆E*ab values were also calculated for fresh soups and freeze-dried samples stored for
                           3 months.                              q
                                                                C∗ =       (a∗ ) 2 + (b∗ ) 2                                (1)
                                                                                     b∗
                                                                     ho = arctan                                            (2)
                                                                                     a∗
                                                           q
                                                  ∗
                                                ∆Eab =         (L∗ − L0∗ ) 2 + (a∗ − a0∗ ) 2 + (b∗ − b0∗ ) 2                (3)
                           where: L0∗ , a0∗ , b0∗ —color attributes of fresh soups; L*, a*, b*—color attributes of freeze-dried
                           soups.

                           2.2.3. pH
                                The pH (fresh, dried and stored soups) was determined using a digital pH meter
                           (SevenCompact S210, Mettler-Toledo GmbH, Greifensee, Switzerland) at room temperature.

                           2.2.4. Antioxidant Capacity and the Content of Polyphenolic Compounds
                                The content of polyphenols and antioxidant capacity were analyzed in extract pro-
                           duced from the soups. The sample of the material was homogenized with an aqueous
                           solution of ethanol (80%) and boiled for 3 min. Afterwards, the extract was filtered [54].
                           Three extraction experiments were carried out and the mean value was taken for the data
                           analysis. The antioxidant capacity was measured spectrophotometrically based on the
                           degree of scavenging of 2,2-diphenyl-1-picrylhydrazyl (DPPH•; Sigma Aldrich, St. Louis,
                           MI, USA) radical by antioxidants present in fresh and dried soups extracts within the
                           30-min time period. The method was described by Brand-Williams et al. [55] and modified
                           by Nowacka et al. [54]. The base solution of DPPH was prepared by solute of DDPH in a
                           99% solution of methanol. The DPPH solution was diluted with an 80% aqueous solution
                           of ethanol. The antioxidant capacity was determined by mixing the extract with the 80%
                           solution of ethanol and the DPPH solution. The tubes with the solutions were mixed and
                           stored in darkness for 30 min. The changes of DPPH radicals’ concertation were assayed
                           based on the absorbance measurement at 515 nm against the sample black (80% aqueous
                           ethanol solutions) (Heλios Gamma spectrophotometer; Thermo Spectronic, Cambridge,
                           UK). The EC50 coefficient was used to characterize the extract concertation required for a
                           50% reduction of DPPH radicals. It was expressed as mg of dry matter per 100 mL of the
                           extract [56].
                                The content of polyphenolic compounds in fresh, dried, and stored soups was deter-
                           mined by the Folin–Ciocalteu method, using gallic acid as reference. The distilled water,
                           extract, and Folin reagent were transferred to flasks, mixed, and after 3 min the sodium
                           carbonate solution was added. After mixing, the solution was left in the dark for 1 h. The
                           absorbance was measured in a Heλios Gamma spectrophotometer (Thermo Spectronic,
                           Cambridge, UK) at a wavelength of 750 nm. The reverence sample without the extract
                           was applied as a control. The polyphenol content was determined based on the calibration
                           curve, which shows the relation between the absorbance and the concentration of gallic
                           acid. The total phenolic content (TPC) was expressed in mg of gallic acid equivalents (GAE)
                           per 100 g of dry matter.

                           2.2.5. Sensory Analysis
                                 Sensory analysis was carried out by a trained panel of 10 Polish panelists. The sensory
                           quality of soups was determined with the quantitative descriptive analysis [57]. Prior to
                           testing, three training sessions were held to familiarize the panelists with the product and
                           with the selected attributes. A 10-point category scale was used to measure the intensity
                           of each sensory attribute (color, consistency, aroma, taste, overall quality) for the different
                           soups. Table 2 presents a list of sensory attributes and their definitions.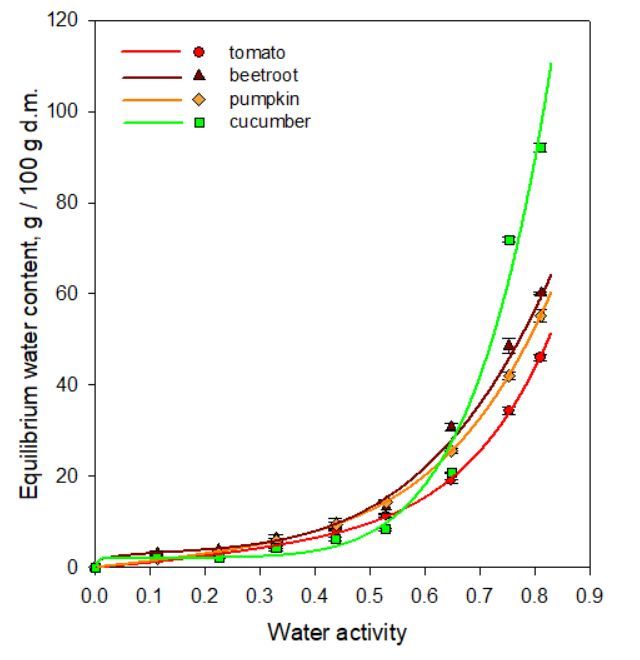
Appl. Sci. 2021, 11, 654                                                                                                 6 of 20

                           Table 2. Sensory attributes and their definitions.

                                 Attributes                       Definition                   Scale-Boundary Conditions
                                                      Color typical for the main vegetable
                                                     ingredient of a selected soup: tomato         1-very bright color
                                   Color
                                                       (red), pumpkin (yellow), beetroot           10-dark, deep color
                                                    (red-violet), pickled cucumber (green)
                                                                                                          1-thin
                                Consistency        Consistency from thin, watery, to thick
                                                                                                         10-thick
                                                   Taste typical for the main ingredient of       1-no perceptible flavor
                                   Taste
                                                                   the soup                   10-intensive perceptible flavor
                                                    Aroma typical of the main vegetable           1-no perceptible aroma
                                  Aroma
                                                         ingredient of the soup               10-Intensive perceptible aroma
                                                                                                          1-low
                              Overall quality                 Overall evaluation
                                                                                                         10-high

                                The panelists tested the fresh and freeze-dried soups after rehydration. The rehy-
                           dration was performed using hot water (the amount of water added to dried soups was
                           calculated based on the determination of the water content in fresh and dried soups). The
                           samples of soups (fresh and rehydrated) were heated up to 60 ◦ C and monadically served
                           to experts in plastic containers with a lid which contained 50 g of soup. The containers
                           with soups were coded and presented in random order to each panelist.
                                The change of the values of sensory attributes after rehydration of samples in compar-
                           ison to fresh soups was calculated as (4):

                                                                           Af − Ar
                                                                  ∆A =             100%                                     (4)
                                                                              Af

                           where: ∆A—the change of the value of sensory attribute after rehydration of dried soup in
                           comparison to fresh soup, Af —value of the sensory attribute for fresh soup, Ar —value of
                           the sensory attribute after rehydration of dried material.

                           2.2.6. Sorption Isotherms—Static Method
                           Experimental Determination of Moisture Sorption Isotherms
                                The freeze-dried soup samples were brought in equilibrium after storage in a desicca-
                           tor with anhydrous calcium chloride. Then, the selected salts were mixed with distilled
                           water until a solution with excess crystals was formed. The salt solutions were poured
                           in the glass desiccator to a depth of 3 cm. Afterward, dry samples (1.5 g) in aluminum
                           weighing boats were placed in 9 desiccators containing anhydrous CaCl2 , and saturated
                           solutions of selected salts: LiCl, CH3 COOK, MgCl2 , K2 CO3 , Mg(NO3 )2 , NaNO2 , NaCl,
                           (NH4 )2 SO4 ), which generated an environment with different water activity of 0, 0.113,
                           0.225, 0.329, 0.438, 0.529, 0.648, 0.753, 0.810 (Figure 2). The desiccators with water activity
                           higher than 0.529 contained a dish with thymol to prevent mold growth. The experiment
                           was terminated when the mass of samples did not differ in three sequential measurements.
                           The mass of samples was controlled every month. The triplicate samples of the same type
                           of dried soup were stored for 3 months at a constant temperature of 25 ◦ C. The moisture
                           content of samples after storage was determined using the vacuum drying method in
                           selected conditions (temperature of 70 ◦ C, a pressure of 1 kPa for 24 h). The equilibrium
                           water content was calculated from dry matter of samples.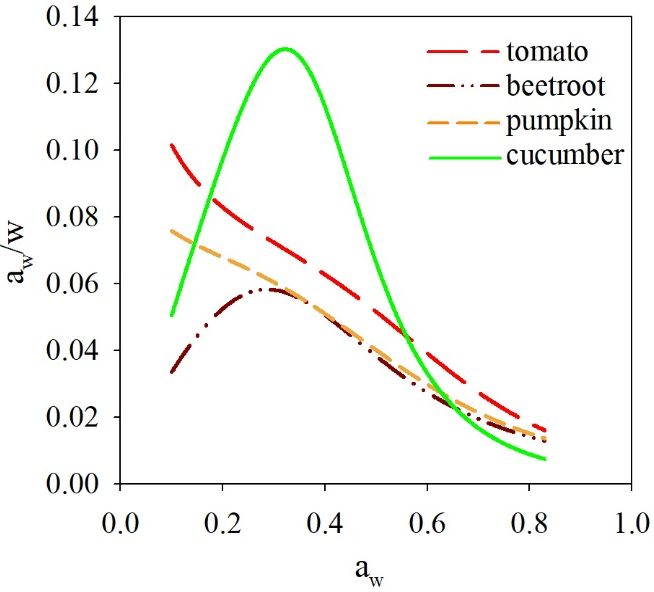
higher than 0.529 contained a dish with thymol to prevent mold growth. The experiment
was terminated when the mass of samples did not differ in three sequential measure-
ments. The mass of samples was controlled every month. The triplicate samples of the
same type of dried soup were stored for 3 months at a constant temperature of 25 °C. The
Appl. Sci. 2021, 11, 654 moisture content of samples after storage was determined using the vacuum drying 7 of 20
method in selected conditions (temperature of 70 °C, a pressure of 1 kPa for 24 h). The
equilibrium water content was calculated from dry matter of samples.
Figure
Figure 2. Sorption
2. Sorption isotherms—the
isotherms—the experimental
experimental setofup
set up of static
static method.
method.
Modelling
Modelling of Moisture
of Moisture Sorption
Sorption Isotherms
Isotherms
The The non-linear
non-linear regression
regression analysis
analysis withwith the application
the application of Table
of Table Curve
Curve 2D program
2D program
(Systat Software Inc., San Jose, CA, USA) was performed to select the best equation for for
(Systat Software Inc., San Jose, CA, USA) was performed to select the best equation
modelling the sorption isotherms. The following Equations (5)–(9) were used to describe
modelling the sorption isotherms. The following Equations (5)–(9) were used to describe
the moisture sorption isotherms:
the moisture sorption isotherms:
GAB model [58]:
GAB model [58]: um Ckaw
u = (5)
u(1 Cka
− kaw )[1 + (C − 1)kaw ]
u= (5)
BET model [58]: (1 − ka )[1 + (C − 1)ka ]
um caw
BET model [58]: u = (6)
(1 − aw )[1 + (c − 1)aw ]
u ca
Lewicki modelu[59]:
= (6)
(1 − a )[1 + (c −F 1)a ] F
u = − (7)
Lewicki model [59]: ( 1 − aw ) G 1 + aw H
Peleg model [60]: F F
u= − (7)
(1 − a ) u =1 +Aaaw D + Baw E (8)
Peleg modelmodel
Halsey [60]: [28]:
−g
u = Aa +awBa= exp (8) (9)
un
Halsey umodel
where: [28]:
m —monolayer moisture content (g water/100 g d.m.); aw —water activity; C,
k—constants of GAB model; c—constant −g of BET model; A, B, D, E—constants of Peleg
a = exp (9)
model; F, G, H—constants of Lewickiumodel; g, n—constants of Halsey model.
The goodness of fit for each model to experimental data was judged by the determi-
nation coefficient (R2 ), the root mean square (RMS) (10) and the mean relative percentage
deviation modulus P (11).
v
ue − up 2
u
u N
t ∑i = 1 ue
RMS = 100% (10)
N
ue − up
∑N
i=1 ue
P = 100% (11)
N
where: ue —experimental water content, up —predicted water content, N—number of
experimental data.
The procedure proposed by Blahovec and Yanniotis [61] was applied to check the
type of sorption isotherms. The aw /w against aw plot was obtained, and the following
formula (12) was applied to describe this relation:
aw aw
= X1 + (X2 − X2 X4 )aw − X3 + X2 X4 − X2 X24 (12)
w 1 + X4 aw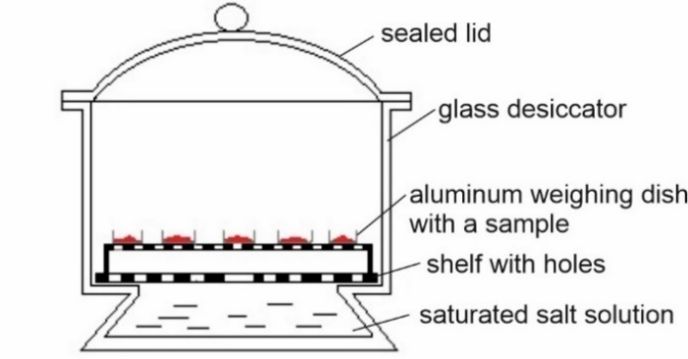
Appl. Sci. 2021, 11, 654 8 of 20
where: X1 , X2 , X3 , X4 are the constants of equations, aw —water activity, w—equilibrium
water content.
The first derivative of this function at water activity aw = 0 is given as D10 . The ratio
of the first derivate of the aw /w−aw plot at the final value to the first derivative at the
initial value (aw = 0) is denoted as Rfi . The extremum of function was noted as awm . The
derivatives and extremum of the function (Equation (12)) were obtained using Table Curve
2D program (Systat Software Inc., San Jose, CA, USA).
2.2.7. Sorption Isotherms—Dynamic Vapor Sorption-Method (DVS)
The sorption isotherms were also obtained using Aquadyne DVS analyzer (Quan-
tachrome, Boynton Beach, FL, USA), which automatically generates the relative humidity
and records the change of mass over time [41]. The samples of freeze-dried soups (about
20 mg) were analyzed at a temperature of 25 ◦ C measuring the moisture sorption in the
range of relative humidity (RH) from 1.5 to 85% with a different RH step size. The measure-
ment was preceded by the purging step at a temperature of 40 ◦ C at 0% RH for 600 min.
The relative humidity changed from one level to next when the change of sample mass was
smaller than 0.001%/min but no earlier than 180 min from the beginning of the step.
2.2.8. Water Sorption Kinetics
The water sorption kinetics was measured according to the protocol applied for freeze-
dried fruit pulps [45]. The freeze-dried soups were stored in a glass jar, which contained
the NaCl solution (aw = 0.753). The samples were automatically weighed every minute for
50 h and the water uptake during storage was expressed as g of adsorbed water per g of
dry matter of the sample.
2.3. Statistical Analysis
All experiments described in Section 2.2. were repeated three times to verify the
obtained results. The one-way analysis of variance (ANOVA) test was used to analyze
the significance of differences among the investigated samples (before and after drying)
at the 95% significance level. All the data followed a Gaussian distribution. Significant
pairwise differences were further tested using paired Tukey’s honest significant difference
method. The data were presented as the mean value ± standard deviation. The non-linear
regression was applied to calculate the obtained parameters of Equation (11). The analyses
were performed using STATISTICA software v. 12.5 (StatSoft Inc., Tulsa, OK, USA) and
Table Curve 2D program (Systat Software Inc., San Jose, CA, USA).
3. Results and Discussion
3.1. Characteristic of Physical, Biochemical, and Sensory Properties of Soups before and after
Freeze-Drying
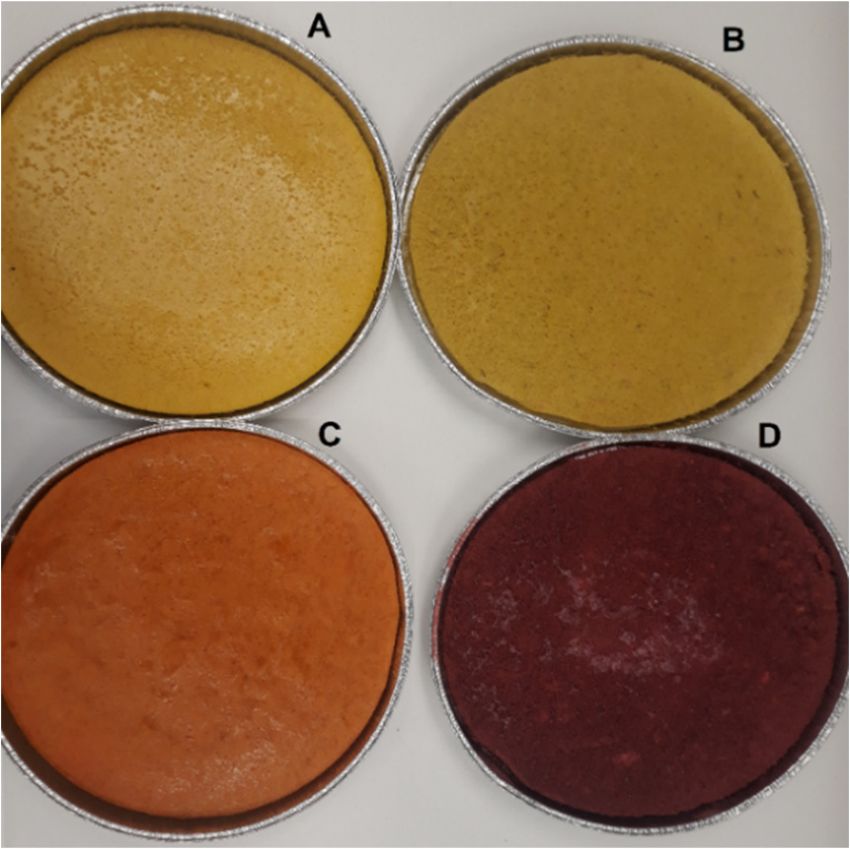
The application of the freeze-drying method for selected vegetable soups enabled the
obtaining of a product with an attractive appearance (Figure 3). Also, the shrinkage of the
dried soups layer was slightly noticeable.
The concentration of the main compounds of soups was also changed. Based on
the initial composition of soups and the measured water content in fresh soups and after
drying, the concentration of sugars, fiber, and salt was calculated. The dried soup contained
sugars form 13.9 (cucumber) to 44.6 (pumpkin) g/100 g (Table 3). The concentration of salt
in dried cucumber soup increased to 15.41 g/100 g. According to the Polish Standard [62],
the concentration of salts in fresh soup should be lower than 1.8%. The fresh soups did
not exceed this limit and the concentration was lower than 1% of salts. The salt and
sugar content in dried soups was very high but the final product should be served after
rehydration.drying, the concentration of sugars, fiber, and salt was calculated. The dried soup
contained sugars form 13.9 (cucumber) to 44.6 (pumpkin) g/100 g (Table 3). The
concentration of salt in dried cucumber soup increased to 15.41 g/ 100 g. According to the
Polish Standard [62], the concentration of salts in fresh soup should be lower than 1.8%.
Appl. Sci. 2021, 11, 654 The fresh soups did not exceed this limit and the concentration was lower than 1% of 9salts.
of 20
The salt and sugar content in dried soups was very high but the final product should be
served after rehydration.
(a) (b)
Figure
Figure 3. The
The pumpkin
pumpkin (A),
(A), cucumber
cucumber (B),
(B), tomato
tomato (C), and beetroot (D) of fresh (a) and freeze-dried (b) soups.
Table 3. Concentration of the main
Table 3. Concentration solid
of the compounds
main of different
solid compounds freeze-dried
of different soups. soups.
freeze-dried
Concentration of Main Concentration of Main
Solid Compounds g Tomato Soup PumpkinCucumber
Cucumber
Solid Compounds Beetroot
TomatoSoup
Soup Pumpkin
Beetroot Soup Soup Soup
Soup Soup
/100 g g/100 g
Sugars 33.6 ± 3.3
Sugars 40.633.6
± 1.5
± 3.3 44.5
40.6 ± 1.5 ± 1.9 44.5 ± 1.9 13.913.9
± 0.5± 0.5
Salt 5.7 ± 0.6 Salt 5.7
8.4 ± 0.3± 0.6 8.4 ±8.8
0.3 ± 0.4 8.8 ± 0.4 15.4 ± 0.6± 0.6
15.4
Fiber 8.4 ± 0.8 Fiber 8.5 8.4 ± 0.8
± 0.3 8.5 ± 0.3 - - ± 0.5± 0.5
13.913.9
The
The fresh
fresh soups were characterized by water content in the range from 89.5 (tomato
soup)
soup) to
to 93.7%
93.7% (cucumber
(cucumber soup)
soup) and
and water
water activity
activity ranged
ranged from
from 0.973
0.973 to
to 0.980
0.980(Table
(Table 4).
4).
A similar
similarlevel
levelofof moisture
moisture content
content (90%)
(90%) was noted
was noted formushroom
for fresh fresh mushroom
cream soup cream soup
prepared
with starch,
prepared withbutter, cream,
starch, button
butter, cream,mushroom and bacon
button mushroom and[34].
baconWater
[34].content after freeze-
Water content after
drying of the investigated soups was reduced to a level of 2–3%. A broader range of moisture
content from 2.83 to 5.46% was observed by Farzana et al. [5] for dried-powdered vegetable
soups. The difference in water content was caused by the addition of different ingredients.
Also, the method of production of instant soup was different because the ingredients were
dried, ground into powder, and mixed with other components [5].
The reduced water content and water activity promote the maintenance of the physical
and chemical properties of dried products during storage [63]. The freeze-dried soups
were stored in room conditions, and after 3 months, the freeze-dried soups’ water content
increased to around 4% and the water activity increased from 0.197–0.221 to 0.268–0.286
(Table 4). The highest increase of water content after storage of dried samples was observed
for pumpkin and tomato soup (about 70–80%). However, the results showed that storage
of dried cucumber soups led to an increase in the water content by 28%. Dried cucumber
soup contained a significantly lower amount of carbohydrates than other soups (Table 3).
The presence of low molecular weight sugars in dried materials may affect their physical
properties such as solubility, viscosity, and hygroscopicity. Fructose is very hygroscopic
whereas other sugars such as sucrose and xylitol absorb water only at the higher water
activity [64]. The dried samples with a higher sugar content are more susceptible to the
moisture uptake during the storage. However, the water activity and water content of
stored dried soups remained at a level which ensures the microbiological stability of dried
products.Appl. Sci. 2021, 11, 654 10 of 20
Table 4. Water content and water activity of different fresh freeze-dried and stored soups.
Kind of Soup Product Water Content (%) Water Activity
fresh 89.5 ± 0.4 a* 0.976 ± 0.001 a
Tomato soup dried 2.0 ± 0.2 c 0.206 ± 0.006 c
stored 3.6 ± 0.2 b 0.268 ± 0.051 b
fresh 89.7 ± 0.2 a 0.980 ± 0.002 a
Beetroot soup dried 2.6± 0.1 c 0.221 ± 0.002 c
stored 4.1± 0.4 b 0.286 ± 0.011 b
fresh 93.2 ± 0.1 a 0.980 ± 0.001 a
Pumpkin soup dried 2.3± 0.1 c 0.197 ± 0.001 c
stored 3.9 ± 0.3 b 0.279 ± 0.009 b
fresh 93.7 ± 0.1 a 0.973 ± 0.004 a
Cucumber soup dried 2.9 ± 0.1 c 0.199 ± 0.011 c
stored 3.7 ± 0.3 b 0.271 ± 0.021 b
* the different letter in the columns (for the same kind of soup) indicates the significant difference between the
obtained values for fresh, dried and stored samples p ≤ 0.05.
The color of the product after drying can be an important indicator of its quality. Un-
desired changes or loss of color may negatively affect the evaluation of the final product by
the consumer [65]. The lightness L* for all investigated soups increased after drying, which
can be related to the degradation of pigments in vegetables used to prepare the soups. The
highest difference of lightness between fresh and dried samples was observed for beetroot
soup; the L* increased from 23.05 to 55.07. The dried samples became slightly brighter
after storage except for beetroot soup, of which L* value did not change significantly in
comparison to the dried sample (Table 5).
Table 5. Color of different fresh, freeze-dried, and stored soups.
Total
Chroma Hue
Product L* +a* +b* Color Change
C* h◦
∆E*ab
Tomato soup
fresh 44.67 ± 0.08 c* 33.98 ± 0.40 a 59.84 ± 0.24 a 68.81 ± 0.40 a 60.41 ± 0.20 a -
dried 52.09 ± 0.05 b 32.46 ± 0.20 b 54.40 ± 0.12 b 63.35 ± 0.20 b 59.17 ± 0.10 b 9.32 ± 0.08 b
stored 60.05 ± 0.95 a 28.74 ± 0.91 c 45.64 ± 0.93 c 53.93 ± 1.27 c 57.90 ± 0.32 c 21.64 ± 0.35 a
Beetroot soup
fresh 23.05 ± 0.04 b 39.64 ± 0.60 a 10.72 ± 0.40 b 41.06 ± 0.63 a 15.25 ± 0.35 c -
dried 55.07 ± 0.02 a 21.91 ± 0.30 b 13.97 ± 0.30 a 25.98 ± 0.41 b 32.65 ± 0.30 a 36.74 ± 0.11 a
stored 54.79 ± 0.75 a 21.05 ± 0.82 b 10.05 ± 2.83 b 22.42 ± 2.11 b 25.55 ± 5.45 b 33.34 ± 1.40 a
Pumpkin soup
fresh 56.13 ± 0.03 c 11.13 ± 0.20 a 64.66 ± 0.11 a 65.61 ± 0.16 a 80.29 ± 0.20 c -
dried 62.53 ± 0.03 b 6.92 ± 0.05 b 60.05 ± 0.70 b 60.45 ± 0.70 b 83.50 ± 0.09 b 8.94 ± 0.23 b
stored 68.04 ± 0.61 a 4.04 ± 0.08 c 45.21 ± 0.25 c 45.39 ± 0.25 c 84.92 ± 0.10 a 23.88 ± 0.10 a
Cucumber soup
c a 82.50 ± 0.10 c
fresh 56.38 ± 0.07 6.01 ± 0.02 44.53 ± 0.70 b 44.94 ± 0.63 b -
dried 66.03 ± 0.03 b 2.66 ± 0.04 b 49.05 ± 0.12 a 49.12 ± 0.12 a 86.90 ± 0.07 b 11.18 ± 0.39 b
stored 72.08 ± 0.82 a 1.01 ± 0.11c 35.04 ± 0.81 c 35.05 ± 0.81 c 88.45± 0.20 a 19.01 ± 0.54 a
* the different letter in the columns (for the same kind of soup) indicates the significant difference between the obtained values for fresh,
dried and stored samples p ≤ 0.05.
The intensity of color depends on the values of a* and b*. The a* value (redness)
decreased from +39.64 to +21.91 after drying of the beetroot soup. The decrease of redness
of the soup can be linked with the degradation of betalains pigments. Antigo et al. [66]Appl. Sci. 2021, 11, 654 11 of 20
noted a positive and strong correlation between the betanins content (the betacyanins
mainly present in beetroot) and the color parameter a* of freeze-dried red beet extract. The
degradation of betanins led to the discoloration of the product and reduction of the a*
parameter. The storage did not affect the a* of beetroot soup, but for pumpkin and tomato
soups, the redness decreased. The yellowness b* decreased after drying and storage of
tomato, pumpkin, and cucumber soup. The increase of water content in dried samples after
storage may affect the changes of color attributes. It can be assumed that the shrinkage
and porosity of samples were changed due to the increase of water content after storage of
products. Structure and opacity of fresh, dried, and stored material may significantly affect
the optical refection capacity.
Table 5 shows that chroma values decreased after freeze-drying of tomato, beetroot,
and pumpkin soups. A significant difference between the chroma values was obtained for
fresh (41.06) and dried (25.98) beetroot soup. Kerr and Varner [67] noted for the freeze-dried
beetroot puree the high chroma value (33.39–35.97), indicating the most saturated color.
The hue angle describes the relative amount of redness (h◦ = 0◦ ) and yellowness
(h = 90◦ ). The lowest value of hue h◦ was observed for the fresh beetroot soup, which
◦
indicated a redder product. The beetroot contains the natural red-violet food colorant
(betanin) with biological activity [68]. Betanins are unstable in the presentence of light
and oxygen and can be degraded when subjected to heating [66]. The drying process
resulted in the increase of hue value of beetroot soup. Antigo et al. [66] observed that
the betanin content in the microcapsules with red beet extracts obtained by freeze-drying
were negatively correlated with the hue angle. Also, degradation the color of samples
occurred from opaque red to clearer yellow after freeze-drying and spray-drying. Samples
of dried beetroot soup after storage showed the lower values of hue h◦ than dried product.
The L*, a*, C* vales of dried beetroot soup remained constant after storage but the b*
parameter as well as hue h◦ decreased that may be attributed to browning reactions such
as non-enzymatic browning. It may also lead to a reinforcement of the sample color [69].
Tomato soups dried and stored also showed the reduction of the hue angle values which
can be also related to browning processes. The pumpkin soups showed after drying and
storage an increase of hue and a slight decrease of chroma value. The drying process
resulted in the brighter sample with lower color saturation which can linked with lycopene
and β-carotene degradation. Also, Guiné and Barroca [70] observed that the freeze-during
process made the samples more dully than fresh pumpkin. However, the storage of dried
pumpkin soups caused a further decrease of color saturation (degradation of pigments).
The similar trend was observed for cucumber soup after drying and storage.
The total color difference between fresh and dried beetroot soups was several-fold
higher than that observed for other soups (Table 5). However, the ∆E*ab obtained for
other soups also showed high values. The total color change was also compared between
fresh soup and dried samples after storage. The highest total color change after storage
of samples were obtained for the beetroot soup. The results of ∆E*ab showed that freeze-
drying of beetroot soup caused the significant changes of color but the storage of the dried
sample did not affect this parameter. The total changes of color due to drying process
of other soups were smaller. The value of ∆E*ab considerably increased for tomato and
pumpkin dried soup after storage. During storage, the degradation of pigments and
bioactive compound probably occurred.
The pH of fresh soups ranged from 3.89 to 5.59 for cucumber and pumpkin soups,
respectively (Table 6). After freeze-drying and storage of dried samples, the pH of soups
was similar to that obtained for most fresh soups. Valdenegro et al. [71] observed that
after drying, pH of goldenberry was maintained. However, the pH of banana leaves after
drying increased slightly after drying due to the degradation of acid compounds in that
material [72]. Dried cucumber soup also showed a higher pH value than fresh soup but
after storage the pH of dried soup did not differ.Appl. Sci. 2021, 11, 654 12 of 20
Table 6. Selected biochemical properties of different fresh, freeze-dried, and stored soups.
Content of Polyphenolic Compounds EC 50
Product pH (TPC) DPPH•
(mg GAE/100 g d.m.) (mg/mL)
Tomato soup
fresh 3.95 ± 0.14 a * 763 ± 15 a 2.08 ± 0.14 b
dried 4.17 ± 0.08 a 543 ± 22 b 2.38 ± 0.09 a
stored 4.05 ± 0.11 a 401 ± 29 c -
Beetroot soup
fresh 4.74 ± 0.08 a 595 ± 49 a 1.26± 0.08 a
dried 4.85 ± 0.10 a 537 ± 57 a 1.24 ± 0.09 a
stored 4.80 ± 0.12 a 521 ± 47 a -
Pumpkin soup
fresh 5.59 ± 0.09 a 556± 42 a 1.15 ± 0.03 b
dried 5.65 ± 0.07 a 501 ± 47 ab 1.26 ± 0.04 a
stored 5.61 ± 0.09 a 451 ± 47 b -
Cucumber soup
fresh 3.89 ± 0.03 b 569± 50 a 2.26 ± 0.09 b
dried 4.20 ± 0.07 a 367 ± 55 b 3.19 ± 0.04 a
stored 4.02 ± 0.11 ab 311 ± 41b -
* the different letter in the columns (for the same kind of soup) indicates the significant difference between the
obtained values for fresh, dried and stored samples p ≤ 0.05.
The scavenging activity against DPPH• radical was described by the EC50 coefficient.
The lower values of EC50 relate to a higher antioxidant activity [56]. The freeze-drying
of soups caused a slight increase of EC50 for the tomato, pumpkin, and cucumber soups
(Table 6). The drying process did not statistically alter the scavenging activity in the case
of the beetroot soup. The content of polyphenolic compounds (TPC) also did not change
after drying and storage of the beetroot soup. Red beetroots contain several phenolic acids
(both hydroxycinnamic and hydroxybenzoic acids) and flavonoids [73], which affect their
bioactivity. The beetroot soups before and after drying had a lower value of the EC50
than cucumber and tomato soups, which means that beetroot soups represented higher
antioxidant activity than cucumber soup, which might contain less bioactive compounds.
Seremet al. [74] observed the increase in the total phenol produced by the heat-treated
beetroot puree and the heat caused an increase in the amount antioxidants. However,
color of samples was significantly reduced by heat. The hydrolysis of C-glycosides in the
flavonoid composition caused the formation of monomers that increase the antioxidant
capacity. The TPC and antioxidant activity after drying of beetroot and pumpkin soups
did not change but the significant changes of color were observed (Tables 5 and 6). Nistor
et al. [75] stated that the degradation of betacyanins leaded to other phenolic compounds
which stimulated the increase of antioxidant activity of dried beetroot. The content of
polyphenolic compounds (TPC) after drying decreased significantly from 763 to 543 mg
GAE/100 g d.m. for tomato soup and from 569 to 367 mg GAE/100 g d.m. for cucumber
soups. It can be noticed that in the case of these soups, also the antioxidant capacity was
the lowest. The significant decrease of TPC after storage was only observed for freeze-dried
tomato soup.
The investigation of freeze-dried soups showed that these products were characterized
by good sensory attributes based on overall acceptability [33] but the food ingredients could
significantly affect the sensory quality of instant soups [31]. The fresh soups and rehydrated
soups were subjected to sensory analysis (Table 7). The investigated fresh commercial
soups varied in the scores of sensory attributes. Thus, the change of these attributes of
fresh soup and after rehydration of dried sample was analyzed. Sensory analysis showed
the scores of color after rehydration of freeze-dried tomato, pumpkin, and cucumber soupsAppl. Sci. 2021, 11, 654 13 of 20
were lower by about 31–36% regarding fresh soups. The rehydrated beetroot soup showed
the highest change of color in comparison to fresh soups. Sensory analysis confirmed the
results obtained by the instrumental measurement of color attributes. The beetroot soups
showed the highest change of color after drying. These changes negatively affected the
color of the reconstituted soup evaluated by the panelists. The drying process did not affect
the consistency of the pumpkin and beetroot soups after rehydration. The scores of taste
and aroma, as well as overall quality, decreased the most for rehydrated tomato soup. The
reconstituted freeze-dried soups were positively evaluated regarding taste, consistency,
aroma, and overall quality, but the color of the soup significantly deviates from the color of
fresh soups.
Table 7. Changes of sensory attributes (%) after rehydration of freeze-dried soups in comparison to
freshly prepared soups.
Product Color Consistency Taste Aroma Overall Quality
Tomato soup 36 ± 3 5±1 18 ± 2 24 ± 2 26 ± 3
Beetroot soup 42 ± 5 0±0 9±1 11 ± 1 16 ± 2
Pumpkin soup 31 ± 2 0±0 11 ± 1 21 ± 2 20 ± 1
Cucumber 35 ± 3 4±1 1±0 17 ± 1 18 ± 2
3.2. The Sorption Properties of Freeze-Dried Soups
The sorption isotherms describe the relationship between the water content and the
water activity of the material. The selection of the best model of sorption behavior can
be difficult due to the complex chemical composition and structure of food products [76].
Table 8 presents the estimated parameters of GAB, BET, Lewicki, Peleg, Hasley models. The
model that best fit the observed data was conducted by the comparison of coefficients RMS,
R2 , and P. The best model should be described by the highest coefficient of determination
(R2 ) and the lowest values of root mean square (RMS) and P (mean relative deviation
modulus) [77]. The parameter P has been used in several sorption experiments, and
the sorption model was acceptable and good when P < 10% [42,78]. A mathematical
comparison of experimental and predicted results for freeze-dried soups gave P values
ranging from 6.44 (Peleg model) to 56.34% (BET model). The values of RMS were very
high for cucumber freeze-dried soup and varied from 21.31 (for Peleg model) to 80.49 (BET
model). The Peleg model showed the lower values of RMS (11.89–21.31%) and P modulus
(lower than 16.5%) than other models for the investigated freeze-dried soups. The values
of determination coefficient R2 (for Peleg model) ranged from 0.976 to 0.999, which was
can be considered to be satisfying. By contrast, the GAB model has been frequently used to
describe sorption isotherms of many food products because parameters of this model have
a physical meaning. Also, the GAB model was reported as a very versatile sorption model
that can be applied for a wide range of water activity [79]. However, Table 8 shows the
GAB parameters obtained in this study did not fulfil the requirements of the GAB model
because constant C should be in the range of 5.67 ≤ C ≤ ∞ [80]. Thus, the Peleg model
was selected as an adequate model to characterize the sorption isotherms of all freeze-fried
soups.Appl. Sci. 2021, 11, 654 14 of 20
Table 8. Parameters of isotherm sorption models obtained for different freeze-dried soups.
Model Parameter Tomato Beetroot Pumpkin Cucumber
um 24.66 65.42 69.11 107.09
C 0.33 0.2 0.17 0.06
k 0.92 0.84 0.83 0.97
GAB 1 R2 0.998 0.978 0.998 0.97
RMS 14.11 20.05 15.24 47.35
P 8.52 14.57 9.77 37.65
um 11.12 8.88 18.02 68.37
c 0.8 2.03 0.53 0.06
BET 2 R2 0.996 0.96 0.992 0.972
RMS 15.22 16.59 14.78 80.49
P 9.77 11.78 8.49 56.34
F 3.13 16.73 13.29 5.23
G 1.59 0.89 0.96 1.78
H −35.59 4.19 3.97 6.21
Lewicki 1 R2 0.966 0.989 0.998 0.966
RMS 48.08 18.85 14.01 35.21
P 29.9 12.96 7.6 25.7
A 108.81 120.44 109.87 325.43
B 19.12 5.39 17.86 2.16
D 5.87 3.82 4.67 5.91
Peleg 1 E 1.29 0.26 1.13 0.04
R2 0.999 0.976 0.999 0.989
RMS 13.16 13.14 11.89 21.31
P 7.63 9.16 6.44 16.5
g 4.12 5.9 5.48 3
h 0.77 0.81 0.81 0.58
Hasley 1 R2 0.995 0.969 0.991 0.962
RMS 25.51 23.32 42.68 35.69
P 15.21 17.92 23.78 29.28
1 in the water activity range of 0–0.85, 2 in the water activity range of 0–0.53.
The experimental and predicted values calculated based on the Peleg model were
presented in Figure 4a. The sigmoid shape of isotherm sorption was observed for freeze-
dried beetroot and cucumber soup. The equilibrium moisture content of freeze-dried
cucumber soup attained lower values than that observed for other dried soups in the water
activity range of 0–0.53. Above the aw value, a rapid increase of equilibrium water was
noted with the increase of water activity for dried cucumber soup. A similar behavior
was reported for freeze-dried avocado when the water activity was higher than 0.5 [81].
The authors stated that this behavior could be related with the high concentration of
hydrophobic fat in the dried avocado. The sigmoid shape of the sorption curve was also
observed for dried tomato products. At low and intermediate water activities, the moisture
content increased linearly with the water activity, but at high water aw , the water content
rapidly increased with the water activity, which was linked with capillary condensation [40].
The cucumber soup contained a high amount of water, and after drying, the layer of dried
soup was more fragile and porous in comparison to other soups (visual observations). It
can be concluded that at the higher water activity, the pores of the dried material were
filled with absorbed water and a further increase of water activity could lead to a rapid
increase of the moisture content in the sample. The material was not able to bind the water
due to the limited amount of solid matrix in freeze-dried cucumber soup.Appl. Sci. 2021, 11, 654 15 of 20
Figure 4. Sorption
Figure 4.isotherms of differentoffreeze-dried
Sorption isotherms soups obtained
different freeze-dried soupsusing: (a) ausing:
obtained static method (lines—Peleg
(a) a static model);
method (lines (b) a
- Peleg
dynamic vapor sorption method (DVS)
model); (b) a DVS method. method.
The sorption isotherms of many vegetable and vegetable powders followed type
II according to Brunauer’s classification [40,82,83]. The procedure and Equation (12)
described by Blahovec and Yanniotis [61] was applied to classify the isotherm sorption
of freeze-dried soups. The non-linear regression enabled the obtaining of classification
parameters for beetroot and cucumber freeze-dried soups (Table 9). The predicted values
for freeze-dried pumpkin and tomato soups were outside the interval of experimental data
and the determination coefficients were lower than 0.85. In this case, regression did not
lead to obtaining the equation parameters, which can be interpreted physically.
Table 9. Parameters of classification of sorption isotherms.
Parameter Beetroot Soup Cucumber Soup
X4 5.21 (X4 > 0.1) 3.61 (X4 > 0.1)
D10 0.75 (positive) 1.47 (positive)
Rfi −0.16 (negative) −0.27 (negative)
awm 0.28 (0.1) 0.30 (0.1)
The sorption isotherms with parameter X4 higher than 0.1, negative value of Rfi ,
positive value of D10 and awm from the range of 0–1, can be classified as type IIc, which
is closer to the solution-like isotherms at higher aw . This type of isotherms was observed
in the case of fruit and vegetables [61,84]. The values obtained for beetroot and cucumber
freeze-dried soups showed that their isotherms can be classified as type IIc (Table 9).
The classification of isotherms can be also performed by plotting aw /w (ratio of water
content and water content) against water activity. The shape and course of the curve may
indicate the type of isotherms [61]. The curves with extremum obtained for freeze-dried
beetroot cucumber soups are characteristic for type II of isotherms (Figure 5). The course
of curves obtained for the freeze-dried tomato and pumpkin soup was ambiguous. The
decreasing trend of water content with the increase of water activity is typical for isotherm
type III, but the shape of the curve slightly deviates from isotherm type III in the range of
low water activities.
1The classification of isotherms can be also performed by plotting aw/w (ratio of water
content and water content) against water activity. The shape and course of the curve may
indicate the type of isotherms [61]. The curves with extremum obtained for freeze-dried
beetroot cucumber soups are characteristic for type II of isotherms (Figure 5). The course
of curves obtained for the freeze-dried tomato and pumpkin soup was ambiguous. The
Appl. Sci. 2021, 11, 654 16 of 20
decreasing trend of water content with the increase of water activity is typical for isotherm
type III, but the shape of the curve slightly deviates from isotherm type III in the range of
low water activities.
Figure 5.
Figure 5. aw
w/w
/wplotted
plottedagainst water
against activity
water (aw)(aobtained
activity during
w ) obtained the adsorption
during of freeze-dried
the adsorption of freeze-dried
soups.
soups.
The sorption
The sorptionofofisotherms
isotherms was
wasalso obtained
also obtainedusing the DVS
using the DVStechnique. The main
technique. Thead-main
vantage of of
advantage this method
this method is the short
is the shorttime
timeof the measurement
of the measurement (about 48 h48for
(about h the freeze-
for the freeze-
driedsoups)
dried soups)inincomparison
comparisontotothe thestatic
staticmethod
method(3(3 months)
months) (Figure
(Figure 4b).
4b). The
The values
values of
of water
water content obtained for samples at the water activities in the investigated
content obtained for samples at the water activities in the investigated range and with range and
with
the the application
application of these
of these two methods
two methods werewere different.
different. However,
However, some some isotherms
isotherms of
of freeze-
freeze-dried soups (cucumber and tomato) had a similar course
dried soups (cucumber and tomato) had a similar course and values. Some investigatorsand values. Some inves-
tigators examined
examined differentdifferent
methodsmethods
of testingof the
testing the sorption
sorption isotherms.isotherms. The experiments
The experiments showed
showed that due to the short time of the experiment, not all pores were saturated by water
that due to the short time of the experiment, not all pores were saturated by water [85].
[85]. Garbalinska et al. [41] concluded that the traditional method and the DVS showed good
Garbalinska et al. [41] concluded that the traditional method and the DVS showed good
compatibility in the range of RH between 0 and 75–85% for the aerated concrete. At higher
Appl. Sci. 2021, 11, 654 compatibility in the range of RH between 0 and 75–85% for the aerated concrete. 17 Atofhigher
21
relative humidity, the equilibrium moisture content was higher for the traditional method
relative humidity, the equilibrium moisture content was higher for the traditional method
than that recorded by the DVS method. On the contrary, the water content registered with
than that recorded by the DVS method. On the contrary, the water content registered
with the application
the application of themethod
of the DVS DVS method
was higher wasfor higher for freeze-dried
freeze-dried beetroot
beetroot soups soups
at the se- at
the
lected water activity. However, the DVS method can be a useful tool for the fast evaluation fast
selected water activity. However, the DVS method can be a useful tool for the
evaluation
of the sorptionof the sorption
behavior behavior of materials.
of materials.
Additionally, the kinetics ofofwater
Additionally, the kinetics watersorption
sorption at at a water
a water activity
activity of 0.75
of 0.75 waswas recorded
recorded
(Figure 6). The measurements confirmed different sorption properties
(Figure 6). The measurements confirmed different sorption properties of freeze-dried cu- of freeze-dried
cucumber
cumber soups soups because
because thethe sample
sample absorbed
absorbed moremore water
water at aat a higher
higher rate.rate.
TheThe freeze-dried
freeze-dried
tomato soup was
tomato soup wasaalesslesshygroscopic
hygroscopicmaterial
material atat
awa=w0.753.
= 0.753.
Figure 6. Kinetics
Figure Kineticsof
ofwater
watersorption
sorptionofoffreeze-dried soups
freeze-dried at aatw a=w0.75.
soups = 0.75.
4. Conclusions
The freeze-drying method can be used to preserve vegetable soups. The final water
content (2–3%) and water activity (0.2) of samples after drying were sufficiently low to ob-
tain a stable product during storage. The undesired changes in the color of vegetable soupsAppl. Sci. 2021, 11, 654 17 of 20
4. Conclusions
The freeze-drying method can be used to preserve vegetable soups. The final water
content (2–3%) and water activity (0.2) of samples after drying were sufficiently low to
obtain a stable product during storage. The undesired changes in the color of vegetable
soups were noticed after drying, and storage of products which could be related to the
disintegration of natural pigments and the browning processes. Also, the antioxidant
activity of most freeze-dried soups was reduced due to the degradation of bioactive
compounds during the long drying time of the process. The Peleg model was applied
to describe the isotherms of freeze-dried soups. The moisture isotherms obtained for
cucumber and beetroot was classified as type II of the isotherm. The shape of the isotherms
observed for freeze-dried tomato was similar to isotherm type III. The composition of soups
and their form (homogenized and with pieces of vegetables) may have affected the porosity
and sorption properties of freeze-dried soups. A sharp increase in water content was
observed for samples stored at water activity higher than 0.5. Thus, the freeze-dried soups
should be stored in barrier bags in an environment with lower humidity. The reconstituted
freeze-dried soups were positively evaluated regarding taste, consistency, aroma, and
overall quality but negatively in terms of their color. The significant decrease of bioactive
activity and the lower scores of sensory attributes obtained for the tomato soups indicated
that soups with a high concentration of tomato were not suitable for freeze-drying.
Author Contributions: Conceptualization, E.J.; Methodology, E.J.; Investigation, E.J. and A.J.; Formal
analysis, E.J.; Writing—original draft preparation, E.J.; Writing—review and editing, E.J. All authors
have read and agreed to the published version of the manuscript.
Funding: This research received no external funding.
Institutional Review Board Statement: Not applicable.
Informed Consent Statement: Not applicable.
Data Availability Statement: Some data used during the study are available from the corresponding
author by request.
Acknowledgments: The research equipment purchased as part of the “Food and Nutrition Centre–
modernization of the WULS campus to create a Food and Nutrition Research and Development
Centre (CŻiŻ)” was co-financed by the European Union from the European Regional Development
Fund under the Regional Operational Programme of the Mazowieckie Voivodeship for 2014–2020
(Project No. RPMA.01.01.00-14-8276/17).
Conflicts of Interest: The authors declare no conflict of interest.
References
1. de Ancos, B.; Sánchez-Moreno, C. Soups. In Innovative Technologies in Beverage Processing, 1st ed.; Aguiló-Aguayo, L., Plaza, L.,
Eds.; John Wiley & Sons Ltd.: Chichester, UK, 2017; pp. 249–273.
2. Erkekoglu, P.; Sipahi, H.; Baydar, T. Evaluation of Nitrite in Ready-Made Soups. Food Anal. Methods 2009, 2, 61–65. [CrossRef]
3. Raitio, R.; Orlien, V.; Skibsted, L.H. Storage stability of cauliflower soup powder: The effect of lipid oxidation and protein
degradation reactions. Food Chem. 2011, 128, 371–379. [CrossRef]
4. Rekha, M.N.; Yadav, A.R.; Dharmesh, S.; Chauhan, A.; Ramteke, R.S. Evaluation of antioxidant properties of dry soup mix
extracts containing dill (Anethum sowa L.) leaf. Food Bioprocess Technol. 2008, 3, 441–449. [CrossRef]
5. Farzana, T.; Mohajan, S.; Saha, T.; Hossain, N.; Haque, Z. Formulation and nutritional evaluation of a healthy vegetable soup
powder supplemented with soy flour, mushroom, and moringa leaf. Food Sci. Nutr. 2017, 5, 911–920. [CrossRef]
6. Abdel-Haleem, A.M.H.; Omran, A.A. Preparation of dried vegetarian soup supplemented with some legumes. Food Nutr. Sci.
2014, 5, 2274–2285. [CrossRef]
7. Karam, M.C.; Petit, J.; Zimmer, D.; Djantou, E.B.; Scher, J. Effects of drying and grinding in production of fruit and vegetable
powders: A review. J. Food Eng. 2016, 188, 32–49. [CrossRef]
8. Vega-Gálvez, A.; Di Scala, K.; Rodríguez, K.; Lemus-Mondaca, R.; Miranda, M.; López, J.; Perez-Won, M. Effect of air-drying
temperature on physico-chemical properties, antioxidant capacity, colour and total phenolic content of red pepper (Capsicum
annuum L. var. Hungarian). Food Chem. 2009, 117, 647–653. [CrossRef]
9. Kerdpiboon, S.; Devahastin, S.; Kerr, W.L. Comparative fractal characterization of physical changes of different food products
during drying. J. Food Eng. 2007, 83, 570–580. [CrossRef]You can also read