Variations of surface water quality in selected tidal creeks of Sagar Island, Indian Sundarban eco region: a multivariate approach
←
→
Page content transcription
If your browser does not render page correctly, please read the page content below
Applied Water Science (2021) 11:63
https://doi.org/10.1007/s13201-021-01391-8
ORIGINAL ARTICLE
Variations of surface water quality in selected tidal creeks of Sagar
Island, Indian Sundarban eco‑region: a multivariate approach
Sanghamitra Basu1 · Subarna Bhattacharyya1 · Pranab Gogoi2 · Suryasis Dasgupta1 · Sanjoy Kumar Das2
Received: 26 November 2019 / Accepted: 3 March 2021 / Published online: 24 March 2021
© The Author(s) 2021
Abstract
Sagar Island in Indian Sundarbans is bestowed with numerous tidal creeks providing a suitable home to its inherent aquatic
biota. The present study investigated the variation in the surface water quality in selected tidal creeks of Sagar Island, Indian
Sundarbans to understand the present status of water quality for wildlife propagation and fisheries. Ten water parameters
were taken into consideration for analysis on monthly basis from four stations (tidal creeks) from September 2015 to August
2016. One-way ANOVA showed five parameters (water temperature, salinity, dissolved oxygen, turbidity and chemical
oxygen demand) varied significantly between seasons (p ≤ 0.05). Factor analysis exhibited four factors explaining 53.21%
total variance in the observed data. Salinity and turbidity showed a maximum annual range of variations followed by dis-
solved oxygen. The fluctuations of physicochemical parameters throughout the year hinted toward the ever-changing nature
of the estuarine ecosystem with possible human-induced impacts. Pronounced variation in turbidity seemed to be the effect
of ferrying/transportation, monsoonal runoff and other human-induced activities. In the present study, water parameters
viz., water temperature, dissolved oxygen and turbidity were the deterministic parameters influencing the variables in the
system. The other important parameters were found to be COD, BOD3 and nitrate concentrations during the study period.
The study shall provide baseline information in formulating the management measures in terms of water quality in wildlife
propagation and fisheries.
Keywords Water parameters · Creeks · Multivariate approach · Sundarbans
Introduction heritage site by United Nations Educational, Scientific and
Cultural Organization (1987) which shall go a long way to
Sundarbans, the largest deltaic stretch of mangrove forest in protect and conserve biodiversity (Sreelekshmi et al. 2020).
the world, is formed at the estuarine phase of the Ganges— Recently, in February 2019, the Indian Sundarbans has also
Brahmaputra river system (Chaudhuri et al. 2012). The area been designated as ‘Wetland of International Importance’
of Sundarbans is characterized by a low flat alluvial plain (Ramsar site) (Sreelekshmi et al. 2020). Gopal and Chauhan
covered with mangrove swamps and marshes, and it is criss- (2006) stated the extensive spatiotemporal changes in hydro-
crossed by a large number of tidal rivers, estuaries, creeks logical regimes, topography and texture of the substratum,
and saline water courses (Bagchi 1972). The biodiversity salinity and their interactions cause habitat heterogeneity in
of Indian Sundarbans is extremely rich and also consists the mangrove ecosystems which affects the aquatic vegeta-
of extremely rich coastal, estuarine and marine fisheries. tion and fauna directly, and also causing damage especially
Taking this into consideration, it has been declared as world to the seabirds. The author also stated that there is continu-
ous threat to biodiversity due to the burgeoning human pop-
ulation, pollution, growing industrialization, oil spills, oil
* Sanghamitra Basu
oomphsenorita090@gmail.com exploration, global climate change and sea level rise.
Tidal creeks are extremely abundant in Sundarbans estua-
1
School of Environmental Studies, Jadavpur University, rine systems which serve as feeder rivers, providing food
Kolkata 700032, India control, storm water drainage and habitat to wildlife. It is
2
Kolkata Centre, ICAR-Central Inland Fisheries Research ecologically important for the transfer of materials from
Institute, C.G.O. Complex, 2nd Floor, Sector‑1, Kolkata, terrestrial to marine biome, habitat to nursery ground for
West Bengal 700 064, India
13
Vol.:(0123456789)63 Page 2 of 11 Applied Water Science (2021) 11:63
commercial fisheries (Mallin and Lewitus 2004; Saliu and seawalls and jetties, etc. (Mondal et al. 2017). The effects
Ekpo 2006). There has been a considerable loss of creeks of climate change are also well documented in and around
due to overuse, pollution, diversion, land filling, etc., and Sagar Island (Mitra et al. 2009).
Indian Sundarbans is also not an exception thereof. The The multivariate statistical approaches have become
nature and distribution of biodiversity are primarily ruled popular in recent times due to their ability to treat large vol-
by variations in the physicochemical properties of water ume of spatial and temporal data from variety of monitoring
(Murugan and Ayyakkannu 1991). It is also responsible for sites (Barakat et al. 2016). Different multivariate statistical
supporting aquatic life and maintaining the aquatic environ- techniques such as cluster analysis, principal component
ment and is likely to have an impact on the growth of the analysis, factor analysis and discriminant analysis are used to
organisms as well as the productivity of the ecosystems (Das interpret the complex data matrices for a better understand-
2012). The physicochemical properties of the estuarine envi- ing of the water quality and ecological status of the stud-
ronment are highly dynamic due to the influx of fresh water. ied ecosystems (Vega et al. 1998; Noorie et al. 2010; Wang
Surface waters are the most vulnerable and are exposed to et al. 2014). It also allows the identification of possible fac-
rapid pollution due to their easy accessibility both the natural tors that have an impact on water systems and provides an
and anthropogenic causes (Singh et al. 2004; Barakat et al. essential tool for reliable management of water resources
2016). These creeks are also acting as the probable channels (Wunderlin et al. 2001; Reghunath et al. 2002; Simeonova
for carrying pollutants (municipal and industrial wastes run et al. 2003). Helena et al. (2000) stated that multivariate
off from agricultural land) to the estuarine core. Barletta statistical techniques facilitate to characterize and evalua-
et al. (2019) opined that the estuaries are often found to have tion of surface water quality, which will be useful further in
the hard-hit zones with respect to the heavy metals and pesti- verifying spatial and temporal patterns linked to seasonal-
cides, and usually it has a high residence time for pollutants. ity. Wang et al. (2007) evaluated the spatiotemporal varia-
In addition, the seasonal variation of precipitation, surface tions of water quality of 19 rivers by applying the cluster
runoff, is a seasonal phenomenon which also supports to analysis and factor analysis. Similarly, Kumarasamy et al.
constitute the polluting source, largely affected by climate. (2014) and Khan et al. (2016) applied cluster analysis and
Since estuaries and the supported creeks are highly fecund factor analysis to investigate the variability of hydrochem-
ecosystems and provides congenial home for the inherent istry from Tamrapani river, Southern India and Ramganga
biota, it is necessary to prevent and control the sources of river (Ganga basin), respectively. The correlation analysis,
pollution and to have reliable information on quality of water principal component analysis and canonical correlation
for effective management. Therefore, it is imperative to components were used by Noori et al. (2010) to study the
understand the changes in water quality variables from time seasonal variation of water variables, relationship between
to time for the quality assessment of the ecosystem (Chang physical and chemical parameters and selection of princi-
2008). The gradual increase in human activities for develop- pal and non-principal monitoring stations in the Karoon
ing coastal areas also have resulted in loss of ecological val- river basin, Iran. Sharma et al. (2015) also applied former
ues of the tidal creeks (Vernberg and Vernberg 2001). The multivariate techniques to identify the potential sources of
large variability in hydrological parameters in coastal water pollution and clustering of monitoring stations of Ganga
influences, topographic heterogeneity and their interactions, and Yamuna River in Uttarakhand, India. Furthermore,
has resulted in a biodiversity explosion in the Sundarbans usefulness of cluster analysis, principal component analysis
mangrove eco-region (Ansari et al. 2017). Although such and factor analysis for interpreting the complex data sets,
creek ecosystems are highly vulnerable to environmental identifying the attributes responsible for pollution as well
changes and anthropogenic interferences, yet their ecologi- as water quality management previously reported by sev-
cal significance is underestimated as very less studies on eral workers (Shreshtha and Kazma 2007; Noori et al. 2010,
these systems have been so far conducted relative to larger, 2012; Wang et al. 2012, 2014; López‐López et al. 2014;
better-known estuarine systems (Mallin and Lewitus 2004). Bostanmaneshrad et al. 2018). In the recent times, several
Therefore, the present study evaluated the water quality authors have evaluated the underlying relationship between
status of four creeks (Costala, Gangasagar, Chemaguri and macro-scale parameters (land use, population density, geol-
Mooriganga) in the Sundarban eco-region. Reports are ogy, erosion, etc.) with the micro-scale attributes, i.e., water
available on fluctuations of physicochemical parameters in quality parameters (Bostanmaneshrad et al. 2018; Chim-
various parts of Sundarbans (Sarkar et al. 1986; Mitra et al. wanza et al. 2014; Liu et al. 2016). Bostanmaneshrad et al.
2009; Manna et al. 2010; Das 2012; Chaudhury et al. 2012; (2018) quantified the significant relationship between land
Rakshit et al. 2015); however, the studies on spatiotemporal use and phosphorus, total solids and turbidity, erosion levels
variations of water quality in tidal creeks, at Sagar Island are and electrical conductivity, and erosion and total solids in
still scarce. The island had been affected by natural coastal their study from Siminehrood river basin. All the previous
processes, storm waves and artificial constructions such as studies showed that the multivariate statistical methods are
13Applied Water Science (2021) 11:63 Page 3 of 11 63
important tools to determine the relationships between the and erosion which accounted for approximately 30 km2
water quality parameters, and identify particular attributes net land loss in the last three decades (Hazra et al. 2002).
responsible for the relationship. With this view, the present Among the tidal creek system at Sagar, Chemaguri creek
study is an attempt to understand the present ecological is the most prominent one with planted mangroves along
health and status of tidal creeks in the mangrove ecosystems its length (Mitra et al. 2009). The present study was car-
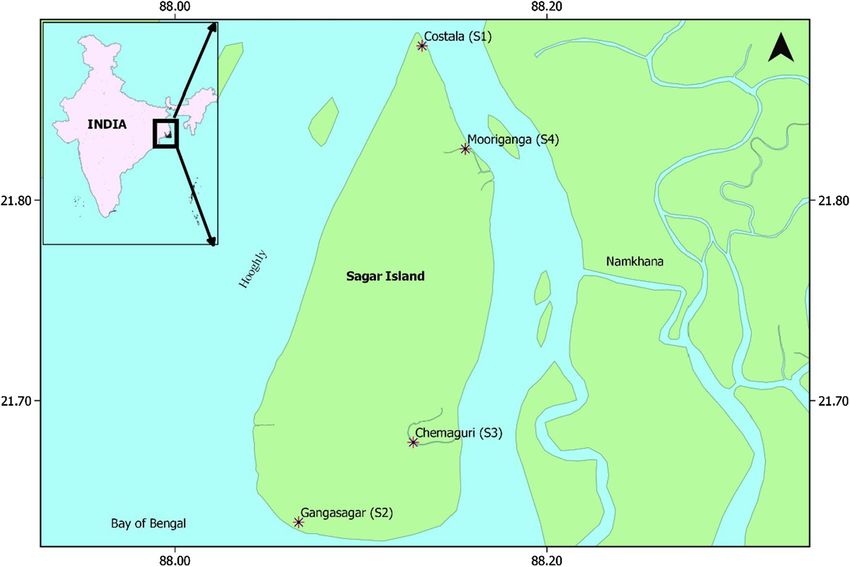
of Sagar Island by approaching multivariate techniques. The ried out from September 2015 to August 2016 in 4 (four)
basic objective of the study is to evaluate the spatiotemporal major creeks viz. Costala (21º 48ʹ 829ʺ N 88º 09ʹ 93ʺ E),
variability in physicochemical parameters of surface water Gangasagar (21º 41ʹ 222ʺ N 88º 02ʹ 80ʺ E), Chemaguri
samples collected from the selected tidal creeks. (21º 40ʹ 745ʺ N 88º 07ʹ 695ʺ E) and Mooriganga
(21º 48ʹ 828ʺ N 88º 09ʹ 93ʺ E) (herein referred as S1, S2,
S3 and S4, respectively) at Sagar Island, Indian Sundarbans.
Study area The sampling sites were designed to cover a wide range of
determinants of key sites, which reasonably represent the
Sagar Island (between latitude 21º 37′ and 21º 52ʹ N and water quality of the creeks in the Island. The sites were
longitude 88º 03′ and 88º 11′E), part of the Hooghly-Mat- selected mainly based on their mangrove vegetation cov-
lah estuary is subjected to intense tidal and wave actions ers and also ranging from region with high riverine influ-
(Majumdar et al. 2002). The island has unique mangrove ence (Costala and Mooriganga) to brackish water regions
vegetation and surrounded by the river Hooghly on the and mangrove vegetation (Chemaguri and Gangasagar). The
north and the west, Mooriganga on the eastern side, while geographical locations of the sampling sites and study area
the southern part faces the Bay of Bengal. The island is in Sagar Island, Sundarbans are shown in Fig. 1.
inundated by various natural tidal creeks and artificial canals
which are a source of saline surface water in the island
(Chakraborty 1995). The island experiences a semidiurnal
tidal regime with high tide zone ranges from 5 to 6 m (Paul
and Bandhopadhay 1987). The island is also highly vulner-
able to environmental degradations, burgeoning population
Fig. 1 The map showing the geographical locations of the sampling sites and study area in Sagar Island, Sundarban
1363 Page 4 of 11 Applied Water Science (2021) 11:63
Sampling procedure coefficient − 1 or 1 indicated the strongly negative or positive
relationship between the two variables, whereas its value
Surface water samples were collected in pre-cleaned acid closer to 0 defined no linear relationship between them at
washed polyethylene bottles (1.0 L) during low tide before 0.05 significance level (Kumar et al. 2006; Barakat et al.
noon from the selected locations. Water temperature (WT) 2016). Hierarchical agglomerative cluster analysis was per-
was measured on field by using a mercury thermometer formed to understand a measure of similarity using Euclid-
(0–100 °C); pH with a digital pH meter (Model No. 101 E), ean distances (Zhao et al. 2011; Singh et al. 2004; Sharma
and turbidity (Nephelometric turbidity unit) was measured 1996). The hierarchical cluster analysis is the most common
by a turbidity meter (Model No. EI 331E). The in situ esti- approach where the clusters are formed based on the similar
mation of dissolved oxygen (DO) and salinity (ppt) was done nature attributes and forming higher clusters step-by-step
by the titrimetric method (APHA 2005). Collected water (Willet 1987). Generally, the Euclidean distance portrayed
samples were brought to the laboratory in cold conditions the proximity between two samples and ‘distance’ which is
for nutrient analysis. Nutrients such as nitrate, phosphate and represented by the ‘difference’ between the obtained val-
silicate were analyzed following standard methods described ues from both the samples (Otto 1998), and it is illustrated
in APHA (2005). For analysis of chemical oxygen demand through a dendogram (Forina et al. 2002). Further, non-
(COD) and biochemical oxygen demand (BOD), water sam- metric dimensional scaling (NMDS) was also performed
ples were collected separately in 500 ml polyethylene bottles. to visualize the dimensions to understand the similarity or
COD was measured by the open reflux method, and BOD dissimilarities among data sets. Likewise, factor analysis
was estimated by a 3-days BOD incubation (BOD3) (APHA was performed (XLSTAT v.18) on the water quality data to
2005). All the methods were standardized as per ambient find out the factors related to influence each of them. The
conditions and blank measurements were taken into consid- first step of factor analysis is to standardize the raw data
eration for the estimation procedures. HPLC grade water was and make them dimensionless. The correlation coefficient
used throughout the laboratory works. Since determination matrix, eigen values and eigen vectors were determined to
of BOD ( BOD3 and/or B OD5) is a long-time estimation pro- yield the covariance matrix (Wang et al. 2014). The fac-
cess, several attempts have been made to shorten the process tors with eigen values that exceed 0.5 were considered in
by applying alternate analytical methods (Noori et al. 2011, this study, whereas only three factors obtained that exceed
2013). The analytical model such as reduced-order neu- one. Varimax rotation is an important second step in factor
ral network model (RONNM) and reduced-order adaptive analysis used for maximizing the sum of the variance of
neuro-fuzzy inference system (ROANFIS) model fed with the squared loadings, where ‘loadings’ means correlations
input vectors [latitude (N), longitude (E), suspended sol- between variables and factors. The varimax rotation on the
ids, water temperature, river discharge, DO, electrical con- factor loading infers the rotated principal factors (Singh et al.
ductivity, nitrate and total phosphorus] is developed which 2004, 2012; Noori et al. 2010; Ghahremanzadeh et al. 2018).
indicated the best fitted online predictions of B OD5 (Noori
et al. 2011, 2013).
Data treatment Table 1 Seasonal variation of water quality parameters in the study
sites of Sundarbans
Statistical computations such as one-way ANOVA, Pear-
Water variables Pre-monsoon Monsoon Post-monsoon
son correlation, clustering dendrogram and factor analy-
sis were performed with the help of software applications pH 7.67a ± 0.29 7.65a ± 0.52 7.50a ± 0.50
(SPSS v. 23 and XLSTAT v. 2018). The environmental data Water temperature 27.67 ± 3.00 26.29a ± 3.07 20.88b ± 0.97
a
were normalized by transforming log(x + 1) prior to analy- (°C)
sis. The water quality parameters of different seasons were Salinity (ppt) 25.59a ± 6.10 5.83b ± 6.82 13.54c ± 5.74
subjected to one-way analysis of variance (ANOVA) and Dissolved oxygen 5.97a ± 1.32 5.96a ± 1.57 4.69b ± 0.83
(mgl−1)
Duncan’s multiple range tests (DMRT) post-hoc test using
Turbidity (NTU) 43a ± 22.83 65b ± 18.11 36.93a ± 28.78
SPSS v.23. The post-hoc test was carried out to find out the
Phosphate (mgl−1) 2.64 ± 2.39 2.90a ± 4.47
a
4.0a ± 3.35
significant variations of measured water variables between
Nitrate (mgl−1) 1.29 ± 0.73 1.40 ± 0.65 1.10a ± 0.57
a a
seasons. Pearson correlation (2-tailed) was conducted to
Silicate (mgl−1) 12.94a ± 7.26 16.6a ± 7.97 13.18a ± 6.30
comprehend the interdependence among the physicochemi-
COD (mgl−1) 23.93a ± 8.39 17.87b ± 6.09 17.0b ± 4.03
cal parameters. This minimizes the effect of between sta-
BOD3 (mgl−1) 2.20a ± 0.77 1.86a ± 0.67 1.81a ± 0.49
tions correlations and between sampling campaigns rela-
tionships (Barakat et al. 2016). Further, the correlation Values are means ± SE means followed by the same letter are not sig-
nificantly different at 5% probability level
13Applied Water Science (2021) 11:63 Page 5 of 11 63
Results and discussion and Bhattacharya (2010) where the authors stated that dis-
solved oxygen concentration in the surface water of Sunda-
The variation of water quality parameters in different sea- rbans mangrove wetland ranged from 5.18 to 6.49 m gl−1
−1
sons (pre-monsoon, monsoon and post-monsoon) is docu- with an average value 4.0 mgl , indicating that surface
mented in Table 1. One-way ANOVA showed that, out of ten waters are moderately oxygenated. Turbidity was recorded
parameters, five parameters (WT, salinity, DO, turbidity and in the expected level with its peak during monsoon which
COD) varied significantly between the seasons (p ≤ 0.05). might be due to riverine influx bearing excess suspended
The water remained neutral to alkaline throughout the study load coupled with high monsoon precipitations. The steady
period well within the predicted range between 7.36 and expansion of waterway transportation/vessel trafficking was
8.16. The result is in agreement with the findings of Manna also one of the reasons for the enhancement of turbidity at
et al. (2010) and Choudhury et al. (2012) from Sundarban the stations under study. The mean value of turbidity was
waters. The rate of photosynthesis process, which removes highest at Chemaguri in the month of November and the
CO2 from water through bicarbonate degradation, freshwa- lowest at Gangasagar in December. The observed range of
ter influx and decomposition of organic matter, could have COD was 8.0–40.0 mgl−1 across the stations with an aver-
contributed to the fluctuation of pH (Rahman et al. 2013). age value 19.60 ± 7.0 m gl−1, which exceeds the permissi-
The alkaline nature of water (pH > 7.0) with low variations ble range of World Health Organization, i.e., < 10 mgl−1.
between the sampling stations, suggested that the water mass The precipitation causes dilution during monsoon which
remained well buffered throughout the study period, and it could be the reason for lower concentration of COD dur-
indicated the presence of biodegradable organic matter in ing monsoon. The moderate concentration of COD in the
the water column. Surface water temperature varied signifi- present study was indicating toward pollution of the aquatic
cantly (p ≤ 0.05) from post-monsoon to pre-monsoon. Water ecosystem due to natural and anthropogenic stresses. Bhat-
temperature of the tidal creeks showed a forecasted range tacharya et al. (2015) reported high range of COD values
of variability with lowest in post-monsoon in the month of (101.28–111.31 mgl−1) in their studies from Jambu Island,
January (19.34 °C), and had a maximum in pre-monsoon Sundarbans and stated that it is derived from the primary
in the month of June (31.13 °C). In tidal influenced estua- production of the dense mangrove forests. High COD val-
rine environment of the Sundarbans, temperature values ues in a tropical coastal wetland in Southern Mexico were
undergo a wide diurnal and seasonal variation. A gradual also previously reported by Hernández-Romero et al. (2004),
increase in salinity was observed from post-monsoon to and it was associated with mangrove-enriched organic mat-
pre-monsoon, recorded maximum in May (28.08 ppt) and ters which supported the present findings. The B OD3 ranges
lowest in October (0.79 ppt). The distinct temporal variation between 1.62 and 2.23 mgl−1 with an average 1.96 mgl−1,
of salinity in the present study was similar to Saravanaku- where maximum and minimum were recorded at Gangasa-
mar et al. (2008); Choudhury et al. (2012) and Gogoi et al. gar and Mooriganga, respectively. An average value of 2.04
(2019). Saravankumar et al. (2008) stated that low salinity mgl−1 BOD was reported previously by Rahman et al. (2015)
level in brackish water habitats such as backwaters, estuar- from Sundarban waters, Bangladesh which is in line with our
ies and mangrove waters is due to influx of freshwater from present observations.
land runoff caused by precipitations or by tidal variations, Non-uniform seasonal trend for nutrients was observed
which supported our present findings. Manna et al. (2010) throughout the study period. In general, nutrients are suf-
also reported similar findings with the lower salinity dur- ficient to support primary productivity in an estuarine envi-
ing winter months (November-February; avg. 16.7 PSU) as ronment. Tidal fluctuation is the main driving force for the
compared to summer months (March to May; 23.5 PSU) distribution of nutrients in Indian Sundarbans, where its
from Bara Herobhanga Khal (Jharkhali waters), Sundar- dispersion primarily depends on the tidal motions of the
bans. Moderate concentrations of dissolved oxygen were water body (Chaudhuri et al. 2012). No significant (p ≥ 0.05)
recorded across the stations with its maximum in October at variations of nutrients (phosphate, nitrate and silicate) were
the station Chemaguri (7.8 mgl−1) and minimum in Decem- observed across the seasons. Phosphate concentration was
ber at Mooriganga (3.29 mgl−1). Dissolved oxygen and water estimated to be highest at station Mooriganga (11.7 mgl−1)
temperature were influenced to a greater extent by atmos- in the month of October while the lowest at Gangasagar
pheric conditions and sampling times (Debels et al. 2005); (0.4 mgl−1) in March. Lower concentration of phosphate
as a result, its concentrations vary during various moments during pre-monsoon season might be due to its utilization
of the day and under different weather conditions. Lower by photoautotrophs, and buffering actions of sediments in
concentrations of DO during post-monsoon may be due to various environmental conditions (Rajasegar 2003). Silicate
increased salinity, temperature and biological activity (Lev- and nitrate showed higher concentration in monsoon as com-
inton 2001). Our observation is in conformity with Sarkar pared to post-monsoon and pre-monsoon during the study
period. Higher values of nitrate and silicate in monsoon may
1363 Page 6 of 11 Applied Water Science (2021) 11:63
be attributed to freshwater influx and land runoff (Sathpathy is mainly due to synthesis or decomposition of organic mat-
et al. 2009; Ramakrishnan et al. 1999). Similarly, Karup- ter. The estimated ratio of nitrate, phosphate and silicate is
pasamy and Perumal (2000) stated that higher magnitude of shown in Table 2.
nitrate during monsoon might be caused by the organic mat- Intra-relationship of various environmental variables
ter being enriched by the monsoonal flow and decomposition (Karl Pearson’s correlation coefficient) showed signifi-
of terrestrial runoff from the catchment areas. Sarkar and cant positive correlation of water temperature with salinity
Bhattacharya (2010) also opined that land-based nutrients, (r = 0.42; p ≤ 0.01), DO (r = 0.55; p ≤ 0.01), silicate (r = 0.40;
especially from the agricultural fields in proximity, contrib- p ≤ 0.01); COD (r = 0.38, p ≤ 0.01), and it was negatively
uted to a greater extent to the enrichment of nutrient con- correlated with phosphate (r = -0.11). According to Osibanjo
centrations during monsoon. The inverse trend was observed et al. (2011) and Şener et al. (2017), one very common but
with regard to phosphate concentrations that recorded the essential parameter, pH governs various other parameters
maximum during post-monsoon. Silicate values were found like alkalinity, solubility and also the hardness. The pH had
to be relatively higher as compared to the nitrate and phos- significant positive correlation with DO (r = 0.31; p ≤ 0.05).
phate in the present study, which is in line with Vajravelu Similar observation was also reported by Gogoi et al. (2019)
et al. (2018). Maximum concentration of nitrate and sili- in their study from Kailash Khal, Sundarbans; depicted that
cate was observed in the month of October (3.20 m gl−1; at pH had a positive correlation with water temperature and
Chemaguri) and August (31.7 mgl−1 at Costala), and low- also salinity with the water temperature and DO. The strong
est in the month of April (0.62 mgl−1 at Gangasagar) and positive correlation was observed between salinity and COD
March (4.24 m gl−1 at Chemaguri), respectively. The high (r = 0.39 p ≤ 0.01), and nutrients such as nitrate (r = 0.35
silicate and phosphate ratio (Si:P) in the present study is p ≤ 0.01) and silicate (r = 0.41 p ≤ 0.01). Gogoi et al. (2020)
corroborated with the findings of Chaudhuri et al. (2012) also found similar observation in their study from Sundarban
and Sarkar and Bhattacharya (2010). However, the Si:P ratio waters, where salinity had a positive correlation with the
was somewhat lower than ‘modified’ Redfield ratio (15:1) nutrient parameters (phosphate, silicate and sulfate).
(Brzezinski 1958), and our present observations in seasonal
estimates of silicate indicated broad seasonal fluctuations Multivariate approach
in the creek environment. Similarly, Choudhury and Bha-
dury (2015) reported that seasonal estimates of N:P ratio Cluster analysis was performed season-wise to understand
remained below the Redfield ratio (16:1), indicated nutri- the percentage similarity among various stations. The
ent limited (nitrogen) environment in Sagar island which hierarchical group average showed the variations in water
is in line with our present observation from Sagar Island. parameters by clustering similar nature of samples/sampling
Arumugum et al. (2016) also showed low N:P ratio than the stations. It formed two clusters with the maximum similar-
Redfield ratio in Muthupet mangrove waters depicted a low ity between the stations Chemaguri and Costala during pre-
bio-availability of nitrogen for primary production which monsoon, while showed maximum dissimilarity between the
confirms to our estimates. Redfield (1958) approached to a station Chemaguri during monsoon and Gangasagar during
conclusion that atomic ratios of elements in the biochemical pre-monsoon (Fig. 2). The freshwater influx with its high
cycle of plankton were statistically uniform and follow the allochthonous inputs during the rainy season also could be
stoichiometric ratio of C:N:P = 106:16:1 and this variation a reason for variations of water attributes during monsoon.
Further, NMDS also showed the similar nature of ordinance
pattern among samples/sampling stations that were observed
Table 2 Nutrient parameters: Months N:P Si:P in cluster analysis (Fig. 3). The stress value was found less
nitrate, phosphate and silicate
(N:P:Si) ratio in the study sites
than 0.14 which is good ordinance pattern that distance
September 0.29 2.10
of Sundarbans among items/samples are perfect. In this study, water param-
October 0.27 1.89
eters such as dissolved oxygen and turbidity were found to
November 0.37 4.93
be strong parameters influencing their variables in the sys-
December 0.67 7.78
tem. The other important parameters were found to be COD,
January 0.19 2.14
BOD3 and phosphate concentrations during the study period
February 1.14 6.45
(Table 3).
March 0.95 4.98
Results of the factor analysis showed, four factors were
April 0.37 2.26
extracted which explained 53.21% of the total variance in
May 0.48 5.59
the observed data (Table 4 and Fig. 4). The eigen value and
June 0.45 8.76
cumulative percentage variability of the extracted factor
July 0.44 7.34
from the data set are shown in the scree plot (Fig. 5). Fac-
August 0.55 8.90
tor 1 accounts for 22.62% variance where the parameters
13Applied Water Science (2021) 11:63 Page 7 of 11 63
Group average
Normalise
Resemblance: D1 Euclidean distance
POMS3
MONS4
PRMS3
PRMS1
MONS1
Samples
MONS3
POMS2
MONS2
POMS4
PRMS4
POMS1
PRMS2
5 4 3 2 1 0
Distance
Fig. 2 Dendogram showing the similarity of stations in seasons
Normalise loading revealed that parameters such as phosphate, COD
Resemblance: D1 Euclidean distance
and BOD3 were negatively correlated with each other. Since
POMS4 Season
POMS1
MONS4
2D Stress: 0.14
these causes of these parameters (phosphate and COD) are
1
2 primarily from the source of agricultural land and indus-
3
trial activities. BOD represents the high organic load, which
POMS2
POMS3 enriching the growth of microorganisms in the mangrove
MONS2 patches. From this analysis, it is reflected that the major
PRMS4 MONS1 causes of the water quality variations/degradation seemed
to be more usage of nitrogenous and phosphate-rich fertiliz-
ers, discharge of untreated industrial effluents, increasing
PRMS3
PRMS2 waterway transportation which accelerates the oil spills in
MONS3
PRMS1
river/estuary and also the other non-point sources. With the
best uses of Sundarban waters in different aspects such as
fishing, irrigation, ferry service, boating and tourism, some
Fig. 3 NMDS showing the environmental variables recorded in vari- water quality parameters are still well within the permis-
ous stations and seasons (1: pre-monsoon; 2: monsoon; 3: post-mon- sible limits, where it is seemed to be suitable for bathing,
soon)
aquatic biodiversity, fisheries and recreation, etc., accord-
ing to the criterion placed from the various best designated
(loadings) such as pH, WT, salinity, DO, silicate and COD use prescribed by the World Health Organization, US Envi-
were positively correlated, while the attributes viz., turbid- ronmental Protection Agency and Pollution Control Board,
ity, phosphate and nitrate were negatively correlated. Simi- India (Table 5).
lar observations also reported by Sarkar and Bhattacharya
(2010), where they stated that, the factors appear (negative
correlation of nitrate, phosphate and BOD) to be originated Conclusion
from the combined effect from the anthropogenic activities.
Factor 2 explained the 15.88% total variance, and it was The present study reflected the changes in some important
negatively loaded with variables; DO, turbidity and nitrate. hydrological factors round the year which hinted toward the
The causes may be due to gradual increase in water trans- dynamic nature of the estuarine ecosystem due to climate
portation/fishing vessels and agriculture expansions. Like- change and human-induced impacts. Salinity and turbidity
wise, factor 4 represents the 6.68% total variance. The factor showed the maximum annual range of variation followed
1363 Page 8 of 11 Applied Water Science (2021) 11:63
Table 3 Intra-relationship of Variables pH WT Sal DO Tur Phos Nitr Si COD BOD3
environmental variables in
Sundarbans pH 1
WT (°C) 0.15 1
Sal (ppt) − 0.04 0.42** 1
DO (mgl−1) 0.31* 0.55** 0.23 1
Tur (mgl−1) 0.01 0.07 − 0.36* 0.08 1
Phos (mgl−1) − 0.03 − 0.11 − 0.18 − 0.22 0.13 1
Nitr (mgl−1) 0.15 0.03 − 0.01 0.35* 0.24 0.28* 1
Si (mgl−1) 0.21 0.40** 0.17 0.41** 0.06 − 0.05 -0.03 1
COD (mgl−1) 0.12 0.38** 0.39** 0.18 − 0.24 − 0.02 − 0.25 0.31* 1
BOD3 (mgl−1) 0.08 0.16 0.16 − 0.14 − 0.14 − 0.01 − 0.08 − 0.07 0.40** 1
Sal salinity, Tur turbidity, Phos phosphate, Nitr nitrate, Si silicate
*Correlation is significant at the 0.05 level (2-tailed)
**Correlation is significant at the 0.01 level (2-tailed)
Table 4 Factor analysis of the water quality parameters after varimax Factor loadings (axes F1 and F2: 38.51 %)
COD
rotation 0.4
BOD Salinity
Variables F1 F2 F3 F4 0.2
pH 0.2278 − 0.2161 − 0.1467 − 0.1480
0
WT (°C) 0.6762 − 0.1446 − 0.1032 − 0.0195
Temparature
F2 (15.88 %)
Salinity (ppt) 0.7200 0.2571 0.5586 0.3216 -0.2 Phosphate Silicate
DO (mgl−1) 0.6617 − 0.5841 − 0.2197 0.1836 pH
Turbidity (mgl−1) − 0.1716 − 0.3797 − 0.1834 − 0.0815 -0.4 Turbidity
Phosphate (mgl−1) − 0.2117 − 0.1346 0.1579 − 0.3197
-0.6
Nitrate (mgl−1) − 0.0216 − 0.8382 0.4983 − 0.2208 DO
Silicate (mgl−1) 0.4702 − 0.1529 − 0.2742 − 0.0090 -0.8
COD (mgl−1) 0.6732 0.3670 − 0.0626 − 0.4624 Nitrate
BOD3 (mgl−1) 0.2128 0.2824 0.1310 − 0.3691 -1
-1 -0.8 -0.6 -0.4 -0.2 0 0.2 0.4 0.6 0.8
Variability (%) 22.6281 15.8826 8.0111 6.6847
F1 (22.63 %)
Cumulative (%) 22.6281 38.5107 46.5218 53.2065
Bold values indicating the highest loading for the variables Fig. 5 Factor loading of water quality parameters after varimax rota-
tion
Scree plot
2.5 100
by dissolved oxygen in the present study. Other parameters
Cumulave variability (%)
2 80
did not show any significant annual range of variation in
the present study, though phosphate and COD values were
Eigenvalue
1.5 60
higher in post-monsoon and pre-monsoon seasons, respec-
1 40
tively. As there were no significant industrial activities in
the near vicinity; therefore, the higher COD might be due
0.5 20 to the presence of mangroves at sampling sites. Water vari-
ables such as dissolved oxygen, water temperature, salinity,
0 0 turbidity and nitrate were the effective factors influencing
F1 F2 F3 F4 F5 F6 F7
their variables in the creeks, which was evident from factor
axis
analysis. The higher magnitude of COD in this study doesn’t
seem to indicate pollution in the study area. Higher turbidity
Fig. 4 Scree plot of the factor analysis after varimax rotation
seemed to be due to monsoonal runoff and ferrying activities
in the creeks. Long-term monitoring approach is required
to look for time-scale changes to comprehend the climatic
emergencies and anthropogenic stress. Also, studies on
13Applied Water Science (2021) 11:63 Page 9 of 11 63
Table 5 Water quality standards Water variables BIS CPCB EPA Present study
for aquatic biodiversity
propagation pH 6.5–8.5 6.5–8.5 6–8.5 7.50–7.67
DO (mgl−1) 4.0 5.0 or 60% saturation value, > 5.5 4.69–5.97
whichever is higher
Phosphate (mgl−1) 0.1 – – 2.64–4.0
BOD3 (mgl−1) – < 3 (20 °C for 5 days) – 1.81–2.20
COD (mgl−1) – < 10 (Outdoor bathing) 17–23.93
Turbidity (NTU) 10 30 < 50 36.93–65
Free ammonia (as N) – 1.2 or less – –
BIS Bureau of Indian Standards, CPCB Central Pollution Control Board, India, EPA US Environmental
Protection Agency
anthropogenic interferences such as pollution, coastal devel- Open Access This article is licensed under a Creative Commons Attri-
opment, destructive fishing, ferrying, overexploitation, etc., bution 4.0 International License, which permits use, sharing, adapta-
tion, distribution and reproduction in any medium or format, as long
resulted in unique information that may provide mitigating as you give appropriate credit to the original author(s) and the source,
measures to conserve biodiversity. Water quality criteria for provide a link to the Creative Commons licence, and indicate if changes
wildlife propagation and fisheries need to be addressed for were made. The images or other third party material in this article are
the sustenance of endemic biota inhabiting in the Sundarban included in the article’s Creative Commons licence, unless indicated
otherwise in a credit line to the material. If material is not included in
Biosphere Reserve, which is also opined by many previ- the article’s Creative Commons licence and your intended use is not
ous workers. Although the creek waters (Sundarbans) are permitted by statutory regulation or exceeds the permitted use, you will
impacted by various human-induced activities (such as fish- need to obtain permission directly from the copyright holder. To view a
ing, irrigation, ferry service, boating and tourism), some copy of this licence, visit http://creativecommons.org/licenses/by/4.0/.
water quality parameters are still well within the permissible
limits, where it is suitable for bathing, aquatic biodiversity,
fisheries and recreation purpose. References
Acknowledgements The authors are grateful to the Director, School APHA (2005) In: Rice EW, Baird RB, Eaton AD, Clesceri LS (eds)
of Environmental Studies, Jadavpur University, Kolkata -700032, India Standard methods for the examination of water and Wastewater,
for laboratory support to carry out the research work. The authors also 21st edn. American Public Health Association (APHA), Ameri-
acknowledge Mr. K. Lohith Kumar, Scientist, ICAR-Central Inland can Water Works Association (AWWA) and Water Environment
Fisheries Research Institute, Kolkata for the preparation of the map Federation (WEF), Washington, DC, USA
citing the sampling stations. Ansari KGMT, Bhadury P (2017) Occurrence of epibionts associated
with meiofaunal basibionts from the world’s largest mangrove
Author contributions SB: conceptualization, sample collection, inter- ecosystem, the Sundarbans. Mar Biodivers 47(2):539–548
pretation of data, and manuscript preparation. PG: statistical analysis, Arumugum S, Sigamani S, Samikannu M, Perumal M (2016) Assem-
interpretant of data, and manuscript preparation. SB: guidance, review blages of phytoplankton diversity in diferent zonation of Muthupet
and manuscript corrections. SD: statistical analysis, and manuscript mangroves. Reg Stud Mar Sci 3:234–241
preparation. SKD: manuscript preparation and corrections. Bagchi KG (1972) The Bhagirathi–Hooghly Basin. Calcutta Univer-
sity Publication, Calcutta
Barakat A, Baghdadia ME, Raisa J, Aghezzafb B, Slassib M (2016)
Funding No financial support received from any organization, as the
Assessment of spatial and seasonal water quality variation of
work was under a part of Ph.D. research work.
Oum Er Rbia River (Morocco) using multivariate statistical
techniques. Int Soil Water Conserv Res 4:284–292
Declarations Barletta M, Lima AR, Costa MF (2019) Distribution, sources and
consequences of nutrients, persistent organic pollutants, met-
Conflict of interest The authors declare that they have no known com- als and microplastics in South American estuaries. Sci Total
peting financial interests or personal relationships that could have ap- Environ 651:1199–1218. https://d oi.o rg/1 0.1 016/j.s citot env.
peared to influence the work reported in this manuscript. 2018.09.276
Bhattacharya BD, Hwang JS, Sarkar SK, Rakhsit D, Murugan K, Tseng
Ethical approval The authors declare that they have strictly followed LC (2015) Community structure of mesozooplankton in coastal
all the rules and principles of ethical and professional conduct while waters of Sundarban mangrove wetland, India: a multivariate
completing the research work. No specific permission was required approach. J Mar Sys 141:112–121
to collect the water samples at the study sites. Under this research no Bostanmaneshrad F, Partani S, Noori R, Hans-Peter N, Berndtsson
involvement of human and/ or animals. R, Adamowski JF (2018) Relationship between water quality
and macro-scale parameters (land use, erosion, geology, and
population density) in the Siminehrood River Basin. Sci Total
Environ 639:1588–1600
1363 Page 10 of 11 Applied Water Science (2021) 11:63
Brzezinski MA (1958) The Si:C:N ratio of marine diatoms: inter- use change and climate change on hydrology and water quality:
specific variability and the effect of some environmental vari- an application to the Trail Creek Watershed Indiana. Sci Total
ables. J Phycol 2:347–357 Environ 553:149–163
Chakraborti P (1995) Evolutionary history of the coastal quaternar- López-Lópezn JA, Mendiguchían C, García-Vargasn M, Morenon C
ies of the Bengal plain India. Proc INSA 61:343–354 (2014) Multi-way analysis for decadal pollution trends assess-
Chang H (2008) Spatial analysis of water quality trends in the Han ment: the Guadalquivir River estuary as a case study. Chemos-
River basin, South Korea. Water Res 42:3285–3304 phere 111:47–54
Chaudhuri K, Manna S, Sarma SK, Naskar P, Bhattacharyya S, Bhat- Majumdar RK, Mukherjee AL, Roy NG, Sarkar K, Das S (2002)
tacharyya M (2012) Physicochemical factors controlling water Groundwater studies on south Sagar Island region, South 24-Par-
column metabolism in Sundarban estuary India. Aquat Biosyst ganas, West Bengal. In: Proceedings of the International Confer-
8:26 ence on Water Related Disasters, New Age International Publish-
Chimwanza B, Mumba PP, Moyo BHZ, Kadewa W (2014) The ers, Calcutta, India, pp 175–183
impact of farming on river banks on water quality of the rivers. Mallin MA, Lewitus AJ (2004) The importance of tidal creek ecosys-
Int J Environ Sci Technol 2(4):353–358 tems. J Exp Mar Biol Ecol 2(298):145–149
Choudhury A, Bhadury P (2015) Relationship between N:P:Si ratio Manna S, Chaudhuri K, Bhattacharyya S, Bhattacharyya M (2010)
and phytoplankton community composition in a tropical estua- Dynamics of Sundarban estuarine ecosystem: eutrophication
rine mangrove ecosystem. Biogeosciences 12:2307–2355 induced threat to mangroves. Saline Syst 6:8
Das GK (2012) Impact of water quality on the changing environmen- Mitra A, Gangopadhyay A, Dube A, Schmidt ACK, Banerjee K (2009)
tal scenario of Sunderbans. Reason 11:57–66 Observed changes in water mass properties in the Indian Sunda-
Debels P, Figueroa R, Urrutia R, Barra R, Niell X (2005) Evalua- rbans (northwestern Bay of Bengal) during 1980–2007. Curr Sci
tion of water quality in the Chillán River (Central Chile) using 97:1145–1152
physicochemical parameters and a modified water quality index. Mondal I, Bandyopadhyay J, Dhara S (2017) Detecting shoreline
Environ Monit Assess 110(1–3):301–322 changing trends using principle component analysis in Sagar
Forina M, Armanino C, Raggio V (2002) Clustering with dendro- Island, West Bengal India. Spatial Inform Res 25(1):67–73
grams on interpretation variables. Anal Chim Acta 454:13–19 Murugan A, Ayyakkannu K (1991) Ecology of uppanar backwa-
Ghahremanzadeh H, Noori R, Baghvand A, Nasrabadi T (2018) ters, Cuddalore: 1 physico–chemical parameters. Mahasagar
Evaluating the main sources of groundwater pollution in the 24(1):31–38
southern Tehran aquifer using principal component factor analy- Noori R, Sabahi MS, Karbassi AR, Baghvand A, Taati Zadeh H
sis. Environ Geochem Health 40:1317–1328 (2010) Multivariate statistical analysis of surface water quality
Gogoi P, Sinha A, Das Sarkar S, Chanu TN, Yadav AK, Koushlesh based on correlations and variations in the data set. Desalination
SK, Borah S, Das SK, Das BK (2019) Seasonal influence of 260:129–136
physico-chemical parameters on phytoplankton diversity and Noori R, Karbassi AR, Ashrafi Kh, Ardestani M, Mehrdadi N (2011)
assemblage pattern in Kailash Khal, a tropical wetland, Sunda- Development and application of reduced-order neural network
rbans India. Appl Water Sci 9:156 model based on proper orthogonal decomposition for BOD5
Gogoi P, Das SK, Das Sarkar S, Chanu TN, Manna RK, Sengupta A, monitoring: active and online prediction. Environ Progress Sus-
Raman RK, Samanta S, Das BK (2020) Environmental factors tain Energy. https://doi.org/10.1002/ep.10611
driving phytoplankton assemblage pattern and diversity: insights Noori R, Karbassi A, Khakpour A, Shahbazbegian M, Khalf Badam
from Sundarban eco-region. Ecohydrol Hydrobiol. https://d oi.o rg/ HM, Vesali-Naseh M (2012) Chemometric analysis of surface
10.1016/j.ecohyd.2020.09.005 water quality data: case study of the Gorganrud River Basin
Gopal B, Chauhan M (2006) Biodiversity and its conservation in the Iran. Environ Model Assess 17:411–420
Sundarban mangrove ecosystem. Aquat Sci 68(3):338–354 Noori R, Safavi S, Nateghi Shahrokni SA (2013) A reduced-order
Hazra S, Ghosh T, Dasgupta R, Sen G (2002) Sea level and associated adaptive neuro-fuzzy inference system model as a software sen-
changes in the Sundarbans. Sci Cult 68(9–12):309–321 sor for rapid estimation of five-day biochemical oxygen demand.
Helena B, Pardo R, Vega M, Barrado E, Fernandez JM, Fernandez J Hydrol 495:175–185
L (2000) Temporal evolution of groundwater composition in an Osibanjo O, Daso AP, Gbadebo AM (2011) Gbadebo AM (2011) The
alluvial aquifer (Pisuerga River, Spain) by principal component impact of industries on surface water quality of River Ona and
analysis. Water Res 34:807–816 River Alaro in Oluyole Industrial Estate, Ibadan Nigeria. Afr J
Hernández-Romero AH, Tovilla-Hernández C, Malo EA, Bello- Biotechnol 10(4):696–702
Mendoza R. (2004) Water quality and presence of pesticides in Otto M (1998) Multivariate methods. In: Kellner R, Mermet JM,
a tropical coastal wetland in southern Mexico. Mar Pollut Bull Otto M, Widmer HM (eds) Analytical chemistry. Wiley-VCH,
48(11–12):1130–1141 Weinheim, p 916
Karuppasamy PK, Perumal P (2000) Biodiversity of zooplankton in Paul AK, Bhandyopadhay MK (1987) Morphology of Sagar Island,
Pichavaram mangroves, South India. Adv Biosci 19:23–32 a part of Ganga delta. J Geol Soc India 29:412–423
Khan MYA, Gani KM, Chakrapani GJ (2016) Assessment of surface Rahaman SMB, Golder J, Rahaman MS, Hasanuzzaman AFM, Huq
water quality and its spatial variation. A case study of Ramganga KA, Begum S, Islam SS, Bir J (2013) Spatial and temporal
River, Ganga Basin India. Arab J Geosci 9(1):1–9 variations in phytoplankton abundance and species diversity
Kumar M, Ramanathan A, Rao MS, Kumar B (2006) Identification in the Sundarbans mangrove forest of Bangladesh. J Mar Sci
and evaluation of hydrogeochemical processes in the groundwater Res Dev 3(2):1–9
environment of Delhi India. Environ Geol 50:1025–1039 Rahaman SMB, Rahaman MS, Ghosh AK, Gain D, Biswas SK,
Kumarasamy P, James RA, Dahms HU, Byeon CW, Ramesh R (2014) Sarder L, Islam SS, Sayeed AB (2015) A spatial and seasonal
Multivariate water quality assessment from the Tamiraparani river pattern of water quality in the Sundarbans river systems of
basin Southern India. Environ Earth Sci 71(5):2441–2451 Bangladesh. J Coast Res. https://doi.org/10.2112/jcoastres-D-
Levinton JS (2001) Marine biology. Oxford Univer Press, New York, 13-00115.1 (Coconut Creek (Florida), ISSN 0749-0208)
p 560 Rajasegar M (2003) Physico–chemical characteristics of the Vellar
Liu Y, Theller LO, Pijanowski BC, Engel BA (2016) Optimal selection estuary in relation to shrimp farming. J Environ Biol 24:95–101
and placement of green infrastructure to reduce impacts of land
13Applied Water Science (2021) 11:63 Page 11 of 11 63
Rakshit D, Sarkar SK, Bhattacharya BD, Jonathan MP, Biswas JK, Simeonova P, Simeonov V, Andreev G (2003) Water quality study of
Mondal P, Mitra S (2015) Human-induced ecological changes the Struma River Basin, Bulgaria. Cent Eur J Chem 2:121–136
in western part of Indian Sundarban Megadelta: a threat to eco- Singh KP, Malik A, Mohan D, Sinha S (2004) Multivariate statistical
system stability. Maine Pollut Bull 99:186–194 techniques for the evaluation of spatial and temporal variations
Ramakrishnan R, Perumal P, Santhanam P (1999) Spatio-temporal in water quality of Gomti river (India)—a case study. Water Res
variations of hydrographical features in the Pichavaram man- 38:3980–3992
groves and Mohi aqua farm, Southeast coast of India. In: Pro- Sreelekshmi S, Nandan SB, Kaimal SV, Radhakrishnan CK, Suresh
ceeding of international seminar on application with hydrogeo- VR (2020) Mangrove species diversity, stand structure and
chemistry. Annamalai University, Dept. of Geology, Annamalai zonation pattern in relation to environmental factors—A case
University, Annamalai Nagar, Tamil Nadu, India, pp 197–203 study at Sundarban delta, east coast of India. Reg Stud Mar Sci
Redfield AC (1958) The biological control of the chemical factors in 1:35:101111
the environment. Am Sci 46:205–222 Vajravelu M, Martin Y, Ayyappan S, Mayakrishnan M (2018) Seasonal
Reghunath R, Murthy TR, Raghavan BR (2002) The utility of mul- influence of physico-chemical parameters on phytoplankton diver-
tivariate statistical techniques in hydro geochemical studies: an sity, community structure and abundance at Parangipettai coastal
example from Karnataka, India. Water Res 36:2437–2442 waters, Bay of Bengal, South East Coast of India. Oceanologia.
Saliu JK, Ekpo MP (2006) Preliminary chemical and biological https://doi.org/10.1016/j.oceano.2017.08.003
assessment of Ogbe Creek, Lagos, Nigeria, West Africa. App Vega M, Pardo R, Barrado E, Deban L (1998) Assessment of seasonal
Ecol 9:12 and polluting effects on the quality of river water by exploratory
Saravanakumar A, Rajkumar M, Thivakaran GA, Serebiah J (2008) data analysis. Water Res 32(12):3581–3592
Abundance and seasonal variations of phytoplankton in the Vernberg FJ, Vernberg WB (2001) The Coastal Zone. University of
creek waters of western mangrove of Kachchh-Gujarat. J Envi- South Carolina Press, Columbia, p 191
ron Biol 29(2):271–274 Wang XL, Lu YL, Han JY, He GZ, Wang TY (2007) Identification
Sarkar SK and Bhattacharya BD (2010) Water quality analysis of the of anthropogenic influence on water quality of rivers in Taihu
coastal regions of Sundarban Mangrove Wetland, India using watershed. J Environ Sci 19:475–481
multivariate statistical techniques. In: Sarkar SK (ed) Environ- Wang X, Cai Q, Ye L, Qu X (2012) Evaluation of spatial and temporal
mental management, p 258. ISBN 978–953-307-133-6 variation in stream water by multivariate statistical techniques: a
Sarkar SK, Singh BN, Choudhury A (1986) Compositions and case study of the Xiangxi River basin China. Q Int 1:1–8
variations in the abundance of zooplankton in the Hooghly Wang YB, Liu CW, Liao PY, Lee JJ (2014) Spatial pattern assess-
estuary, West Bengal India. Proc Indian Acad Sci (Anim Sci) ment of river water quality: Implications of reducing the number
95(2):125–134 of monitoring stations and chemical parameters. Environ Monit
Satpathy KK, Sahu G, Mohanty AK, Prasad MVR, Panigrahi RC Assess 186(3):1781–1792
(2009) Phytoplankton community structure and its variabil- Willet P (1987) Similarity and clustering in chemical information sys-
ity during southeast monsoon transition in the coastal waters tems. Research Studies Press Wiley, New York
of Kalpakkam, East Coast of India. Int J Oceans Oceanogr Wunderlin DA, Diaz MP, Ame MV, Pesce SF, Hued AC, Bistoni MA
3(1):43–74 (2001) Pattern recognition techniques for the evaluation of spatial
Şener Ş, Şener E, Davraz A (2017) Evaluation of water quality using and temporal variations in water quality. A case study: Suquia
water quality index (WQI) method and GIS in Aksu River (SW- river basin (Cordoba, Argentina). Water Res 35:2881–2894
Turkey). Sci Total Environ 584–585(131–662):144 Zhao J, Fu G, Lei K, Li Y (2011) Multivariate analysis of surface water
Sharma S (1996) Applied multivariate techniques. Wiley, New York quality in the Three Gorges area of China and implications for
Sharma M, Kansal A, Jain S, Sharma P (2015) Application of multi- water management. J Environ Sci 23(9):1460–1471
variate statistical techniques in determining the spatial temporal
water quality variation of Ganga and Yamuna Rivers present in Publisher’s Note Springer Nature remains neutral with regard to
Uttarakhand State, India. Water Qual Expo Health 7(4):567–581 jurisdictional claims in published maps and institutional affiliations.
Shrestha S, Kazama F (2007) Assessment of surface water quality
using multivariate statistical techniques: a case study of the Fuji
river basin Japan. Environ Modell Softw 22(4):464–475
13You can also read