Public Knowledge of Monarchs and Support for Butterfly Conservation - MDPI
←
→
Page content transcription
If your browser does not render page correctly, please read the page content below
sustainability

Article
Public Knowledge of Monarchs and Support for
Butterfly Conservation
Jerrod Penn 1     ID
                       , Hannah Penn 2, *    ID
                                                  and Wuyang Hu 3
 1    Department of Agricultural Economics and Agribusiness, Louisiana State University and AgCenter,
      Baton Rouge, LA 70803, USA; jpenn@agcenter.lsu.edu
 2    Department of Entomology, Louisiana State University and AgCenter, Baton Rouge, LA 70803, USA
 3    Department of Agricultural Environmental and Economics, The Ohio State University, Columbus, OH 43210,
      USA; hu.1851@osu.edu
 *    Correspondence: hpenn@agcenter.lsu.edu; Tel.: +1-225-578-1595

 Received: 8 February 2018; Accepted: 11 March 2018; Published: 14 March 2018

 Abstract: Pollinator populations in North America are in decline, including the iconic monarch
 butterfly. In order to determine if public knowledge of monarchs informs opinions on butterfly
 conservation, we surveyed the public to assess their knowledge of monarchs. We also asked
 participants about their attitudes towards general butterfly conservation and if they believe that
 butterfly gardens contribute to conservation. Respondents generally had some knowledge of
 monarchs but were unaware of monarch population declines and the necessity of milkweed to
 their life cycle. Respondent knowledge was correlated with more positive attitudes about butterfly
 conservation. Furthermore, membership in an environmental organization increased the likelihood
 that the participant had prior knowledge of monarchs and cared about monarch conservation.
 Respondent socioeconomic factors of age and sex were also significantly correlated with conservation
 attitudes—older and female participants had more positive attitudes towards general butterfly
 conservation. Interestingly, females were also less likely than males to admit having prior knowledge
 of monarchs, indicating that gender may also play an important role in conservation outreach
 efforts. Our study indicates that educational efforts need to be directed more toward individuals
 not already associated with an environmental organization as these individuals are predisposed to
 regard conservation positively.

 Keywords: attitudes; insect identification; milkweed; monarch; outreach; viceroy

1. Introduction
     Social norms play an integral role in actualizing conservation programs and environmental
policies since perceived social norms can alter individuals’ conservation decisions. Both Milfont [1]
and Primmer and Karppinen [2] showed that perceived norms can impact forester conservation
decisions. Similarly, Van Dijk et al. [3] found that farmers consider social expectations when planning
conservation management strategies. Social norms and subsequent public opinions can sway the
enforcement and funding of conservation-oriented policies through financial appropriations and voting
trends [4–6]. For instance, Endangered Species Act policies in the United States [7,8] are more likely to
be successful with buy-in from the general public and stakeholders [9–12]. However, general apathy
towards conservation, low levels of education on conservation issues, and negative associations with
pro-environmental groups have been implicated as potential roadblocks for public and stakeholder
support of ESA policies [13–15].
     Education or exposure to different values may be an effective way to change the public’s
opinion on conservation ideas [12,16–19] as attitudes can be based partially on social expectations
and narratives [20–22]. For instance, during interviews with immigrant women in Los Angeles,

Sustainability 2018, 10, 807; doi:10.3390/su10030807                      www.mdpi.com/journal/sustainability
Sustainability 2018, 10, 807                                                                       2 of 16

Lassister and Wolch [23] found that many times the participants’ opinions of marine animal welfare
changed after exposure to US norms on animal welfare and treatment. Public outreach efforts,
particularly those with hands-on experience, have been particularly useful in this vein [24–28].
García-Cegarra and Pacheco [28] found that whale-watching tour participants stated being more
likely to care about marine conservation after taking the tour, and a survey of insect zoo attendees
revealed that respondents felt more favorably towards insects after visiting and physically interacting
with insects [29]. Furthermore, Suh and Samways [30] show that the public was generally ignorant of
the insects rather than “not interested” in their preservation.
       The influence of public opinion and policy support is particularly critical for invertebrate
(i.e., insects, spiders, etc.) conservation. However, public support for insect communities is generally
lacking despite an estimated $4.5 billion in economic benefits provided to North America
annually [31,32]. Surveys of the Connecticut public and children, revealed a general dislike of
insects [16,33]. Additionally, when looking at the valuation placed on invertebrates versus birds,
mammals, and even reptiles and fish, invertebrates have been consistently the lowest rated in terms
of monetary support for conservation [20,34]. One invertebrate of note is the monarch butterfly
(Danaus plexippus L. (Lepidoptera: Nymphalidae)) since it is often used as a teaching device in schools
and outreach events due to its iconic orange color and its annual trek across North America [35,36].
Due to this migration, the vast majority of the United States public has the opportunity to interact with
this species at some point during the year. However, due to over-wintering site habitat loss as well
as the loss and contamination of food resources (milkweed) and habitat in its summer range [37–40],
the decline of monarch populations has been of increasing concern [41–43]. Concerns over monarch
decline have caused the US Fish and Wildlife to undertake an effort to evaluate its threatened status in
accordance with the Endangered Species Act [44–46] in addition to private efforts to conserve and create
suitable habitat [47,48]. Current recommendations for monarch conservation include the transition of
marginal agricultural lands into milkweed plantings, particularly in the northcentral and southern
regions of the US including Kentucky where our survey was conducted [49–51]. However, a large
amount of stakeholder participation is required, which may require more targeted educational efforts.
       Given the overall charisma of monarchs [52] and efforts to change the conservation status
of monarchs [53], we aimed to determine if the general public’s views on butterfly conservation
generally were informed by prior knowledge of monarchs [54,55]. Specifically, we wanted to determine
(1) if prior knowledge of monarchs (i.e., appearance, required food sources, and potential decline)
affects monarch conservation attitudes. Additionally, we wanted to find the impacts of (2) participation
in environmental or garden organizations and (3) socioeconomic factors on both prior knowledge
of monarchs and corresponding conservation attitudes. We expected that greater levels of prior
knowledge would increase the likelihood of positive attitudes towards butterfly conservation.
Furthermore, we expected that participation in environmental and garden organizations would
increase both the likelihood of prior knowledge and positive attitudes towards conservation but that
environmental organizations would have a greater relative impact compared to gardening groups.
Finally, we anticipated that socioeconomic variables would influence participation in environmental
or gardening groups, prior knowledge of monarchs, and attitudes towards conservation since data
have shown similar trends [56]. The outcomes of our study will inform future education and public
outreach needs in order to increase the public’s desire for monarch and general insect conservation [57],
particularly at a local scale where prior studies have indicated the greatest need [54].

2. Materials and Methods
     Our main objectives were achieved through a public survey. The study and survey
received approval from the Institutional Review Board from the University of Kentucky
(Protocol No. 16-0316-X4B), and each respondent acknowledged the terms of participation prior to
beginning the survey. We conducted a survey of the public in the Commonwealth of Kentucky over
51 days from 9 May to 22 July 2016 in Fayette County, Kentucky public parks with the approval of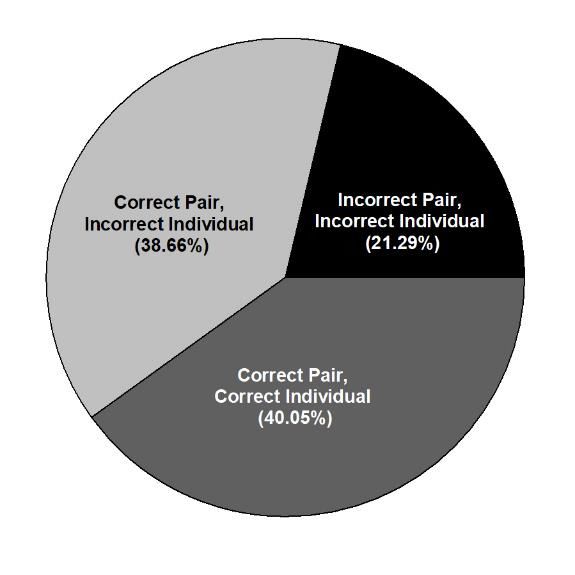
Sustainability 2018, 10, 807                                                                      3 of 16

the University of Kentucky and park managers. Prior to the survey, the questionnaire went through
four rounds of focus groups. Each focus group consisted of 5–8 individuals recruited from the
University of Kentucky listservs where participants were given the current rendition of the survey
and allowed to ask questions and make comments on the clarity and neutrality of the questions.
Following focus groups, one pilot study was performed at the UK Arboretum (50 responses) to ensure
the accuracy of the information and clarify the content. For the finalized survey, a total of 34 public
parks and events were visited at various times throughout the day (approximately 8 a.m.–11 a.m.,
3 p.m.–5 p.m., and 6 p.m.–9 p.m.) with some parks sampled repeatedly for special events such as
movie nights, outdoor concerts, and sporting events. Although we conducted our survey in and
around public parks, we also selected many of these events as being unrelated to conservation in
order to reduce potential sampling bias. While on site, potential respondents (any individual passing
by) over the age of 18 were able to approach the survey station or were approached by a moderator
about taking the survey advertised as related to parks in order to avoid biasing the sample towards
only pro-environmental participants [58]. Among observable characteristics, the sample contains
a greater proportion of respondents with children and a smaller proportion of more senior respondents
compared to the population. While it is difficult to understand the potential direction of the bias
in this specific analysis, a meta-analysis by Wiernik et al. [59] showed that age had no effect on
environmental awareness or knowledge, and, more broadly, either no or negligible effects across
a range of environmental sustainability variables, environmental awareness or knowledge. Although
Dupont et al. find that willingness to pay for environmental improvements significantly increases
with the presence of children [60], Torgler et al. find no evidence of having children on a range of
environmental attitudes [61]. Of course, differences caused by demographic characteristics or other
unobservable characteristics of the sample may still affect the results.
     Respondents were then given an online survey with an estimated completion time of 10 min
on a tablet device through the platform provided by the research firm Qualtrics (Provo, UT, USA).
To single out the effect on conservation attitudes associated with monarchs being a flagship species in
addition to its charismatic appearance, each respondent was randomly assigned to a survey about
either monarch or viceroy butterflies, a non-threatened, monarch doppelganger (Limenitis archippus L.
(Lepidoptera: Nymphalidae)) [62]. The two versions of the survey are identical except for a brief
excerpt at the beginning of the survey, each with 40 questions (combination of True-False, multiple
choice, and Likert-style). To ensure that respondents were relatively informed, a short excerpt about
the corresponding butterfly’s food resources and their native range was given followed by three
True-False questions about that excerpt. Respondents in the monarch version were also informed that
the monarch was under review for the US list of endangered or threatened species as well as its sole
reliance on milkweed plants during its larval stage.
     The remaining survey questions pertained to prior knowledge of monarchs (stated overall
knowledge, food requirements, population decline, and identification), participation in environmental
or gardening organizations, prior donations to environmental organizations, extent of outdoor activity,
sociodemographic, and attitudes towards butterfly conservation and the use of butterfly gardens
for conservation. To quantify each participant’s ability to identify a monarch, each respondent was
asked to identify a monarch butterfly in two steps. First, they were presented with four sets of
paired, similar-looking butterflies (Figure 1A) and asked which set contained the monarch. If they
identified the correct pair, they were asked to identify which of the pair was a monarch (Figure 1B),
again followed by a question regarding their certainty. In addition, the following Likert questions were
asked to estimate prior knowledge:

       “Have you ever heard or read about monarch/viceroy butterflies prior to this survey?
       How much did you know about the decline in monarch populations prior to this survey?
       How much did you know about the importance of milkweeds to monarch prior to this
       survey? How important is it to you to help conserve butterfly species? How much do you
       believe that installing butterfly plants can actually help butterfly conservation?”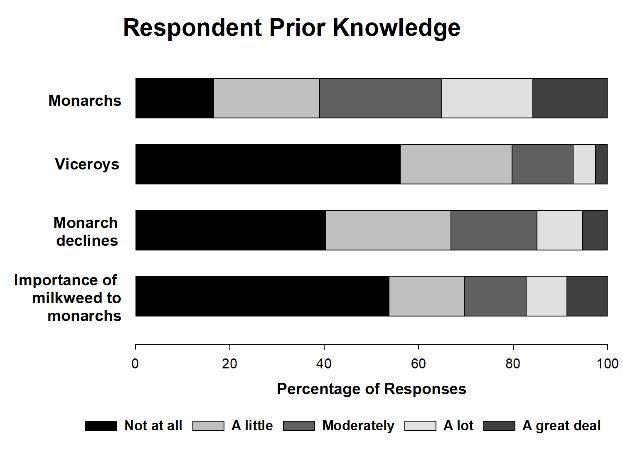
Sustainability 2018, 10, 807 4 of 16
Sustainability 2018, 10, x FOR PEER REVIEW 4 of 15
Figure 1. Butterfly
Figure 1. Butterfly identification images used in two steps for (A) identification
identification of the pair
pair with
with the
the
monarch
monarch and
and viceroy
viceroy and
and (B)
(B) identification
identification of
ofmonarch.
monarch.
Respondentscould
Respondents couldchoose
chooseone
oneofof five
five answers
answers to each
to each of the
of the questions
questions fromfrom
“not “not
at all”attoall” to “a
“a great
great deal,” with the exception of butterfly gardens, which used a slightly different scale (five
deal,” with the exception of butterfly gardens, which used a slightly different scale (five answers answers
ranging from
ranging from “not
“not important”
important” to
to “very
“very important”).
important”). InIn total,
total, 789
789 participants
participants (Table 1) completed
(Table 1) completed the the
full survey and were included in the dataset for statistical analyses.
full survey and were included in the dataset for statistical analyses.
Table 1.
Table 1. Socioeconomic
Socioeconomic composition
composition of
of sample
sample versus
versus population
populationestimates
estimates(N
(N== 789).
789).
Variable Sample Lexington-Fayette County 1
Variable Male Sample
44.5% Lexington-Fayette
49.0% County 1
MaleFemale 55.5%
44.5% 51.0%49.0%
MedianFemale
Age (18 and above) 55.5%
39.5 * 42 * 51.0%
Median Age (18 andAgeabove) 39.5 * 42 *
Age 18–24 17.1% 18.2%
18–2425–34 27.4%
17.1% 19.5%18.2%
25–3435–44 27.4%
23.7% 17.2%19.5%
35–4445–54 23.7%
15.2% 15.2%17.2%
45–5455–64 15.2%
11.4% 14.4%15.2%
55–64 65+ 11.4%
5.1% 15.3%14.4%
65+ 5.1% 15.3%
Education
Education
High school or less 21.9% 30.4%
High
Someschool
collegeoror
less
Associate’s 21.9%
25.6% 28.1%30.4%
Some college or Associate’s 25.6% 28.1%
Bachelor’s 27.5% 22.6%
Bachelor’s 27.5% 22.6%
Graduate or Professional 25.0% 18.9%
Graduate or Professional 25.0% 18.9%
Median
Median IncomeIncome $42,500
$42,500 ** $51,948
$51,948
White White 71.4%
71.4% 75.9%75.9%
BlackBlack or African
or African American
American 14.3%
14.3% 14.4%14.4%
Asian Asian 3.2% 3.5% 3.5%
OtherOther
or Multiple RacesRaces
or Multiple 7.1% 6.2% 6.2%
MinorMinor
child child
at home
at home 46.7% 27.2%27.2%
Single, nevernever
Single, married
married 33.1%
33.1% 37.9%37.9%
MarriedMarried 52.9%
52.9% 43.1%43.1%
1 Based on
onthe
the2015
2015American
AmericanCommunity
Community Survey
Survey 1-year
1-year estimates;
estimates; **Calculated
Calculatedusing
usingcorresponding
corresponding
1 Based
category mid-point.
category mid-point.
In order to answer our three questions, the following variables were used as the dependent
variables in separate ordered logistic regressions: monarch knowledge, viceroy knowledge,Sustainability 2018, 10, 807 5 of 16
In order to answer our three questions, the following variables were used as the dependent
variables in separate ordered logistic regressions: monarch knowledge, viceroy knowledge, knowledge
of monarch declines, knowledge of milkweed importance, ability to identify a monarch, and willingness
to conserve butterflies. All models included age, sex, education, income, household with children,
race, outdoor recreation, member in a garden club, member of an environmental group, and previous
donation to environmental cause as independent variables with the exception of willingness to
conserve which had the added variable of monarch knowledge. Because of incomplete responses to
these independent variables, the sample used to perform regression analysis (which relies on complete
responses) decreases to the results seen in Tables 2 and 3.
All analyses were conducted in Stata 13 (StataCorp LP, College Station, TX, USA) with average
marginal effects (MEs) calculated in the same program. MEs are commonly used in the social
science discipline representing the change of likelihood of survey respondents be in each of the five
possible answer groups (from “not at all” to “a great deal”) following one unit of difference between
them (e.g., male versus female, or one year older) while holding all other factors unchanged [63].
As an example, if the marginal effect for an independent indicator variable (e.g., female = 1)
equals 0.2 for particular level of the dependent variable, this means that the observations with that
characteristic (i.e., being a female) are 20% more likely to have selected that particular level while
holding all other factors unchanged. A marginal effect of −0.05 would indicate observations with that
characteristic are 5% less likely to select that level of the dependent variable. Such marginal effects
can be generated for every level of the dependent variable, and the sum of all marginal effects for
a given independent variable across all levels of the dependent variable must sum to zero. While ME
at every level of the responses is generated in the ordered logit models, for brevity, we interpret ME
only at the lowest (“not at all” or “not important”) and highest (“a great deal” or “very important”)
extremes of the responses for only those variables that were significant or marginally significant in the
corresponding model.Sustainability 2018, 10, 807 6 of 16
Table 2. Marginal effects of statistically significant (*, p < 0.01) and marginally significant (ˆ, p < 0.1) demographic variables on knowledge of monarchs versus viceroys.
Blanks cells indicate non-significance.
Viceroy (n = 691) Monarch (n = 691)
Variable 1-Not At All 2-A Little 3-Moderate 4-A Lot 5-A Great Deal Variable 1-Not At All 2-A Little 3-Moderate 4-A Lot 5-A Great Deal
Age Age
Female * 11.5% −4.0% −4.1% −2.1% −1.2% Female
Some College Some College * −7.4% −5.9% −0.3% 4.7% 8.9%
Bachelor’s ˆ −9.9% 3.2% 3.7% 1.9% 1.1% Bachelor’s * −8.0% −6.5% −0.3% 5.2% 9.5%
Advanced Degree * −16.6% 4.9% 6.3% 3.4% 2.0% Advanced Degree * −9.3% −8.3% −0.9% 6.4% 12.1%
Household Income ($1000) Household Income ($1000)
Minor child Minor child
Black * 14.0% −5.8% −4.8% −2.2% −1.2% Black * 12.0% 6.5% −3.1% −7.1% −8.3%
Asian Asian ˆ 9.6% 4.9% −2.3% −5.5% −6.7%
Hispanic Hispanic
Other Race Other Race
Recreation Recreation
Garden club Garden club ˆ −8.8% −9.3% −3.2% 5.8% 15.5%
Environ. Org.* −27.0% 5.4% 11.3% 6.5% 3.8% Environ. Org. ˆ −4.9% −4.4% −0.4% 3.5% 6.2%
Environ. Donation ˆ −7.1% 2.4% 2.6% 1.3% 0.8% Environ. Donation * −7.8% −7.4% −0.8% 6.0% 10.0%Sustainability 2018, 10, x FOR PEER REVIEW 7 of 15
Sustainability
Table 3.2018, 10, 807 effects of statistically significant (*, p < 0.01) and marginally significant (^, p < 0.1) 7 of 16
Marginal
demographic variables and regression results for all variables on willingness to conserve butterflies.
Blanks cells indicate non-significance for marginal effects.
Table 3. Marginal effects of statistically significant (*, p < 0.01) and marginally significant (ˆ, p < 0.1)
demographic variables and regression resultstofor
Willingness all variables
Conserve on willingness to conserve butterflies.
(n = 691)
Blanks cells indicate non-significance for marginal
Marginal Effects effects. Model Results
Variable 1-Not At All 4-A lot Coef. Std. Err. p-Values
Age * Willingness
−0.2 to Conserve
0.7 (n = 691)
0.037 0.006 0
Female * −2.3 Effects 6.5
Marginal Model0.360
Results 0.148 0.015
Some College
Variable 1-Not At All 4-A lot −0.312
Coef. Std.0.225
Err. 0.166
p-Values
Bachelor’s
Age * −0.2 0.7
−0.044
0.037
0.224
0.006
0.843
0
Advanced
Female *Degree −2.3 6.5 −0.294
0.360 0.249
0.148 0.237
0.015
Household Income ($1000)
Some College −0.027
−0.312 0.017
0.225 0.106
0.166
Bachelor’s
Minor child −0.044
0.149 0.224
0.150 0.843
0.319
Advanced Degree −0.294 0.249 0.237
Black −0.256 0.232 0.27
Household Income ($1000) −0.027 0.017 0.106
Asian
Minor child 0.124
0.149 0.442
0.150 0.779
0.319
Hispanic
Black −0.132
−0.256 0.385
0.232 0.731
0.27
AsianRace
Other 0.124
0.166 0.442
0.296 0.779
0.574
Hispanic
Recreation −0.132
0.038 0.385
0.036 0.731
0.293
Other Race 0.166 0.296 0.574
Garden club
Recreation 0.479
0.038 0.597
0.036 0.422
0.293
Environ. Org. ^
Garden club −2.5 8.8 0.458
0.479 0.246
0.597 0.062
0.422
Environ.
Environ.Donation
Org. ˆ * −2.5−3.5 8.812.8 0.662
0.458 0.181
0.246 0
0.062
Environ. Donation
Monarch Knowledge* * −3.5−2.4 12.86.8 0.662
0.377 0.181
0.063 00
Monarch Knowledge * −2.4 6.8 0.377 0.063 0
3. Results
3. Results
3.1. General Attitudes towards Monarch Conservation
3.1. General Attitudes towards Monarch Conservation
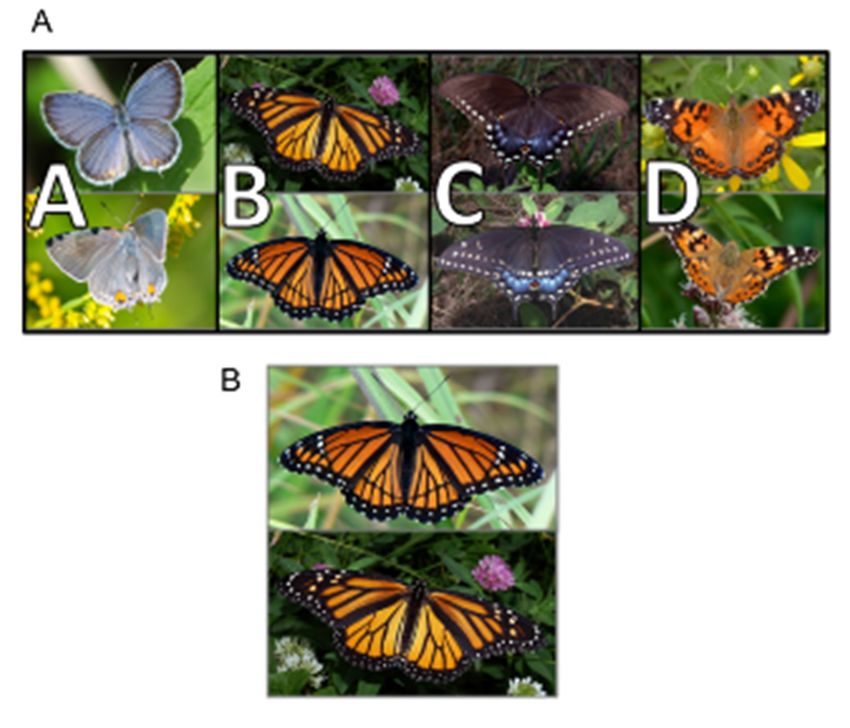
When asked “how important is it to you to help conserve butterfly species,” respondents had
When asked “how important is it to you to help conserve butterfly species,” respondents
mixed responses. Very few thought it was “not important” (6.34%), while the responses among
had mixed responses. Very few thought it was “not important” (6.34%), while the responses
“somewhat important,” “important,” and “very important” were evenly divided (Figure 2), and the
among “somewhat important,” “important,” and “very important” were evenly divided (Figure 2),
remaining 4.56% answered “didn’t know.” This last group is excluded from the logit model. Most
and the remaining 4.56% answered “didn’t know.” This last group is excluded from the logit model.
individuals also thought that butterfly gardens contributed to butterfly conservation, with 54.5%
Most individuals also thought that butterfly gardens contributed to butterfly conservation, with 54.5%
thinking that it was “very important” and 35.2% answering that it was “important.”
thinking that it was “very important” and 35.2% answering that it was “important.”
Percentageofofresponses
Figure2.2. Percentage
Figure responseson
onaaLikert
Likertscale
scaleregarding
regardingparticipant
participantattitudes
attitudeson
onthe
therelative
relative
importance of butterfly gardens to butterfly conservation and how much they value
importance of butterfly gardens to butterfly conservation and how much they value butterfly butterfly
conservationin
conservation ingeneral.
general.
3.2.Prior
3.2. PriorMonarch
MonarchKnowledge
KnowledgeCorrelated
Correlatedwith
withConservation
ConservationAttitudes
Attitudes
Thegeneral
The generalpublic’s
public’sreported
reported knowledge
knowledge about
about either
either monarchs
monarchs or viceroys
or viceroys was was lacking,
lacking, but
but viceroy knowledge more so (Table 2). When asked about overall prior knowledge, 56.08%
viceroy knowledge more so (Table 2). When asked about overall prior knowledge, 56.08% and 16.60% and
16.60% of participants reported not knowing anything about viceroys and monarchs, respectively
of participants reported not knowing anything about viceroys and monarchs, respectively (Figure 3).
(Figure 3). The same trend appears for those who reported knowing “a lot” or “a great deal” aboutSustainability 2018, 10, x FOR PEER REVIEW 8 of 15
Sustainability 2018, 10, 807 8 of 16
The same trend appears for those who reported knowing “a lot” or “a great deal” about viceroys
(4.81% and
viceroys 2.53%,
(4.81% respectively)
and and monarchs
2.53%, respectively) (19.26% (19.26%
and monarchs and 15.84%, respectively).
and 15.84%, When asked
respectively). Whenabout
asked
prior
aboutknowledge of monarch
prior knowledge population
of monarch declines,declines,
population the majority of respondents
the majority did not know
of respondents anything
did not know
(40.25%)
anythingor only knew
(40.25%) or only“aknew
little”“a(26.58%). Respondent
little” (26.58%). prior prior
Respondent knowledge
knowledge of the importance
of the importanceof
milkweeds
of milkweedsas aasfood resource
a food resourceto to
monarchs
monarchs was
wassimilar
similartotothat
thatofofmonarch
monarchdecline.
decline.Again,
Again,the
thevast
vast
majority
majority of
of respondents
respondents did did not
not know
know anything
anything (53.67%)
(53.67%) or or knew
knew “a“a little”
little” (15.95%)
(15.95%) about
about the
the
importance of milkweed (Figure
importance of milkweed (Figure 3). 3).
Figure 3. Percentages of responses on a Likert scale for stated prior knowledge of monarch and viceroy
Figure 3. Percentages
butterflies, of responses
monarch population on a Likert
decline, and thescale for statedofprior
importance knowledge
milkweeds of monarch
as a food resourceand
for
viceroy
monarch butterflies, monarch population decline, and the importance of milkweeds as a food resource
communities.
for monarch communities.
When given the opportunity to identify a monarch/viceroy pair out of a lineup (Figure 4),
When given the opportunity to identify a monarch/viceroy pair out of a lineup (Figure 4), most
most respondents (78.71%) could identify the pair correctly. This proportion is significantly different
respondents (78.71%) could identify the pair correctly. This proportion is significantly different than
than 25% (a random guess of an answer out of the four alternatives) (p < 0.01). Claiming to have prior
25% (a random guess of an answer out of the four alternatives) (p < 0.01). Claiming to have prior
knowledge of monarchs (p < 0.01), in general, increases the likelihood of a correct answer (ME = 7.61%;
knowledge of monarchs (p < 0.01), in general, increases the likelihood of a correct answer (ME = 7.61%;
i.e., 7.61% more likely). However, only 50.89% of respondents who answered the first identification
i.e., 7.61% more likely). However, only 50.89% of respondents who answered the first identification
question correctly could subsequently correctly identify the monarch from the monarch/viceroy pair,
question correctly could subsequently correctly identify the monarch from the monarch/viceroy pair,
(40.05% of entire sample), which was not significantly different (p = 0.75) from null proportion of
(40.05% of entire sample), which was not significantly different (p = 0.75) from null proportion of 50%
50% (corresponding to a random guess by respondents as to which butterfly shown is a monarch).
(corresponding to a random guess by respondents as to which butterfly shown is a monarch). This
This indicates that respondents have a general idea of monarchs’ appearance but are not necessarily
indicates that respondents have a general idea of monarchs’ appearance but are not necessarily able
able to differentiate them from a similar looking species. The only notable predictor of ability to
to differentiate them from a similar looking species. The only notable predictor of ability to correctly
correctly identify a monarch in the second question was stated prior knowledge of monarchs, but only
identify a monarch in the second question was stated prior knowledge of monarchs, but only with
with marginal significance (p = 0.08), and the effect was rather small (ME = 2.88%). Increases in
marginal significance (p = 0.08), and the effect was rather small (ME = 2.88%). Increases in stated prior
stated prior monarch knowledge also highly correlated with increased likelihood of respondents
monarch knowledge also highly correlated with increased likelihood of respondents finding butterfly
finding butterfly conservation “very important” (ME = 6.8%, Table 3) and decreased the likelihood of
conservation “very important” (ME = 6.8%, Table 3) and decreased the likelihood of “not important”
“not important” (ME = −2.4%).
(ME = −2.4%).Sustainability 2018,10,
Sustainability2018, 10,807
x FOR PEER REVIEW 99of
of16
15
Figure 4. Percentage of respondents who were able to identify the monarch/viceroy pair from Figure 1A
and the 4.
Figure monarch fromofthe
Percentage viceroy in Figure
respondents 1B. able to identify the monarch/viceroy pair from Figure
who were
1A and the monarch from the viceroy in Figure 1B.
3.3. Participation in Environmental Organizations Impacts Prior Knowledge and Attitudes
3.3. Participation in Environmental Organizations Impacts Prior Knowledge and Attitudes
Participants that were members of garden clubs (p = 0.01), environmental organizations (p < 0.01),
had previously
Participants donated to an members
that were environmental groupclubs
of garden (p < 0.01)
(p =were
0.01),more likely to haveorganizations
environmental prior knowledge (p <
of monarchs
0.01), and their decline
had previously donated (Table
to an 2).environmental
Such participation group increased
(p < 0.01) thewere
likelihood
morethat theto
likely respondents
have prior
knew “a great
knowledge deal” about
of monarchs and monarchs
their decline and decreased
(Table 2). Such the likelihood that
participation they the
increased know nothingthat
likelihood at
all. The same trend
the respondents knew was“a true
greatfor stated
deal” aboutknowledge
monarchsofand monarch
decreased declines—being
the likelihood part
thatofthey
a garden
know
club or environmental
nothing at all. The sameorganization
trend was true decreased
for statedtheknowledge
chance of reporting
of monarch being “not at all” part
declines—being familiar
of a
(ME
garden= −club
23.49%,or − 15.16%, respectively)
environmental organizationand increased
decreased the the
chance that respondents
chance of reportingknew being“a“notgreatatdeal”
all”
(ME = 10.29%, 4.25%, respectively). Respondents who donated to an
familiar (ME = −23.49%, −15.16%, respectively) and increased the chance that respondents knew “a environmental cause (p < 0.01)
had
greata similar
deal” (ME association
= 10.29%,to4.25%,
knowledge of monarch
respectively). declines (ME
Respondents who“not at all”
donated to=an−environmental
17.68%; ME “a great cause
deal” = 4.33%).
(p < 0.01) Furthermore,
had a similar those
association towho spent more
knowledge time outdoors
of monarch declines for (MErecreation
“not at all” are= also slightly
−17.68%; ME
more likely
“a great to be
deal” aware of
= 4.33%). monarch declines
Furthermore, those who (p = spent
0.02), more
with onetimeadditional
outdoors for dayrecreation
of recreation per
are also
week corresponding
slightly more likely to to be
a smaller
aware of chance
monarch of being not familiar
declines (p = 0.02),(MEwith =− 1.73%)
one and a greater
additional chance of
day of recreation
knowing
per week“a great deal” (ME
corresponding to a=smaller
0.37%).chance of being not familiar (ME = −1.73%) and a greater chance
Prior knowledge
of knowing “a great deal” of (ME
milkweed’s
= 0.37%).importance and ability to identify a monarch was less
straight-forward.
Prior knowledge Beingofanmilkweed’s
environmental organization
importance member
and ability (p < 0.01,a ME
to identify “not atwas
monarch = −straight-
all”less 20.43%,
ME
forward. Being an environmental organization member (p < 0.01, ME “not at all” = −20.43%, <
“a great deal” = 8.64%) or having donated to environmental causes (p ME0.01,
“a
ME
great“not at all”
deal” = −11.47%,
= 8.64%) or havingME donated
“a great deal” = 4.05%) increased
to environmental causes (p the likelihood
< 0.01, ME “not thatatthe
all”respondent
= −11.47%,
knew
ME “aabout
great the importance
deal” of milkweeds
= 4.05%) increased as food resources
the likelihood for monarchs,
that the respondent knew butabout
beingthe a member
importance of
aofgarden club did
milkweeds not impact
as food resources prior
for knowledge
monarchs, but of milkweed
being a member importance (p = 0.12).
of a garden clubThose
did not who did
impact
more
prior outdoor
knowledge recreation had some
of milkweed evidence(pof=milkweed
importance 0.12). Those knowledge
who did (p = 0.06)
more since they
outdoor were less
recreation had
likely
some to answerof“not
evidence at all” (ME
milkweed = −1.5%)
knowledge (p =and more
0.06) since likely
theyto answer
were less “a great
likely to deal”
answer (ME“not= 0.5%).
at all”
Association
(ME = −1.5%) with
andgarden
more(plikely
= 0.43)
to or environmental
answer organizations
“a great deal” (ME = 0.5%).(p = 0.53), having made
Association a donation
with garden (p =
to an environmental
0.43) or environmental cause (p = 0.93), or
organizations (p having
= 0.53), prior
having knowledge of viceroys
made a donation to an(p environmental
= 0.27) did not cause have
a(psignificant
= 0.93), orimpact
havingon the ability
prior knowledge to find of the monarch/viceroy
viceroys (p = 0.27) didpair. not have a significant impact on the
When
ability asked
to find theabout monarch conservation,
monarch/viceroy pair. participation in environmental organizations diverged
from When
those whoaskedparticipated
about monarch in outdoor recreation
conservation, or in garden
participation in clubs (Table 3). organizations
environmental Members of
diverged from organizations
environmental those who participated
(p = 0.06) and in outdoor
those whorecreation or in garden
had donated clubs (Tablecauses
to environmental 3). Members
(p < 0.01)of
environmental
were more likelyorganizations
to find butterfly (p =conservation
0.06) and those whoimportant”
“very had donated (ME to=environmental
8.8% and 12.8%, causes (p < 0.01)
respectively).
were moremembers
However, likely to find butterfly
of garden conservation
clubs (p = 0.42)“very important”
and those (ME = 8.8%
with greater levelsandof12.8%,
outdoor respectively).
recreation
However,
(p members
= 0.29) were no more of garden
likely toclubs
find (p = 0.42) and
butterfly those with
conservation greater levels of outdoor recreation (p =
important.
0.29) were no more likely to find butterfly conservation important.Sustainability 2018, 10, 807 10 of 16
3.4. Socioeconomic Factors Influence Knowledge and Attitudes
Older participants were more likely to know about monarch declines but the marginal effects
were often very low. For instance, the marginal effect for one year older in age (p = 0.03) on answering
knowing about monarch declines with “not at all” is −0.03%. This means that all else equal, a person
who is one year older than another is 0.03% less likely to answer “not at all.” Conversely, the marginal
effect of age is 0.06% in reporting “a great deal” of knowledge of monarch declines. Age was not
a significant predictor of prior knowledge of monarchs (p = 0.84) or viceroys (p = 0.09) in general
or milkweed importance (p = 0.16). However, older participants were more likely to find butterfly
conservation “very important” (p < 0.01, ME = 0.7%).
Participant sex was only a significant predictor variable in regressions for prior viceroy knowledge
and the importance of butterfly conservation. Females were significantly more likely than males to state
that they know about viceroys “not at all” (p < 0.01, ME = 12.70%) in general but not monarchs (p = 0.90).
Sex had no impact on state knowledge of monarch declines (p = 0.18) or importance of milkweed
(p = 0.87). Males had greater self-reported knowledge of monarchs and especially viceroys, but males
were no more likely to correctly identify the monarch/viceroy pair or monarch butterfly specifically
compared to females. For the importance of butterfly conservation, sex was an important predictor
(p = 0.01, Table 3). Females were more likely than males to state that conservation is “very important”
(ME = 7.47%) and less likely to state that is was “not important” (ME = −2.01%).
Race was correlated with all aspects of prior knowledge and willingness to conserve butterflies.
Individuals who self-identified as black were more likely than white individuals to not know about
(“not at all”) viceroys (p < 0.01, ME = 16.10%), monarchs (p < 0.01, ME = 11.56%), monarch declines
(p < 0.01, ME = 15.30%), and the importance of milkweed (p < 0.01, ME = 16.50%). No other races
were significant predictors in these models. Interestingly, Asian (p = 0.07, ME = −16.07%) and
Hispanic (p = 0.08, ME = −14.27%) respondents were significantly less likely to correctly identify
monarchs correctly than were white respondents. Whereas, black respondents were no more likely to
correctly identify the monarch than white respondents (p = 0.14). However, race-related predictors
for willingness to conserve butterflies was more similar to those for prior knowledge (Table 3)—black
participants (p = 0.04) were less likely to find it “very important” (ME = −8.81%) and more likely to
find it “not important” (ME = 2.91%).
Other socioeconomic factors were less important in all regressions. For both general viceroy
and monarch knowledge, greater education indicated a smaller likelihood of knowing “nothing”
(Table 2). The same trend was true for knowledge of monarch declines (p < 0.01) and the importance
of milkweed (p < 0.01). In both of these cases the marginal effects were stronger for knowing
nothing (ME = −5.36% and ME = −5.76%, respectively) versus knowing a great deal (ME = 0.86%
and ME = 1.56%, respectively). Respondent education levels did not impact their ability to identify
monarchs (p = 0.30) or willingness to conserve butterflies (Table 3). Neither being in a household with
children nor household income (p-values listed in same order) had an impact on prior knowledge of
viceroys (Table 2), monarchs, monarch declines (p = 0.36, p = 0.14), milkweed importance (p = 0.24,
p = 0.46) or monarch identification (p = 0.66, p = 0.39) and willingness to conserve butterflies (Table 3).
4. Discussion
Generally, the surveyed respondents stated that they had prior knowledge (from “moderate” to
“a lot”) of monarchs but had less knowledge of monarch declines and the importance of milkweed
to the monarch life cycle (Figure 2). More people claimed knowledge of monarchs than viceroys,
interesting as the state butterfly of Kentucky is, in fact, a viceroy and featured on select state license
plates [64]. This interest in monarchs compared to viceroys is unsurprising given recent media
coverage of monarchs in relation to other topics such as agriculture biotechnology, climate change,
and gardening [65–68]. Stated prior knowledge of monarchs was correlated with both being able to
identify monarchs and in willingness to conserve butterflies (concern for wildlife), which corroboratesSustainability 2018, 10, 807 11 of 16
what prior studies have found [29,69,70] and lends urgency to education efforts to gain public buy-in
for milkweed plantings [49,51,66].
Association with environmental groups, including having donated to an environmental
cause, increased both the likelihood of monarch knowledge and positive attitudes about butterfly
conservation. Participation in garden clubs also increased knowledge but did not correlate with
positive attitudes about butterfly conservation, while outdoor recreation and its potential for exposure
to monarch did correlate with either. The social values of environmental group members for efforts to
save endangered species possibly influenced their support for monarch conservation efforts [71,72],
while the garden club members did not hold these same values. In terms of conservation, increased
environmental group membership might foment an increased acceptance of environmentally friendly
attitudes and behaviors [73–75].
As prior studies have found, environmentally friendly behaviors and attitudes are not predicated
on personal values alone as signaled by environmental group membership, but also by demographic
and cultural factors [76]. Similarly, we found that even after taking into consideration prior knowledge
of monarch and membership in environmental groups, some demographic factors played an integral
role in explaining attitudes towards butterfly conservation. We found that an increase in age correlated
with an increase in positive attitudes towards conservation as have some other studies [77] though,
in contrast to prior studies, higher household income (that tends to increase with age) did not [78,79].
However, the marginal effects of sex were prominent, with self-identified females exhibiting more
positive attitudes towards butterfly conservation than did males despite having lower reported levels
of monarch knowledge. Since this is a trend seen in prior studies on environmental attitudes and
environmentally friendly behaviors, sex clearly has a large impact on conservation strategies in
addition to educational efforts to improve public knowledge [79–85].
Since it is difficult to explain the sex differences in conservation attitudes, the results of our study
emphasize the need for public education and recruitment to environmental organizations [69,86,87].
In terms of educational goals, if increasing public awareness is done in order to increase interest in
conservation practices, it appears that more emphasis on specific conservation needs and methods is
required (i.e., planting milkweeds and other nectar plants) [88–90]. Future education and outreach
efforts for monarch conservation should also target individuals who are not already members of
environmental organizations as this group is already inclined to support butterfly conservation.
This is especially important as monarch habitat is dependent in large part on private landowners
(often farmers), who are likely not members of environmental organizations [91,92]. But previous
studies have shown that increased education increased the likelihood of farmers perceiving and
mitigating environmental concerns such as monarch habitat loss [93–95].
5. Conclusions
Conservation is not a one-sided task. Our study shows that educating the public involves more
than the appearance of an animal species, particularly for insects. As there has been little research
conducted on social understanding and perception toward conservation or protection of insect species,
our analysis adds to this limited depository [52,62]. Based on our work, further studies can examine
how individuals may be willing to contribute to protecting the entire range of monarch butterflies
including Mexico and Canada or how the public may view the tradeoff between preserving milkweed
versus land management such as agricultural weed control [38]. Our research strengthened the idea
that identifying public attitudes related to conservation is necessary to determine what aspects of
conservation are important to the general public [96].
Acknowledgments: The authors would like to thank the Michael Lorton from the City of Lexington Parks and
Recreation Department for permitting surveys at various events and locations and the University of Kentucky
Student Sustainability Council for funding. The authors would also to thank those who helped implement the
survey (William Fox, Rachel Hart, Jessica Richards, Erica Rogers, and Jason Simon) and the many others we
fail to recognize by name but have nonetheless contributed. Artwork credits: butterfly images are all publiclySustainability 2018, 10, 807 12 of 16
available, with credit given to Benny Mazur, Kenneth Dwain Harrelson, Andrew C, John Flannery, Patrick Coin,
and Jörg Hempel. Publication of this work was supported by the LSU Open Access Author Fund.
Author Contributions: The following statements should be used J.P. and W.H. conceived and designed the
experiments; J.P. performed the experiments; J.P. and W.H. analyzed the data; H.P. wrote and revised the paper.
Conflicts of Interest: The authors declare no conflict of interest. The founding sponsors had no role in the design
of the study; in the collection, analyses, or interpretation of data; in the writing of the manuscript, and in the
decision to publish the results.
References
1. Milfont, T.; Mastrangelo, M.E.; Laterra, P.; Gavin, M.C.; Linklater, W.L.; Milfont, T.L. Psycho-social factors
influencing forest conservation intentions on the agricultural frontier. Conserv. Lett. 2014, 7, 103–110.
2. Primmer, E.; Karppinen, H. Professional judgment in non-industrial private forestry: Forester attitudes and
social norms influencing biodiversity conservation. For. Policy Econ. 2010, 12, 136–146. [CrossRef]
3. Van Dijk, J.; de Snoo, G.; Lokhorst, A.M.; Staats, H.; van Dijk, E.; de Snoo, G.; van Dijk, J. What’s in it
for me? Motivational differences between farmers’ subsidised and non-subsidised conservation practices.
Appl. Psychol. 2011, 60, 337–353.
4. Gill, J.D.; Crosby, L.A.; Taylor, J.R. Ecological concern, attitudes, and social norms in voting behavior.
Public Opin. Q. 1986, 50, 537–554. [CrossRef]
5. Loomis, J.B.; White, D.S. Economic benefits of rare and endangered species: Summary and meta-analysis.
Ecol. Econ. 1996, 18, 197–206. [CrossRef]
6. Moon, W.; Balasubramanian, S.K. Public attitudes toward agrobiotechnology: The mediating role of risk
perceptions on the impact of trust, awareness, and outrage. Rev. Agric. Econ. 2004, 26, 186–208. [CrossRef]
7. U.S. Fish and Wildlife Service. Endangered Species Act of 1973; U.S. Fish and Wildlife Service: Washington,
DC, USA, 1973.
8. Brown, G.M.; Shogren, J.F. Economics of the Endangered Species Act. J. Econ. Perspect. 1998, 12, 3–20.
9. Lomax, G.P. From breeder reactors to butterflies: Risk, culture, and biotechnology. Risk Anal. 2000, 20,
747–754. [CrossRef] [PubMed]
10. Wolt, J.D.; Peterson, R.K. Agricultural biotechnology and societal decision-making: The role of risk analysis.
AgBioForum 2000, 3, 39–46.
11. Missrie, M.; Nelson, K. Direct payments for conservation: Lessons from the monarch butterfly conservation
fund. Economics 2005, 88, 339–353.
12. Henle, K.; Alard, D.; Clitherow, J.; Cobb, P.; Firbank, L.; Kull, T.; McCracken, D.; Moritz, R.F.A.; Niemelä, J.;
Rebane, M.; et al. Identifying and managing the conflicts between agriculture and biodiversity conservation
in Europe—A review. Agric. Ecosyst. Environ. 2008, 124, 60–71. [CrossRef]
13. Kotchen, M.J.; Reiling, S.D. Environmental attitudes, motivations, and contingent valuation of nonuse values:
A case study involving endangered species. Ecol. Econ. 2000, 32, 93–107. [CrossRef]
14. Brook, A.; Zint, M.; De Young, R. Landowners’ responses to an Endangered Species Act listing and
implications for encouraging conservation. Conserv. Biol. 2003, 17, 1638–1649. [CrossRef]
15. Stanley, D.L. Local perception of public goods: Recent assessments of willingness-to-pay for endangered
species. Contemp. Econ. Policy 2005, 23, 165–179. [CrossRef]
16. Kellert, S.R. Values and perceptions of invertebrates. Conserv. Biol. 1993, 7, 845–855. [CrossRef]
17. Fulton, D.C.; Manfredo, M.J.; Lipscomb, J. Wildlife value orientations: A conceptual and measurement
approach. Hum. Dimens. Wildl. 1996, 1, 24–47. [CrossRef]
18. Herzon, I.; Mikk, M. Farmers’ perceptions of biodiversity and their willingness to enhance it through
agri-environment schemes: A comparative study from Estonia and Finland. J. Nat. Conserv. 2007, 15, 10–25.
[CrossRef]
19. Lucey, A.; Barton, S. Public perception and sustainable roadside vegetation management strategies.
Transp. Res. Rec. J. Transp. Res. Board 2010, 2262, 1–15. [CrossRef]
20. Czech, B.; Krausman, P.R.; Borkhataria, R. Social construction, political power, and the allocation of benefits
to endangered species. Conserv. Biol. 1998, 12, 1103–1112. [CrossRef]
21. Kubiatko, M.; Prokop, P.; Fancovicova, J.; Kubiatko, M. Vampires are still alive: Slovakian students’ attitudes
toward bats. Anthrozoos 2009, 22, 19–30.Sustainability 2018, 10, 807 13 of 16
22. Dickman, A.J. Complexities of conflict: The importance of considering social factors for effectively resolving
human–wildlife conflict. Anim. Conserv. 2010, 13, 458–466. [CrossRef]
23. Lassister, U.; Wolch, J.R. Sociocultural aspects of attitudes toward marine animals: A focus group analysis.
Calif. Geogr. 2002, 42, 1–24.
24. Hostetler, M.; Drake, D. Conservation subdivisions: A wildlife perspective. Landsc. Urban Plan. 2009, 90,
95–101. [CrossRef]
25. Müller, M.; Job, H. Managing natural disturbance in protected areas: Tourists’ attitude towards the bark
beetle in a German national park. Biol. Conserv. 2009, 142, 375–383. [CrossRef]
26. Hostetler, M.; Allen, W.; Meurk, C. Conserving urban biodiversity? Creating green infrastructure is only the
first step. Landsc. Urban Plan. 2011, 100, 369–371. [CrossRef]
27. Takahashi, B.; Duan, R.; Witsen, A. Hispanics’ behavioral intentions toward energy conservation: The role of
sociodemographic, informational, and attitudinal variables. Soc. Sci. Q. 2017. [CrossRef]
28. García-Cegarra, A.M.; Pacheco, A.S. Whale-watching trips in Peru lead to increases in tourist knowledge,
pro-conservation intentions and tourist concern for the impacts of whale-watching on humpback whales.
Aquat. Conserv. Mar. Freshw. Ecosyst. 2017, 27, 1011–1020. [CrossRef]
29. Pitt, D.; Shockley, M. Don’t fear the creeper: Do entomology outreach events influence how the public
perceives and values insects and arachnids? Am. Entomol. 2014, 60, 97–100. [CrossRef]
30. Suh, A.N.; Samways, M.J. Development of a dragonfly awareness trail in an African botanical garden.
Biol. Conserv. 2001, 100, 345–353. [CrossRef]
31. Losey, J.E.; Vaughan, M. The economic value of ecological services provided by insects. Bioscience 2006, 56,
311–323. [CrossRef]
32. Lemelin, R.H. To bee or not to bee: Whether tis nobler to revere or to revile those six-legged creatures during
one’s leisure. Leis. Stud. 2013, 32, 153–171. [CrossRef]
33. Snaddon, J.L.; Turner, E.C.; Foster, W.A. Children’s perceptions of rainforest biodiversity: Which animals
have the lion’s share of environmental awareness? PLoS ONE 2008, 3, e2579. [CrossRef] [PubMed]
34. Coursey, D.L. Revealed demand for a public good: Evidence from endangered and threatened species. N. Y.
Univ. Environ. Law J. 1997, 6, 411–449.
35. Oberhauser, K.S.; Solensky, M.J. Monarch Butterfly: Biology & Conservation; Oberhauser, K.S., Ed.;
Cornell University Press: Ithaca, NY, USA, 2004.
36. Howard, E.; Davis, A.K. The fall migration flyways of monarch butterflies in eastern North America revealed
by citizen scientists. J. Insect Conserv. 2009, 13, 279–286. [CrossRef]
37. Honey-Roses, J.; Lopez-Garcia, J.; Rendon-Salinas, E.; Peralta-Higuera, A.; Galindo-Leal, C. To pay or not to
pay? Monitoring performance and enforcing conditionality when paying for forest conservation in Mexico.
Environ. Conserv. 2009, 36, 120–128. [CrossRef]
38. Pleasants, J.M.; Oberhauser, K.S. Milkweed loss in agricultural fields because of herbicide use: Effect on the
monarch butterfly population. Insect Conserv. Divers. 2013, 6, 135–144. [CrossRef]
39. Krischik, V.; Rogers, M.; Gupta, G.; Varshney, A. Soil-applied imidacloprid translocates to ornamental flowers
and reduces survival of adult Coleomegilla maculata, Harmonia axyridis, and Hippodamia convergens lady beetles,
and larval Danaus plexippus and Vanessa cardui butterflies. PLoS ONE 2015, 10, e0119133. [CrossRef] [PubMed]
40. Pecenka, J.R.; Lundgren, J.G. Non-target effects of clothianidin on monarch butterflies. Sci. Nat. 2015, 102,
1–4. [CrossRef]
41. Malcolm, S.B. Monarch butterfly migration in North America: Controversy and conservation.
Trends Ecol. Evol. 1987, 2, 135–138. [CrossRef]
42. Prysby, M.D.; Oberhauser, K.S. Temporal and geographic variation in monarch densities: Citizen scientists
document monarch population patterns. In The Monarch Butterfly: Biology and Conservation; Oberhauser, K.S.,
Solensky, M.J., Eds.; Cornell Press: Ithaca, NY, USA, 2004; pp. 9–20.
43. Inamine, H.; Ellner, S.P.; Springer, J.P.; Agrawal, A.A. Linking the continental migratory cycle of the monarch
butterfly to understand its population decline. Oikos 2016, 125, 1081–1091. [CrossRef]
44. Kauffman, V. Service Initiates Status Review of Monarch Butterfly under the Endangered Species Act;
U.S. Fish & Wildlife Service: Washington, DC, USA, 2014.
45. Jepsen, S.; Schweitzer, D.F.; Young, B.; Sears, N.; Ormes, M.; Black, S.H. Conservation Status and Ecology of the
Monarch Butterfly in the United States; U.S. Forest Service: Washington, DC, USA, 2016.Sustainability 2018, 10, 807 14 of 16
46. U.S. Fish and Wildlife Service Status of the Monarch Butterfly. Available online: https://www.fws.gov/
savethemonarch/SSA.html (accessed on 5 January 2018).
47. Landis, T.D. Monarch waystations: Propagating native plants to create travel corridors for migrating monarch
butterflies. Native Plants J. 2014, 15, 5–16. [CrossRef]
48. Thogmartin, W.E.; López-Hoffman, L.; Rohweder, J.; Diffendorfer, J.; Drum, R.; Semmens, D.; Black, S.;
Caldwell, I.; Cotter, D.; Drobney, P.; et al. Restoring monarch butterfly habitat in the Midwestern US:
‘All hands on deck’. Environ. Res. Lett. 2017, 12, 074005. [CrossRef]
49. Pleasants, J. Milkweed restoration in the Midwest for monarch butterfly recovery: Estimates of milkweeds
lost, milkweeds remaining and milkweeds that must be added to increase the monarch population.
Insect Conserv. Divers. 2017, 10, 42–53. [CrossRef]
50. Oberhauser, K.; Wiederholt, R.; Diffendorfer, J.E.; Semmens, D.; Ries, L.; Thogmartin, W.E.;
Lopez-Hoffman, L.; Semmens, B. A trans-national monarch butterfly population model and implications for
regional conservation priorities. Ecol. Entomol. 2017, 42, 51–60. [CrossRef]
51. Malcolm, S.B. Anthropogenic impacts on mortality and population viability of the monarch butterfly.
Annu. Rev. Entomol. 2018, 63, 277–302. [CrossRef] [PubMed]
52. Pyle, R.M. Conservation of Lepidoptera in the United States. Biol. Conserv. 1976, 9, 55–75. [CrossRef]
53. Lewandowski, E.J.; Oberhauser, K.S. Contributions of citizen scientists and habitat volunteers to monarch
butterfly conservation. Hum. Dimens. Wildl. 2017, 22, 55–70. [CrossRef]
54. Diffendorfer, J.E.; Loomis, J.B.; Ries, L.; Oberhauser, K.; Lopez-Hoffman, L.; Semmens, D.; Semmens, B.;
Butterfield, B.; Bagstad, K.; Goldstein, J.; et al. National valuation of monarch butterflies indicates
an untapped potential for incentive-based conservation. Conserv. Lett. 2014, 7, 253–262. [CrossRef]
55. Penn, J.M.; Penn, H.J.; Potter, M.F.; Hu, W. Bed bugs and hotels: Traveler insights and implications for the
industry. Am. Entomol. 2017, 63, 79–88. [CrossRef]
56. Garcia, X.; Llausàs, A.; Ribas, A. Landscaping patterns and sociodemographic profiles in suburban areas:
Implications for water conservation along the Mediterranean coast. Urban Water J. 2014, 11, 31–41. [CrossRef]
57. Kühn, E.; Feldmann, R.; Harpke, A.; Hirneisen, N.; Musche, M.; Leopold, P.; Settele, J. Getting the public
involved in butterfly conservation: Lessons learned from a new monitoring scheme in Germany. Isr. J.
Ecol. Evol. 2008, 54, 89–103. [CrossRef]
58. Groves, R.M.; Presser, S.; Dipko, S. The role of topic interest in survey participation decisions. Public Opin. Q.
2004, 68, 2–31. [CrossRef]
59. Wiernik, B.; Ones, D.S.; Dilchert, S. Age and environmental sustainability: A meta-analysis. J. Manag. Psychol.
2013, 28, 826–856. [CrossRef]
60. Dupont, D.P. Do children matter? An examination of gender differences in environmental valuation.
Ecol. Econ. 2004, 49, 273–286. [CrossRef]
61. Torgler, B.; Garcia-Valiñas, M.A.; Macintyre, A. Differences in Preferences towards the Environment: The Impact
of a Gender, Age and Parental Effec; FEEM Working Paper No. 18.2008; Center for Research in Economics,
Management and the Arts: Basel, Switzerland, 2008. [CrossRef]
62. Guiney, M.; Oberhauser, K. Insects as flagship conservation species. Terr. Arthropod Rev. 2009, 1, 111–123.
[CrossRef]
63. Chapman, R.G.; Staelin, R. Exploiting rank ordered choice set data within the stochastic utility model.
J. Mark. Res. 1982, 19, 288–301. [CrossRef]
64. Sloan, S. KY Has a Wide Variety of Specialty License Plates. KY Herald Leader, 15 April 2013.
65. Mcinerney, C.; Bird, N.; Nucci, M. The flow of scientific knowledge from lab to the lay public: The case of
genetically modified food. Sci. Commun. 2004, 26, 44–74. [CrossRef]
66. Marcotty, J. Calling All Milkweed: Federal Pollinator Plan Needs a Billion Plants for Monarch Butterflies.
Star Trib. 2015. Available online: http://www.startribune.com/calling-all-milkweed-federal-pollinator-
plan-needs-a-billion-plants-for-monarchs/306383591/ (accessed on 13 March 2018).
67. Higgins, A. Are Our Gardens the Monarch Butterfly Sanctuaries We Think They Are? The Washington Post,
19 July 2017.
68. Trezza, J. Monarch Butterfly Migration Was Off This Year and Researchers Are Worried. The Washington Post,
24 January 2018.You can also read